全文HTML
--> --> -->| 反应 | 反应速率 |
| He + e → He* + e | $2.308 \times {10^{ - 10} }T_{\rm{e} } ^{0.31}\exp \left( { - \dfrac{ {2.297 \times { {10}^5} } }{ { {T_{\rm{e} } } } } } \right)$/(cm3·s–1) |
| He + e → He+ + 2e | $2.584 \times {10^{ - 12} }T_{\rm{e} } ^{0.68}\exp \left( { - \dfrac{ {2.854092 \times { {10}^5} } }{ { {T_{\rm{e} } } } } } \right)$/(cm3·s–1) |
| He* + e → He+ + 2e | $4.661 \times {10^{ - 10} }T_{\rm{e} } ^{0.6}\exp \left( { - \dfrac{ {5.546 \times { {10}^4} } }{ { {T_{\rm{e} } } } } } \right)$/(cm3·s–1) |
| ${\rm{He}}_2^+ $ + e → He* + He | $5.386 \times {10^{ - 7}}{T_{\rm{e}}}^{ - 0.5}$/(cm3·s–1) |
| He+ + 2He → ${\rm{He}}_2^+ $ + He | 1.1 × 10⁻³¹/(cm6·s–1) |
| He* + 2He → ${\rm{He}}_2^* $ + He | 1.3 × 10⁻³³/(cm6·s–1) |
| He* + e → He + e | $1.099 \times {10^{ - 11} }{T_{\rm{e} } ^{0.31}}$/(cm3·s–1) |
| ${\rm{He}}_2^* $ + e →${\rm{He}}_2^+ $ + 2e | $1.268 \times {10^{ - 12} }{T_{\rm{e} } ^{0.71}}\exp \left( { - \dfrac{ {3.945 \times { {10}^4} } }{ { {T_{\rm{e} } } } } } \right)$/(cm3·s–1) |
| He* + He* → He+ + He + e | $2.7 \times {10^{ - 10}}$/(cm3·s–1) |
表1反应方程和速率
Table1.Elementary reaction and rates.
电子(e)、氦离子(He+)、电离态氦分子(


图1(a)给出了数值模型的放电结构示意图, 也是对应的实验装置示意图. 如图1(a)所示, 等离子体射流在介质管中产生并传播, 介质管的内径为1 mm, 厚度和相对介电常数分别为0.5 mm和10. 缠绕在介质管上的两个金属环电极的间距为13 mm, 接高压脉冲的电极和接地电极的宽度分别为1和0.5 mm.
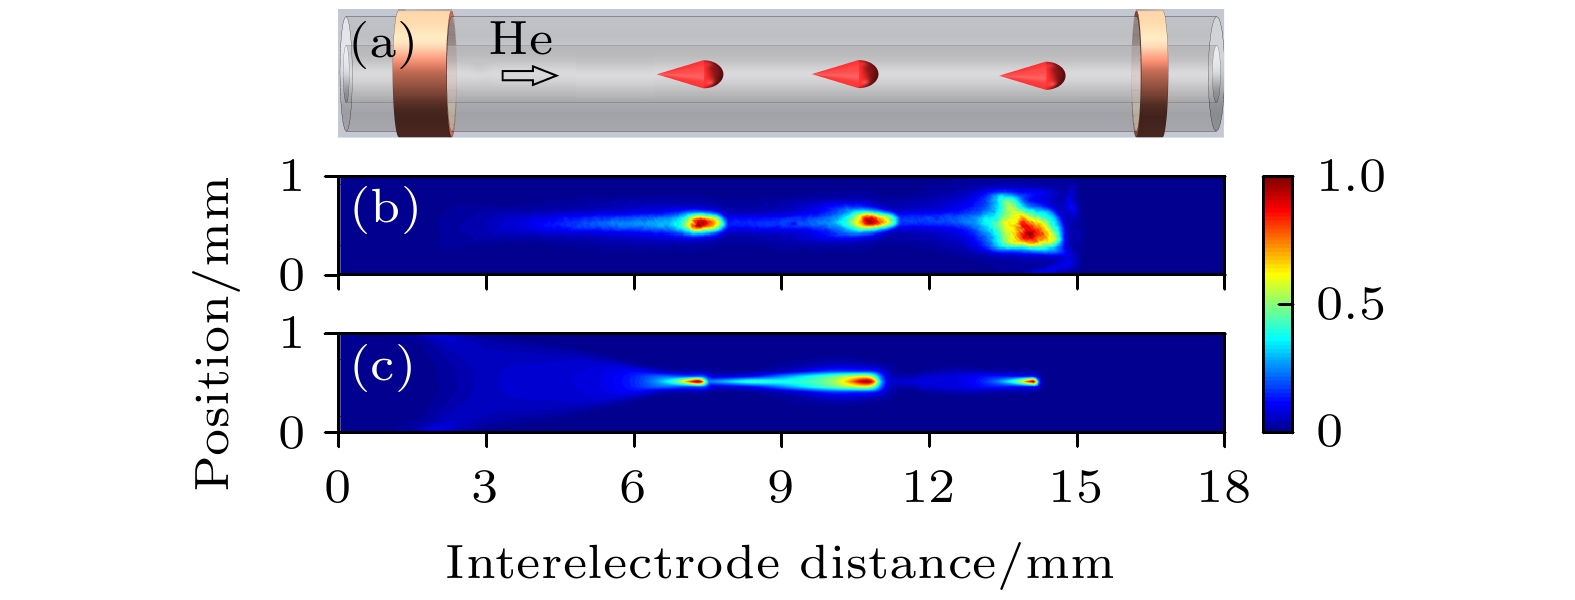 图 1 (a)放电结构示意图; 典型等离子体子弹的(b)实验拍摄照片和(c)数值模拟结果
Figure1. (a) Schematic setup of discharge; typical appearance of plasma bullet (b) taken in experiments and (c) numerically simulated.
图1(b)所示的是实验中利用ICCD (Andor iStar)拍摄的石英管中产生的典型的等离子体子弹照片, 拍摄的曝光时间为20 ns, 从3个时刻的照片可以看出, 等离子体从靠近高压脉冲电极产生, 之后向接地电极传播, 等离子体子弹的形貌表现为头部较强, 后面有拖尾. 图1(c)给出了与图1(b)对应的数值模拟的放电中He+离子的密度, 可以对应于等离子体的发光强度, 这是由于放电中电子从基态到激发态的碰撞激发率可以近似为直接碰撞电离率(He + e → He+ + 2e)[21]. 图1(c)也显示出与对应实验测量一致的等离子体子弹的形成以及输运过程.
 图 2 实验测量脉冲放电等离子体射流时空演变图
Figure2. Temporal-spatial evolution profile of pulsed discharge plasma plume experimentally measured by optical emission.
图3为数值模拟脉冲放电等离子体射流中氦离子(He+)密度在高压脉冲放电阶段的时空演化, 其中高压脉冲电极上施加的电压幅值为2500 V, 低于实验中的脉冲电压幅值, 这是由于数值模拟中没有考虑空气等杂质气体的影响. 脉冲电压的脉宽、上升沿和下降沿时间都与图2中的实验参数一致. 数值模拟结果中的He+密度与实验测量的放电图像强度进行对比, 可以发现在两个电极间脉冲放电的数值模拟结果与图2中的实验测量放电空间结构的时间演化过程基本一致, 放电在0.2 μs时刻在高压脉冲电极附近产生以后以等离子体子弹的形式向接地电极传播, 不过等离子体子弹在0.4 μs时刻就已经到达接地电极, 比图2中到达接地电极的时刻(0.6 μs)低, 说明数值模拟的等离子体子弹的传播速度更高, 这与数值模型中考虑的电离反应过程有关, 将根据等离子体子弹速率结果进一步讨论. 与实验结果一致, 在脉冲电压下降沿(1.2 μs时刻)产生的第二次放电, 也没有形成等离子体子弹. 因此脉冲放电形成的等离子体射流特性主要由处于脉冲电压上升沿阶段的放电产生的等离子体子弹决定.
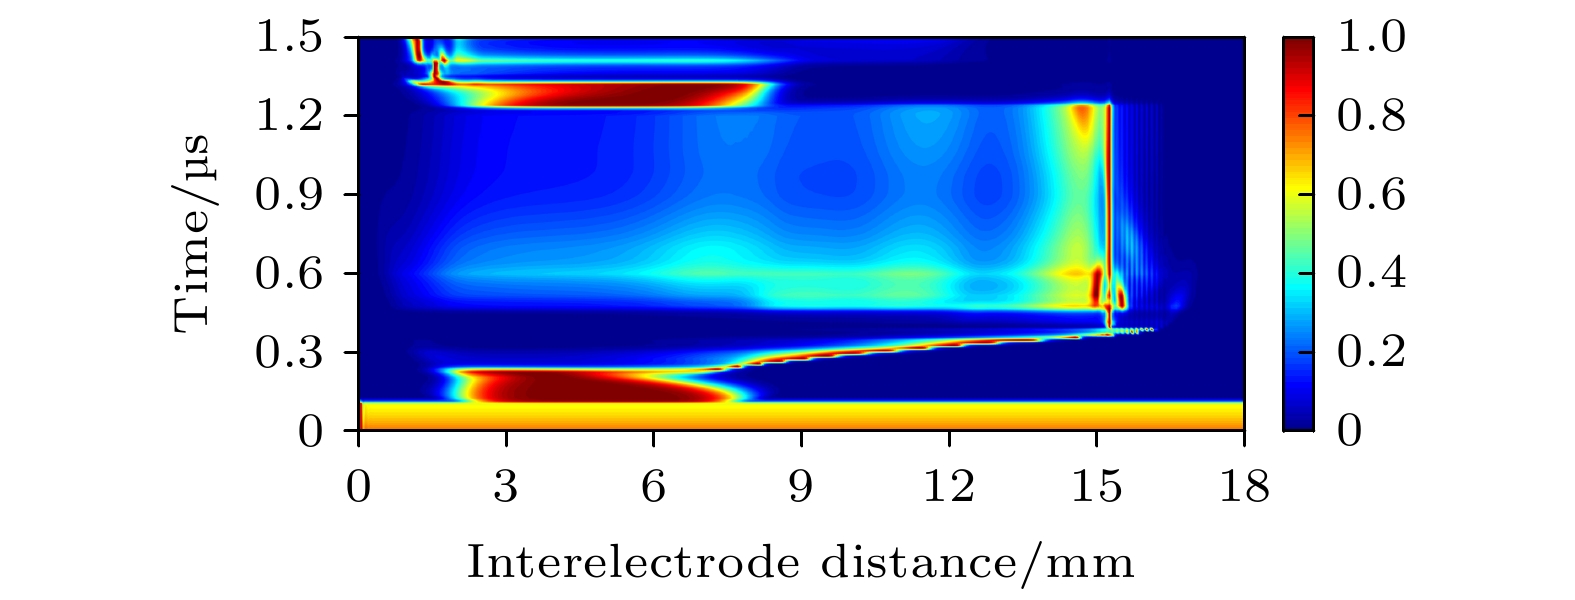 图 3 数值模拟脉冲放电等离子体射流中He+密度的时空演变图
Figure3. Temporal-spatial evolution profile of simulated He+ density in pulsed discharge plasma plume.
图4为实验测量和数值模拟的等离子体子弹在介质管中不同位置的传播速率, 可以看出, 数值模拟得到的等离子体子弹的传播速率要高于实验测量结果, 与图2和图3的结果一致, 这与数值模型中包含的反应方程相关, 特别是与电离相关的反应, 模型中由于没有考虑杂质气体, 因此参与的电离相关的反应过程较实验中要少; 另外, 数值模拟中也没有考虑介质管外电势对等离子体子弹形成和传播的影响. 实验测量的等离子体子弹的速率保持在3.0 × 10⁴ m·s–1左右, 与其他报道的实验测量结果基本一致, 在接地电极附近, 等离子体子弹的速率有一个先增加然后降低的过程, 这是由于接地电极附近电势变化较大, 而接地电极上维持电势为零, 因此等离子体子弹在接地电极附近的特性也与接地电极的尺寸相关[22,23]. 数值模拟结果得到的等离子体子弹的速率在高压脉冲电极附近为4.0 × 10⁴ m·s–1, 与实验测量结果接近, 随着等离子体子弹向接地电极传播, 速率逐步增加到11 × 104 m·s–1, 到达接地电极以后下降到7 × 10⁴ m·s–1. 虽然数值模拟等离子体子弹的速率高于实验测量结果, 但其中放电过程和机理基本一致, 因此数值模拟结果中的电场强度、电子密度和电子产生率的时空分布将有助于研究等离子体子弹的形成和传播机理.
 图 4 实验测量和数值模拟等离子体子弹在介质管中的传播速率
Figure4. Measured and simulated velocities of plasma bullet in dielectric tube.
图5(a)为对应于图1(c)中3个位置上(7.2, 11和14.5 mm)等离子体子弹的轴向电场强度的空间分布, 分别代表等离子体子弹在产生、传播和到达接地电极附近时的情况, 每个等离子体子弹位置处对应为电场强度达到峰值, 说明等离子体子弹主要是由局部增强的电场导致的, 3个位置上电场强度峰值分别为1.1 × 10⁶, 1.0 × 10⁶和2.0 × 10⁶ V·m–1, 说明等离子体子弹产生以后局部增强的电场强度在传播阶段没有进一步增强, 只有当等离子体子弹接近接地电极时得到增强, 因此等离子体子弹的速率也更高, 如图4所示. 图5(b)给出了在等离子体子弹从产生到传播到接地电极过程中对应的电场强度的时空演化过程, 对应0.2—0.4 μs时间段, 与图3中等离子体子弹随时间变化的空间分布一致, 进一步说明了等离子体子弹的产生和传播主要是由局部增强的电场强度导致的. 在等离子体子弹产生阶段, 高压脉冲电极附近区域内的电场强度逐步在等离子体子弹产生位置上增强, 形成等离子体子弹以后局域增强的电场随时间向接地电极方向传播. 为了进一步显示等离子体子弹附近的电场强度分布, 图5(c)给出了等离子体子弹周边区域内电场强度的矢量图, 其中箭头的长度和方向分别代表电场强度的大小和方向. 如图5(c)所示, 等离子体子弹头部的电场强度最大并且指向接地电极, 而在等离子体子弹尾部和前端未到达区域电场强度都较弱, 这也与图5(a)和图5(b)的结果一致. 因此等离子体子弹的产生和传播可以归因于在放电区域中局域增强的电场强度.
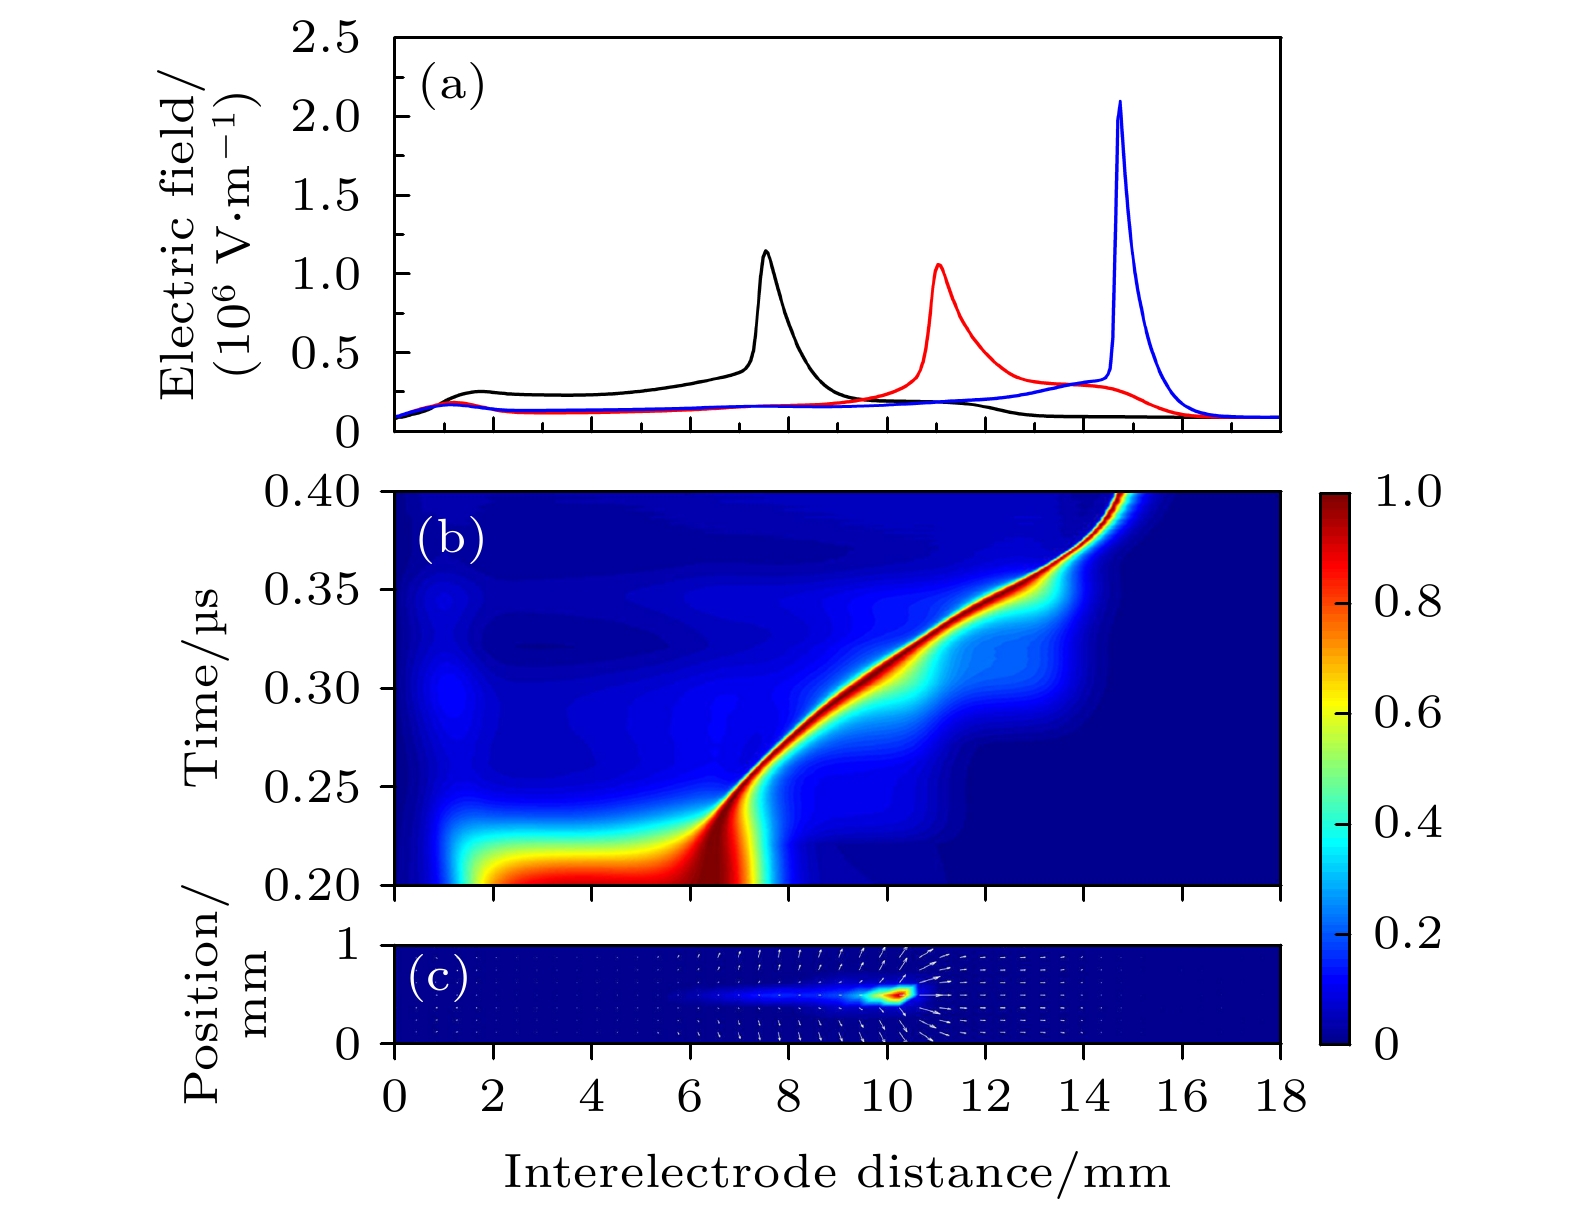 图 5 (a) 等离子体子弹在不同位置处的轴向电场强度分布; (b) 等离子体子弹阶段电场强度的时空分布; (c) 等离子体子弹周边典型的电场强度分布
Figure5. (a) Spatial profiles of the electric field of plasma bullets at different positions; (b) spatiotemporal evolution of the electric field with the existing of plasma bullet; (c) typical electric field distribution in the domain near the plasma bullet.
图6(a)给出了脉冲放电过程中电子密度的时空分布, 对应于图3中的等离子体子弹产生的时刻和位置, 电子密度也开始增加, 并且其最大值随着等离子体子弹的传播也向接地电极扩展, 但是在后方区域也保持着较高的电子密度, 这解释了等离子体子弹形成拖尾的原因, 如图1(a)和图1(c)所示. 当等离子体子弹到达接地电极以后, 由于形成的等离子体子弹强度的增强, 导致电子密度主要集中于接地电极附近. 在脉冲电压保持阶段, 电子密度维持在放电空间, 直至脉冲电压下降沿时刻电子密度重新分布到高压脉冲电极附近, 因此脉冲电压下降沿阶段放电不会引起等离子体子弹. 为了进一步表征等离子体子弹的形成机理, 图6(b)给出了在等离子体子弹产生和传播阶段放电空间中的电子产生率, 为放电中e + He → 2e + He+, e + He* → 2e + He+, e +


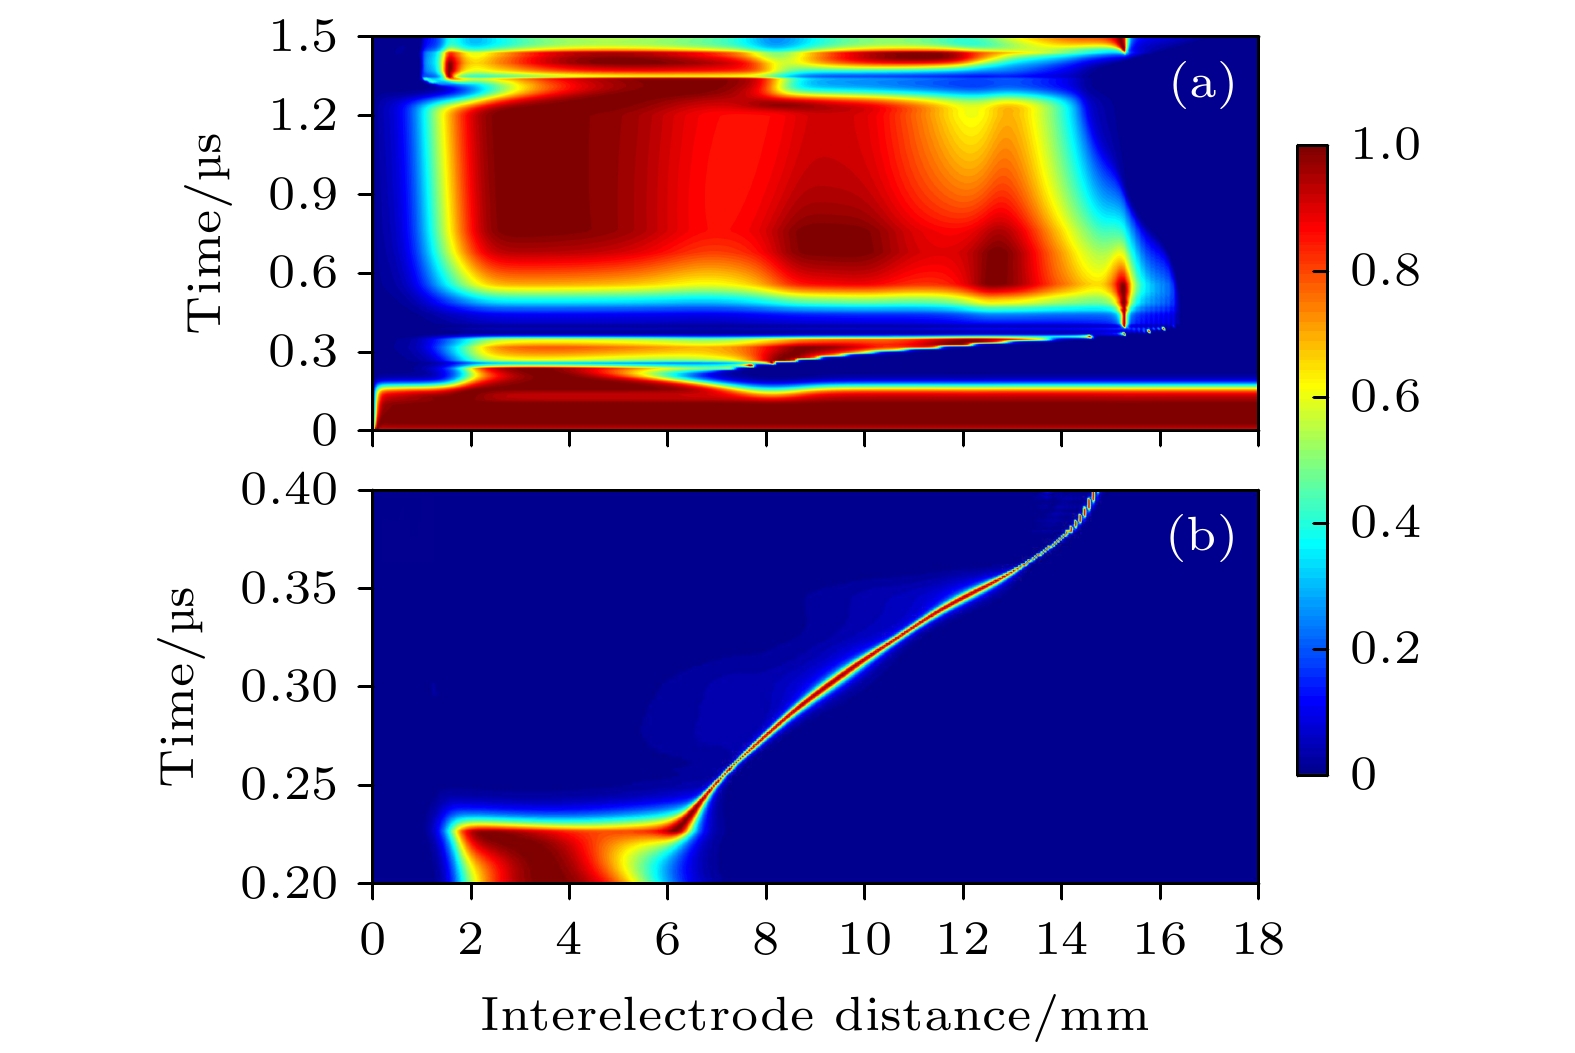 图 6 (a) 电子密度和 (b) 0.2—0.4 μs阶段电子产生率的时空分布
Figure6. Spatiotemporal profile of (a) electron density and (b) electron generation rate in 0.2–0.4 μs.
