全文HTML
--> --> -->沙尘暴是指强风将地面大量尘沙卷入空中使空气特别浑浊, 水平能见度低于1 km的天气现象. 我国是世界上沙漠及沙漠化土地比较严重的国家之一, 在我国的西北部, 沙漠最为集中, 沙尘暴天气频繁出现, 沙尘暴天气产生的空中悬浮沙粒对电磁波的吸收和散射不仅会引起信号严重的衰减, 还容易导致信号相位波动、波形畸变、退偏和交叉极化现象, 因此, 沙尘暴天气对电磁波传播具有很大的影响. 国外****自20世纪40年代就沙尘暴的物理特性和沙尘暴对无线电传播影响开展了理论研究和实验测量的工作, 不同****根据不同条件建立了沙尘暴对电磁波的衰减模型[6-9]. 我国自20世纪80年代后期也开始了沙尘媒质的电波传播研究, 主要侧重于沙尘暴中微波/毫米波、陆地和卫星通信线路及对激光与红外信号的影响[10-14]. 但在太赫兹波段, 沙尘暴对其传输影响的研究工作报道的还非常少. 李宇晔等[15]使用太赫兹时域光谱技术测试了太赫兹脉冲对模拟沙尘的透射特性, 得到不同沙尘条件下太赫兹信号的透射光谱, 结果表明在0. 2—1.0 THz范围, 透射率随着太赫兹频率的提高而降低; 许文忠等[16]理论分析了3 THz的太赫兹波在沙尘暴环境中传输的能量损耗, 指出沙尘暴对太赫兹波的衰减要大于对红外光波的衰减, 沙尘能见度较低时必须要考虑多次散射的影响; 董群锋等[17]应用Mie理论研究了沙尘单次散射对波长分别为30, 35和40 μm的太赫兹波传输衰减, 结果表明沙尘暴对太赫兹波传播影响明显. 沙尘暴对电磁波的传输影响不仅与频率有关, 还与沙尘的尺度分布、介电系数及沙粒含水量有关, 为进一步研究不同模态沙尘暴及沙粒含水量对太赫兹波的传输影响, 为太赫兹在遥感、雷达、通信及大气环境监测等方面的应用提供基础, 本文以国内沙粒尺度分布不同的六种模态沙尘暴为例, 基于Mie散射理论和Monte Carlo方法, 分析了多重散射对1—10 THz波段的太赫兹波的传输衰减特性. 鉴于0.1—1 THz波段的太赫兹波的传输衰减特性与1—10 THz波段存在较大差异, 该波段的衰减特性拟另文讨论.


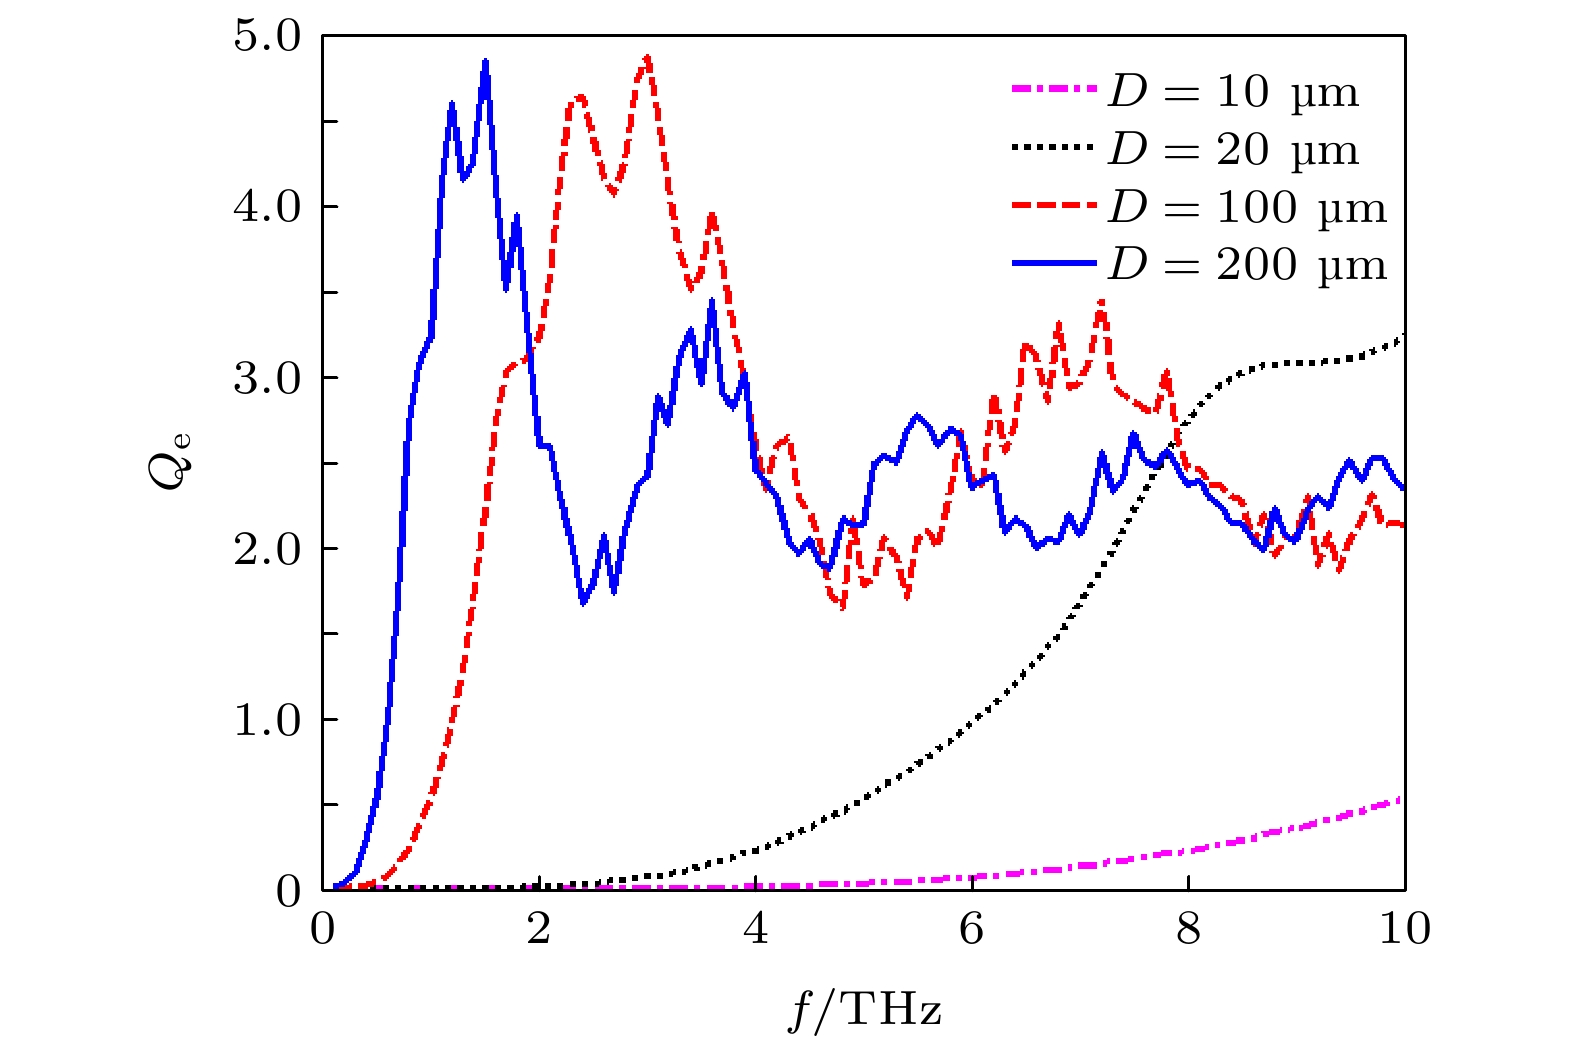 图 1 消光效率因子与频率的关系
Figure1. Relationship between extinction efficiency factor and frequency.
 图 2 效率因子与沙粒直径的关系(1 THz)
Figure2. Relationship between efficiency factor and sand diameter (1 THz).
在某些情况下, 沙尘粒子含有水分, 其复介电常数由沙和水的介电系数以及含水量决定, 且随频率变化. 因此, 沙尘粒子的复介电系数是含水量和频率的函数, 其等效值可用下式所示的Maxwell-Garnett公式[19]来计算:
以1 THz波为例, 选取不同尺寸的沙尘粒子, 计算得到消光、散射和吸收效率因子随含水量的变化如图3所示. 可以看出: 对于直径20和100 μm的沙尘粒子, 随着含水量的增大, 吸收效率因子和消光效率因子都增大; 而对于D = 200 μm的大尺寸沙尘粒子, 随着含水量的增大, 吸收效率因子增大, 但散射效率因子减小, 二者综合结果使消光效率因子先缓慢变化, 后基本保持不变; 对于D = 250 μm的更大尺寸沙尘粒子, 随着含水量的增大, 吸收效率因子虽然增大, 但散射效率因子减小更多, 二者综合结果使消光效率因子逐渐减小. 因此, 对于确定频率的太赫兹波, 沙尘粒子尺寸不同, 含水量对消光的影响也不同.
 图 3 效率因子与沙粒含水量的关系(1 THz)
Figure3. Relationship between efficiency factor and sand moisture content (1 THz).

| Sand source | m0 | σ |
| Loess | –3.08 | 0.491 |
| Maowusu | –2.96 | 0.380 |
| Tengger | –2.31 | 0.296 |
| Taklimakan | –2.26 | 0.276 |
| Gansu | –2.19 | 0.279 |
| Coast | –1.83 | 0.166 |
表1沙粒的尺度分布参数
Table1.Size distribution parameters of sand particles.
沙尘暴群粒子对太赫兹波总的消光是所有尺度粒尘粒子消光共同贡献的结果, 总的消光系数为
2
3.1.蒙特卡罗方法
对于较低能见度的沙尘暴天气, 沙粒数密度较大, 多重散射现象显著, 对衰减结果产生的影响不可忽略. 对于存在多重散射的辐射传输问题, 人们已提出了多种研究方法, 其中蒙特卡罗法[24-27]是以概率模型为基础, 用随机数和概率统计方法研究电磁波在随机分布介质中的传输问题, 其基本思想是把电磁辐射看成由很多光子组成的光子束, 电磁辐射的传输问题就转化为光子的传输问题, 只要光子数取足够多, 通过对每个光子的跟踪, 就能比较准确地模拟随机介质的多重散射问题. 本文在利用Mie散射理论计算出消光参量的基础上, 进一步根据蒙特卡罗方法分析太赫兹波在沙尘暴中的多重散射传输衰减问题.利用加权蒙特卡罗方法求太赫兹波在沙尘暴中的传输衰减主要步骤如下.
1) 光子初始状态
设光子从坐标原点沿z轴方向垂直入射到厚度为H的沙尘暴中, 任意时刻的位置用(x, y, z)表示, 运动方向由方向余弦(μx, μy, μz)表示, 每一步的运动步长用L表示, θ和φ分别表示散射后光子运动方向的散射角和方位角, 光子的初始状态为
光子运动步长是基于对光子自由程概率分布抽样的基础上确定的. 根据消光系数的定义, 可以得到自由程的抽样函数为
3) 光子的吸收
当光子在沙尘暴中传输时, 由于吸收作用而使光子的权重减小. 初始权重设为W0 = 1, 每次光子与沙粒碰撞后, 权重变为

根据Henyey-Greenstein散射相函数可得光子在某点与沙尘粒子碰撞后散射角θ的抽样值为[28]

光子与沙粒碰撞后在介质中的新坐标位置可根据方向余弦和运动步长求得
6) 衰减率统计
跟踪N个光子(取N = 106), 则平均透过率的估值为
根据透射率T, 可求出太赫兹波在沙尘暴中传播单位距离的衰减率为
2
3.2.干沙模态沙尘暴对太赫兹波衰减与频率的关系
根据以上分析, 选取能见度Vb = 1 km, 频率范围f 为1—10 THz, 对每一模态的沙尘暴, 首先根据(6)式、(8)式和表1计算出沙尘粒子数密度N0, 再根据Mie理论和(7)式、(12)式和(14)式分别计算出不同频率相应的消光系数μ、反照率ω 及不对称因子g. 积分计算时, 取沙粒半径r的范围为 0.1—150 μm, 半径间隔dr = 0.3 μm. 从计算式可以看出, 3个消光参量与群粒子尺度分布密度函数p密切相关, 对于同一频率的太赫兹波, 由于不同模态的沙尘暴群粒子尺度分布不同, 3个消光参量必然不同. 图4(a)、图4(b)和图4(c)是基于Mie散射理论及沙粒尺度分布函数计算得到的不同模态沙尘暴的3个消光参量随太赫兹波频率的变化情况, 图4(d)是基于蒙特卡罗方法计算得到的衰减率A随太赫兹波频率的变化情况, 计算时取光子数N = 106. 图 4 六种干沙模态沙尘暴对太赫兹波的衰减与频率的关系 (a) ω vs. f ; (b) g vs. f ; (c) μ vs. f ; (d) A vs. f
Figure4. Relationship of THz wave attenuation caused by six dry sand and dust storms to frequency: (a) ω vs. f ; (b) g vs. f ; (c) μ vs. f ; (d) A vs. f .
图4(a)表明六种干沙模态沙尘暴对THz波散射反照率都比较高(ω > 0.96), 说明散射远强于吸收, 消光主要是散射作用导致的结果; 比较图4(c)和图4(d)可以看出, 消光系数μ和衰减率A随THz波频率的变化情况不完全一致, 这是因为前者仅反映单次散射的消光情况, 后者则是反映多次散射的衰减. 在沙尘暴这种粒子浓度比较大的天气环境中, 多次散射现象比较显著, 如果不考虑多次散射, 仅依据单次散射进行计算, 结果会出现比较大的偏差[14,25,26]. 因此, 图4(d)反映多重散射的蒙特卡罗方法计算结果更接近沙尘暴对太赫兹波传输衰减的真实情况.
从图4(d)可以看出: 六种干沙模态沙尘暴对1—10 THz波段的太赫兹波衰减率都是随频率的变化先增加后减小; 在1—2.5 THz波段, 衰减率随THz波频率的增大变化非常显著, 相对而言, 该频段海岸沙尘暴相应的衰减率最大, 甘肃、塔克拉玛干及腾格里沙尘暴的衰减次之, 毛乌素和黄土沙尘暴的衰减相对最小; 而在4.2—10 THz高频波段, 衰减率随太赫兹波频率的增加非常缓慢地减小, 在该波段毛乌素和黄土沙尘暴的衰减率大于另外四种模态沙尘暴的衰减率, 相对而言, 海岸沙尘暴的衰减率最小. 各模态沙尘暴对太赫兹波衰减最强的频段有所不同, 海岸沙暴的最强衰减频率范围为1—3.2 THz, 甘肃、塔克拉玛干及腾格里沙尘暴的最强衰减大致是在1.6—4.2 THz范围; 毛乌素和黄土沙尘暴对3—7 THz频段内的太赫兹波都有较强的衰减.
根据Mie散射理论可知, 粒子对波长比较接近自身尺度的入射波散射较强. 沙尘暴模态不同, 对太赫兹波衰减最强的频段也不同, 其主要原因是沙尘群粒子的尺度分布不同所致. 根据表1所列的沙粒的尺度分布参数可知, 黄土和毛乌素沙尘粒子的尺度分布比较接近, 大多数粒子直径在30—70 μm范围, 在六种模态中, 这两种沙尘粒子的尺度相对最小, 故相应强衰减的入射波的波长最小, 频率最高; 腾格里、塔克拉玛干及甘肃沙粒的尺度分布比较接近, 多数粒子直径分布在80—130 μm之间, 明显大于黄土和毛乌素沙尘粒子的粒径, 故这三种模式的沙尘暴强衰减的入射波波长大于前两种; 相对而言, 海岸沙粒的尺寸最大, 多数粒子直径在130—180 μm范围, 因此, 强衰减的入射波波长相对最长, 频率相对最低.
2
4.1.衰减率与含水量的关系
选取频率分别为1, 2, 3, 5和8 THz的太赫兹波, 在19 ℃时, 水在这些频率处的复介电系数分别为4.06 + i2.26, 3.70 + i1.66, 3.53 + i1.69, 2.68 + i1.81和2.25 + i0.94[20], 首先根据(5)式计算不同含水量的湿沙粒子的等效复介电系数, 其余计算过程与第3节干沙模态类同. 在能见度Vb = 1 km的条件下, 计算得到两种湿沙模态沙尘暴对几种太赫兹波的消光参量、衰减率与沙粒含水量的关系如图5和图6所示. 图 5 黄土沙尘暴对太赫兹波的衰减与含水量的关系 (a) ω vs. p; (b) g vs. p; (c) μ vs. p; (d) A vs. p
Figure5. Relationship between THz wave attenuation and water content of loess sand and dust storms: (a) ω vs. p; (b) g vs. p; (c) μ vs. p; (d) A vs. p.
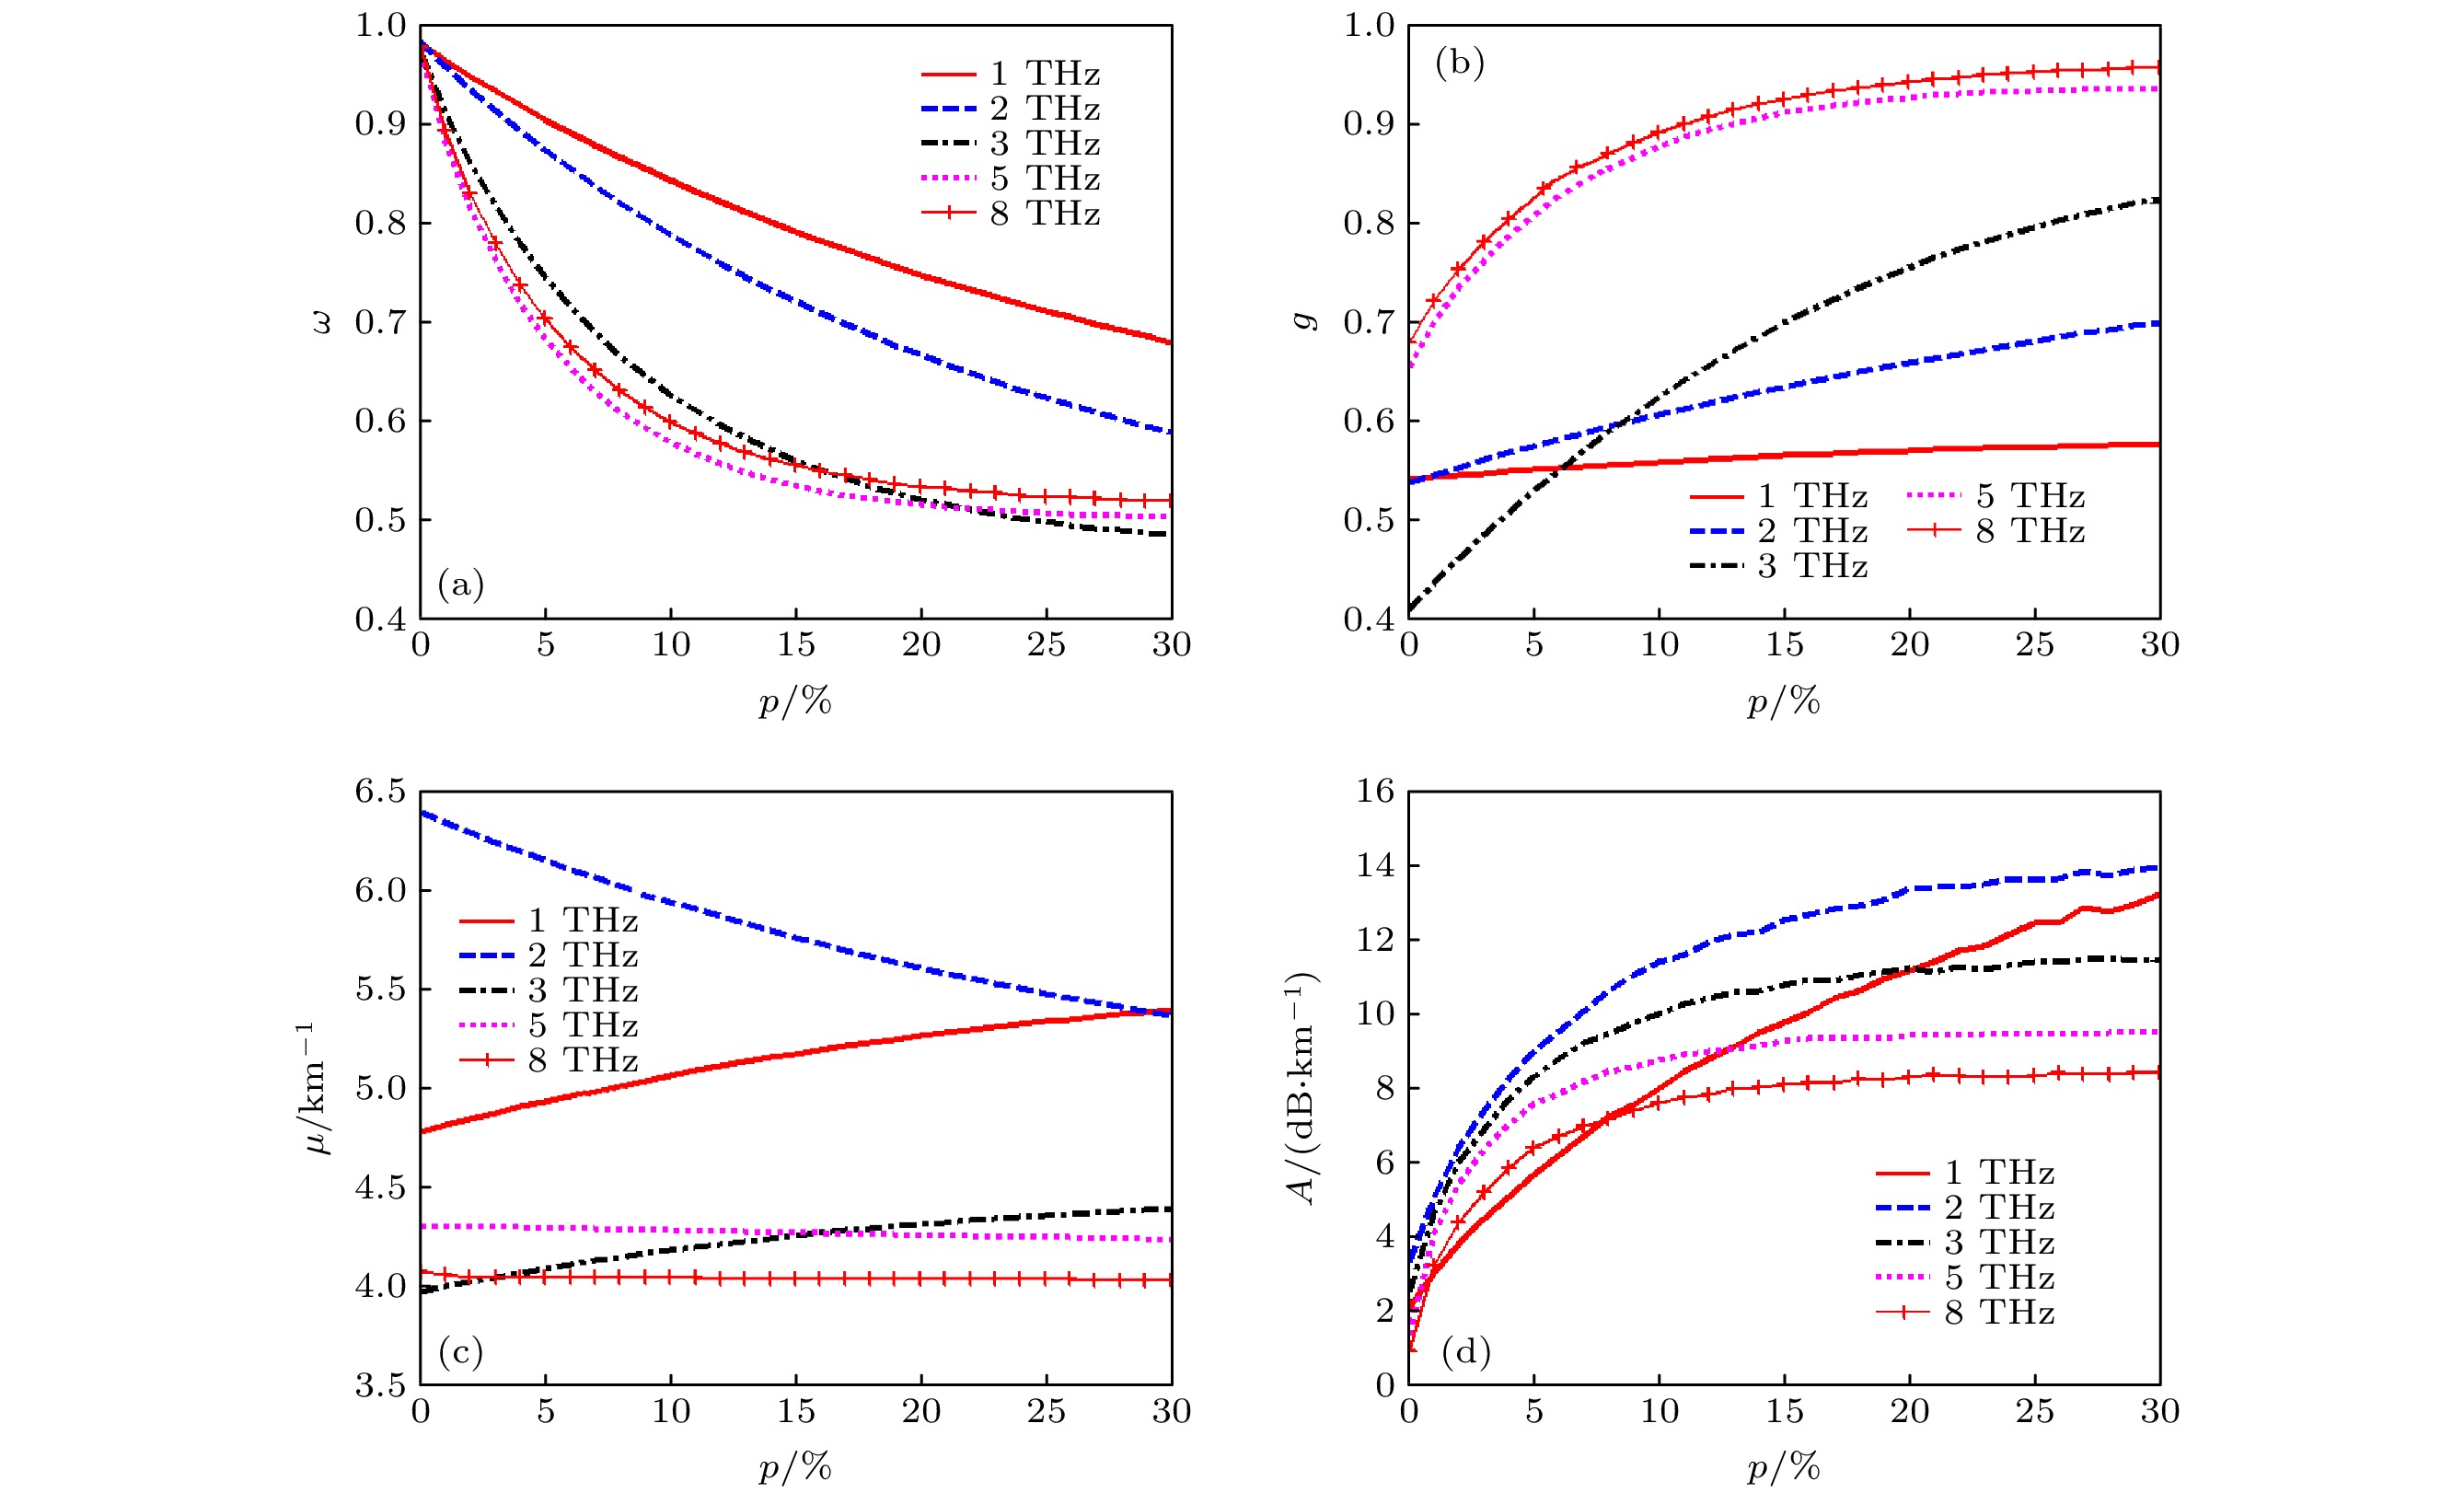 图 6 海岸沙尘暴对太赫兹波的衰减与含水量的关系 (a) ω vs. p; (b) g vs. p; (c) μ vs. p; (d) A vs. p
Figure6. Relationship between THz wave attenuation and water content of coastal sand and dust storms: (a) ω vs. p; (b) g vs. p; (c) μ vs. p; (d) A vs. p.
从图5(a)和图6(a)可以看出, 两种沙尘暴对各频率太赫兹波的散射反照率ω 随沙粒含水量的增大而减小, 这是由于吸收作用随含水量的增大而增加的缘故.
图5(c)说明, 对于黄土沙尘暴, 1和2 THz波消光系数随含水量增大略有增大, 8 THz波消光系数对含水量不敏感, 3和5 THz波消光系数随含水量增大而略有减小, 这是由于尽管沙粒群的吸收作用随含水量增加而加强了, 但散射作用减弱, 导致总的消光系数减小. 从蒙特卡罗方法计算的图5(d)结果可以看出: 1, 2及3 THz波衰减率随含水量增大而显著增大; 对于高频的5和8 THz波, 含水量小于5%时, 衰减率随含水量增大而显著增大, 当含水量大于15%时, 衰减率随含水量增大变化减缓.
图6(c)说明, 对于海岸沙尘暴, 1和3 THz波消光系数随含水量增大略有增大, 5和8 THz波消光系数对含水量不敏感, 2 THz波消光系数随含水量增大而明显减小. 图6(d)所示的蒙特卡罗方法计算结果表明: 含水量小于5%时, 各频率太赫兹波的衰减率随含水量增大都显著增大; 在含水量大于15%时, 频率越高, 其衰减率随含水量增大变化越缓慢.
2
4.2.衰减率与频率的关系
在能见度Vb = 1 km的条件下, 选取1—10 THz范围的太赫兹波频率, 采用与上类同的方法, 计算得到含水量不同时(5%, 10%, 20%, 30%), 两种湿沙模态沙尘暴对太赫兹波消光参量、衰减率与频率的关系如图7和图8所示, 为了与干沙相比较, 还同时在图中呈现了干沙(0%)的计算结果. 图 7 不同含水量的黄土沙尘暴对太赫兹波的衰减与频率的关系 (a) ω vs. f ; (b) g vs. f ; (c) μ vs. f ; (d) A vs. f
Figure7. Relationship of THz wave attenuation caused by loess sand and dust storms with different water content to frequency: (a) ω vs. f ; (b) g vs. f ; (c) μ vs. f ; (d) A vs. f .
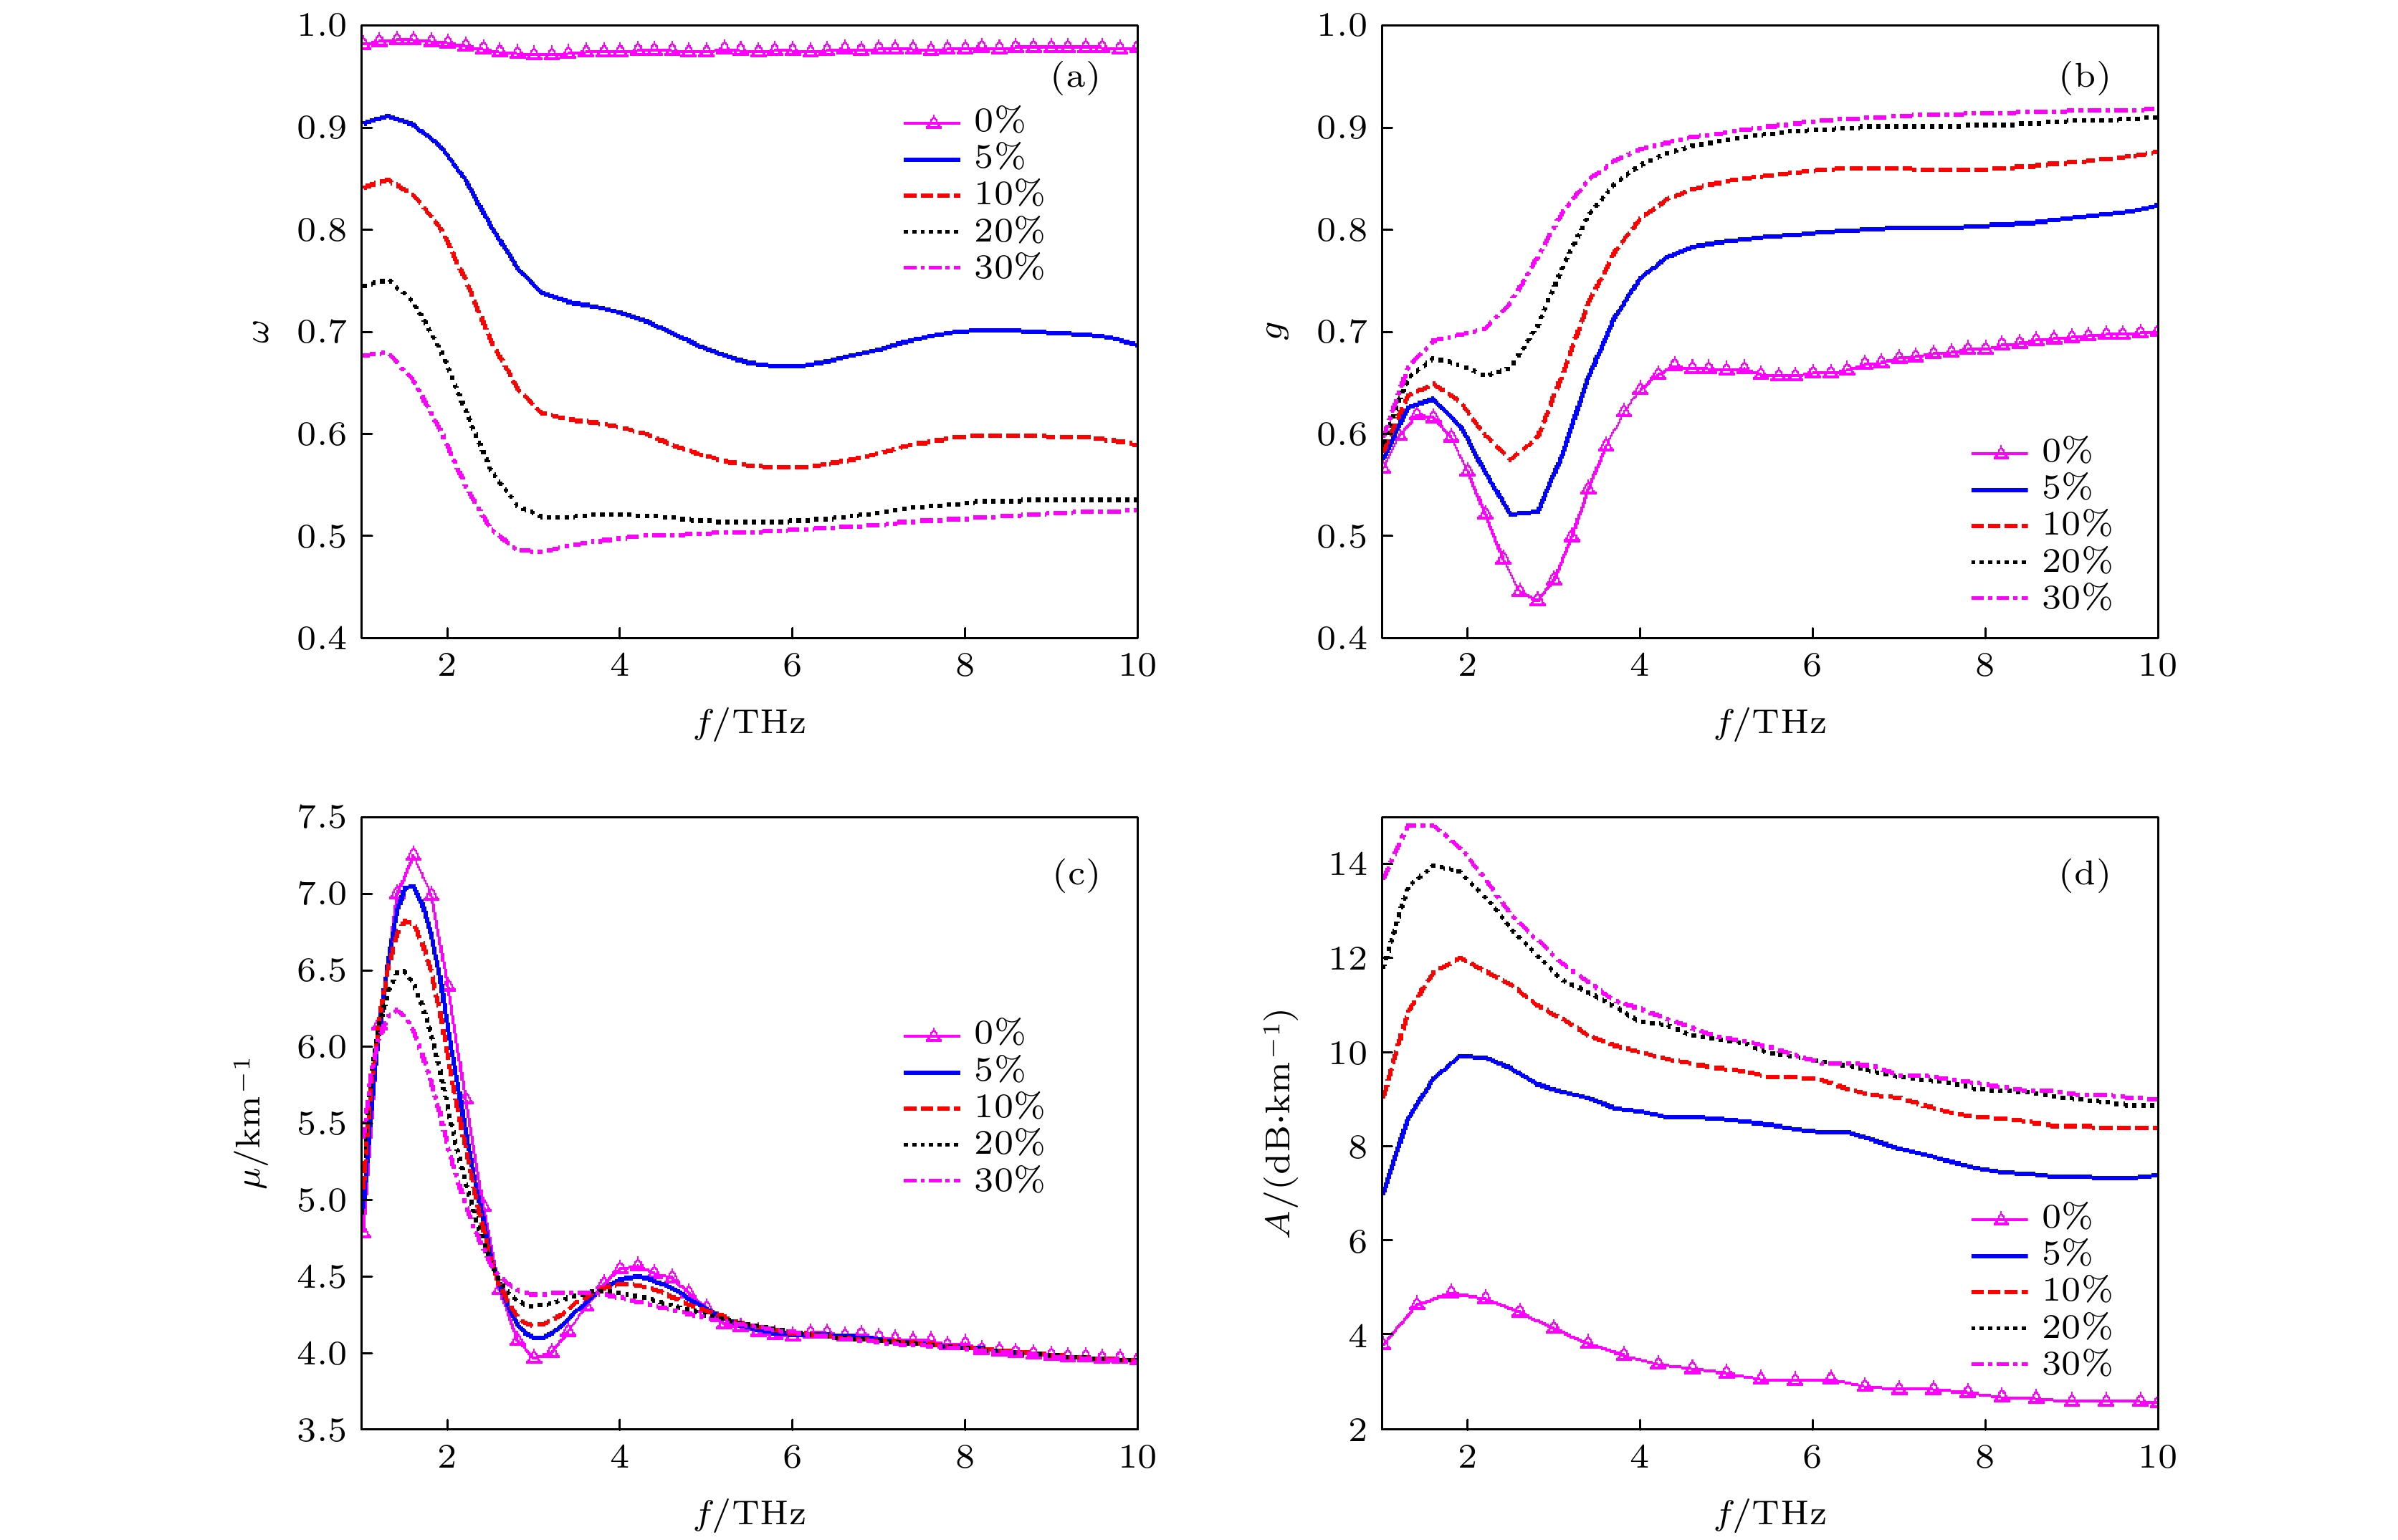 图 8 不同含水量的海岸沙尘暴对太赫兹波的衰减与频率的关系 (a) ω vs. p; (b) g vs. p; (c) μ vs. p; (d) A vs. p
Figure8. Relationship between THz wave attenuation caused by coastal sand and dust storms with different water content to frequency: (a) ω vs. p; (b) g vs. p; (c) μ vs. p; (d) A vs. p.
从图7(a)和图8(a)可以看出, 湿沙模态沙尘暴的反照率随频率的增大呈波浪式变化, 其值明显小于干沙模态沙尘暴的反照率, 说明湿沙模态沙尘暴的消光效应是散射和吸收共同作用的结果, 而干沙模态沙尘暴的消光效应是散射作用的结果, 沙尘粒子含水量越高, 反照率越小, 吸收作用越强.
图7(d)和图8(d)表明: 不同含水量时两种湿沙模态沙尘暴对太赫兹波的衰减率都是随频率增大先增大而后逐渐减小, 随含水量增大, 衰减强的频段向低频方向移动; 此外, 还可以看出, 当频率大于5 THz时, 20%和30%的两条曲线比较接近, 进一步说明沙尘暴对高频段的太赫兹波(> 5 THz)衰减随含水量的进一步增大变化减缓.
通过数值计算, 给出了六种干沙模态沙尘暴对太赫兹波的消光参量和衰减率与频率的关系. 结果显示, 各干沙模态散射反照率都很高, 消光主要是散射作用所致. 在1—2 THz波段, 衰减率随太赫兹波频率的增大而增强, 而在4.2—10 THz高频波段, 衰减率随太赫兹波频率的增加非常缓慢地减小, 各模态沙尘暴的沙粒尺度分布不同, 其衰减率较强的频段范围也不同, 干沙模态的海岸沙尘暴其沙粒尺寸相对较大, 对1—3.2 THz频段的太赫兹波有较强的衰减, 甘肃、塔克拉玛干及腾格里三种沙尘暴的沙粒尺寸分布比较一致, 衰减较强的频段是在1.6—4.2 THz范围, 而毛乌素和黄土沙尘暴其沙粒尺寸相对较小, 对3—7.0 THz频段内的太赫兹波衰减较强. 因此, 根据不同模态的沙尘暴天气对太赫兹波的衰减规律, 在不同地区可避开强衰减的太赫兹波频段, 选用低衰减的工作频段.
分析了两种湿沙模态沙尘暴含水量对太赫兹波的消光参量和衰减率的影响, 并和干沙模态沙尘暴的计算结果进行了比较. 结果显示, 湿沙模态沙尘暴的反照率明显小于相同尺度分布的干沙模态沙尘暴的反照率, 消光是散射和吸收共同作用的结果, 吸收作用随含水量的增大而增强. 太赫兹波频率不同, 含水量对衰减率的影响也不同, 随沙粒含水量增大, 湿沙模态沙尘暴强衰减频段向低频方向移动. 含水量小于5%时, 衰减率随含水量增大而显著增大, 当含水量大于15%时, 高频段的太赫兹波衰减率随含水量的进一步增大变化减缓; 相对而言, 湿沙模态沙尘暴比干沙模态沙尘暴对太赫兹波传播的衰减影响更为显著.
