1.State Key Laboratory of Quantum Optics and Quantum Optics Devices, Institute of Opto-Electronics, Shanxi University, Taiyuan 030006, China 2.Collaborative Innovation Center of Extreme Optics, Shanxi University, Taiyuan 030006, China
Fund Project:Project supported by the National Key Research and Development Program of China (Grant Nos. 2016YFA0301602, 2018YFA0307600) and the National Natural Science Foundation of China (Grant Nos. 11804203, 11904217)
Received Date:08 April 2020
Accepted Date:06 June 2020
Available Online:29 September 2020
Published Online:05 October 2020
Abstract:Quantum phase transition of ultracold atomic gas is one of the core contents in the study of quantum correlational many-body systems. In this paper, two-dimensional (2D) optical lattices are generated by a single fold retroreflected laser beam, and this scheme is used to experimentally design and implement the 2D optical lattice of double wells suitable for isolating and manipulating an array of individual pairs of atoms and predict a topological semimetal in the high orbital bands in this 2D lattice. Two types of optical lattice structures are produced by controlling the laser polarization. One type is the usual 2D optical lattice, which is formed by two independent one-dimensional(1D) optical lattices in two directions and named in-plane lattice, and the other type is the lattice that is formed by the interference between two one-dimensional optical lattices in two directions and called out-plane lattice. When 87Rb BEC (Bose-Einstein condensation) is loaded into the 2D optical lattice, the quantum phase transition between superfluid state and Mott insulator state is observed by controlling the tunneling and in-site interaction. And the phase transition from superfluid state to Mott insulator is judged by observing whether there are interferential lattice points in momentum space. The lattice depths of two cases can be calibrated by Kapitza-Dirac scattering in the ultracold atomic experiment through the time-of-flight absorption imaging. In the in-plane optical lattice, some incorrect points appear in the 45° direction, because the linear polarization degree of beam is impure after being reflected by mirrors and two direction of beam are not completely orthogonal to each other. It is obvious that the two cases have different phase transition points, which is due mainly to the difference in structure. For the in-plane lattice, there are two independent 1D optical lattices, and for the out-plane lattice, the two direction beams mutually interfere with each other, therefore, two optical lattices are not independent of each other. The atoms come back to BEC by reducing the potentials of optical lattice to zero; the temperature of system is slightly higher, because of the jitter of the light lattice. The different behaviors of quantum phase transition are analyzed for two types of optical lattices. This work will provide a platform for the future study of large spin system and strong correlation physics in optical lattices. Keywords:optical lattice/ quantum transition/ many-body physics/ superfluid/ Mott insulator
此时这一状态为MI态, 相邻格点间没有相干, 所以在动量空间不会观察到干涉产生的离散动量分量. 前面描述两个极端情况下的Bose-Hubbard模型, 考虑J/U从$0 \to \infty $即从SF态到MI态的相变过程, 这主要由J/U和${\mu _i}/{U}$共同作用, 如果MI态中单个格点中仅有一个原子, 可以根据蒙特卡洛数值模拟出临界点为${\left( {U/J} \right)_{n = 1}} = 16.4$[21]. 3.实验过程图2为产生二维光晶格的实验光路图. 光晶格激光经过平面反射镜M1、M2和平凹反射镜M3的反射后, 沿原光路返回, 其中消色差透镜F0、F1使激光会聚到原子的束腰直径为200 μm. 图 2 实验装置二维光晶格由一束激光往返产生, 其中方案1和方案2分别代表激光偏振平行和垂直于光束所在平面的两种情况 Figure2. Schematic diagram of the experimental setup to realize the two-dimensional optical lattices. The two-dimensional optical lattices are made of a single fold retroreflected laser beam. The linearly polarization of the incident laser beam aligned parallel (case 1) or normal (case 2) to the drawing plane can generate two different cases of two-dimensional optical lattice potentials.
在本实验中, 通过改变激光偏振产生了两种不同结构的二维光晶格. 根据入射激光偏振的不同, 具体分为两种方案: 方案1是激光的偏振平行于光束所在平面, 由此产生的二维光晶格称为面内晶格, 沿x轴和y轴是两个独立的一维光晶格, 所以势阱为${U_1}\left( {x, y} \right) = V\left[ {{\rm{co}}{{\rm{s}}^2}\left( {{k_{\rm{r}}}x} \right) + {\rm{co}}{{\rm{s}}^2}\left( {{k_{\rm{r}}}y} \right)} \right]$, 其中${k_{\rm{r}}} = 2{\text{π}}/\lambda $, $\lambda $是光晶格激光的波长. 面内二维光晶格势阱的空间分布及在xz平面上的投影如图3(a)所示, 可以看到势阱沿x、y轴独立分布, 空间周期为$\lambda /2$. 方案2是入射激光偏振垂直于光束所在平面, 产生的二维光晶格称为面外晶格, 因为沿x、y方向激光偏振互相平行, 所以两个一维光晶格会产生干涉, 势阱为${U_2}\left( {x, y} \right) = V \big[ {\rm{co}}{{\rm{s}}}\left( {{k_{\rm{r}}}x} \right) + {\rm{co}}{{\rm{s}}}\left( {{k_{\rm{r}}}y} \right) \big]^2$, 其中${\rm{2 cos}}\left( {{k_{\rm{r}}}x} \right){\rm{cos}}\left( {{k_{\rm{r}}}y} \right)$为干涉项, 由图3(b)可以看到势阱沿x轴、y轴呈45°分布, 周期为$\lambda /\sqrt 2 $当波长为红失谐时(V < 0), 光晶格产生的势阱就像地平面上挖的一个个“洞”. 近期本研究组将这两种光晶格的相位信息写到物质波上, 产生了亚波长的相位结构[22]. 图3(c)和3(d)分别表示的是面内晶格和面外晶格的一个晶胞. 图3(e)表示的是在相同光强和波长下, 两种光晶格势在xz平面的分布, 蓝线代表方案1(两条蓝线对应图3(a)中势阱在xz面上最低和最高处的平面分布), 红线代表方案2, 可以看到在相同情况下, 面外光晶格势阱更深, 束缚原子的能力也越强, 也更容易达到MI态. 图 3 两种光晶格 (a)方案1的面内光晶格空间分布; (b)方案2的面外光晶格空间分布; (c)方案1的晶胞; (d)方案2的晶胞; (e)两种光晶格势在xz平面上的分布 Figure3. Two types of optical lattices: (a) Spatial distribution pattern of in-plane optical lattice for case 1; (b) spatial distribution pattern of out-plane optical lattice for case 2; (c) unit cell for case 1; (d) unit cell for case 2; (e) the potentials of two types of optical lattices(V = –Er).
具体实验过程如下: ${\left| {F = 2, {m_F} = 2} \right\rangle }$态的87Rb原子在四极磁阱和蓝失谐光塞势阱叠加形成的复合阱中进行射频蒸发预冷却[23-25], 当原子温度达到5 μK左右时, 将原子装载到两束激光交叉形成的偶极阱中(波长为1064 nm, 频率相差10 MHz, 在原子云处的光斑直径是200 μm), 通过进一步蒸发冷却后, 最终获得2 × 10⁵个87Rb原子的玻色爱因斯坦凝聚体[26,27]. 然后打开光晶格激光, 将光强由零线性增大, 用时30 ms, 再等待5 ms, 使原子在光晶格中稳定下来. 时序如图4(a)所示, 红线表示光晶格光强. 在打开光晶格过程中光偶极阱功率保持不变, 用于维持z方向的束缚, 最后突然关闭偶极阱和光晶格势阱, 原子在自由空间中飞行12 ms后做吸收成像(time of flight, TOF), 依据原子在动量空间中的分布, 可以判定BEC是否相变到MI态; 当获得MI态后, 降低光晶格光强到零, 用时30 ms, 最后同时关断所有激光, 自由飞行12 ms成像, 即实现SF态到MI态再到BEC的量子相变, 实验时序如图4(b)所示. 图 4 实验时序图 红色表示的光晶格光强的变化, 最后自由飞行12 ms吸收成像, 其中(a)表示SF到MI的时序, (b)表示BEC到MI再到BEC的时序 Figure4. Schematic diagram of the experimental sequence: The red lines show the light intensity of optical lattice, and finally have an imaging of TOF 12 ms. The drawing (a) shows the sequence of SF to MI, drawing (b) shows the sequence of BEC to MI, and back to BEC.
4.实验结果和分析实验上首先研究了面内二维光晶格的量子相变过程. 通过每次调节时序图4(a)中的光强来观察相变过程, 分别为0.92 mW(2.23Er)、3.7 mW(8.96Er)、10.67 mW(25.84Er)和13.26 mW(32.12Er), 由此得到图5中的(a1)、(a2)、(a3)、(a4), 可以看到在弱光晶格下, 在原子动量空间中心的上下左右四个正方向$ {2 k}_{r} $处出现干涉的动量分量, 表明原子处在超流态, 随着光强增大, 格点间原子隧穿减弱, 相互作用增强, 格点间的干涉减弱, 因此干涉的高动量分量对比度减弱. (a2)中在±45°方向上出现$\sqrt 2 {k_{\rm{r}}}$动量分量, 这主要是由于偏振不纯导致有少许面外光晶格的贡献, 实验中用偏振分光棱镜测得光束经过反射镜M2时, 消光比已经由1/1000变化到1.8/1000; 其次是两个方向上的光路无法保证完全垂直. 当阱深加到32Er时, 凝聚体彻底相变到MI态, 此时每个格点内原子相互作用增强, 由此导致格点间原子的相对相位随机, 因此干涉消失, 此时原子弥散分布在连续动量空间里. Spielman等[28]采用单束激光产生二维光晶格, 实验观测到87Rb原子在面内晶格中由SF态彻底相变到MI态的阱深接近31(2)Er, 结论与本文实验结果相一致. 在图5(a)的基础上, 分别将四次实验的光晶格势阱降到零, 重新获得BEC, 分别对应(b1)、(b2)、(b3)、(b4), 发现光晶格势阱越深, 返回得到的BEC中热原子数也越多, 原子温度略有升高, 主要是由光晶格抖动等不稳定性因素引起原子加热. 图 5 方案1的量子相变 (a0)表示获得MI态的时序图, (a1)到(a4)为SF态相变到MI态的过程, (a1)中红色标注为光晶格格点, (a2)中白色标注的格点主要由于激光偏振不纯、x轴和y轴方向上的光路不完全正交所导致的, 当势阱逐渐加深, 隧穿开始加强, 这些格点也越明显; (b0)为BEC相变到MI态, 再相变回BEC的时序图, 分别对应(b1)—(b4) Figure5. Quantum phase transition for case 1: (a0) Reveals the sequence diagram of BEC to MI, from (a1) to (a4), show the imaging from SF to MI. In (a1), the red dashed circles show the lattice points, and in (a2), the white dashed circles show some incorrect lattice points, because the linearly polarization is impure and two beam paths along x axis and y axis are not totally orthogonal. Increasing potentials, these lattice points are more obvious; (b0) reveals the sequence diagram of MI to BEC, (b1) to (b4) show the imaging of MI to BEC after decreasing the potentials to zero.
之后实验研究了87Rb原子在面外二维光晶格中的量子相变过程, 与方案1相同, 通过改变晶格光强来观察相变过程, 具体的光强参数为0.89 mW(2.15Er), 2.3 mW(5.57Er)、4.2 mW(10.17Er)、5.1 mW (12.35Er), 由此得到图6中的(a1)、(a2)、(a3)、(a4), 表示SF态相变到MI态的过程; 随后分别减小光强到零, 得到各自对应的BEC, 如图6(b1)至图6(b4). 图 6 方案2的量子相变 (a0)表示获得MI态的时序图, 其中(a1)到(a4)为体系从SF相变到MI的过程; (b0)为BEC相变到MI态, 再相变回BEC的时序图, 其中(b1)到(b4)分别对应(a)中光晶格势阱降低到零, 重新获得BEC的空间分布图像 Figure6. Quantum transition for case 2: (a0) Reveals the sequence diagram of BEC to MI, from (a1) to (a4), show the imaging from BEC to MI; (b0) reveals the sequence diagram of MI to BEC, from (b1) to (b4), show the imaging from MI to BEC.


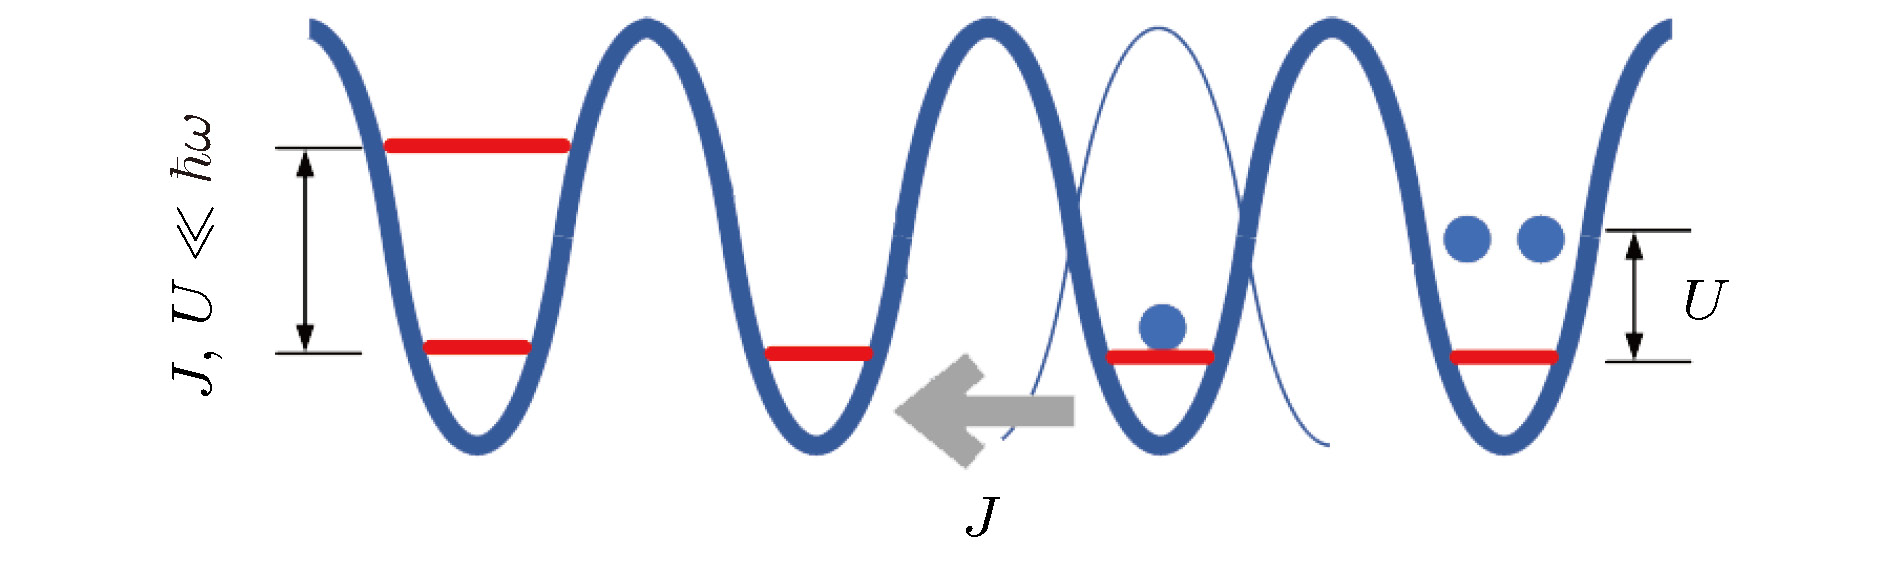 图 1 超冷原子在光晶格中的隧穿


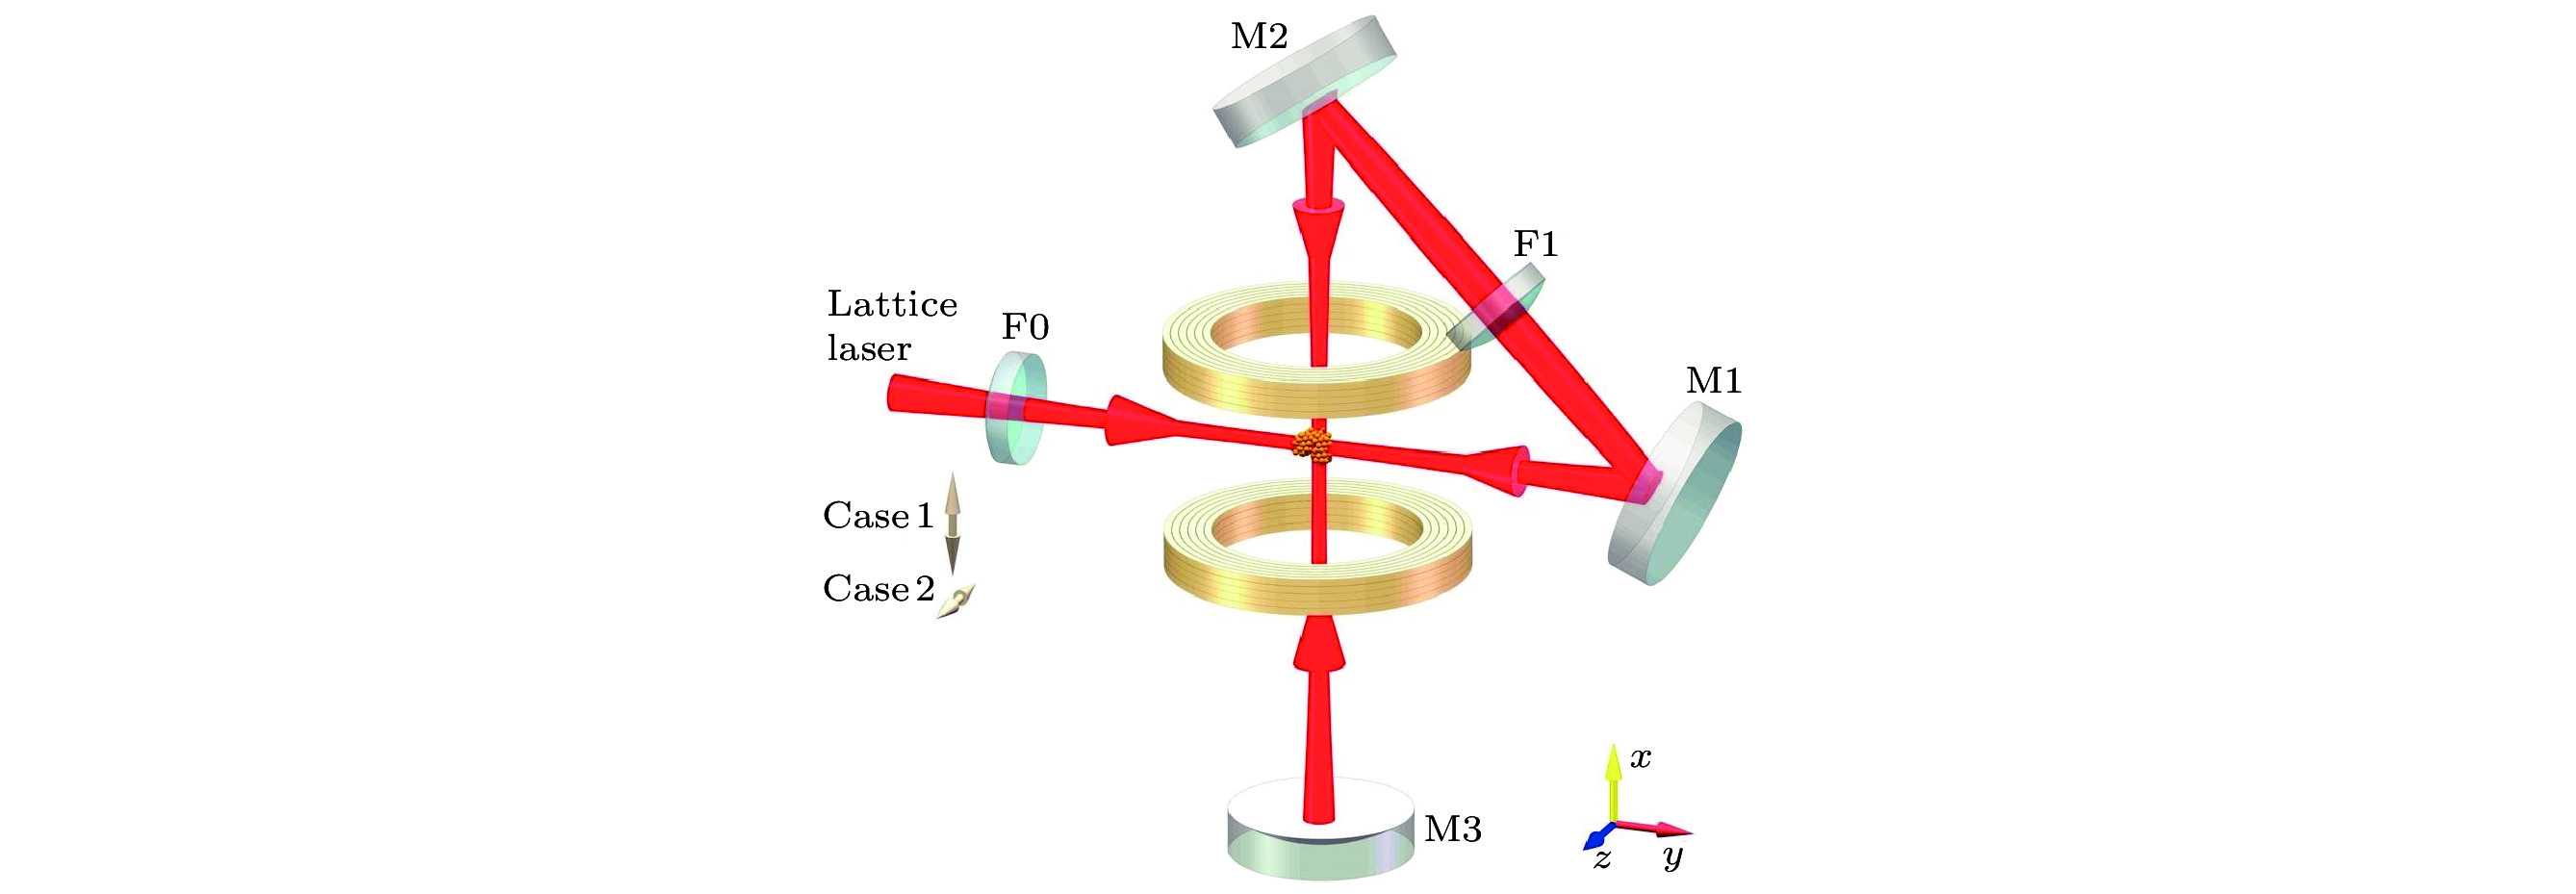 图 2 实验装置二维光晶格由一束激光往返产生, 其中方案1和方案2分别代表激光偏振平行和垂直于光束所在平面的两种情况


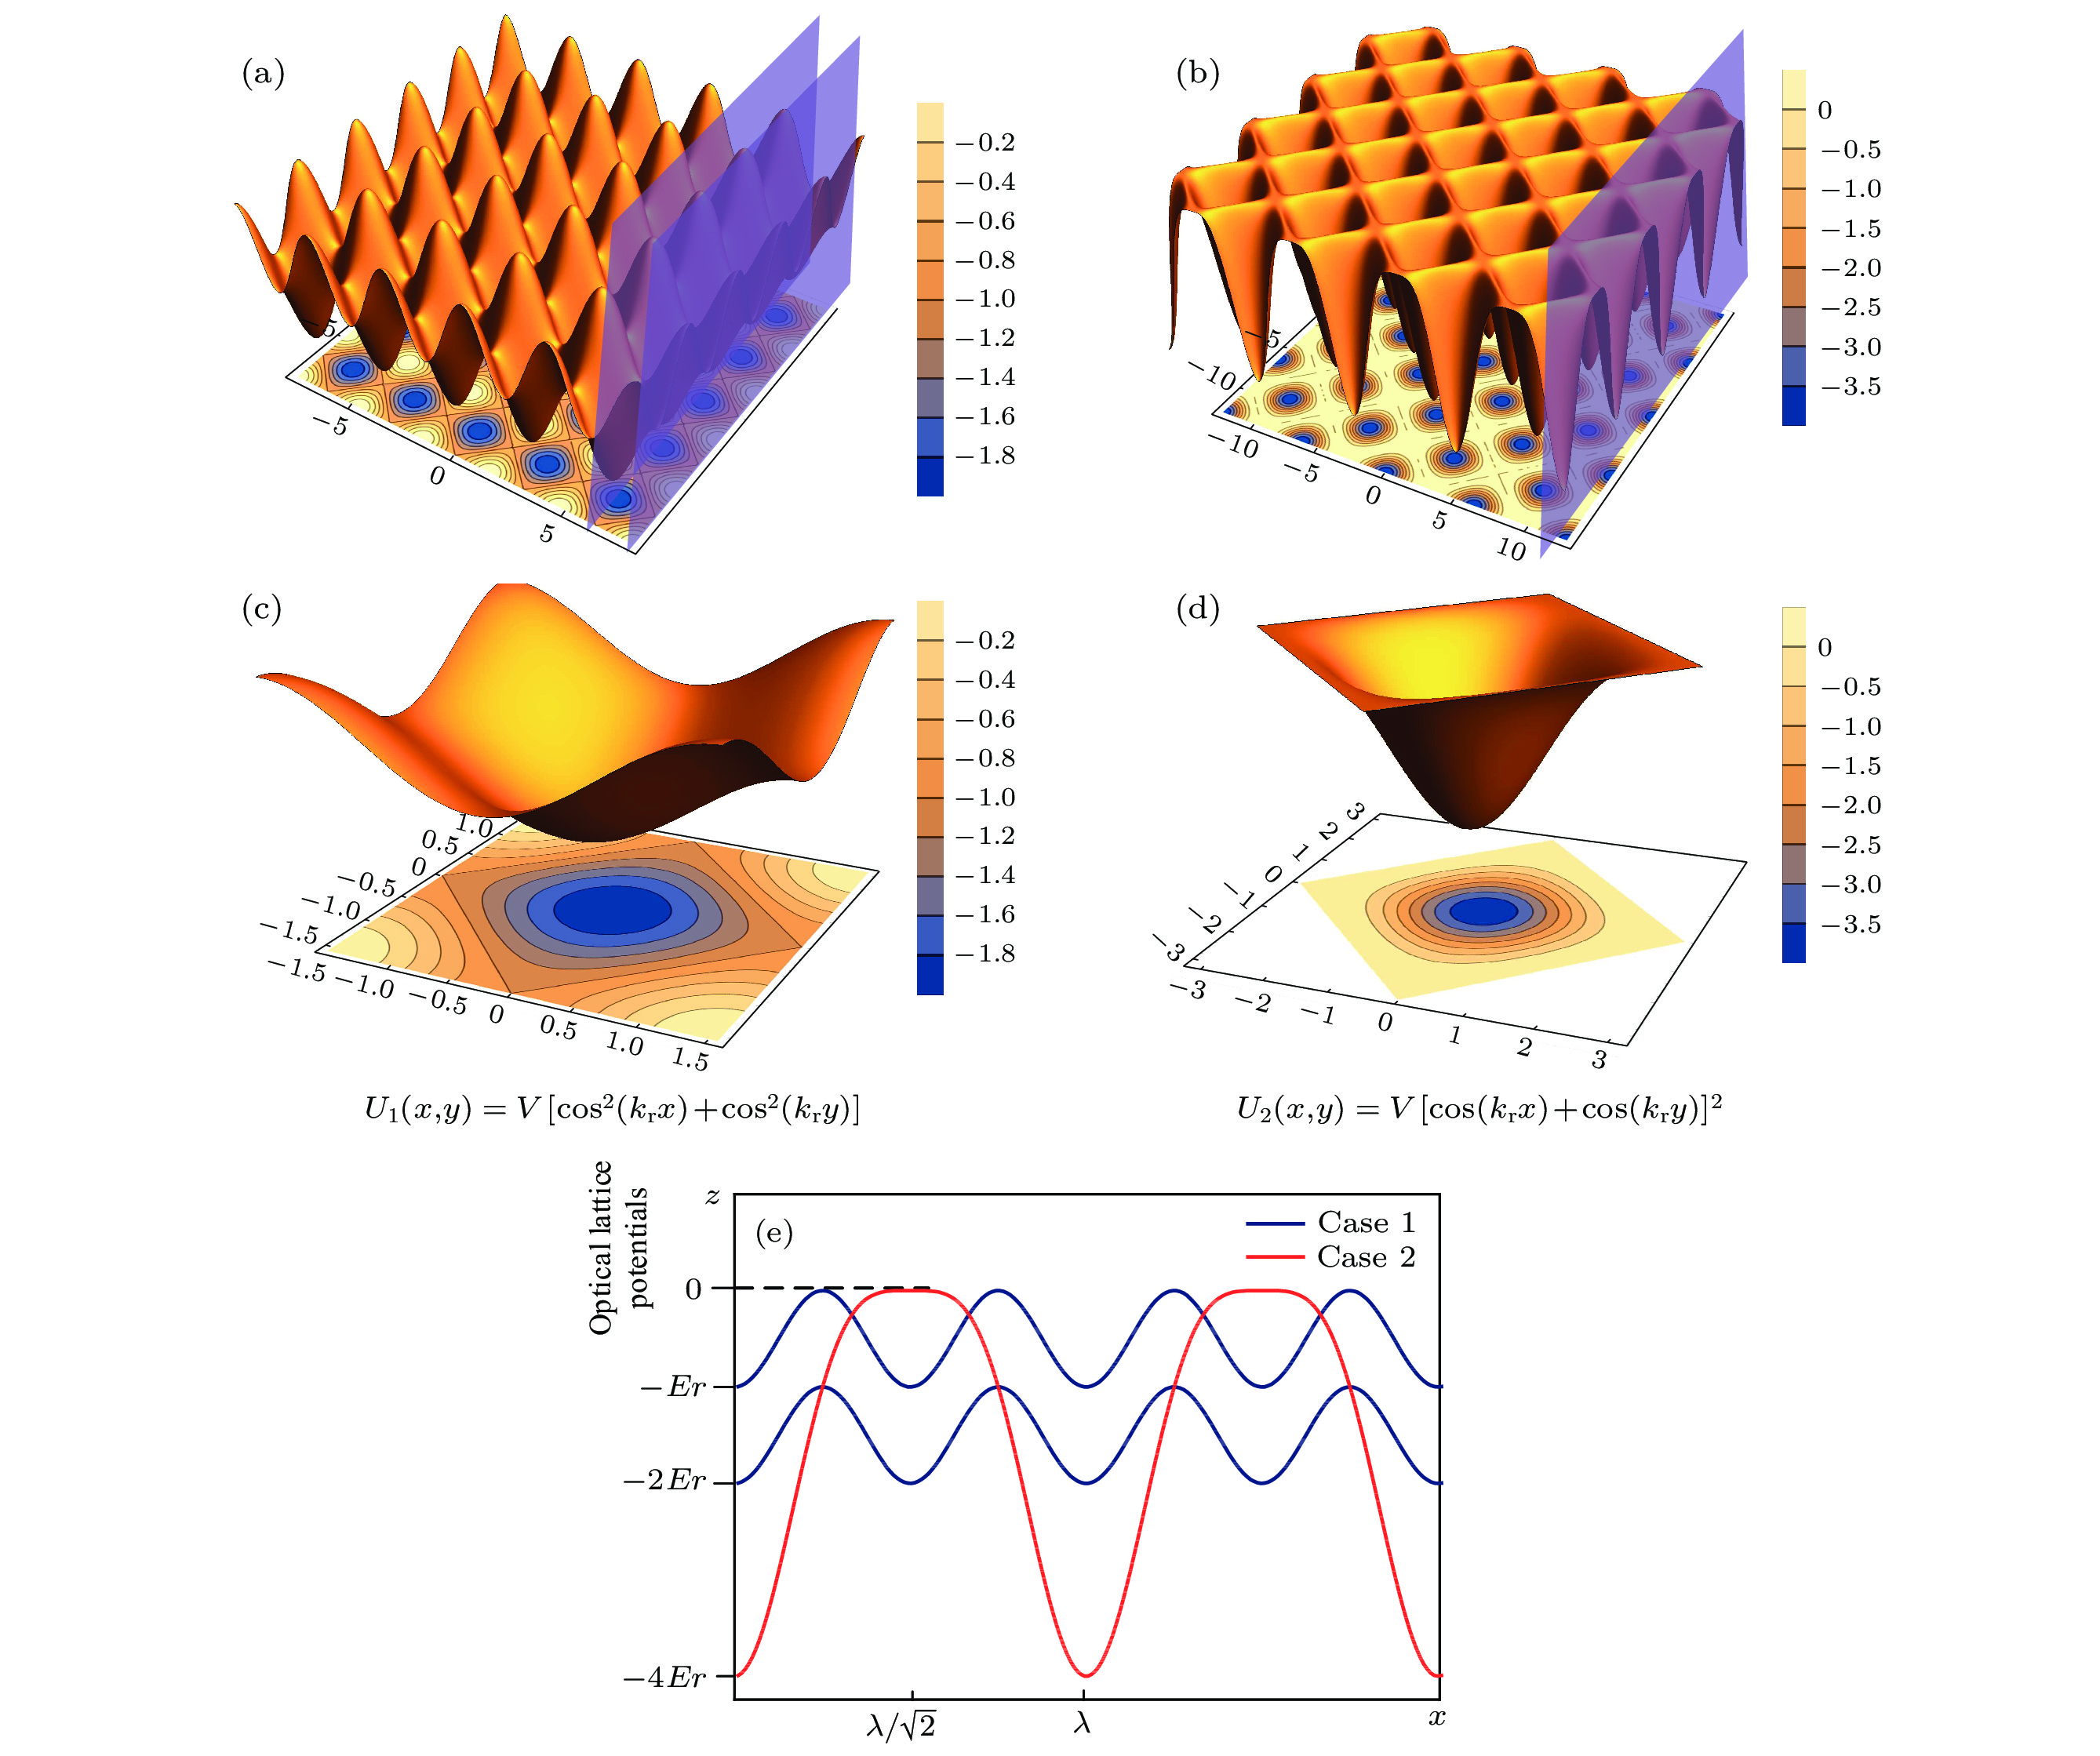 图 3 两种光晶格 (a)方案1的面内光晶格空间分布; (b)方案2的面外光晶格空间分布; (c)方案1的晶胞; (d)方案2的晶胞; (e)两种光晶格势在xz平面上的分布
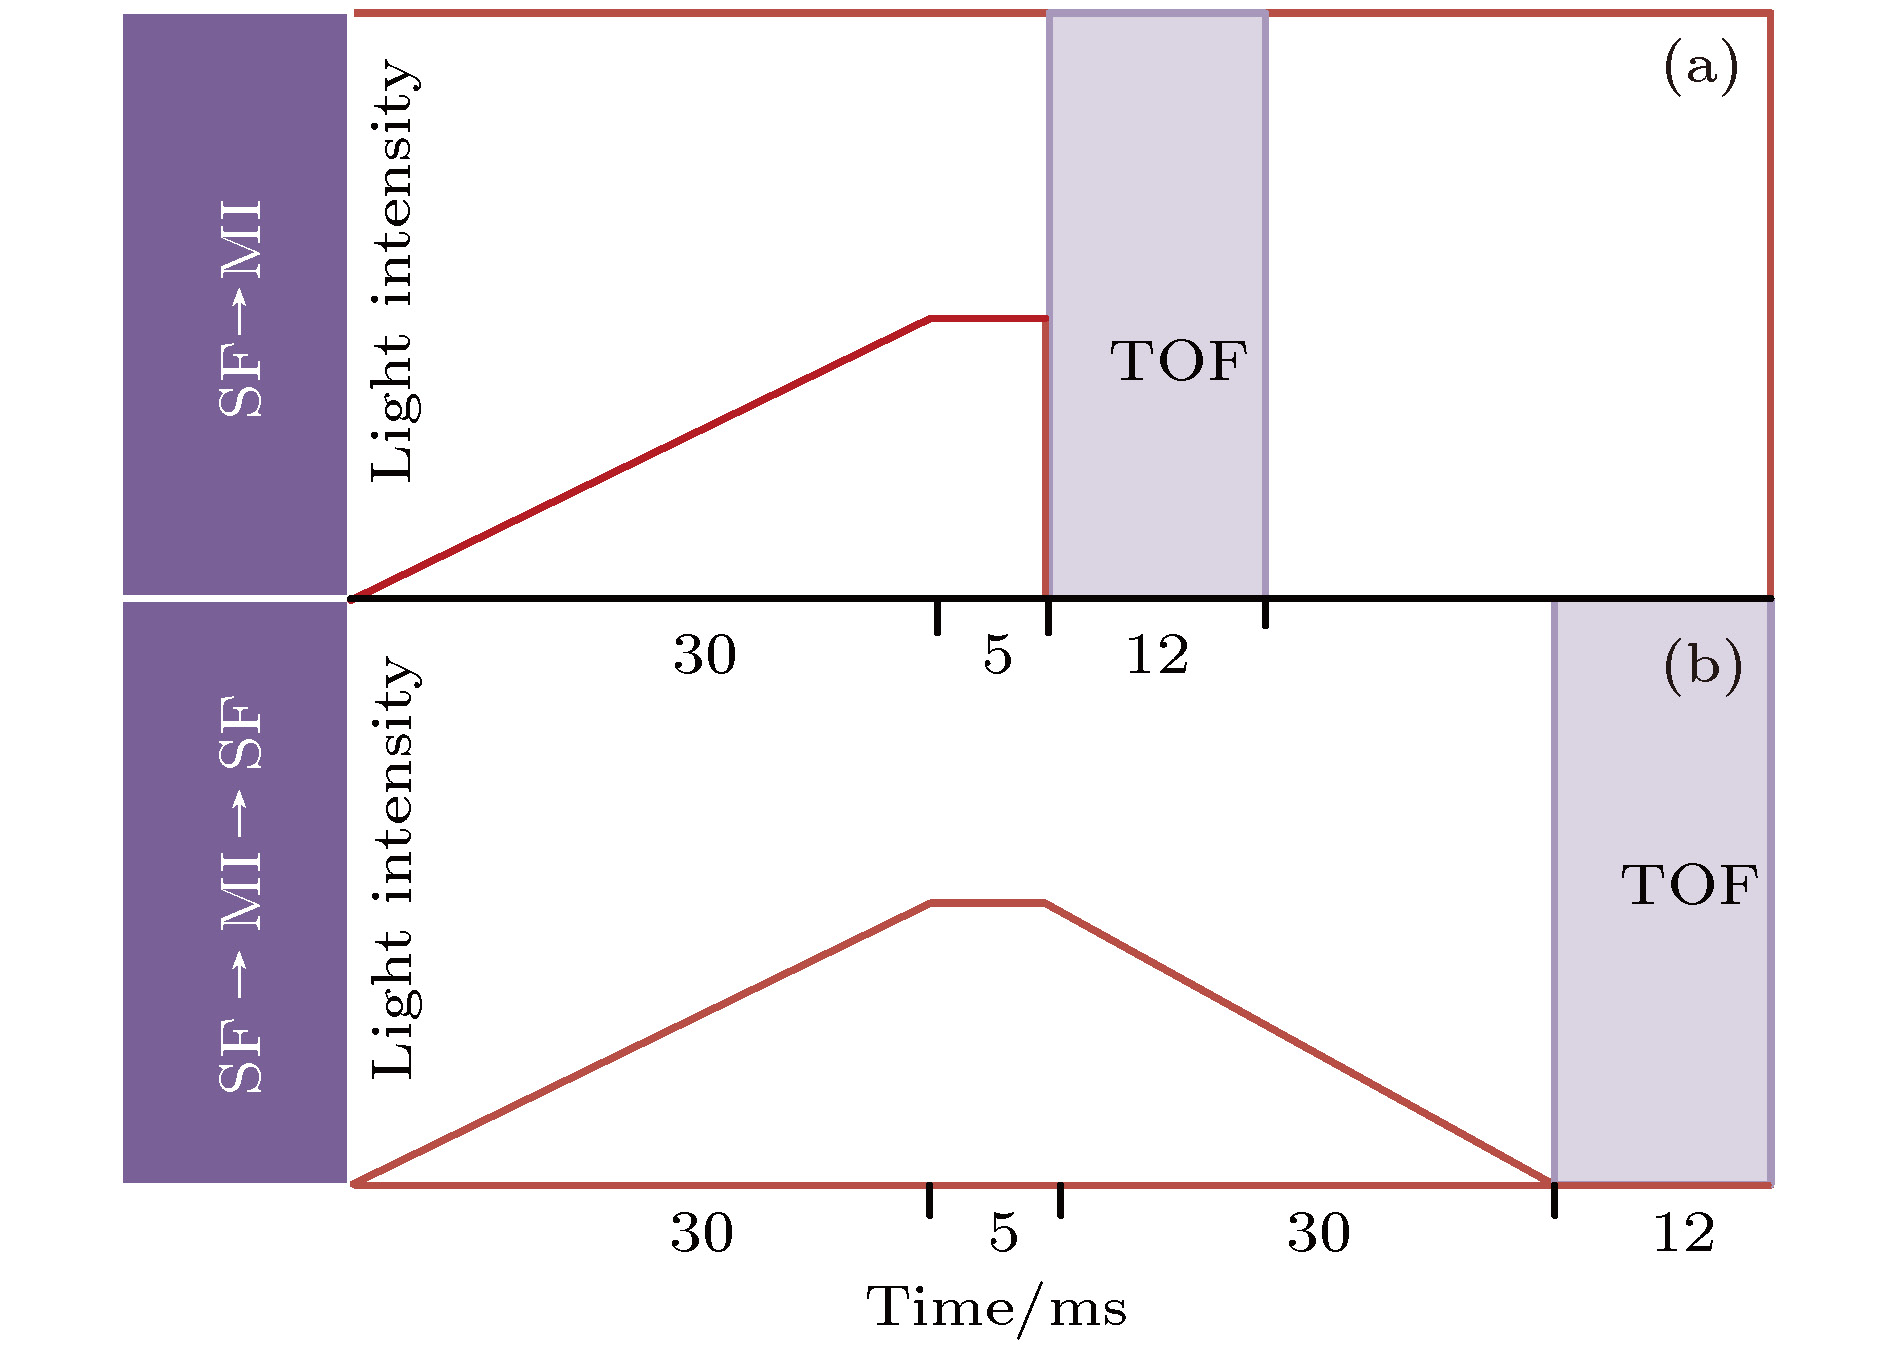 图 4 实验时序图 红色表示的光晶格光强的变化, 最后自由飞行12 ms吸收成像, 其中(a)表示SF到MI的时序, (b)表示BEC到MI再到BEC的时序

 图 5 方案1的量子相变 (a0)表示获得MI态的时序图, (a1)到(a4)为SF态相变到MI态的过程, (a1)中红色标注为光晶格格点, (a2)中白色标注的格点主要由于激光偏振不纯、x轴和y轴方向上的光路不完全正交所导致的, 当势阱逐渐加深, 隧穿开始加强, 这些格点也越明显; (b0)为BEC相变到MI态, 再相变回BEC的时序图, 分别对应(b1)—(b4)
 图 6 方案2的量子相变 (a0)表示获得MI态的时序图, 其中(a1)到(a4)为体系从SF相变到MI的过程; (b0)为BEC相变到MI态, 再相变回BEC的时序图, 其中(b1)到(b4)分别对应(a)中光晶格势阱降低到零, 重新获得BEC的空间分布图像

