1.Key Laboratory of Nuclear Data, China Institute of Atomic Energy, Beijing 102413, China 2.Institute of High Energy Physics, Chinese Academy of Sciences, Beijing 100049, China 3.Spallation Neutron Source Science Center, Dongguan 523803, China 4.State Key Laboratory of Particle Detection and Electronics, Beijing 100049, China 5.Department of Modern Physics, University of Science and Technology of China, Hefei 230026, China 6.State Key Laboratory of Nuclear Physics and Technology, School of Physics, Peking University, Beijing 100871, China 7.Institute of Nuclear Physics and Chemistry, China Academy of Engineering Physics, Mianyang 621900, China 8.Northwest Institute of Nuclear Technology, Xi’an 710024, China 9.University of Chinese Academy of Sciences, Beijing 100049, China 10.Department of Engineering and Applied Physics, University of Science and Technology of China, Hefei 230026, China 11.School of Physics, Beihang University, Beijing 100083, China
Abstract:The back-streaming neutron beam line (Back-n) was built in the beginning of 2018, which is part of the China Spallation Neutron Source (CSNS). The Back-n is the first white neutron beam line in China, and its main application is for nuclear data measurement. For most of neutron-induced nuclear reaction measurements based on white neutron facilities, the beam of gamma rays accompanied with neutron beam is one of the most important experimental backgrounds. The back streaming neutron beam is transported directly from the spallation target to the experimental station without any moderator or shielding, the flux of the in-beam gamma rays in the experimental station is much larger than those of these facilities with neutron moderator and shielding. Therefore, it is necessary to consider the influence of in-beam gamma rays on the experimental results. Studies of the in-beam gamma rays are carried out at the back-n. Monte-Carlo simulation is employed to obtain the energy distribution and the time structure of the in-beam gamma rays. According to the simulation results, when the neutron flight time is longer than 1.0 μs the energy distribution of the in-beam gamma rays does not vary with flight time. Therefore, the time structure of these gamma rays can be measured without the correction of the detection efficiency. In this work, the time structure of the in-beam gamma rays in the low neutron energy region is measured by both direct and indirect methods. In the direct measurement, a 6Li loaded ZnS(Ag) scintillator is located on the neutron beam line and the time of flight method is used to determine the time structure of neutrons and gamma rays. The gamma rays are separated from neutrons with pulse-shape discrimination. The black filter method is used to verify the particle discrimination results. In the indirect measurement, the C6D6 scintillation detectors are used to measure the gamma rays scattered off a Pb sample on the way of the neutron beam. The time structure of the in-beam gamma rays is derived from that of the scattered gamma rays. The experimental results are in good agreement with the simulations with the time-of-flight between 12 μs and 2.0 ms. Besides, according to the simulation results, the intensity of the in-beam gamma rays is 1.21 × 10⁶ s–1·cm–2 in the center of the experimental station 2 of Back-n, which is 76.5 m away from the spallation target of CSNS. Keywords:back-streaming white neutron source/ in-beam γ-rays measurement/ time of flight method/ Monte-Carlo simulation
全文HTML
--> --> --> 1.引 言中国散裂中子源(CSNS)反角白光中子源(Back-n)是我国第一个高通量、宽能区、脉冲化的白光中子源, 其主要用途是开展核数据测量, 基础物理实验和核技术应用[1-4]. Back-n的布局图如图1所示, 高能质子(1.6 GeV)在轰击散裂靶前经过偏转磁铁偏转15°, 这使散裂靶上相对质子束流180°方向出射的中子束与质子输运线有15°夹角, 从而有足够的空间建设反角白光中子束线. 反角白光中子束线全长约80 m, 包括中子输运线和两个实验终端, 其中终端1距离散裂靶约55 m, 终端2距离散裂靶约76 m. 中子输运线包含真空管道、中子束窗、中子开关、中子准直器和废束站. 通过调节中子准直器的准直孔径, 可以在实验终端得到不同几何尺寸的中子束斑, 用于开展不同的物理实验. 图 1 CSNS Back-n布局图 Figure1. Layout of the CSNS Back-n.
表1Geant 4中的物理模型 Table1.Physical models in the Geant 4 code.
研究Back-n实验终端内的束内伽马射线, 最为直接的方式是构建整个Back-n的几何模型, 在实验终端记录伽马射线的信息. 但是对于80 m长的束线, 以上方法计算效率太低, 耗时太长. 本工作采用分步模拟的方式: 第一步在散裂靶的反角方向2.0 m处设置虚拟探测器, 记录从靶面出射的中子和伽马射线的全部信息, 包括能量、时间、位置和动量; 第二步以这些粒子为源粒子, 抽样到Back-n的实验终端2 (76.5 m). 图3显示了76.5 m处的伽马射线的能量分布(图3(a))和时间分布(图3(b)). 从图3可以看出, 束内伽马射线在20 MeV以下均有分布, 并有明显的特征伽马峰, 如0.511和0.847 MeV. 束内伽马射线的时间结构明显分为两个部分: 在质子打靶后300 ns以内到达实验终端2的伽马射线主要是在散裂反应过程中产生的瞬发伽马, 通常被称为γ-flash, 约占全部束内伽马的91.3%; 之后约2.0 ms内有连续的伽马射线到达实验终端2, 这些伽马大多是中子核反应和散裂反应产物核衰变产生的, 占伽马总量的8.7%. 由于γ-flash和后续的束内伽马射线产生机制不同, 其能谱也会有一定的差异, 图4(a)给出了γ-flash的能谱结构(黑色实线)和连续伽马的能谱(红色虚线). 可以看到, 连续伽马能谱中除0.511 MeV伽马峰外, 还包含了H俘获中子后放出的2.23 MeV的伽马射线和靶材料(W, Ta, Fe等)俘获中子后放出的7.0—10.0 MeV的级联伽马射线. 同样, 对连续伽马也进行了不同时间区间的划分, 为了便于比较, 对每个时间窗内的计数进行了归一. 图4(b)给出不同时段的伽马能谱, 可以发现这些伽马能谱基本一致. 能谱一致极大地简化了实验测量方法, 因为可以忽略探测器对不同时刻伽马射线的探测效率变化. 图 3 束内伽马射线的模拟结果 (a) 能谱; (b) 时间结构 Figure3. The simulation results of the in-beam gamma rays: (a) The energy spectrum; (b) the time structure.
图 4 束内伽马射线的能谱 (a) γ-flash和连续伽马能谱; (b)连续伽马在不同时间区间的能谱 Figure4. The energy spectra of the in-beam gamma rays: (a) The energy spectra of γ-flash and the consecutive gamma rays; (b) the energy spectra of the consecutive gamma rays at different time.
图 7 (a) 中子伽马波形甄别结果; (b) EJ-420的飞行时间谱 Figure7. (a) The pulse shape discrimination result of neutron and gamma rays; (b) time-of-flight spectrum of the EJ-420.
 图 1 CSNS Back-n布局图
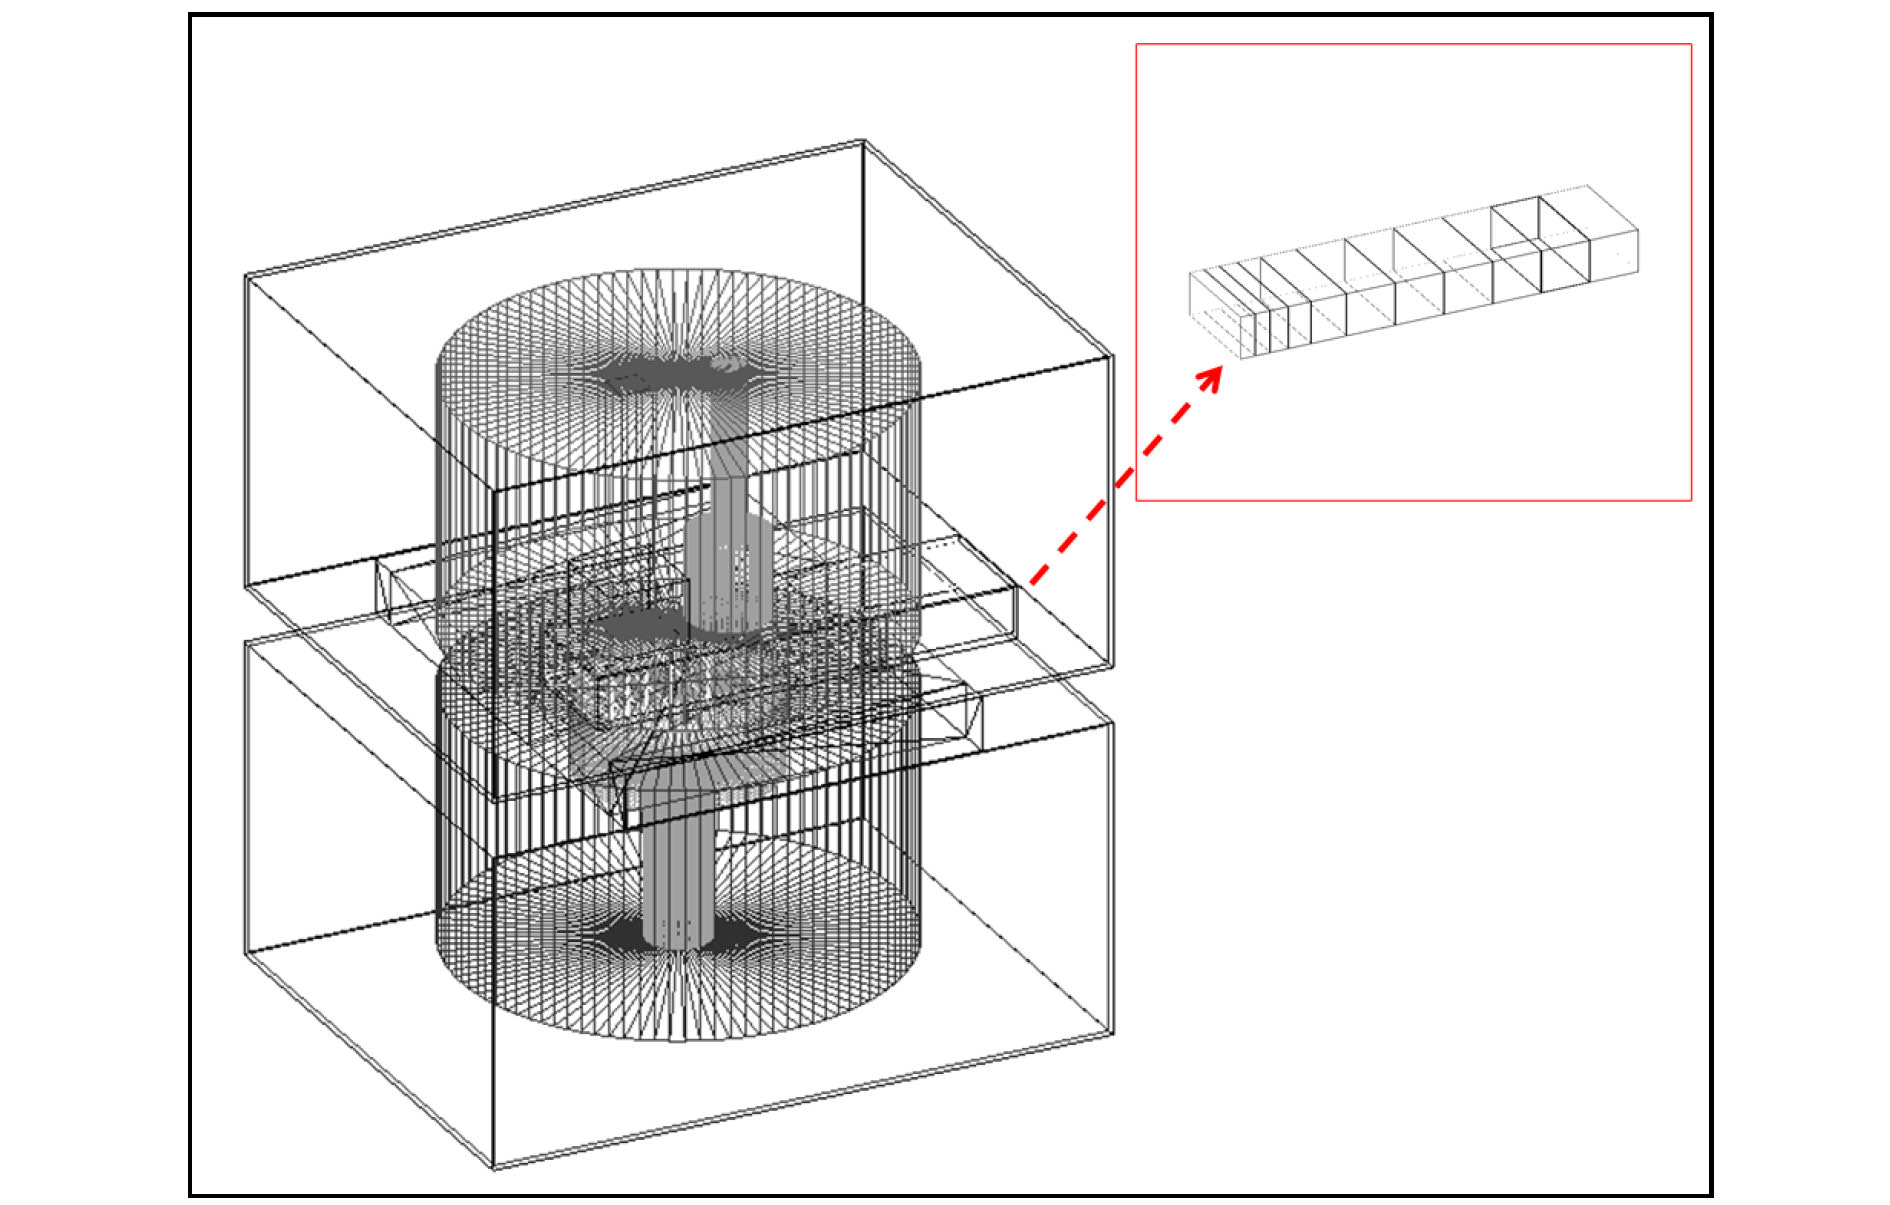 图 2 Geant 4构建的散裂靶几何模型
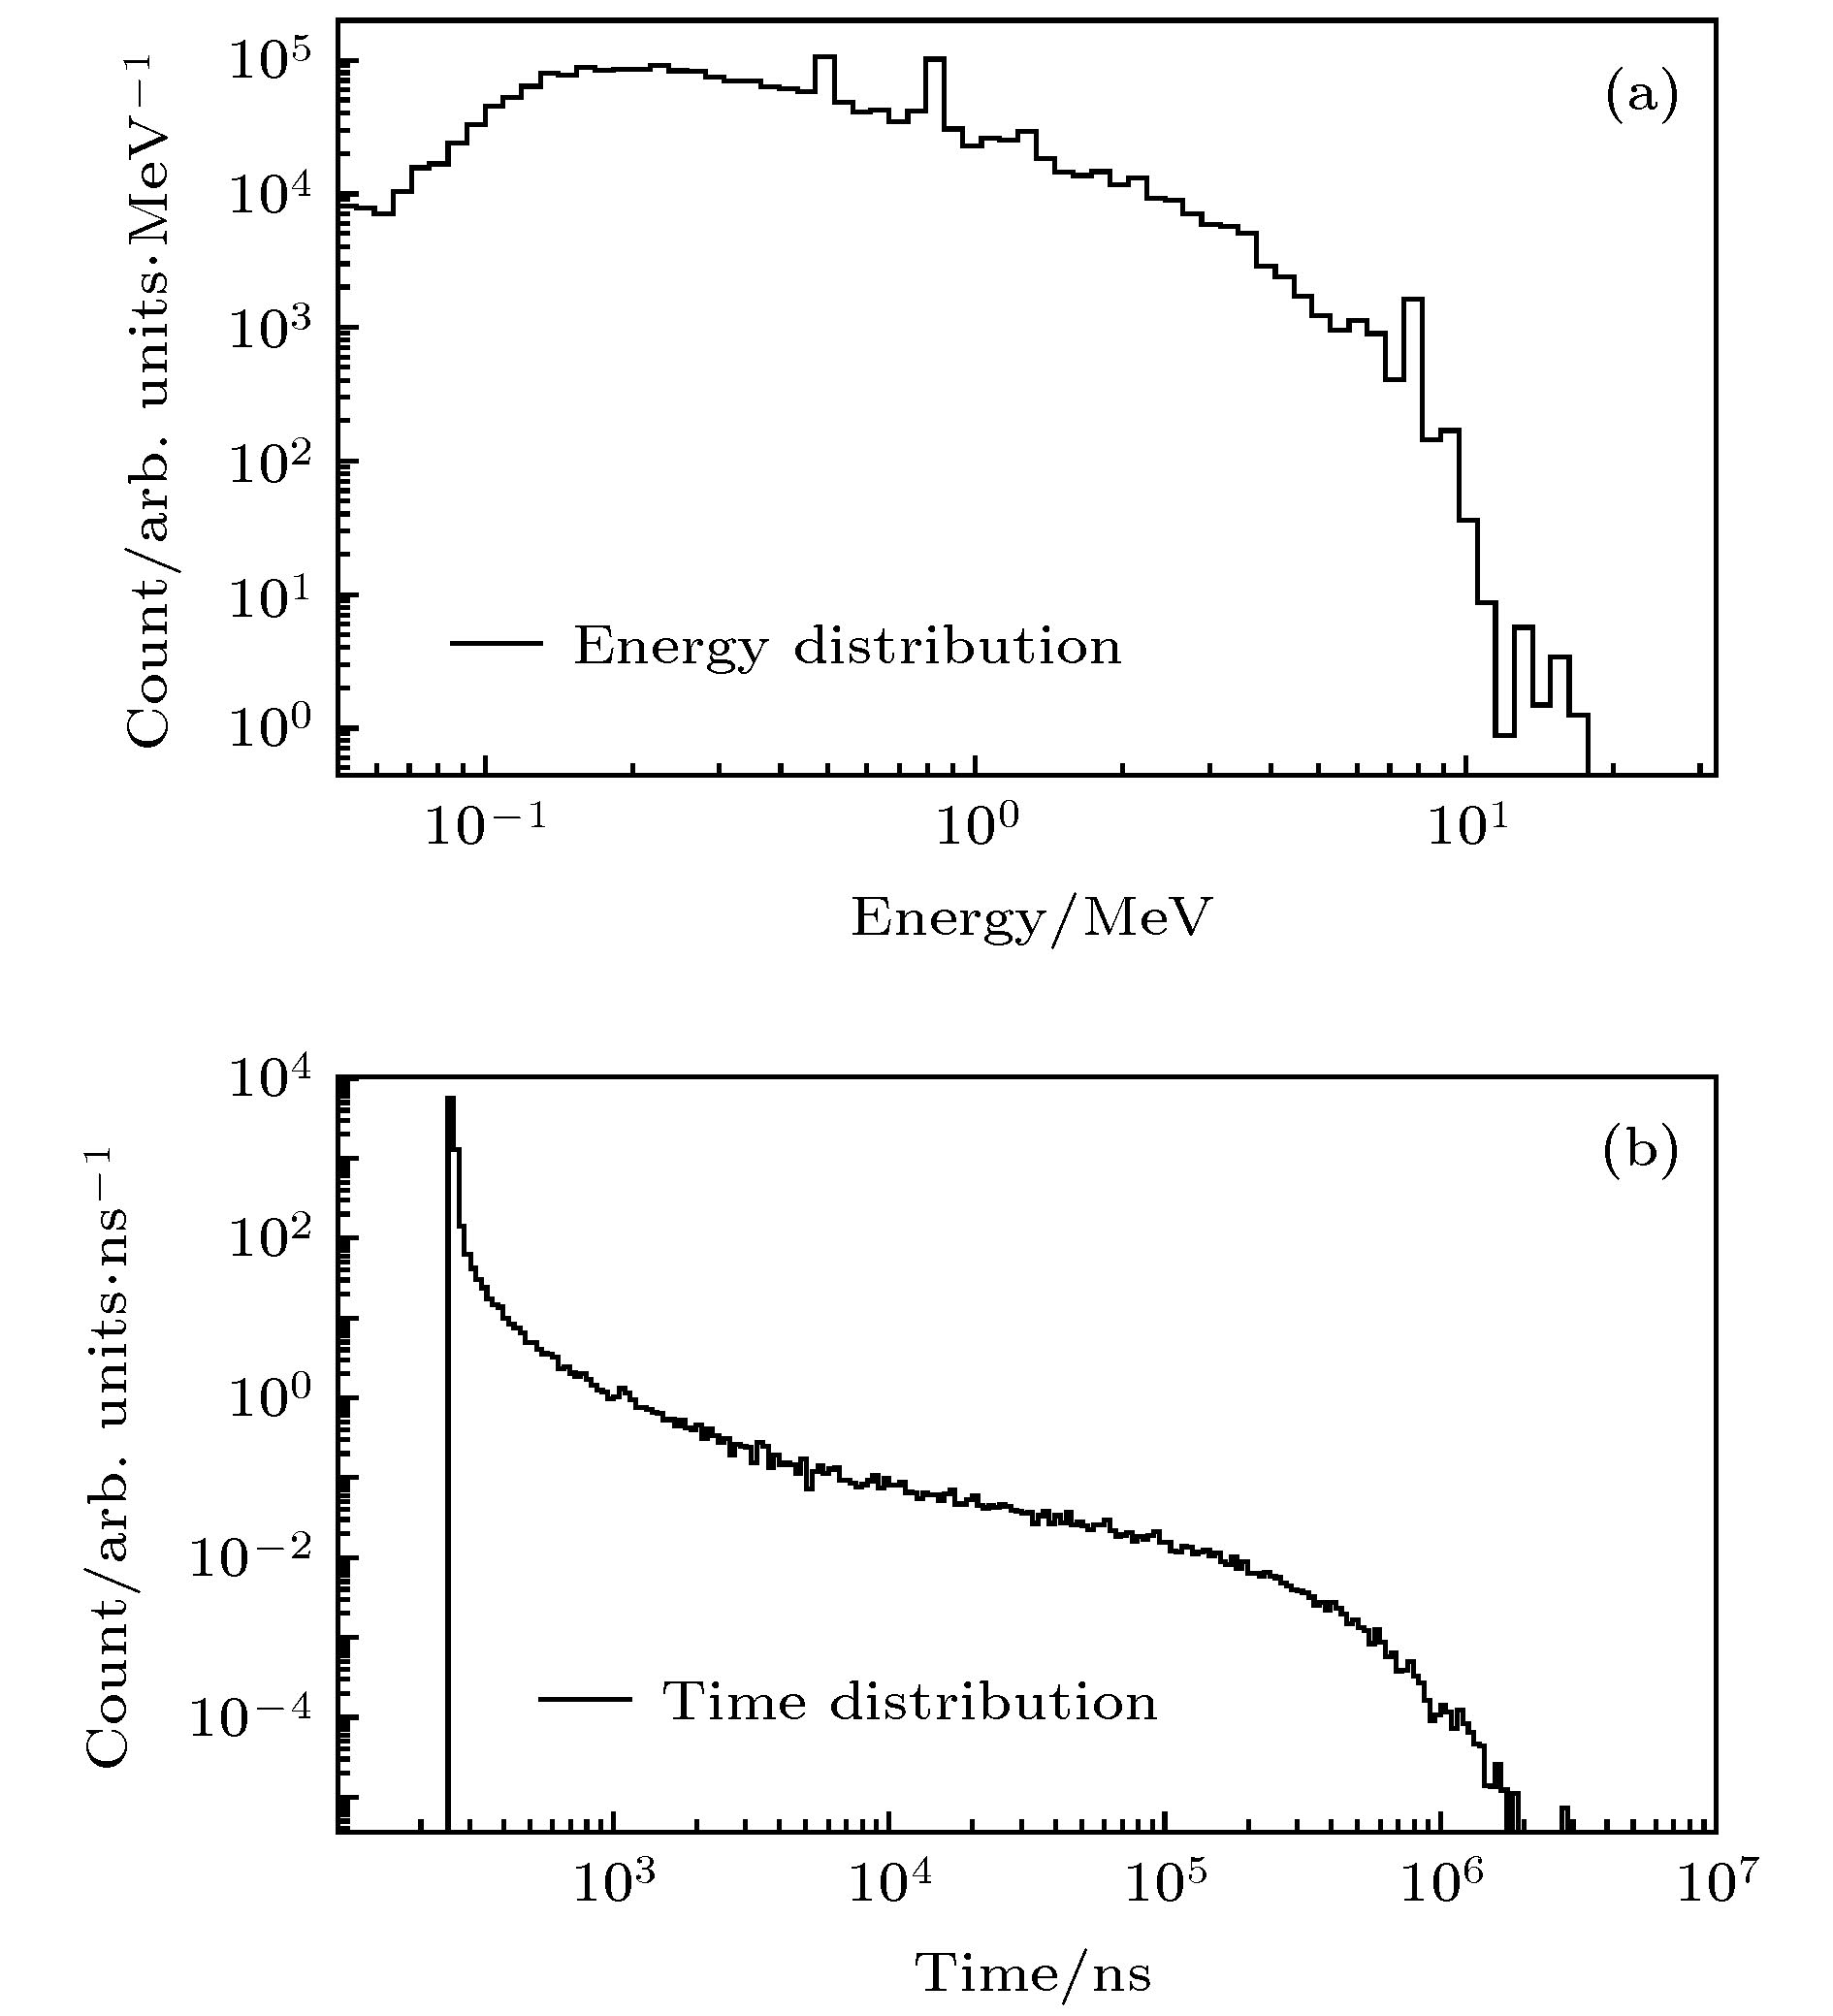 图 3 束内伽马射线的模拟结果 (a) 能谱; (b) 时间结构
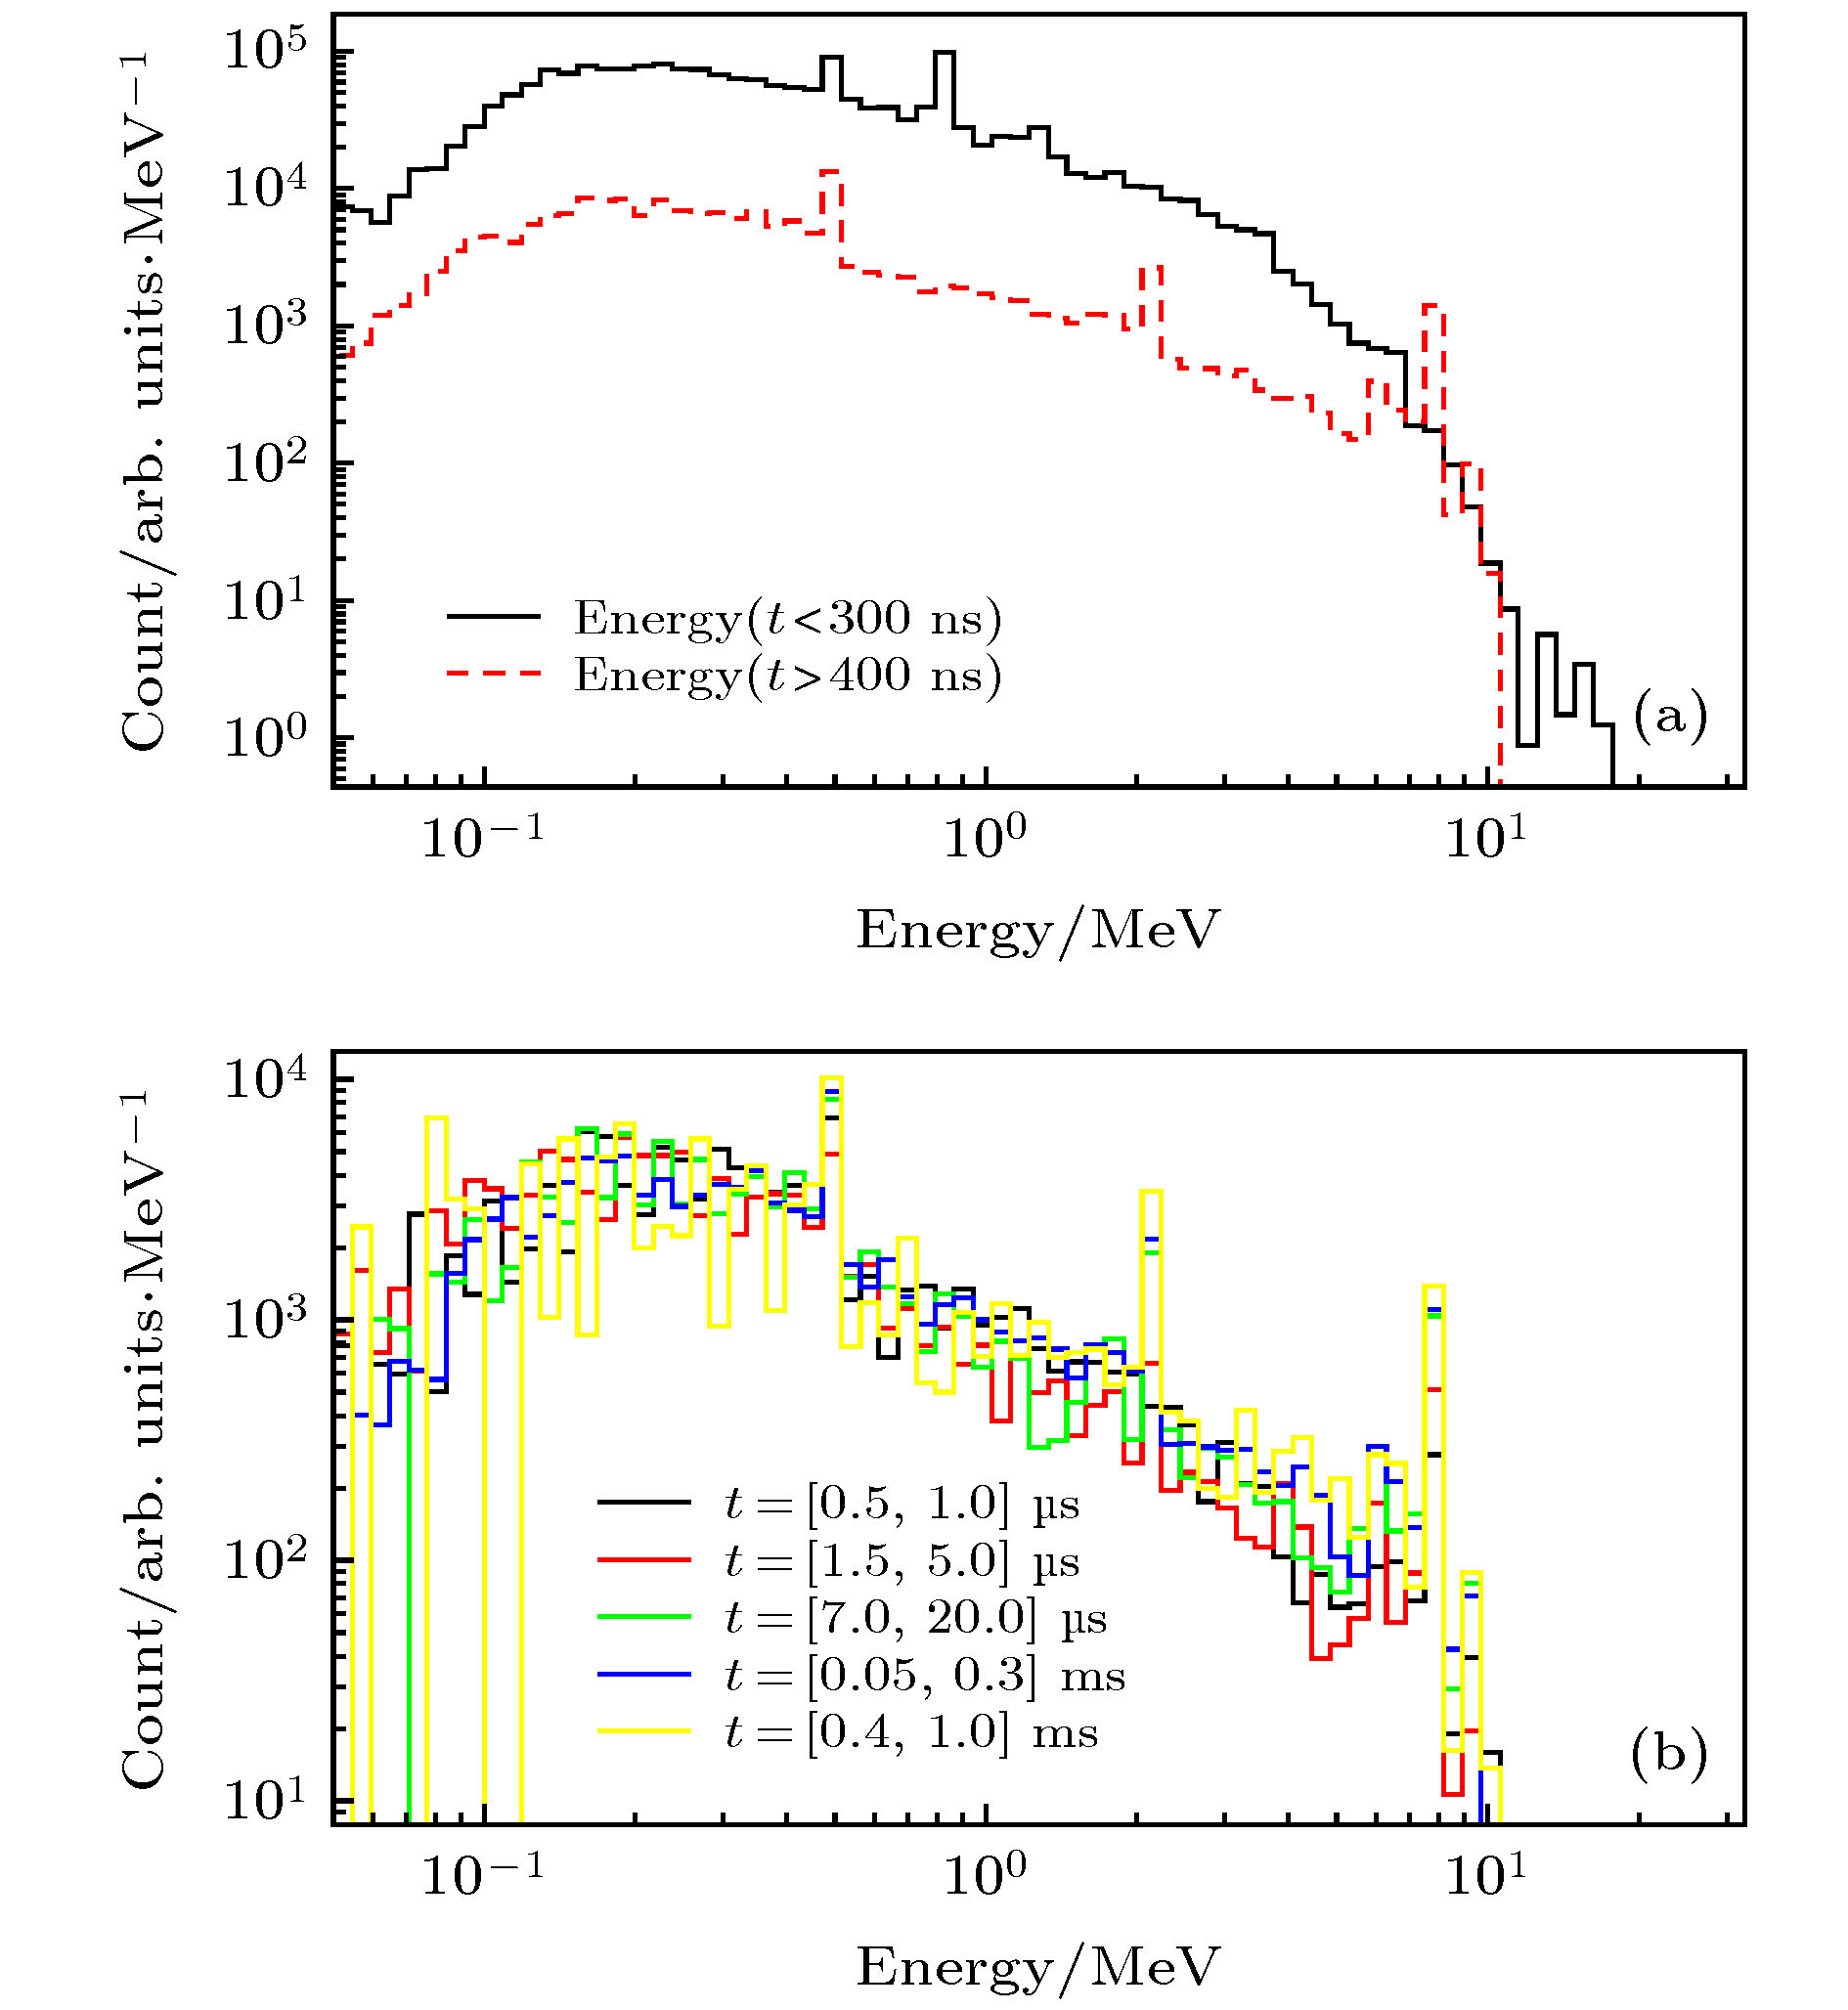 图 4 束内伽马射线的能谱 (a) γ-flash和连续伽马能谱; (b)连续伽马在不同时间区间的能谱
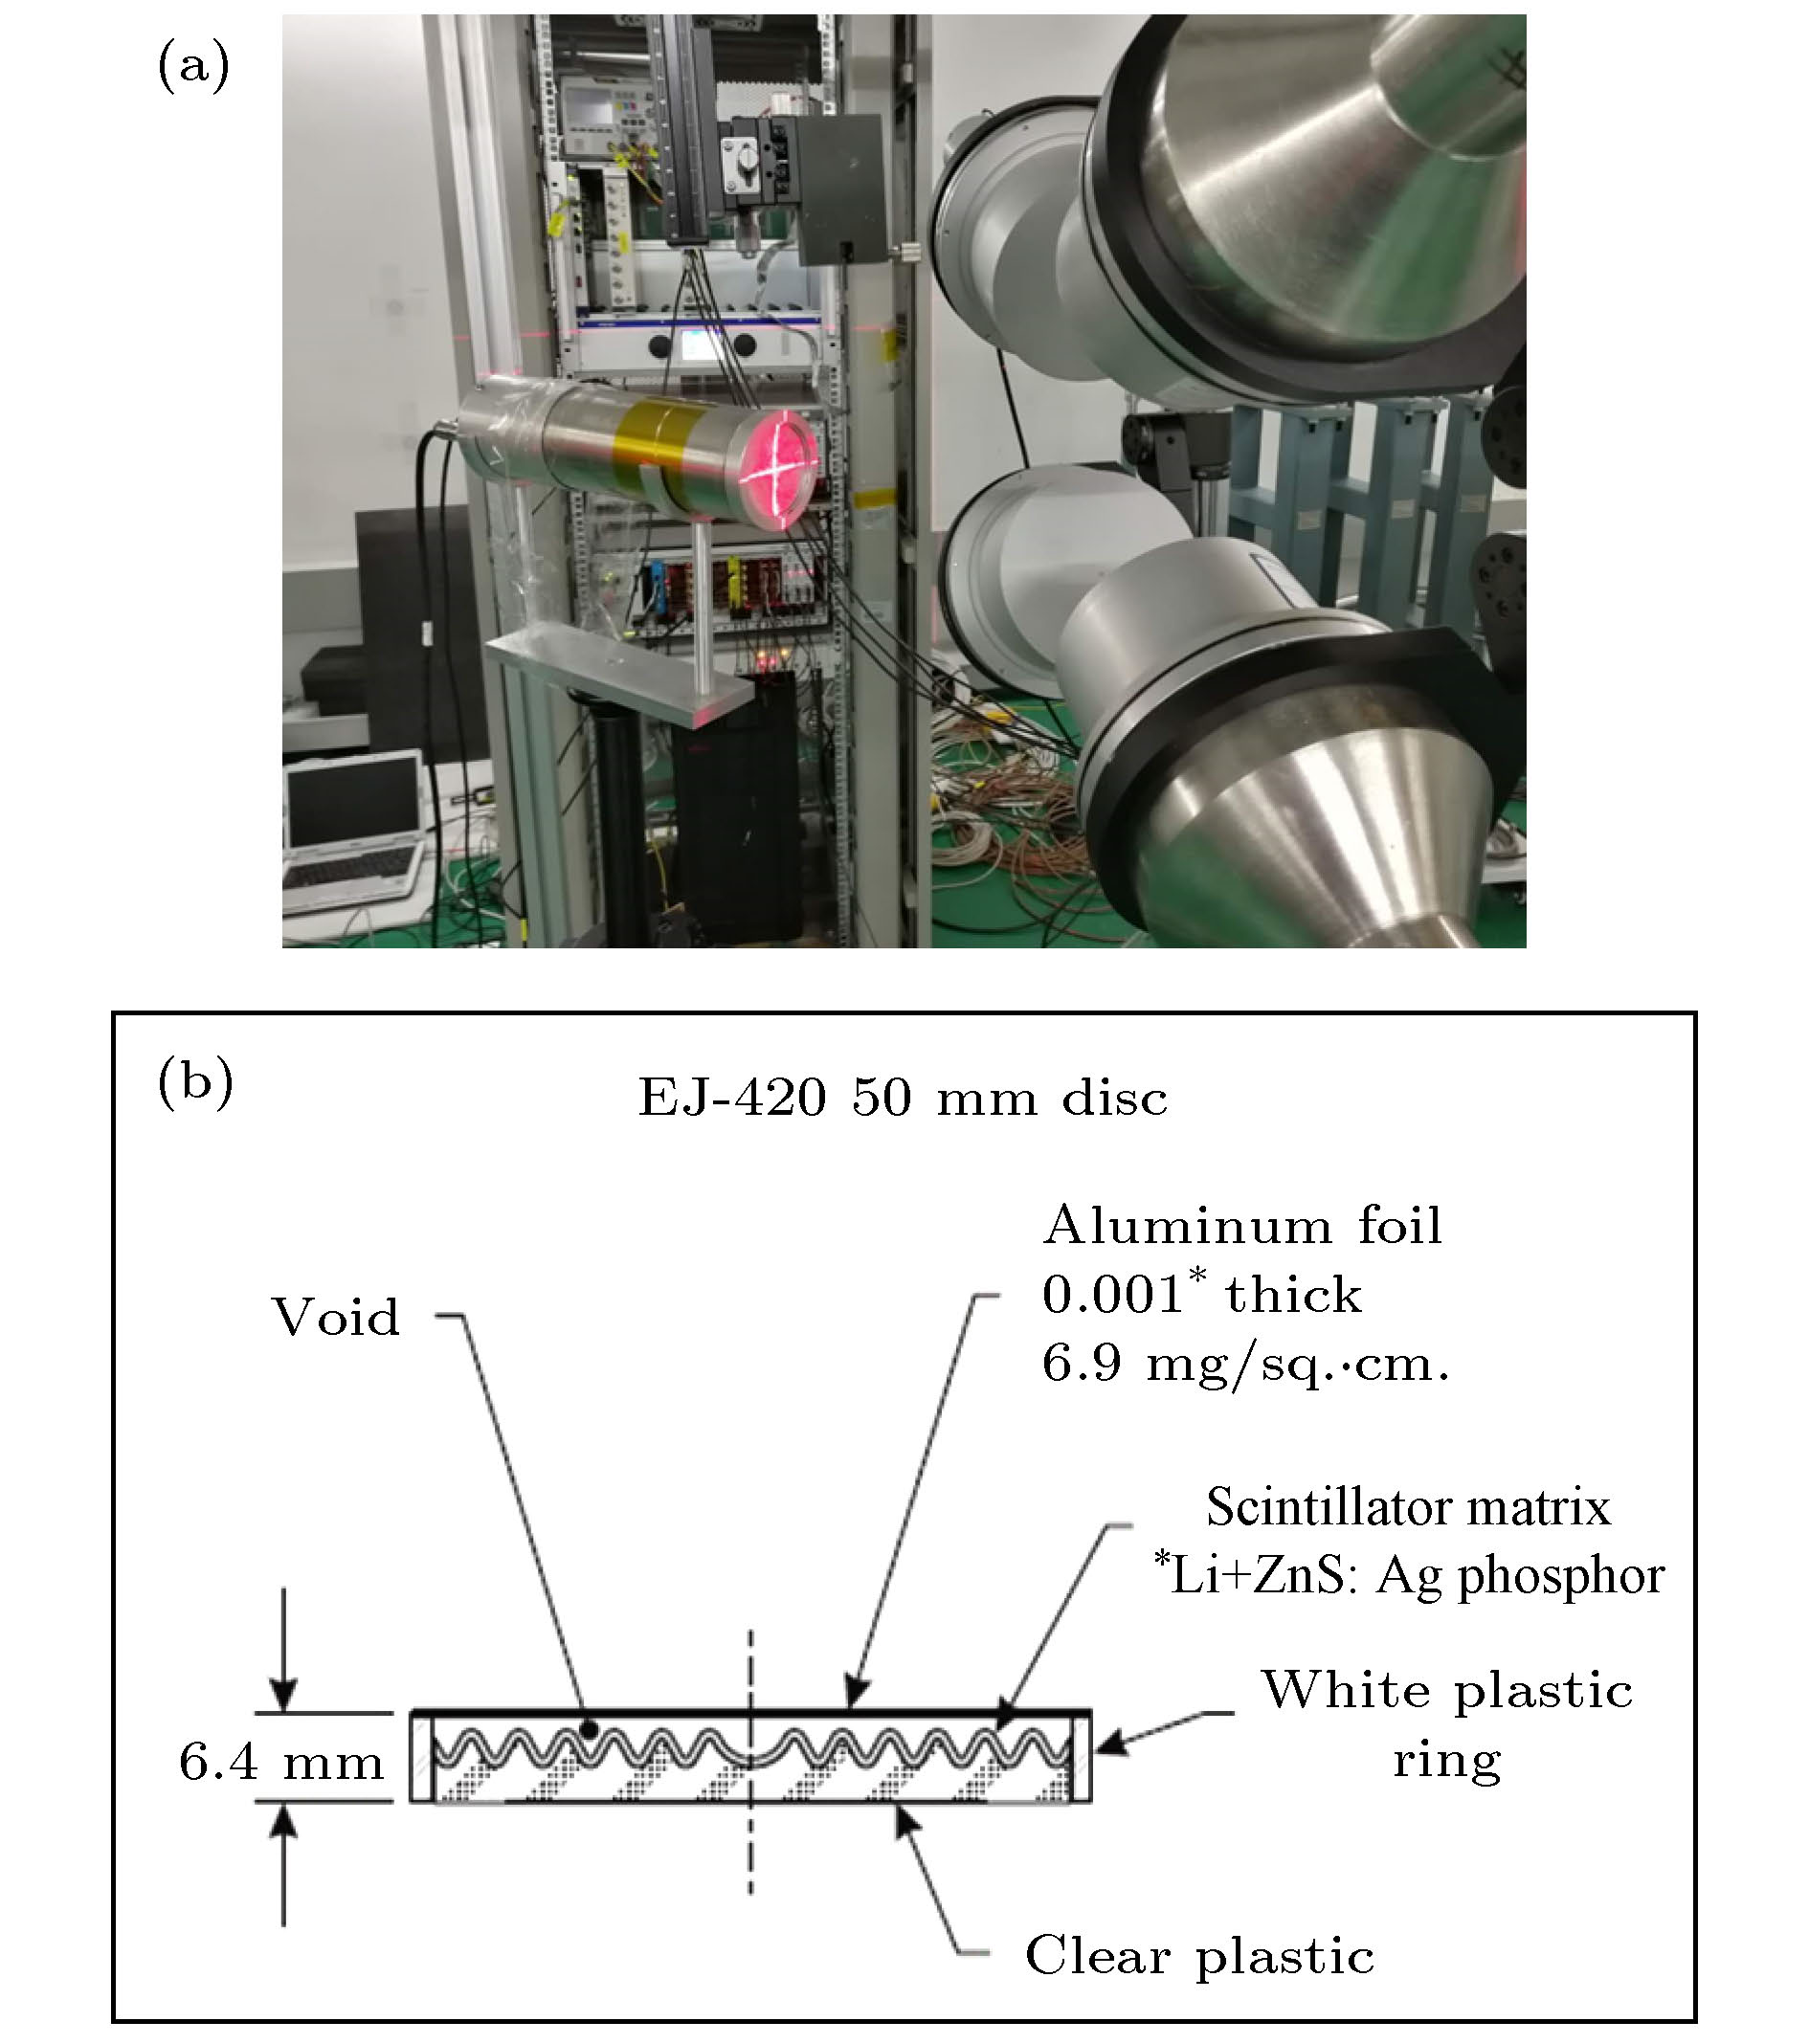 图 5 (a)直接测量实验布局; (b) EJ-420闪烁体结构
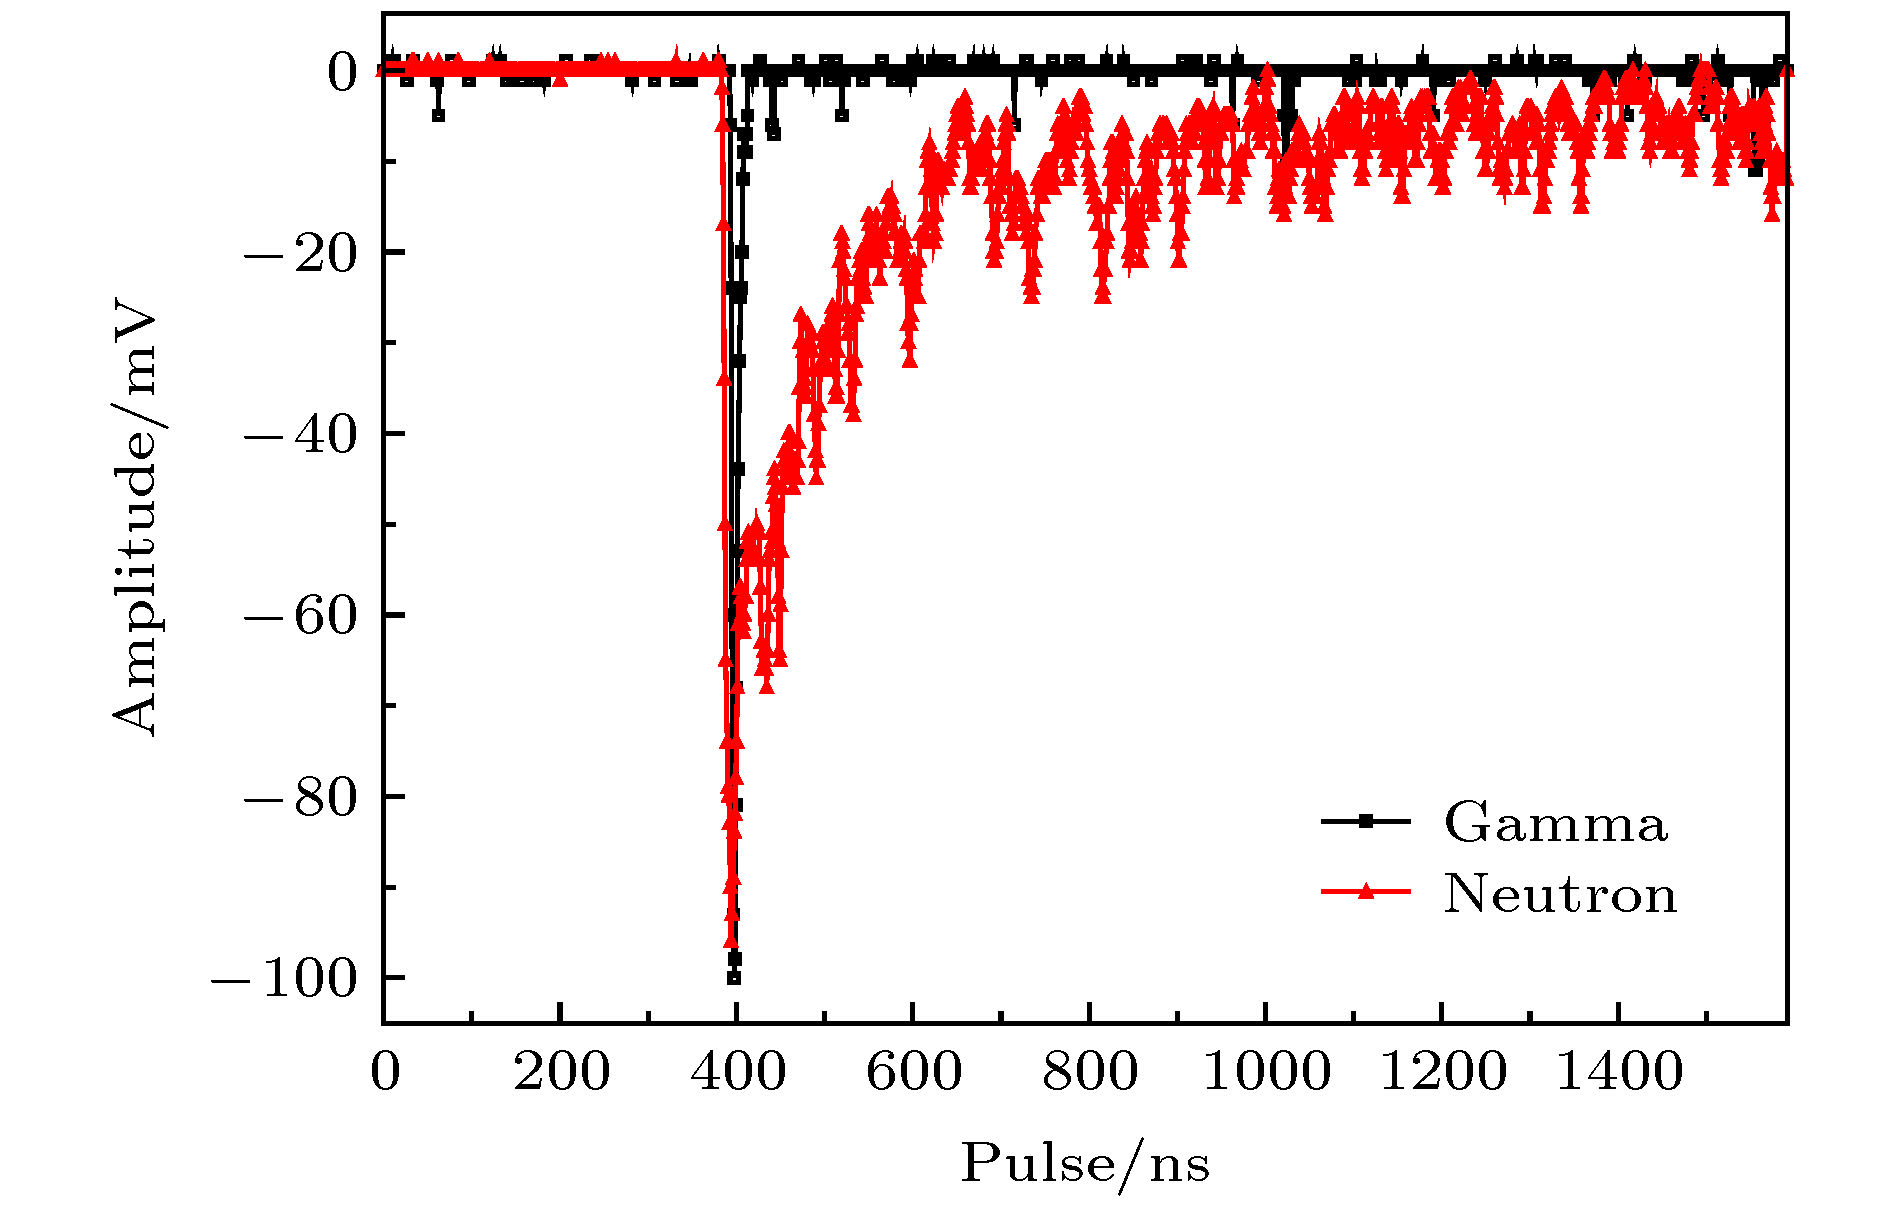 图 6 EJ-420的伽马波形和中子波形
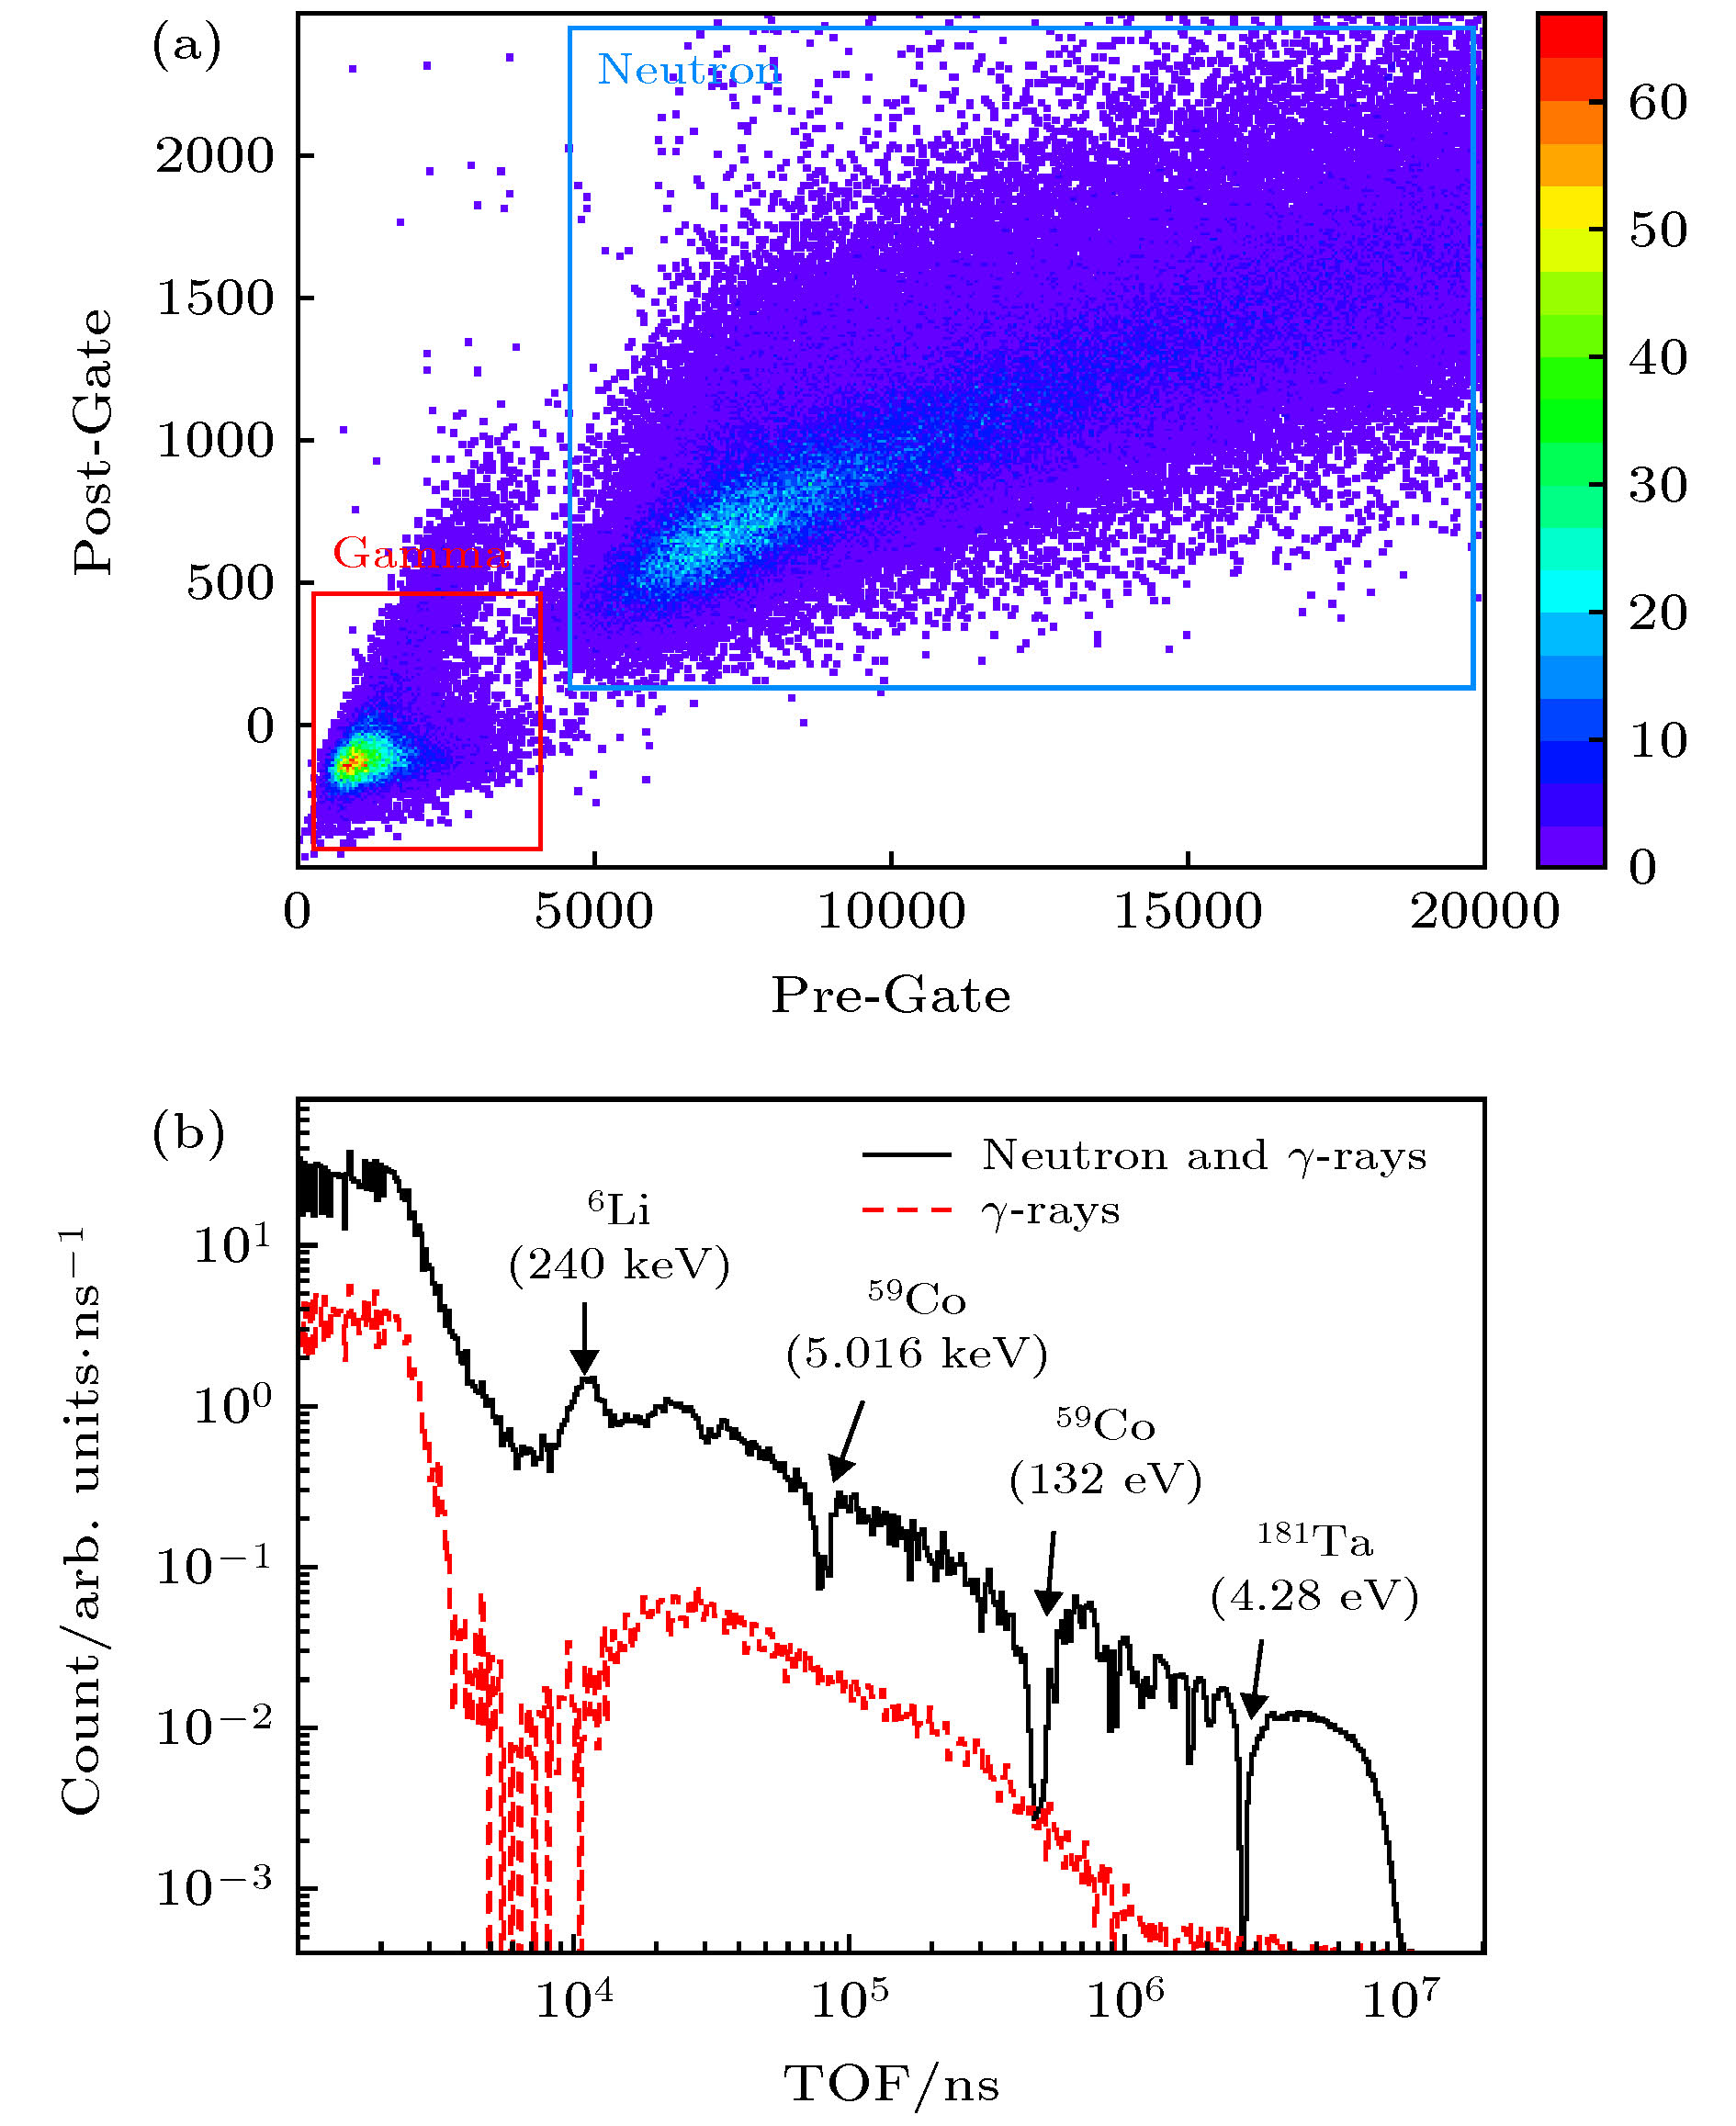 图 7 (a) 中子伽马波形甄别结果; (b) EJ-420的飞行时间谱
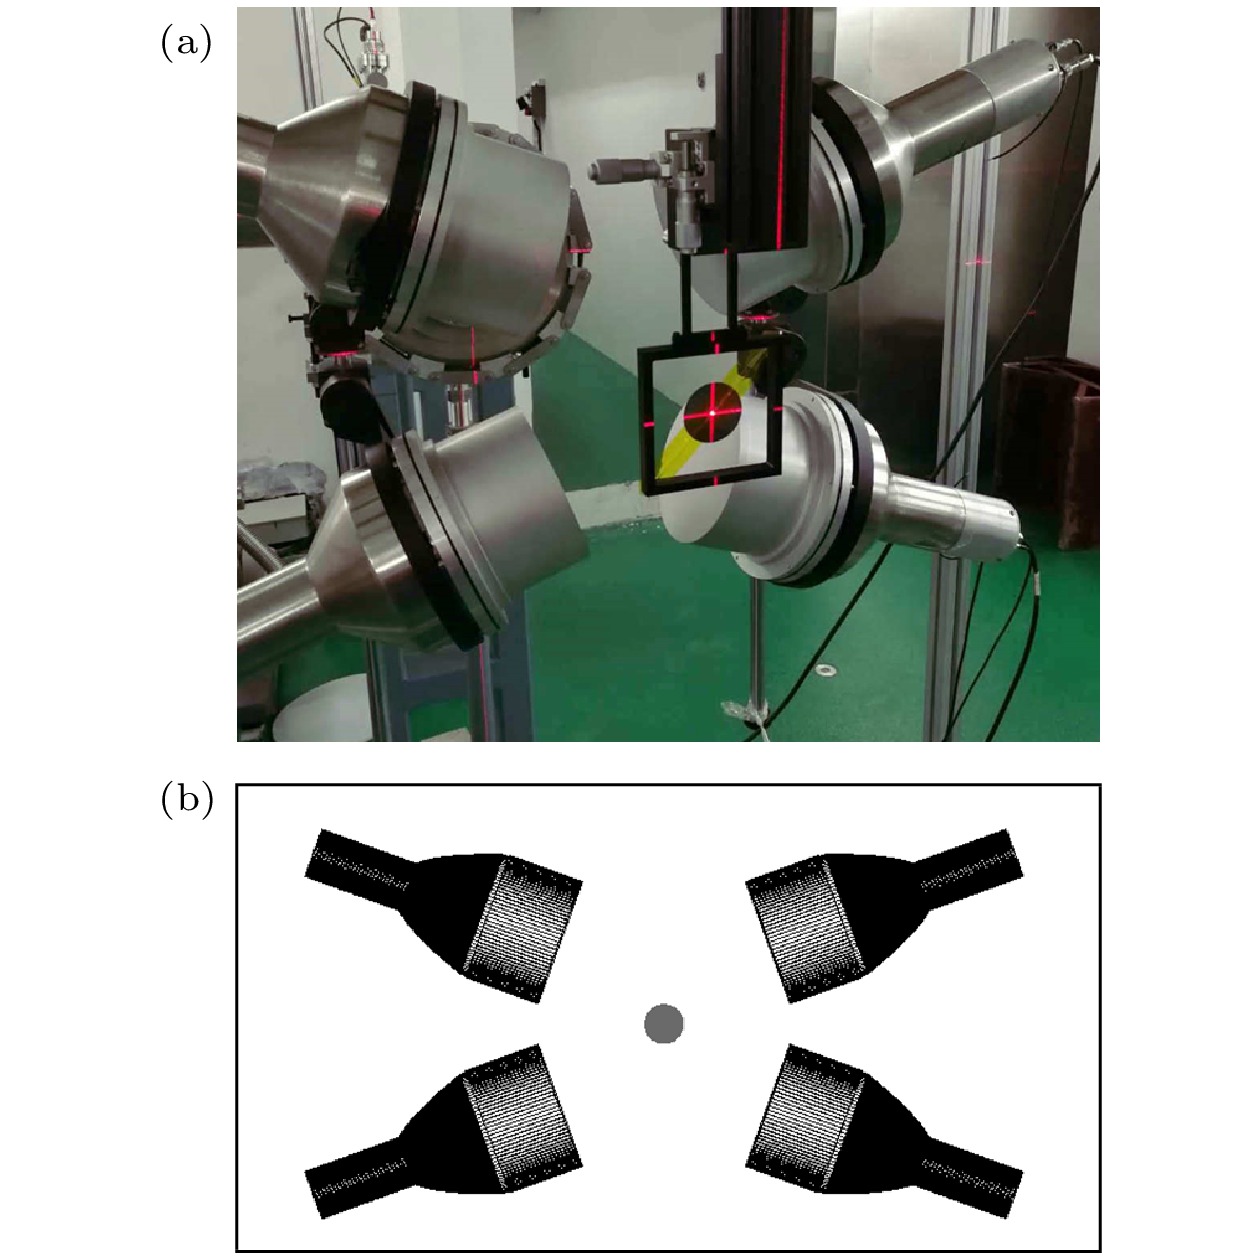 图 8 (a) 间接测量实验布局; (b) Geant 4中的几何模型
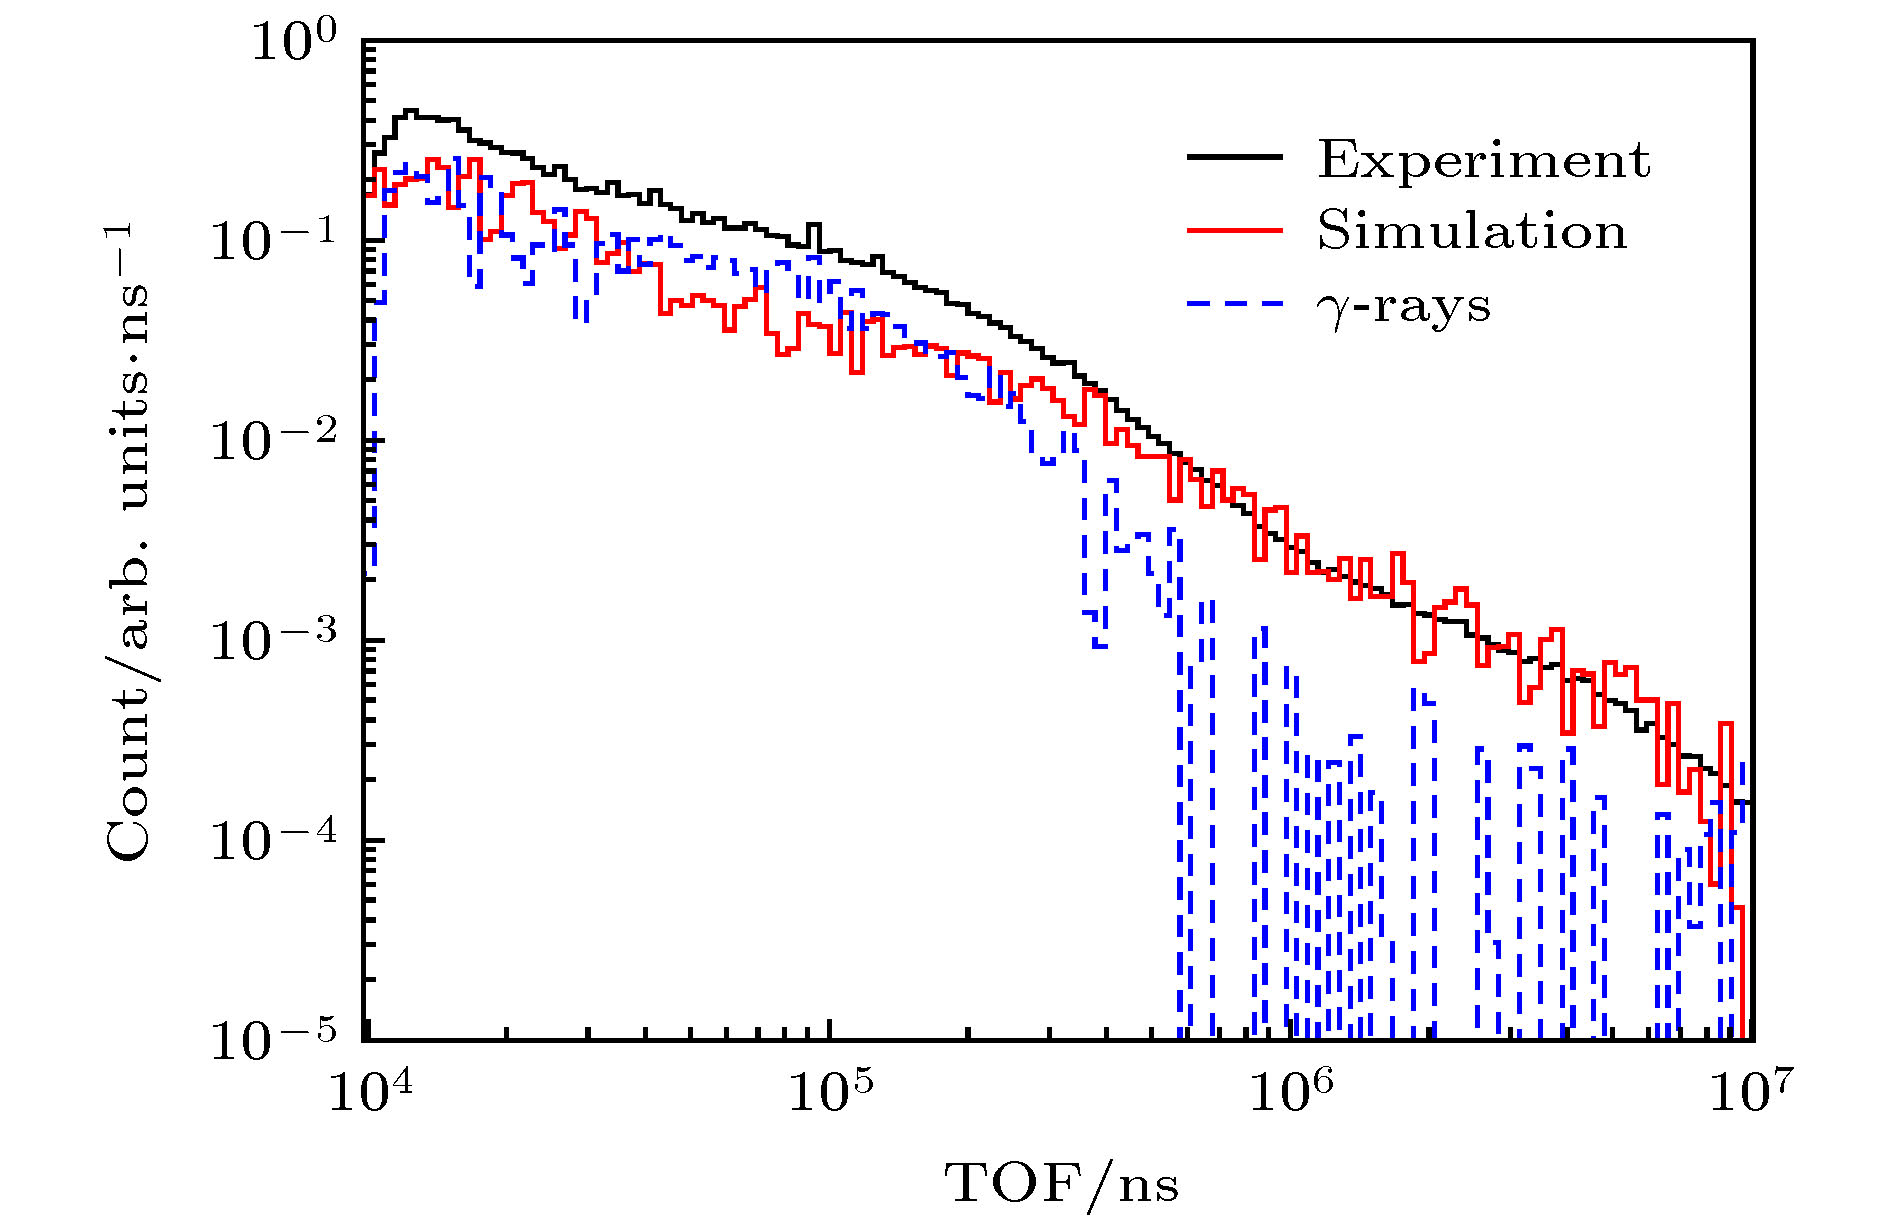 图 9 实验测量与Geant 4模拟得到的TOF谱和束内伽马TOF谱
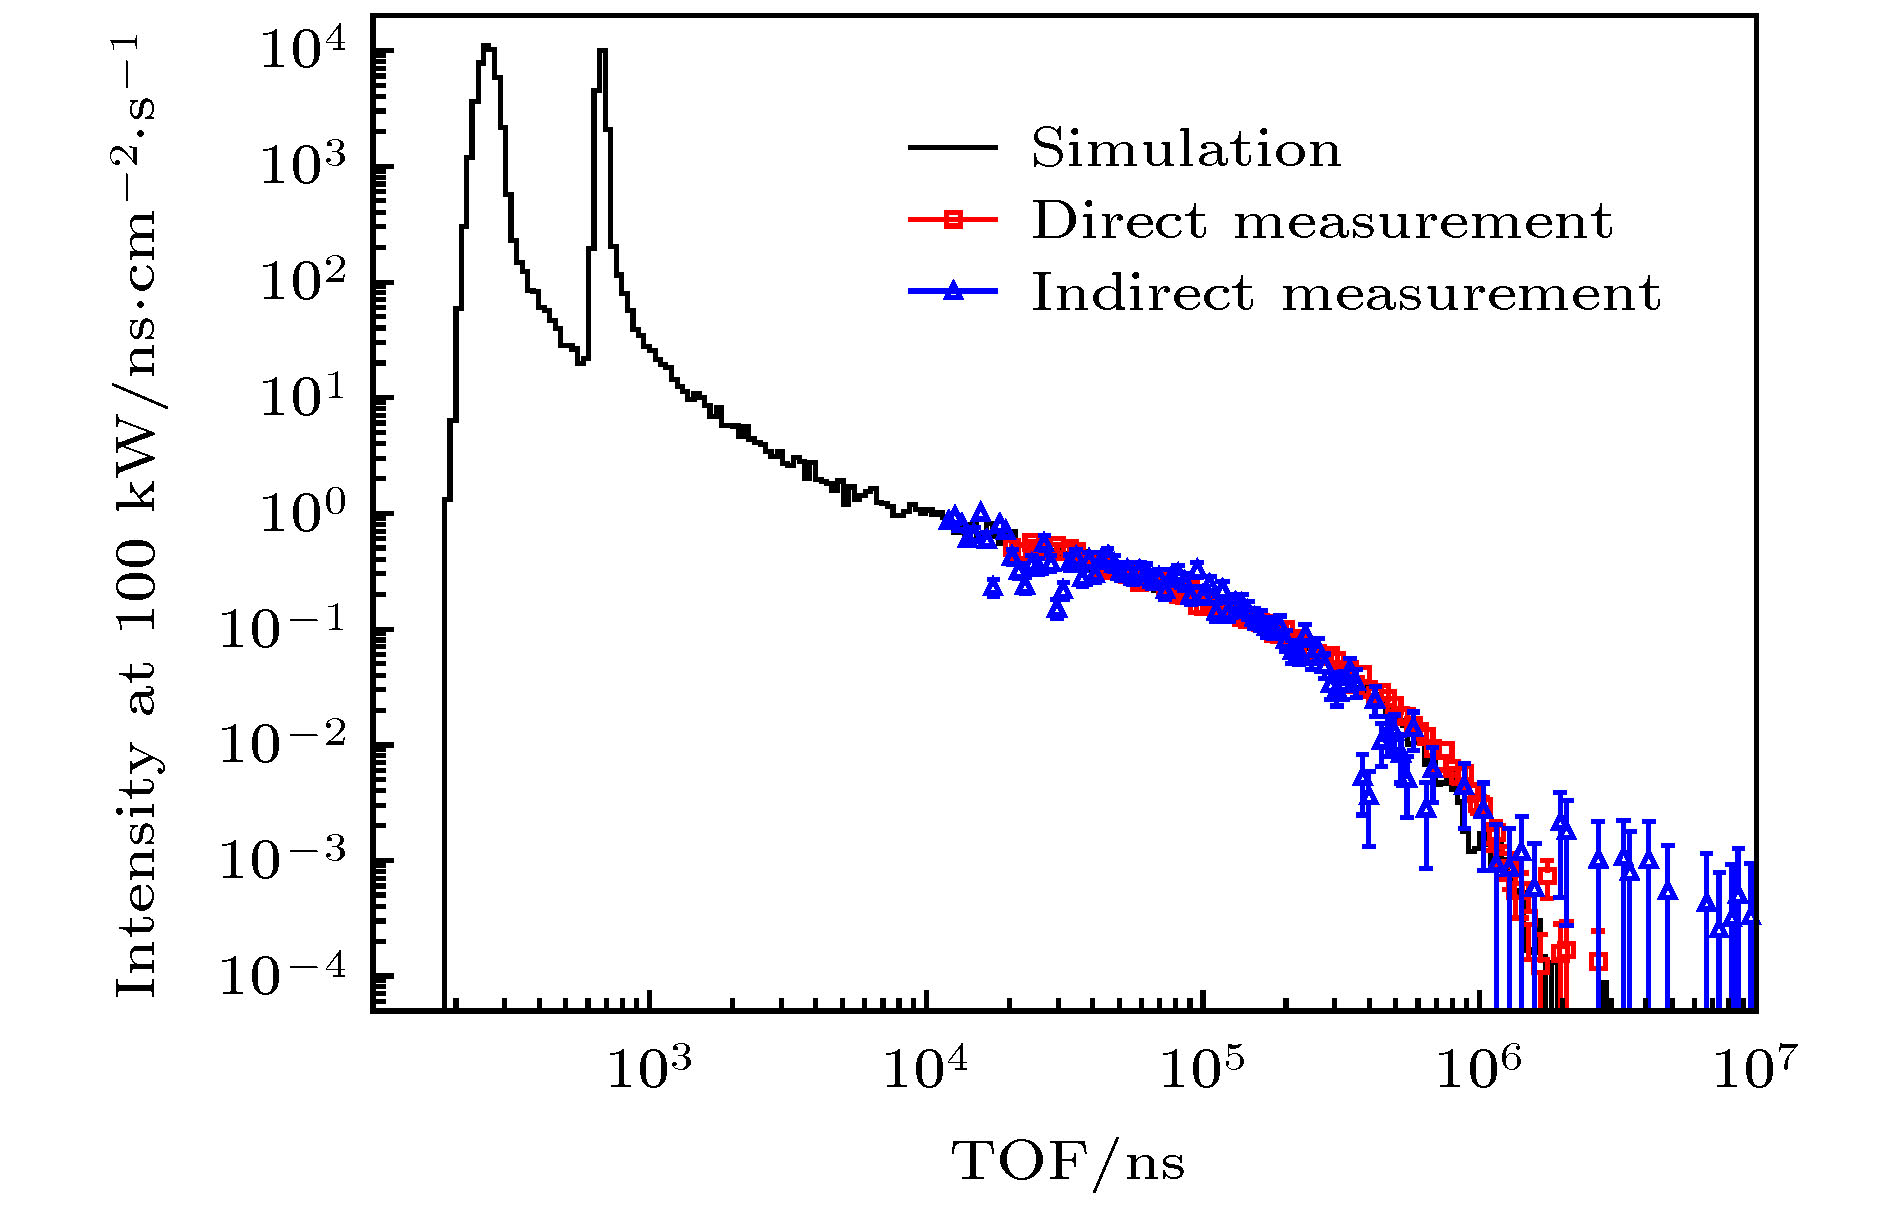 图 10 束内伽马射线的TOF谱对比