Abstract:Bilirubin is the main pigment in human bile, which is closely related to human health. Bilirubin combining with fluorescent protein represents a new type of fluorescent chromophore and has important applications in the field of biological imaging and biosensor. Due to the lack of efficient and accurate electronic structure methods, the electronic structure and excited-state properties of bilirubin molecule are not characterized quantitatively and accurately. Firstly, the vertical absorption energy, oscillator strength and vertical emission energy of the lowest singlet excited state of bilirubin molecule are calculated by combining the implicit solvent model and the linear response time-dependent density functional theory (TDDFT) method. Compared to the experimental data and high-level RI-ADC(2) calculation, the prediction performance of a series of density functional methods is systematically investigated. The results show that the optimally-tuned range separated density functional method has the best overall performance and the minimum absolute and relative errors. This is obviously due to the fact that the suitable proportion of exact exchange included in density functionals can produce neither delocalized nor localized electronic structures. Based on the produced wavefunction by the optimally-tuned method, the excited-state characteristics of the S1 state of bilirubin molecule indicate a hybrid local and charge transfer excitation, based on the quantitative characterization using hole-electron analysis and interfragment charge transfer method. This work can provide a theoretical basis for the study of excited-state dynamics and spectral properties of bilirubin molecules and the optimally tuned range-separated DFT method also provide a reliable and efficient theoretical tool to study the excited-state properties of other biomolecular systems in the future. Keywords:bilirubin/ density functional theory/ optimal tuning/ excited-state character
全文HTML
--> --> -->
1.引 言胆红素(bilirubin)是人胆汁中的主要色素, 在临床上是判定新生儿黄疸的重要依据, 也是肝功能的重要指标[1,2]. 胆红素在人体内浓度过高时有毒性, 会引起对大脑和神经系统不可逆的损害. 如图1所示, 胆红素分子是由两个对称的吡咯-吡咯酮单元通过亚甲基连接而成的, 它的构象多变, 主要依赖于分子内部和溶剂环境中形成的氢键, 以及两个羧基基团的电离状态[3,4]. 例如, 在非极性溶剂(如氯仿等)中, 分子内部形成六个分子内氢键, 将整个分子卷为“脊瓦状”(“ridge-tile”)的刚性结构[5,6]; 在极性溶剂(如二甲基亚砜等)中, 部分分子内氢键被打破, 能同时存在分子内氢键和与溶剂分子形成的分子间氢键[7]; 而在碱性溶液中, 由于分子处于完全电离状态而无分子内氢键形成, 呈现出充分伸展的构型[7,8]. 图 1 本文研究的胆红素分子结构 Figure1. The molecular structure of bilirubin studied in this work.
a Experimental values are taken from Refs. [12,53].
表2各种理论方法计算胆红素分子的垂直激发能(EVA)、振子强度(f )和垂直发射能(EVE)以及与实验值相比的绝对误差和相对误差 Table2.Vertical absorption energies (EVA), oscillator strength (f ) and vertical emission energies (EVE) of bilirubin and the absolute errors and relative errors compared to the available experimental data.
此外, 还考察了各种密度泛函方法预测胆红素分子的最低单重激发态振子强度(f (S1))的表现. 振子强度是衡量两个电子态之间跃迁强度的无量纲的量, 通常体系的基态与激发态之间的振子强度越大, 吸收(发射)光谱中相应的吸收(发射)峰也越强. 表2列出了各种密度泛函方法计算的胆红素分子的f(S1)值, 同时以RI-ADC(2)方法计算的振子强度值作为参考. 可以看出, 与RI-ADC(2)的计算值相比, PBE和B3LYP泛函产生非常小的f值, 错误地暗示了胆红素分子的S1态具有明显的电荷转移特征. 而除了PBE和B3LYP泛函外, 其他类型泛函均可以合理描述胆红素分子的最低单重激发态的振子强度大小. 由上述误差统计分析发现, 各种密度泛函方法的预测表现与泛函中包含的准确交换项比例(eX%)密切相关. 通常表现为低/高eX%的密度泛函方法倾向于描述具有更离域化/局域化特征的π共轭电子结构, 从而相应低估/高估激发能. 如图2所示, 在电子间距离r12 = 2.75 Bohr(约1.455 ?)处, 即π共轭体系中碳-碳单键和双键的平均距离处, LC-ωPBE*(ω = 0.178 Bohr–1)泛函包含大约52%的eX%, ωB97XD*(ω = 0.137 Bohr–1)包含大约53%的eX%; 而未经调控的LC-ωPBE, 其ω默认为0.4 Bohr–1, 包含近88%的eX%, 同样未经调控的ωB97XD泛函, ω默认为0.2 Bohr–1, 包含66%的eX%. 其他区间分离泛函如CAM-B3LYP泛函包含56%的eX%, M11泛函包含了82%的eX%. 而MN15、M062X和M06HF泛函在任意r12距离上都有44%、54%和100%的eX%; PBE和B3LYP泛函分别包含0和20%的eX%. 有趣的是, 较大的误差均来自于泛函中包含过低的eX%(如PBE和B3LYP)或过高的eX%(如未调控LC-ωPBE、M06HF和M11). 可以看出最优化调控泛函LC-ωPBE*、ωB97XD*、MN15、M062X和CAM-B3LYP等泛函的良好预测表现可以归因于它们所包含的适宜eX%, 均在44%—56%范围内, 这样一个合理的eX%有利于密度泛函方法在描述电子结构时既不过于离域化也不过于局域化. 特别是在对区间分离密度泛函中的区间分离参数进行最优化调控后, 可以使其在离域化作用和局域化作用间达到平衡, 从而可以精确描述胆红素分子的激发态电子结构. 为了证明该最优化调控方法的普适性, 我们从文献中选取了藻青素(phycocyanobilin)和四环霉素(tetracycline)生物分子(见补充文件)进行验证计算, 发现最优化调控方法LC-ωPBE*整体上仍能保持非常高的预测精度, 且不随生物分子体系的变化而明显变化. 有趣的是, 对于藻青素和四环霉素分子, 它们的最低单重激发态f (S1)较大, 属于明显LE激发, 因此常用的B3LYP(甚至PBE)泛函表现也还不错, 但是在胆红素分子的预测上这两种泛函是出现定性错误的, 这一点更加突显出最优化调控泛函方法的普适性. 图 2 本文中各种密度泛函中所含准确交换项比例(eX%)与电子间距离(r12)关系示意图 Figure2. Percentages of exact-exchange (eX%) included in various density functionals as a function of intereletronic distance (r12, Bohr).
由上述密度泛函的基准测试发现, 最优化调控区间分离密度泛函LC-ωPBE*在定量描述胆红素分子激发态的电子跃迁能和振子强度方面都表现最优. 因此, 为进一步描述胆红素分子最低单重激发态(S1)的特征, 我们在LC-ωPBE*泛函计算的波函数基础上采用空穴-电子分析方法进行分析. 该方法将电子激发过程描述为“空穴→电子”, 可以通过空穴电子的定义衍生出各种激发态特征指数, 还可以以图形化的方式直观地考察电子的去留, 进而考察其激发态特征. 通常根据空穴和电子的相对位置, 可以将激发态特征分为: 局域激发(local excitation, LE)、电荷转移激发(charge transfer, CT)和杂化局域-电荷转移激发(hybrid local and charge transfer, HLCT). 首先, 基于Multiwfn波函数分析程序定量考察了胆红素分子S1态的电子转移距离(D指数)和空穴与电子的分离程度(Sr指数)等指标. 其中, D指数衡量的是空穴和电子质心之间的距离, 数值越大表示空穴和电子分布范围差距越大(倾向于CT特征), 数值越小表示分布范围越接近(倾向于LE特征). Sr指数衡量空穴和电子的重叠程度, 数值越大重叠程度越高(LE), 数值越小说明空穴和电子的分离越显著(CT), 取值范围是0 < Sr < 1. 计算得到D指数为1.18 ?, 表明空穴与电子主要分布范围很接近; Sr值为0.75 a.u., 表明空穴与电子重叠程度较高. 从以上激发态指数可知, 胆红素分子的最低单重激发态应该属于局域激发为主的类型. 另外, 如图3所示, 为胆红素分子最低单重激发态的空穴-电子分布, 其中蓝色表示空穴, 绿色表示电子, 空穴和电子几乎对称分布在两个吡咯-吡咯酮片段上, 并且空穴和电子在空间上既有重叠也有分离, 暗示着吡咯-吡咯酮片段内存在电荷转移. 图 3 胆红素分子最低单重激发态的空穴-电子分布示意图 Figure3. Diagram of hole-electron distribution for the lowest singlet excited state (isovalue=0.001).
表3胆红素分子最低单重激发态的各片段电子净变化量以及片段间电子转移量 Table3.Net change of each fragment and electron transfer between fragments for lowest singlet excited state of bilirubin molecule.
图 4 胆红素分子的三个片段划分及各片段对最低单重激发态的空穴和电子的贡献 Figure4. The divided three fragments of bilirubin molecule and contribution of each fragment to the hole and electron for the lowest singlet excited state.
图 5 胆红素分子最低单重激发态的各片段电子转移矩阵热图 Figure5. Diagram of electron transfer matrix for each fragment of lowest singlet excited state of bilirubin molecule.
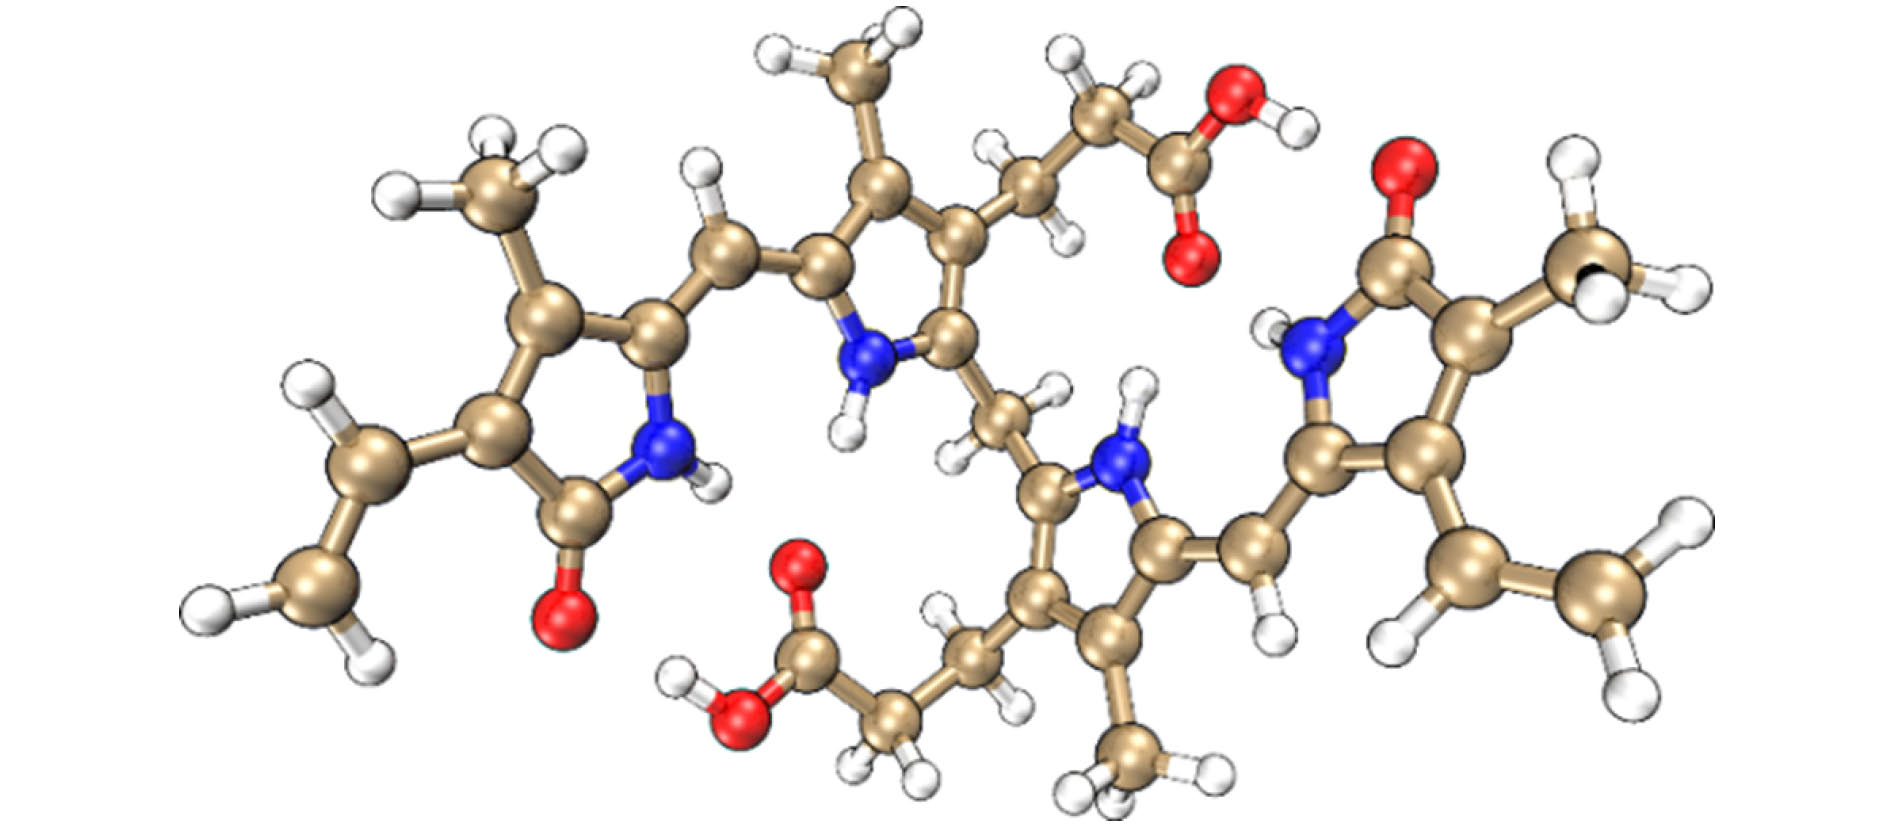 图 1 本文研究的胆红素分子结构

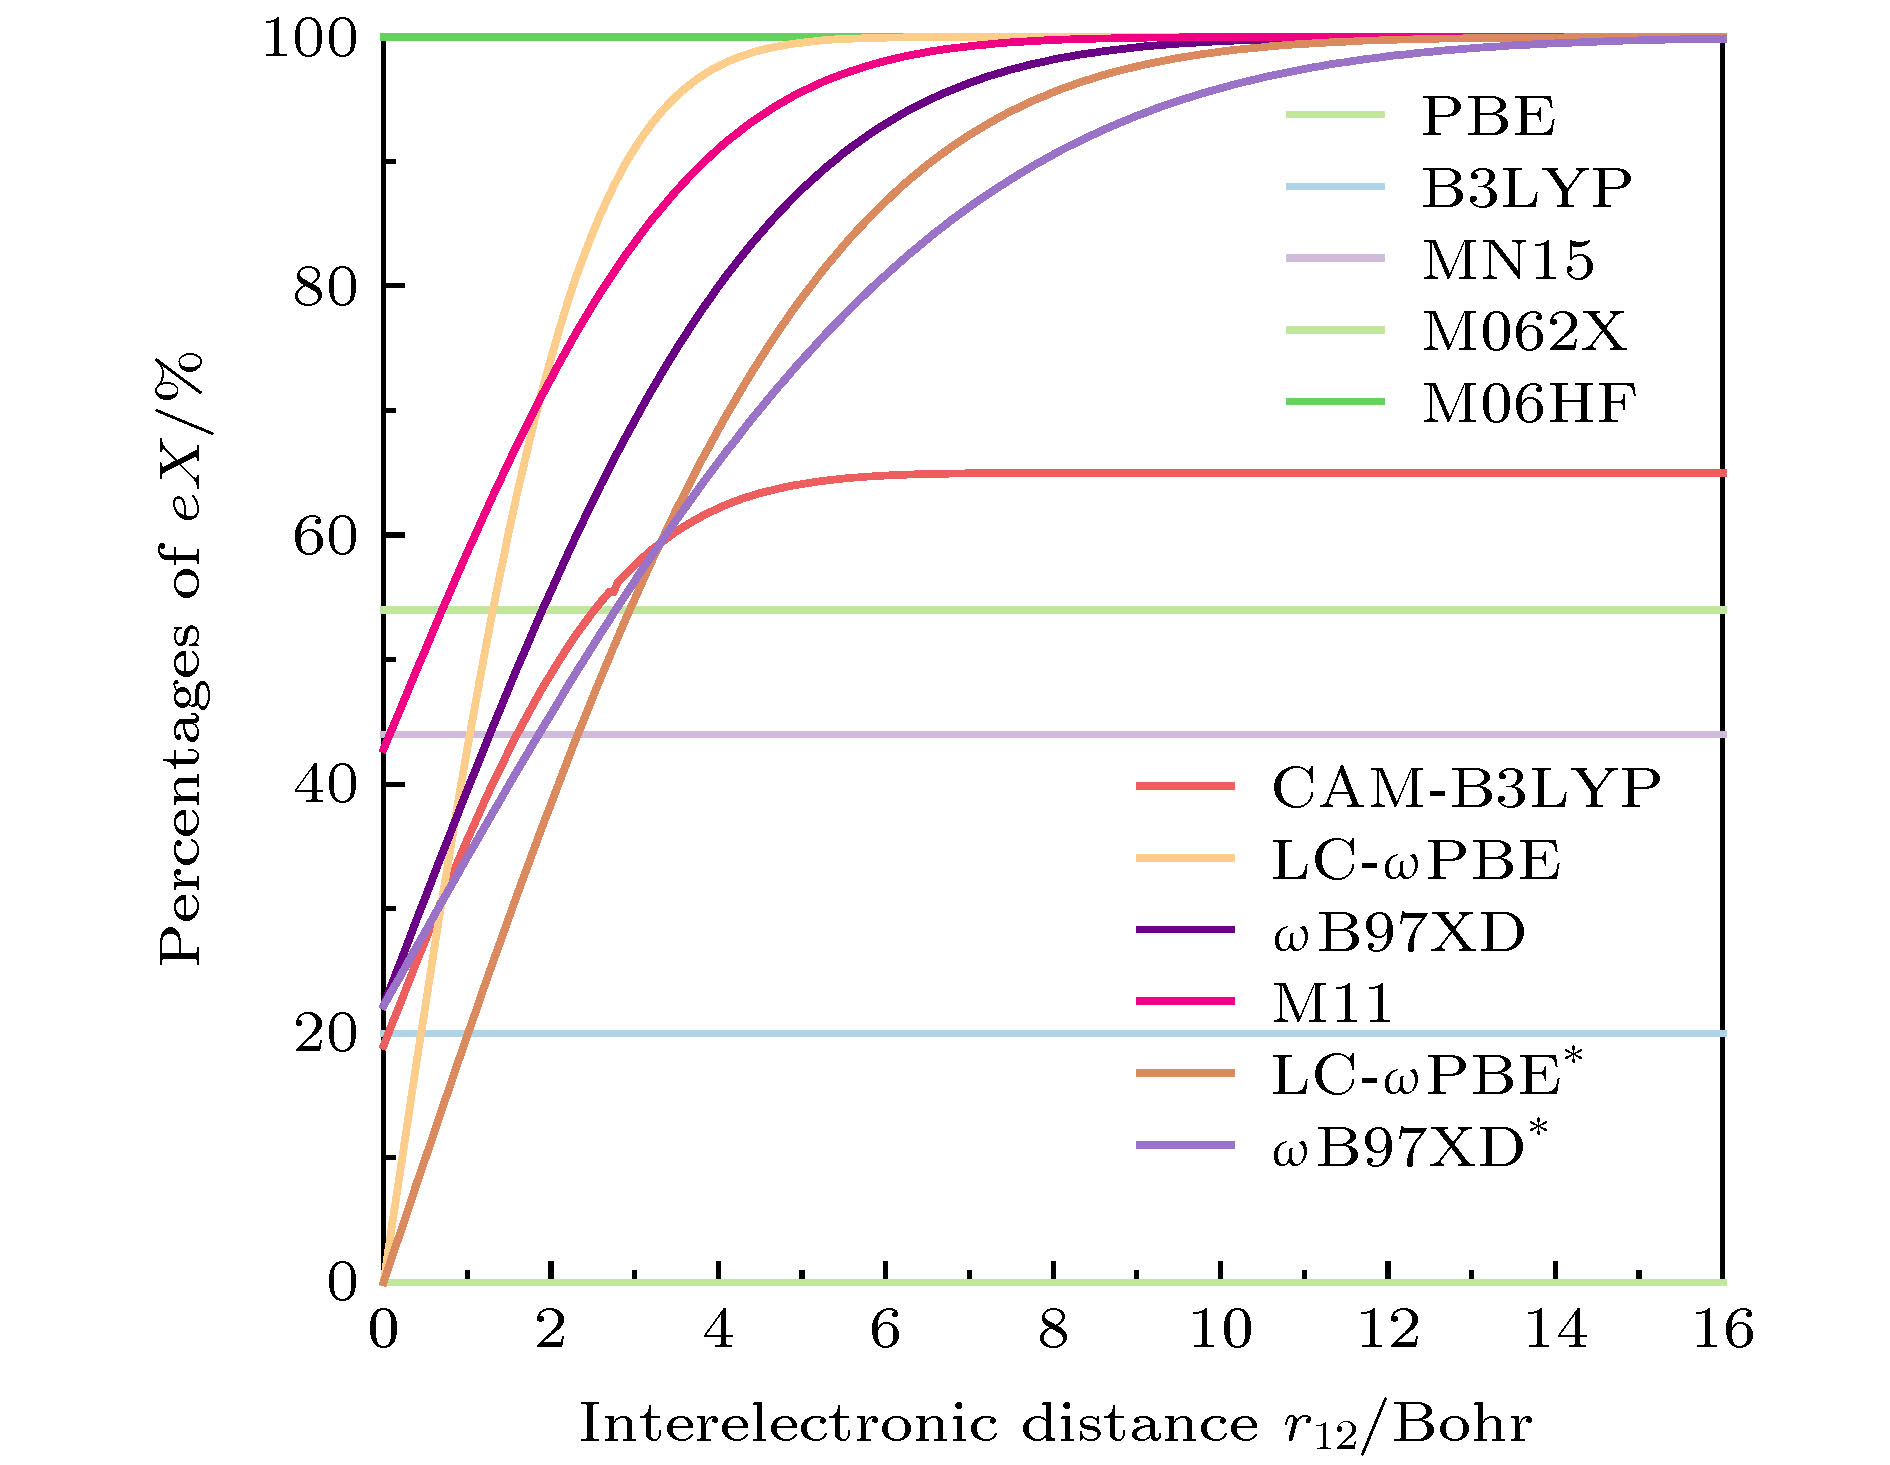 图 2 本文中各种密度泛函中所含准确交换项比例(eX%)与电子间距离(r12)关系示意图
 图 3 胆红素分子最低单重激发态的空穴-电子分布示意图
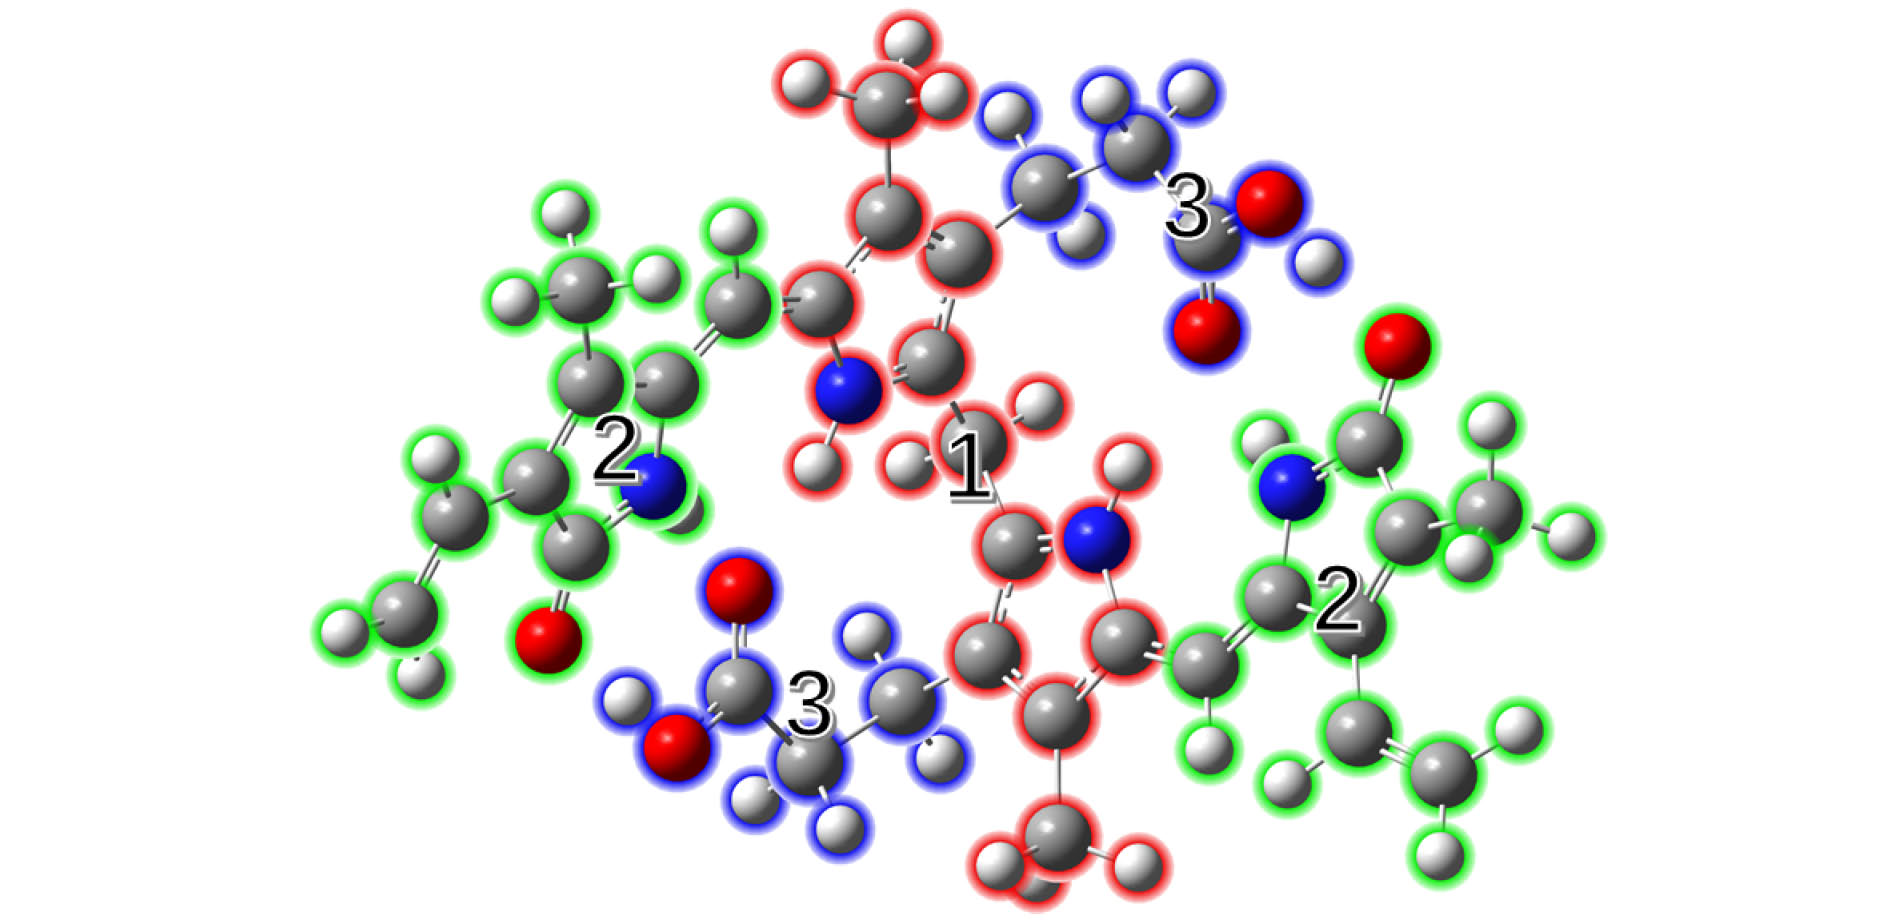 图 4 胆红素分子的三个片段划分及各片段对最低单重激发态的空穴和电子的贡献
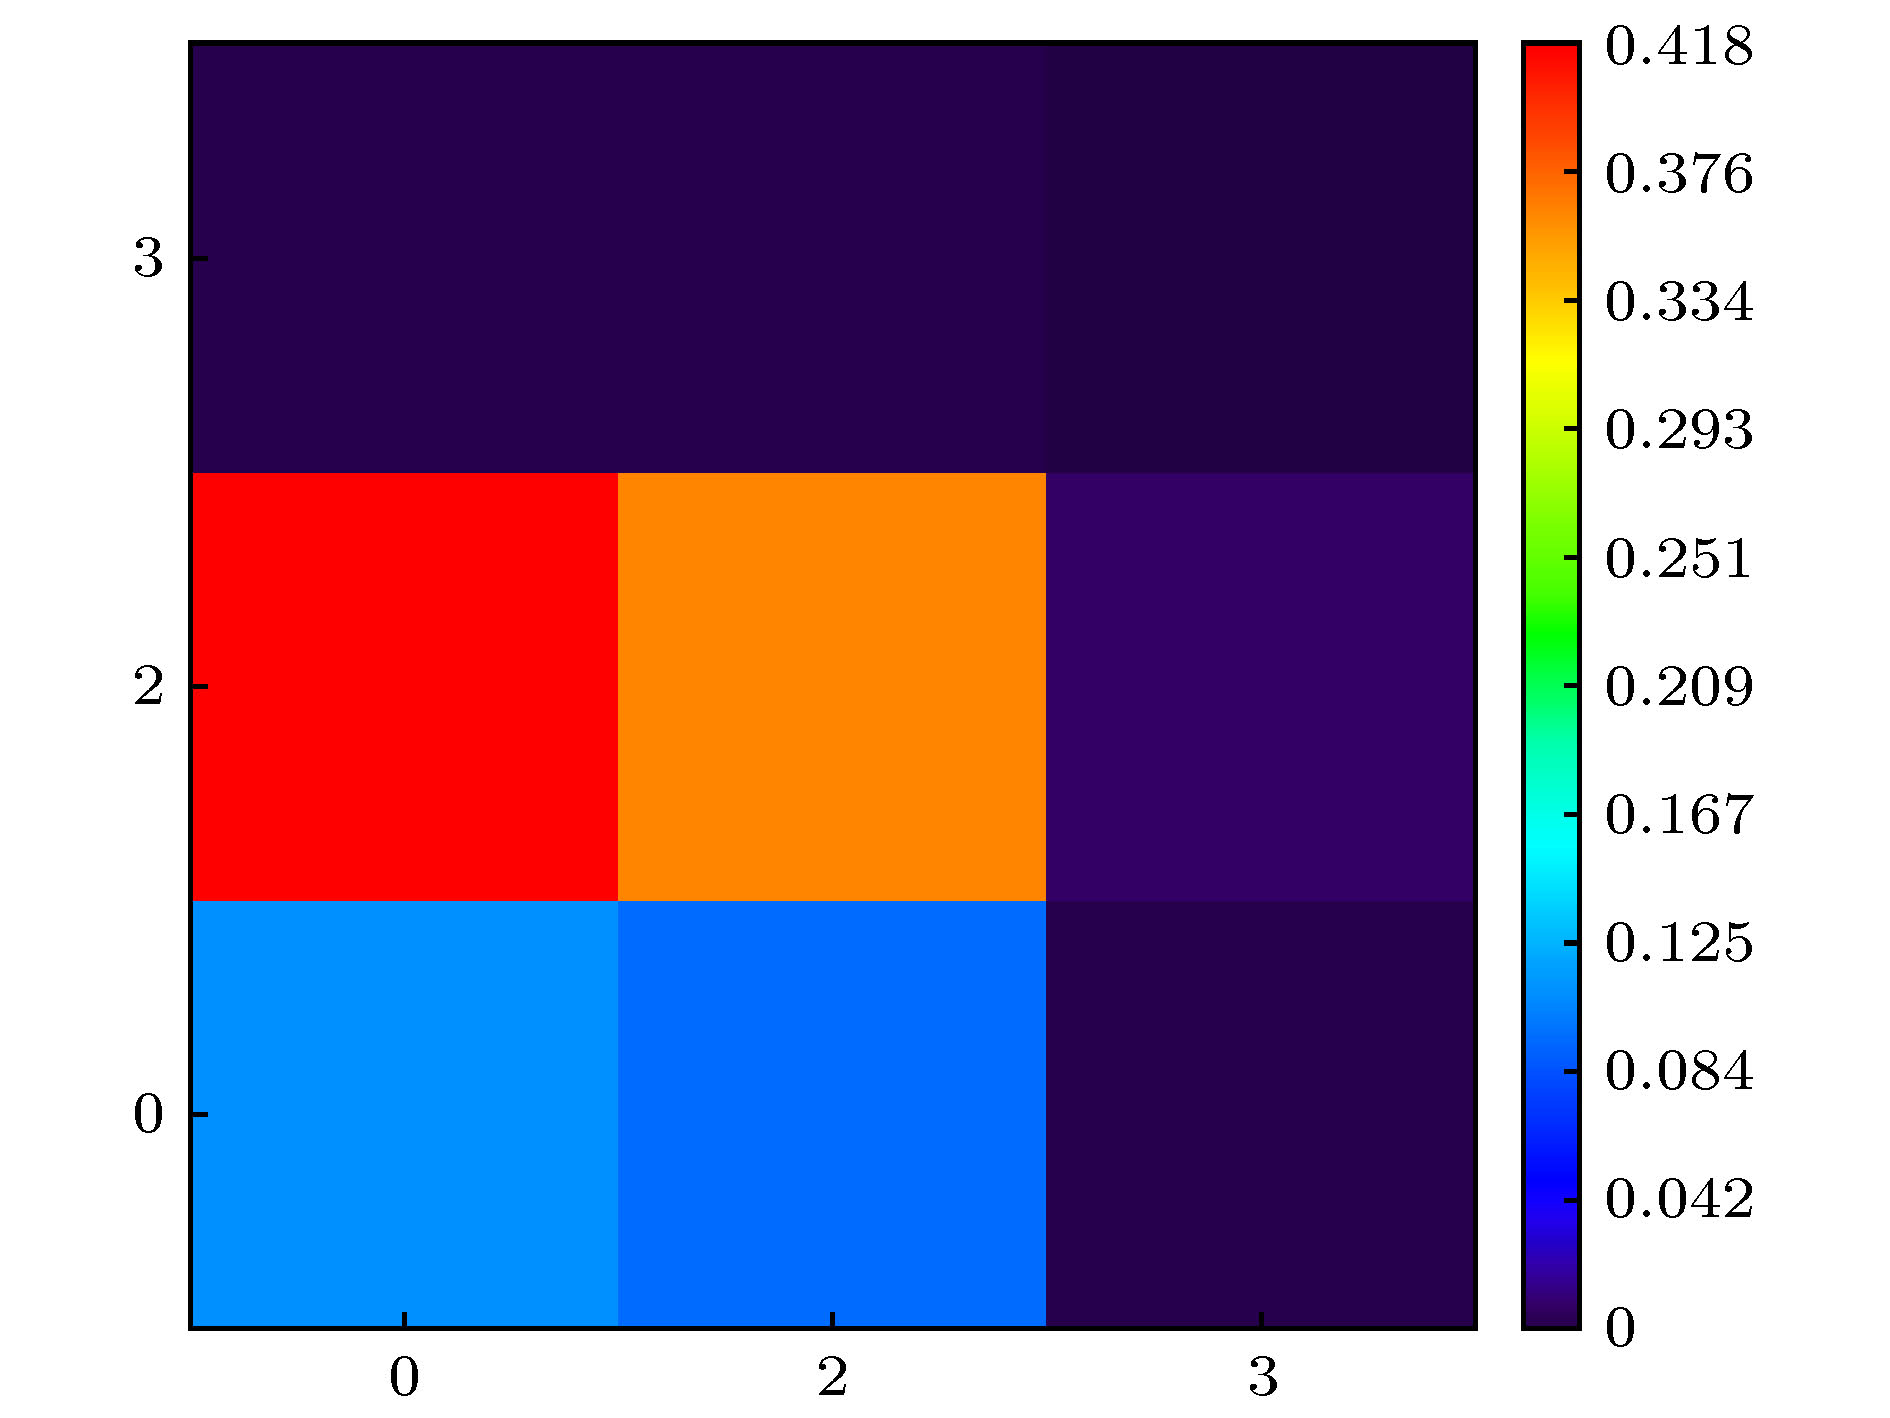 图 5 胆红素分子最低单重激发态的各片段电子转移矩阵热图