1.Collaborative Innovation Center of Extreme Optics, State Key Laboratory of Quantum Qptics and Quantum Optics Devices, Institute of Opto-Electronics, Shanxi University, Taiyuan 030006, China 2.College of Physics and Electronic Engineering, Shanxi University, Taiyuan 030006, China 3.Department of Physics, Zhejiang University, Hangzhou 310027, China
Fund Project:Project supported by the National Key R&D Program of Chnia (Grant No. 2017TFA0304502), the National Natural Science Foundation of China (Grant Nos. 11634008, 11674203, 11574187), and Shanxi Province “1331Project” Key Discipline Construction Program
Received Date:02 July 2019
Accepted Date:07 September 2019
Available Online:05 December 2019
Published Online:05 January 2020
Abstract:Quantum light field is very important source in quantum optics and quantum precision measurement, and the generation of quantum state of light is significant in quantum storage, quantum metrology and studying the interaction between nonclassical light and matter. The polarization squeezed light near the atomic transition has great potential applications in the precise measurement of magnetic field as its Stokes parameter’s noise is less than the standard quantum limit (SQL). Therefore, it is very important to generate the polarization squeezed light at atomic transition. We report in this paper the experiment on generating the bright polarization squeezed light at cesium D2 line based on an optical parametric amplifier (OPA). The experimental system includes the following three parts: 1) a second harmonic generator (SHG), 2) an OPA, and 3) a detection system. The OPA has a similar structure to the SHG system with four-mirror ring cavity in which only the fundamental wave is resonant. A nonlinear type-I periodically-poled KTiOPO4 (PPKTP) crystal with a size of 1 mm × 2 mm × 20 mm is placed in the center of the cavity waist and its temperature is precisely controlled. The OPA is pumped by the 426 nm blue light which is generated by SHG and this OPA is operating below the threshold. The squeezed light at cesium D2 line is produced when the crystal temperature is at its optimum phase-matching temperature and the OPA cavity is stabilized based on resonance. The generated squeezed light is combined with the coherent light on a polarizing beam splitter (PBS) to obtain the polarized squeezed light for either ${\hat S_2} $ or ${\hat S_3} $ of the Stokes parameter by controlling the type of squeezed light (parametric amplification or de-amplification) and the relative phase (0 or π/2) of two beams. And for ${\hat S_1} $, the amplitude-squeezed light (corresponding to parametric de-amplification) is the ${\hat S_1} $ squeezed light. The maximum squeezing of 4.3 dB (actually 5.2 dB) is observed in a bandwidth range of 2-10 MHz. At present, the squeezing is mainly limited by the escape efficiency of OPA and the detection efficiency, and the OPA escape efficiency is mainly limited by the blue-light-induced loss of PPKTP crystal and the thermal effect of crystal. In the optical atomic magnetometer, increasing the signal-to-noise ratio (SNR) of the system can effectively improve the sensitivity of the magnetic field measurement. This bright polarization squeezed light is expected to be used in the optical cesium atomic magnetometer to improve the sensitivity of the magnetometer. Keywords:Stokes parameter/ optical parametric amplifier/ polarization squeezed light
这4个斯托克斯参量及其噪声可以用图2装置来测量. 图 2 四个斯托克斯参量的测量装置. PBS, 偏振分束棱镜; $\lambda /2$和$\lambda /4$分别是半波片和四分之波片; 加号和减号分别代表电流信号相加减; SA, 频谱分析仪 Figure2. Apparatus required to measure four Stokes parameters. PBS, polarizing beam splitter; $\lambda /2$ and $\lambda /4$, half-and quarter-wave plates, respectively; the plus and minus signs imply that an electrical sum or difference has been taken; SA, Spectrum analyzer.
当光场比较强时, 光场的噪声起伏将远小于其相干振幅, 此时可以得到斯托克斯参量的均值为
$\langle {{{\hat S}_0}}\rangle = \alpha _{\rm H}^2\left( t \right) + \alpha _{\rm V}^2\left( t \right) = \left\langle {\hat n} \right\rangle,\tag{3a}$
$\langle {{{\hat S}_1}}\rangle = \alpha _{\rm H}^2\left( t \right) - \alpha _{\rm V}^2\left( t \right),\tag{3b}$
$\langle {{{\hat S}_2}}\rangle = 2{\alpha _{\rm H}}\left( t \right){\alpha _{\rm V}}\left( t \right)\cos \theta,\tag{3c}$
$\langle {{{\hat S}_3}} \rangle = 2{\alpha _{\rm H}}\left( t \right){\alpha _{\rm V}}\left( t \right)\sin \theta,\tag{3d}$
我们在实验上首先研究了OPA腔的参量放大的特性. 将OPA腔腔长锁定, 通过扫描探测光的相位获得参量放大和参量缩小. 通过测量光强的变化来获得增益因子G. 实验结果如图5所示, 其中点为测量数据, 线为根据实验参数拟合的曲线[33]. 图 5 参量增益随泵浦光功率的变化, 其中绿(红)色实点是参量放大(缩小)的实验结果. 实线是理论拟合结果 Figure5. Parametric gain versus pump power, where green (red) solid dots denote the experimental results of amplified (deamplified) gain. The solid lines represent the theoretical results.
表1影响OPA产生压缩和探测过程的实验参数 Table1.Factors of effecting squeezing from the OPA and the detection system.
根据实验参数, 在2 MHz处理论上应该得到4.5 dB的压缩和12 dB的反压缩. 理论结果与实验得到的结果基本上是吻合的. 通过对影响压缩的因素进行分析, 在目前的实验参数下, 获得4.3 dB的压缩是合理的. 限制压缩的主要因素是探测效率和OPA的逃逸效率. 为了获得更高的压缩度, 需要在后续的实验中在本地光光路中加入模式清洁器提高干涉效率, 同时进一步提高传输效率和采用量子效率更高的探测器. 提高泵浦光的模式匹配效率来降低晶体的热效应, 同时采用更优质的腔镜和晶体降低OPA的内腔损耗, 这样可以提高逃逸率. 利用两束光的干涉获得它们之间的相位信息并利用反馈系统控制相位为0或${\text{π}}/2$. 当压缩光为振幅压缩, 与本地相干光相位差锁定为0时(或压缩光为位相压缩, 相位锁定为${\text{π}}/2$时)可以得到${\hat S_2}$压缩、${\hat S_3}$反压缩, ${\hat S_1}$为标准量子噪声基准. 相应的实验结果如图7(a)所示. 同理, 当压缩光为位相压缩, 相位差锁定为0时(或压缩光为振幅压缩, 相位差锁定为${\text{π}}/2$)时得到${\hat S_3}$压缩、${\hat S_2}$反压缩, ${\hat S_1}$为标准量子噪声基准. 相应的实验结果如图7(b)所示. 其中实验参数为: 本地光功率为1 mW, 振幅压缩光功率约为4 μW, 倍频蓝光功率约为110 mW, 谱仪参数RBW = 100 kHz, VBW = 500 Hz, 数据平均为30次. 这两个实验结果中参量${\hat S_1}$噪声在较低频率处略高于标准量子噪声基准. 这是由于激光在较低频率范围内的额外强度噪声所引起的. 如果产生的压缩光是振幅压缩, 那么参量${\hat S_1}$是压缩的, ${\hat S_2}$和${\hat S_3}$为标准量子噪声基准. 实验上测量了一束功率为10 μW的振幅压缩光的斯托克斯参量噪声谱. 相应的实验结果如图7(c)所示. 其中实验参数为: 倍频蓝光功率为85 mW, 谱仪参数RBW = 100 kHz, VBW = 500 Hz, 数据平均为30次. 因为倍频蓝光功率比较低, 相应的压缩度偏低. 从实验结果可以看出, 单束振幅压缩光实际上就是对应斯托克斯参量${\hat S_1}$的偏振压缩光. 图 7 不同斯托克斯参量的噪声测量结果. 其中左图是测量的斯托克斯参量的噪声谱, 已归一化到标准量子噪声基准. 右图是与之对应的噪声分布球及投影噪声分布, 其中蓝色椭球体代表噪声球, 椭圆表示噪声球投影到各个面上的噪声分布. 红色虚线表示相干光对应的噪声, 蓝色实线表示偏振压缩光 (a) ${\hat S_2}$压缩; (b) ${\hat S_3}$压缩; (c) ${\hat S_1}$压缩 Figure7. Measured noise results for different Stokes parameters. The results on the left are the measured variance spectra of Stokes parameters normalized to quantum noise limit. The results on the right are the corresponding diagrammatic illustration of the Stokes parameters’ variance ellipsoid, and the blue ellipsoid is the noise ball, and these ellipses are the noise projections at each plane. The red dashed circles represent the noise of the coherent state and the blue solid circles show the squeezing. (a) Squeezing for Stokes parameter ${\hat S_2}$; (b) Squeezing for Stokes parameter ${\hat S_3}$; (c) Squeezing for Stokes parameter ${\hat S_1}$.


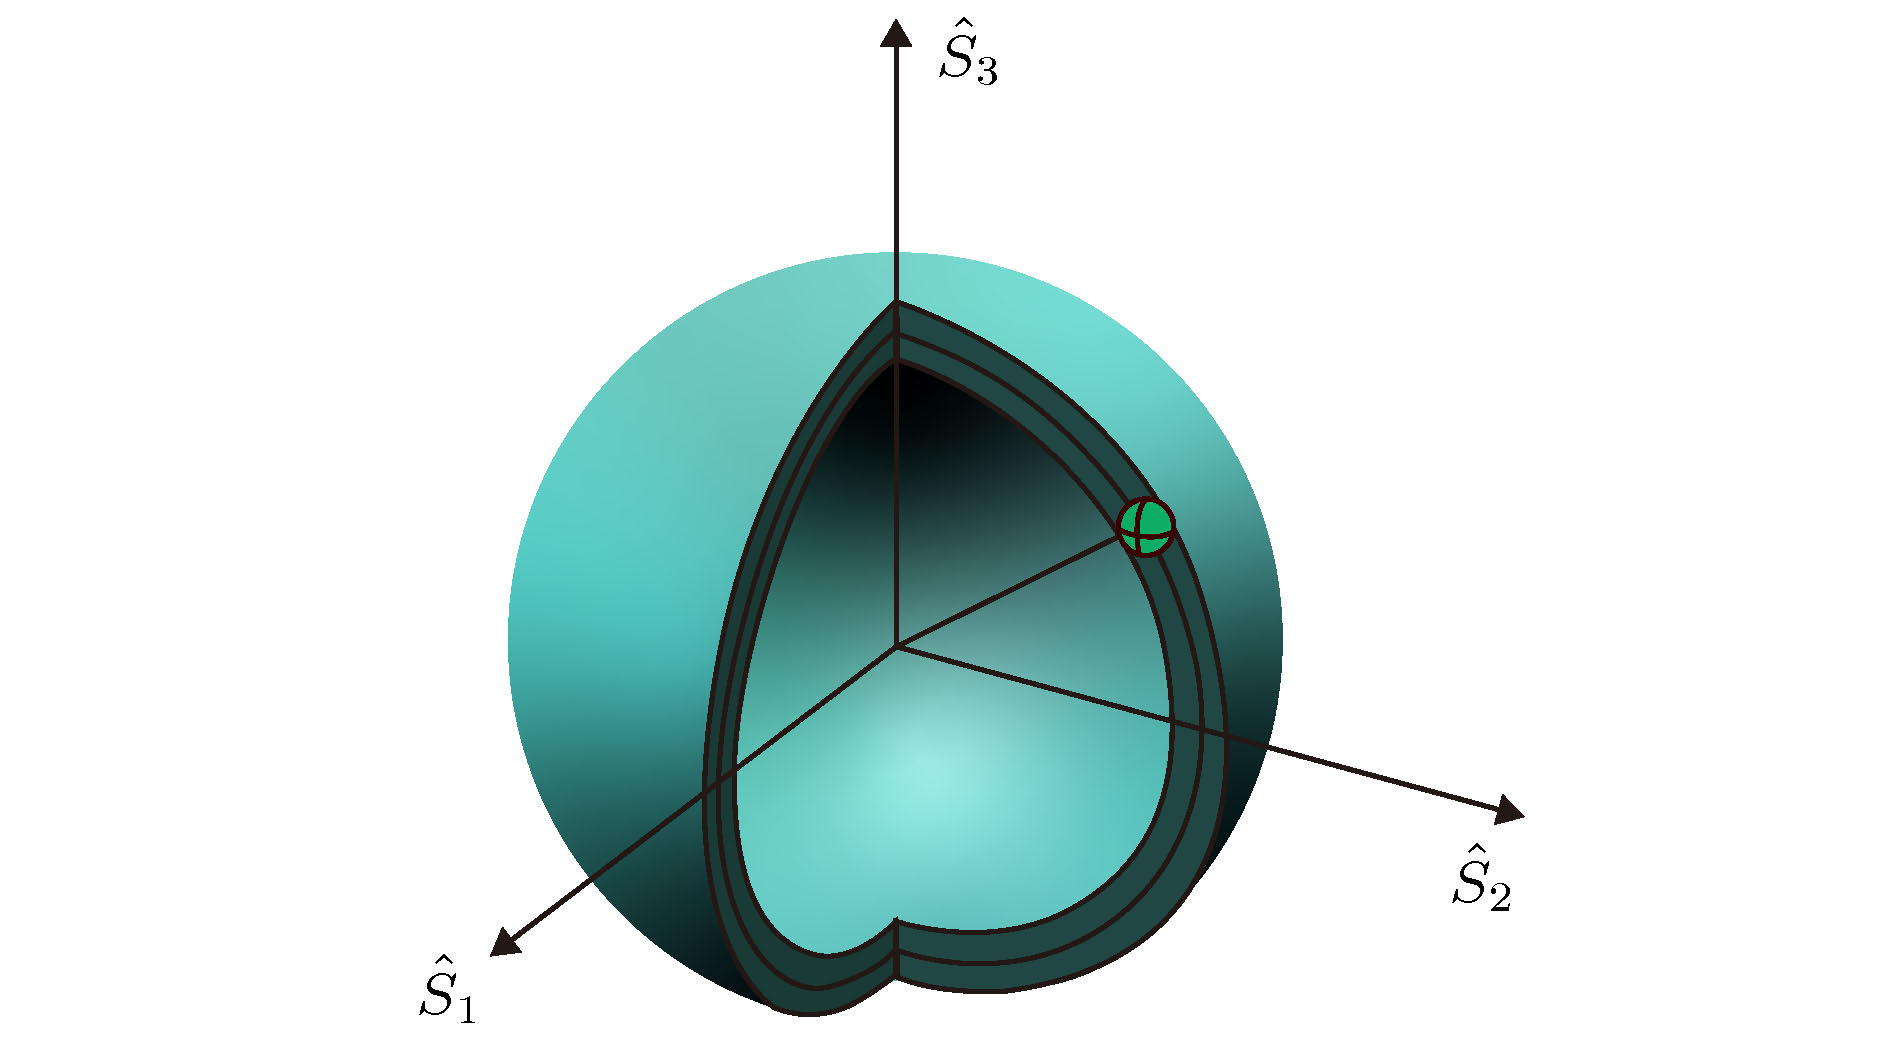 图 1 量子化的庞加莱球和斯托克斯参量图示


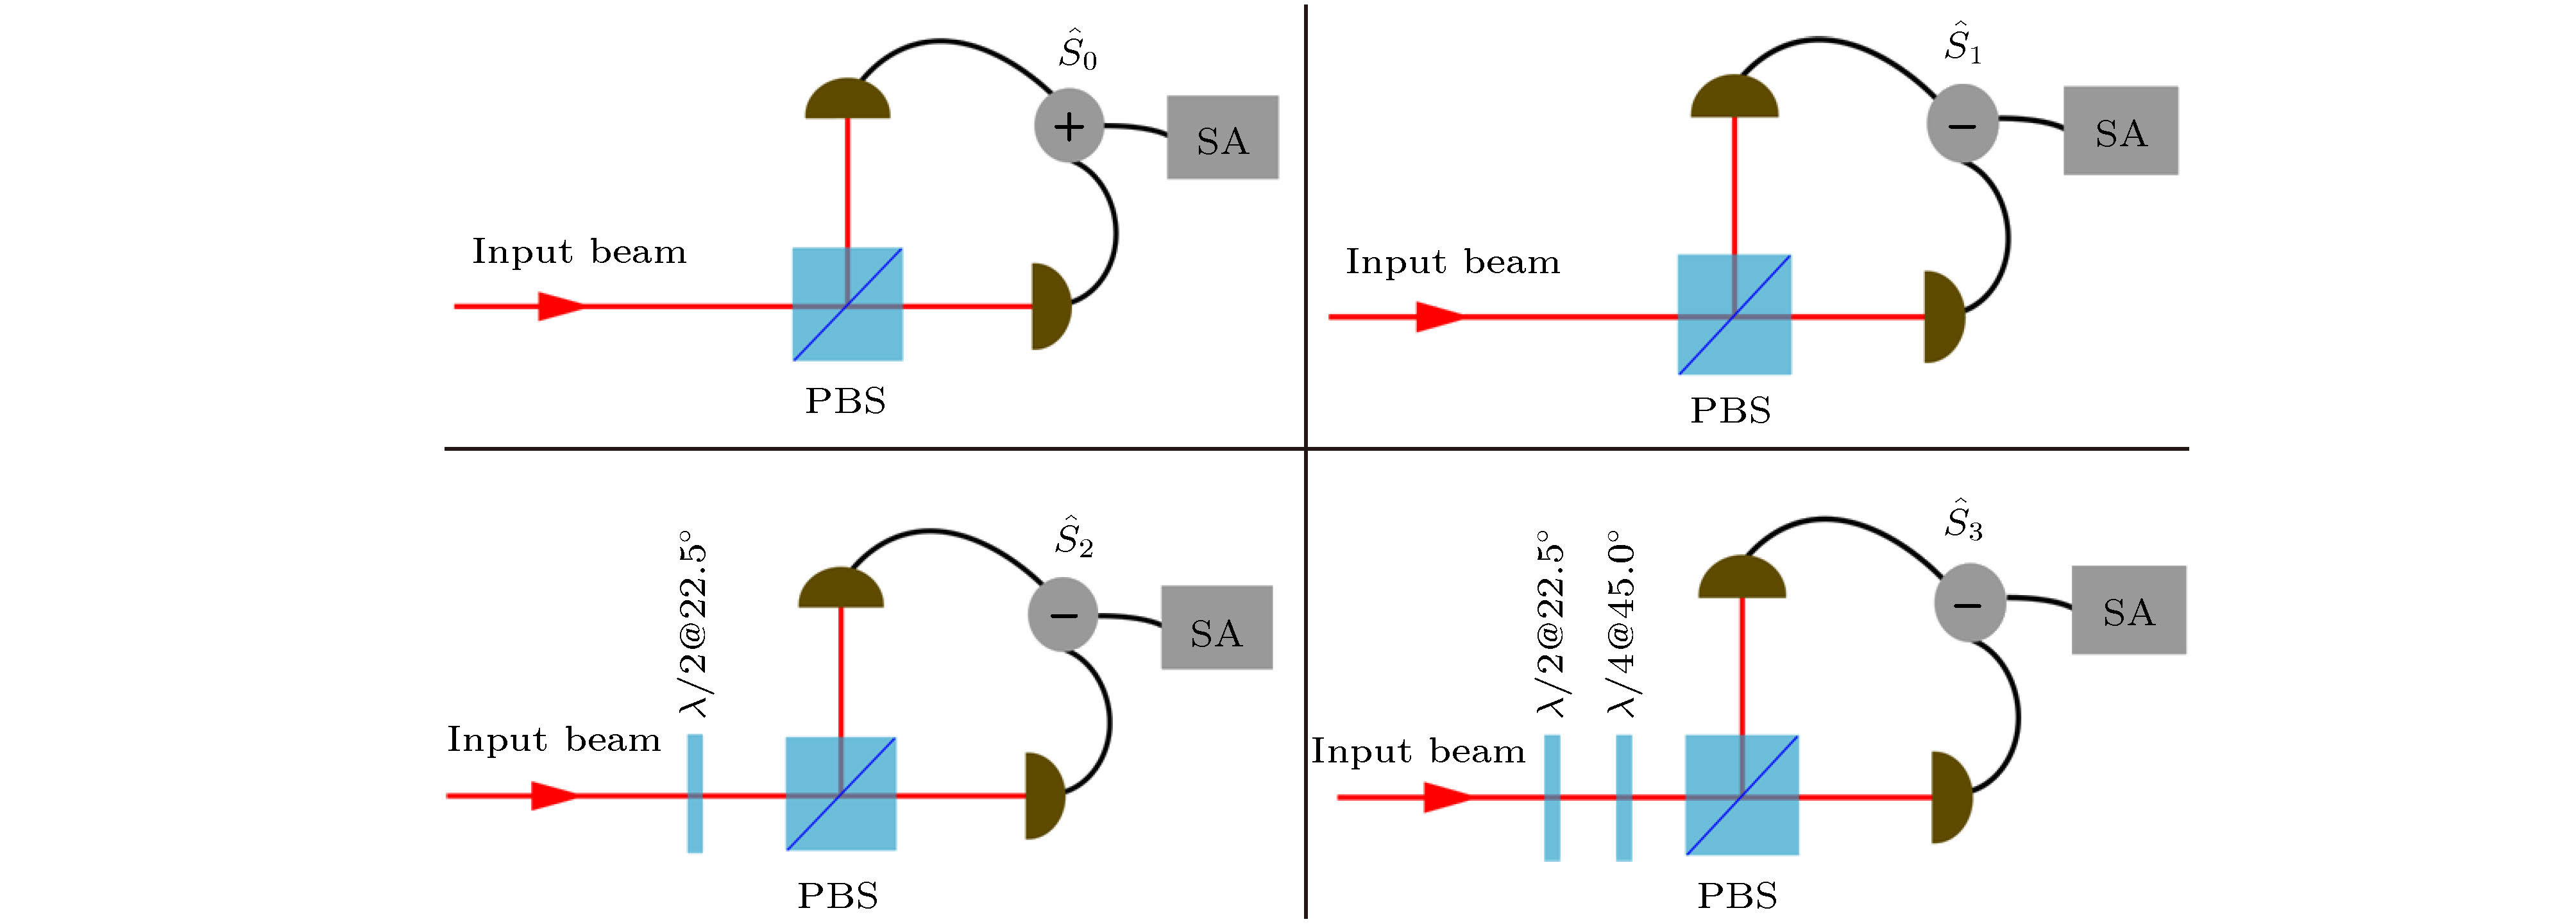 图 2 四个斯托克斯参量的测量装置. PBS, 偏振分束棱镜;


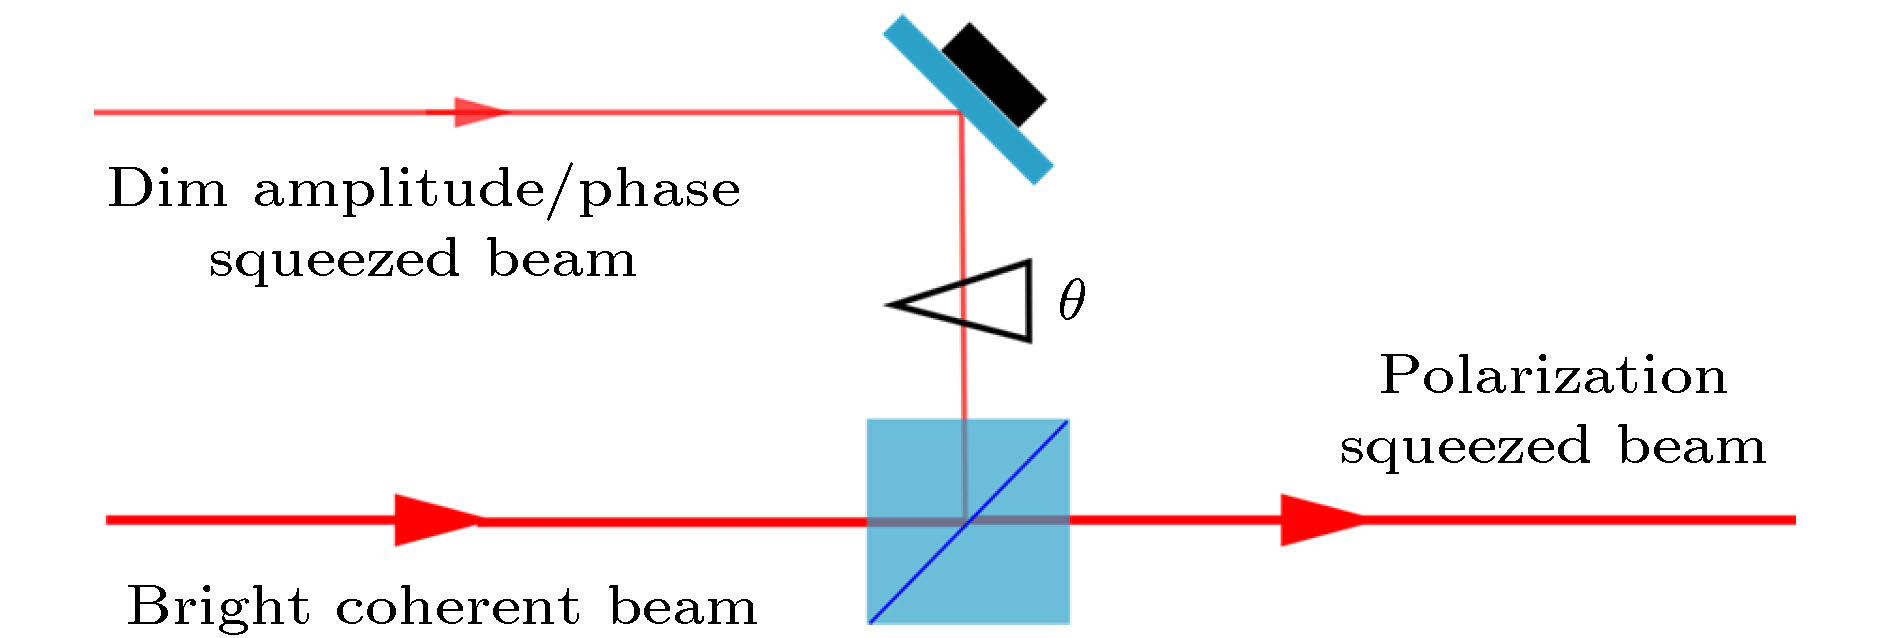 图 3 明亮偏振压缩光合成装置
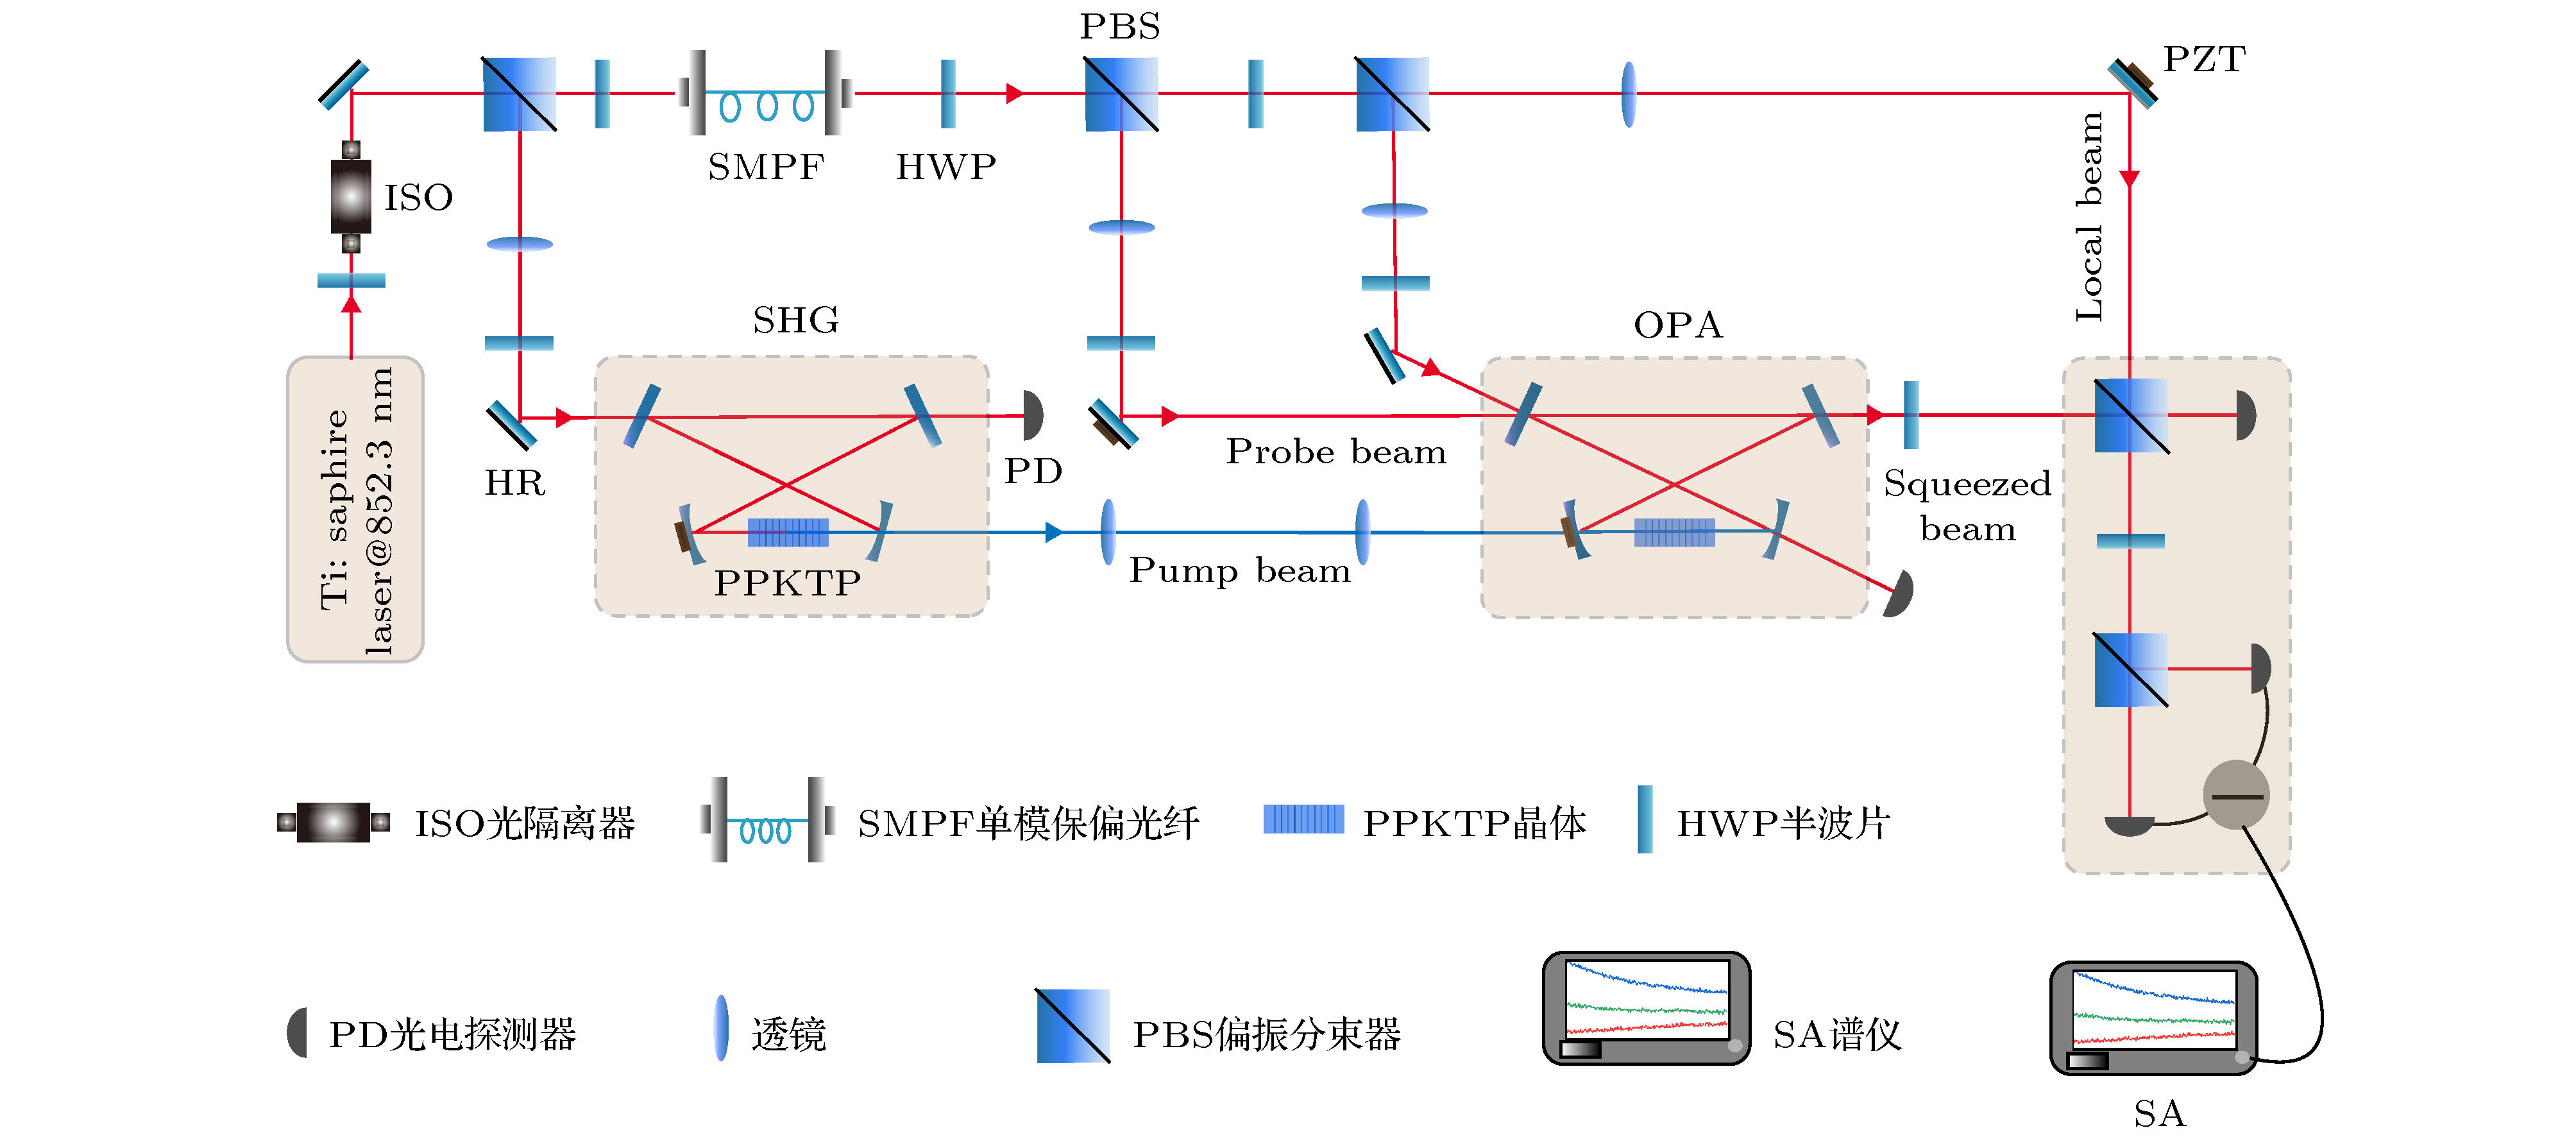 图 4 实验装置图
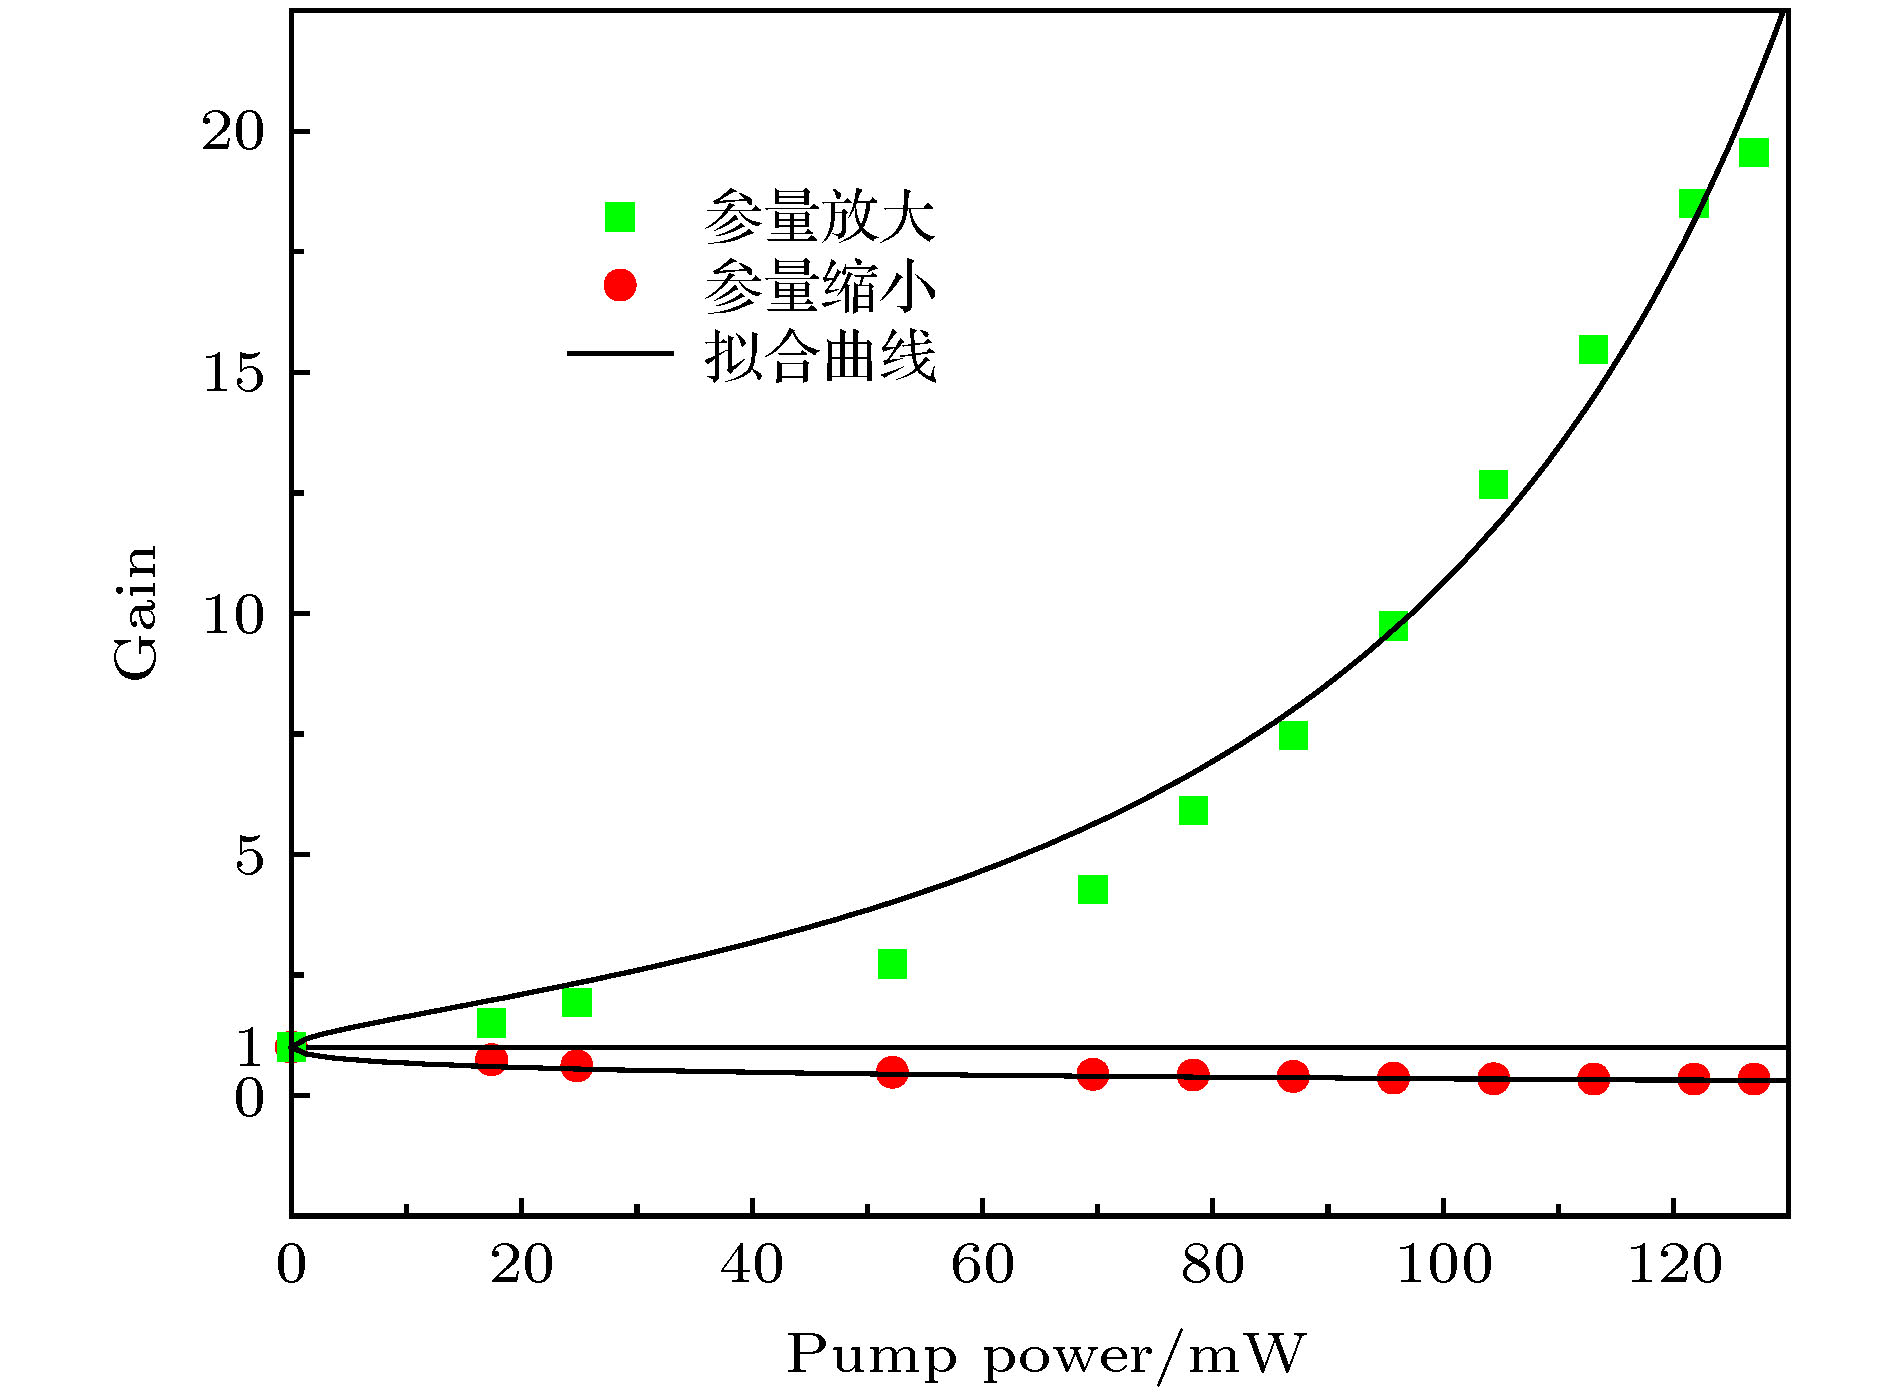 图 5 参量增益随泵浦光功率的变化, 其中绿(红)色实点是参量放大(缩小)的实验结果. 实线是理论拟合结果
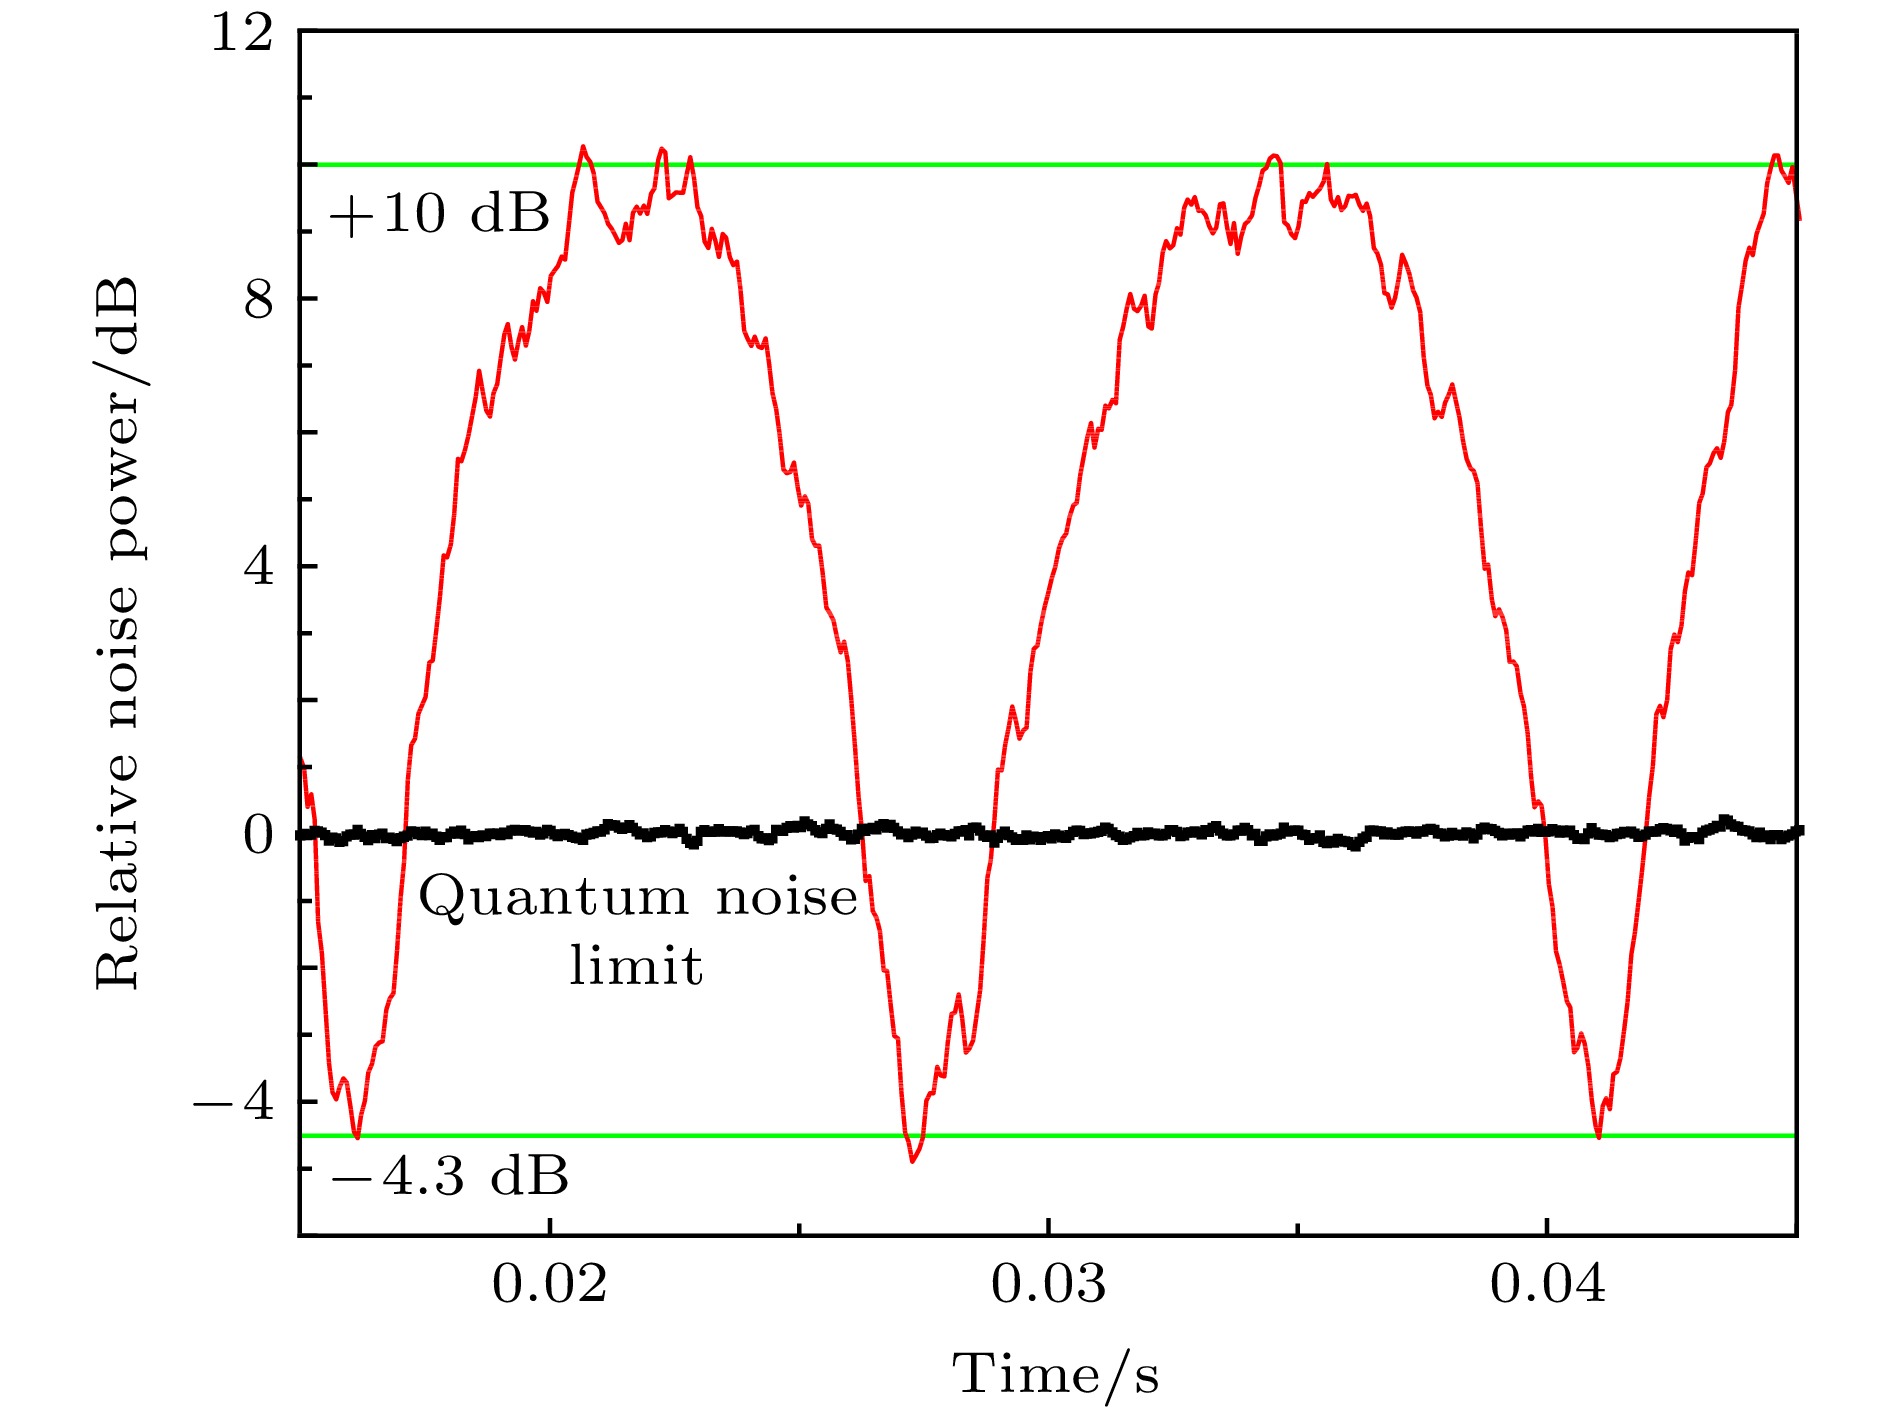 图 6 扫描本地光相位时得到的噪声. 谱仪中心频率为2 MHz, 分辨率带宽(RBW)为100 kHz, 视频带宽(VBW)为500 Hz


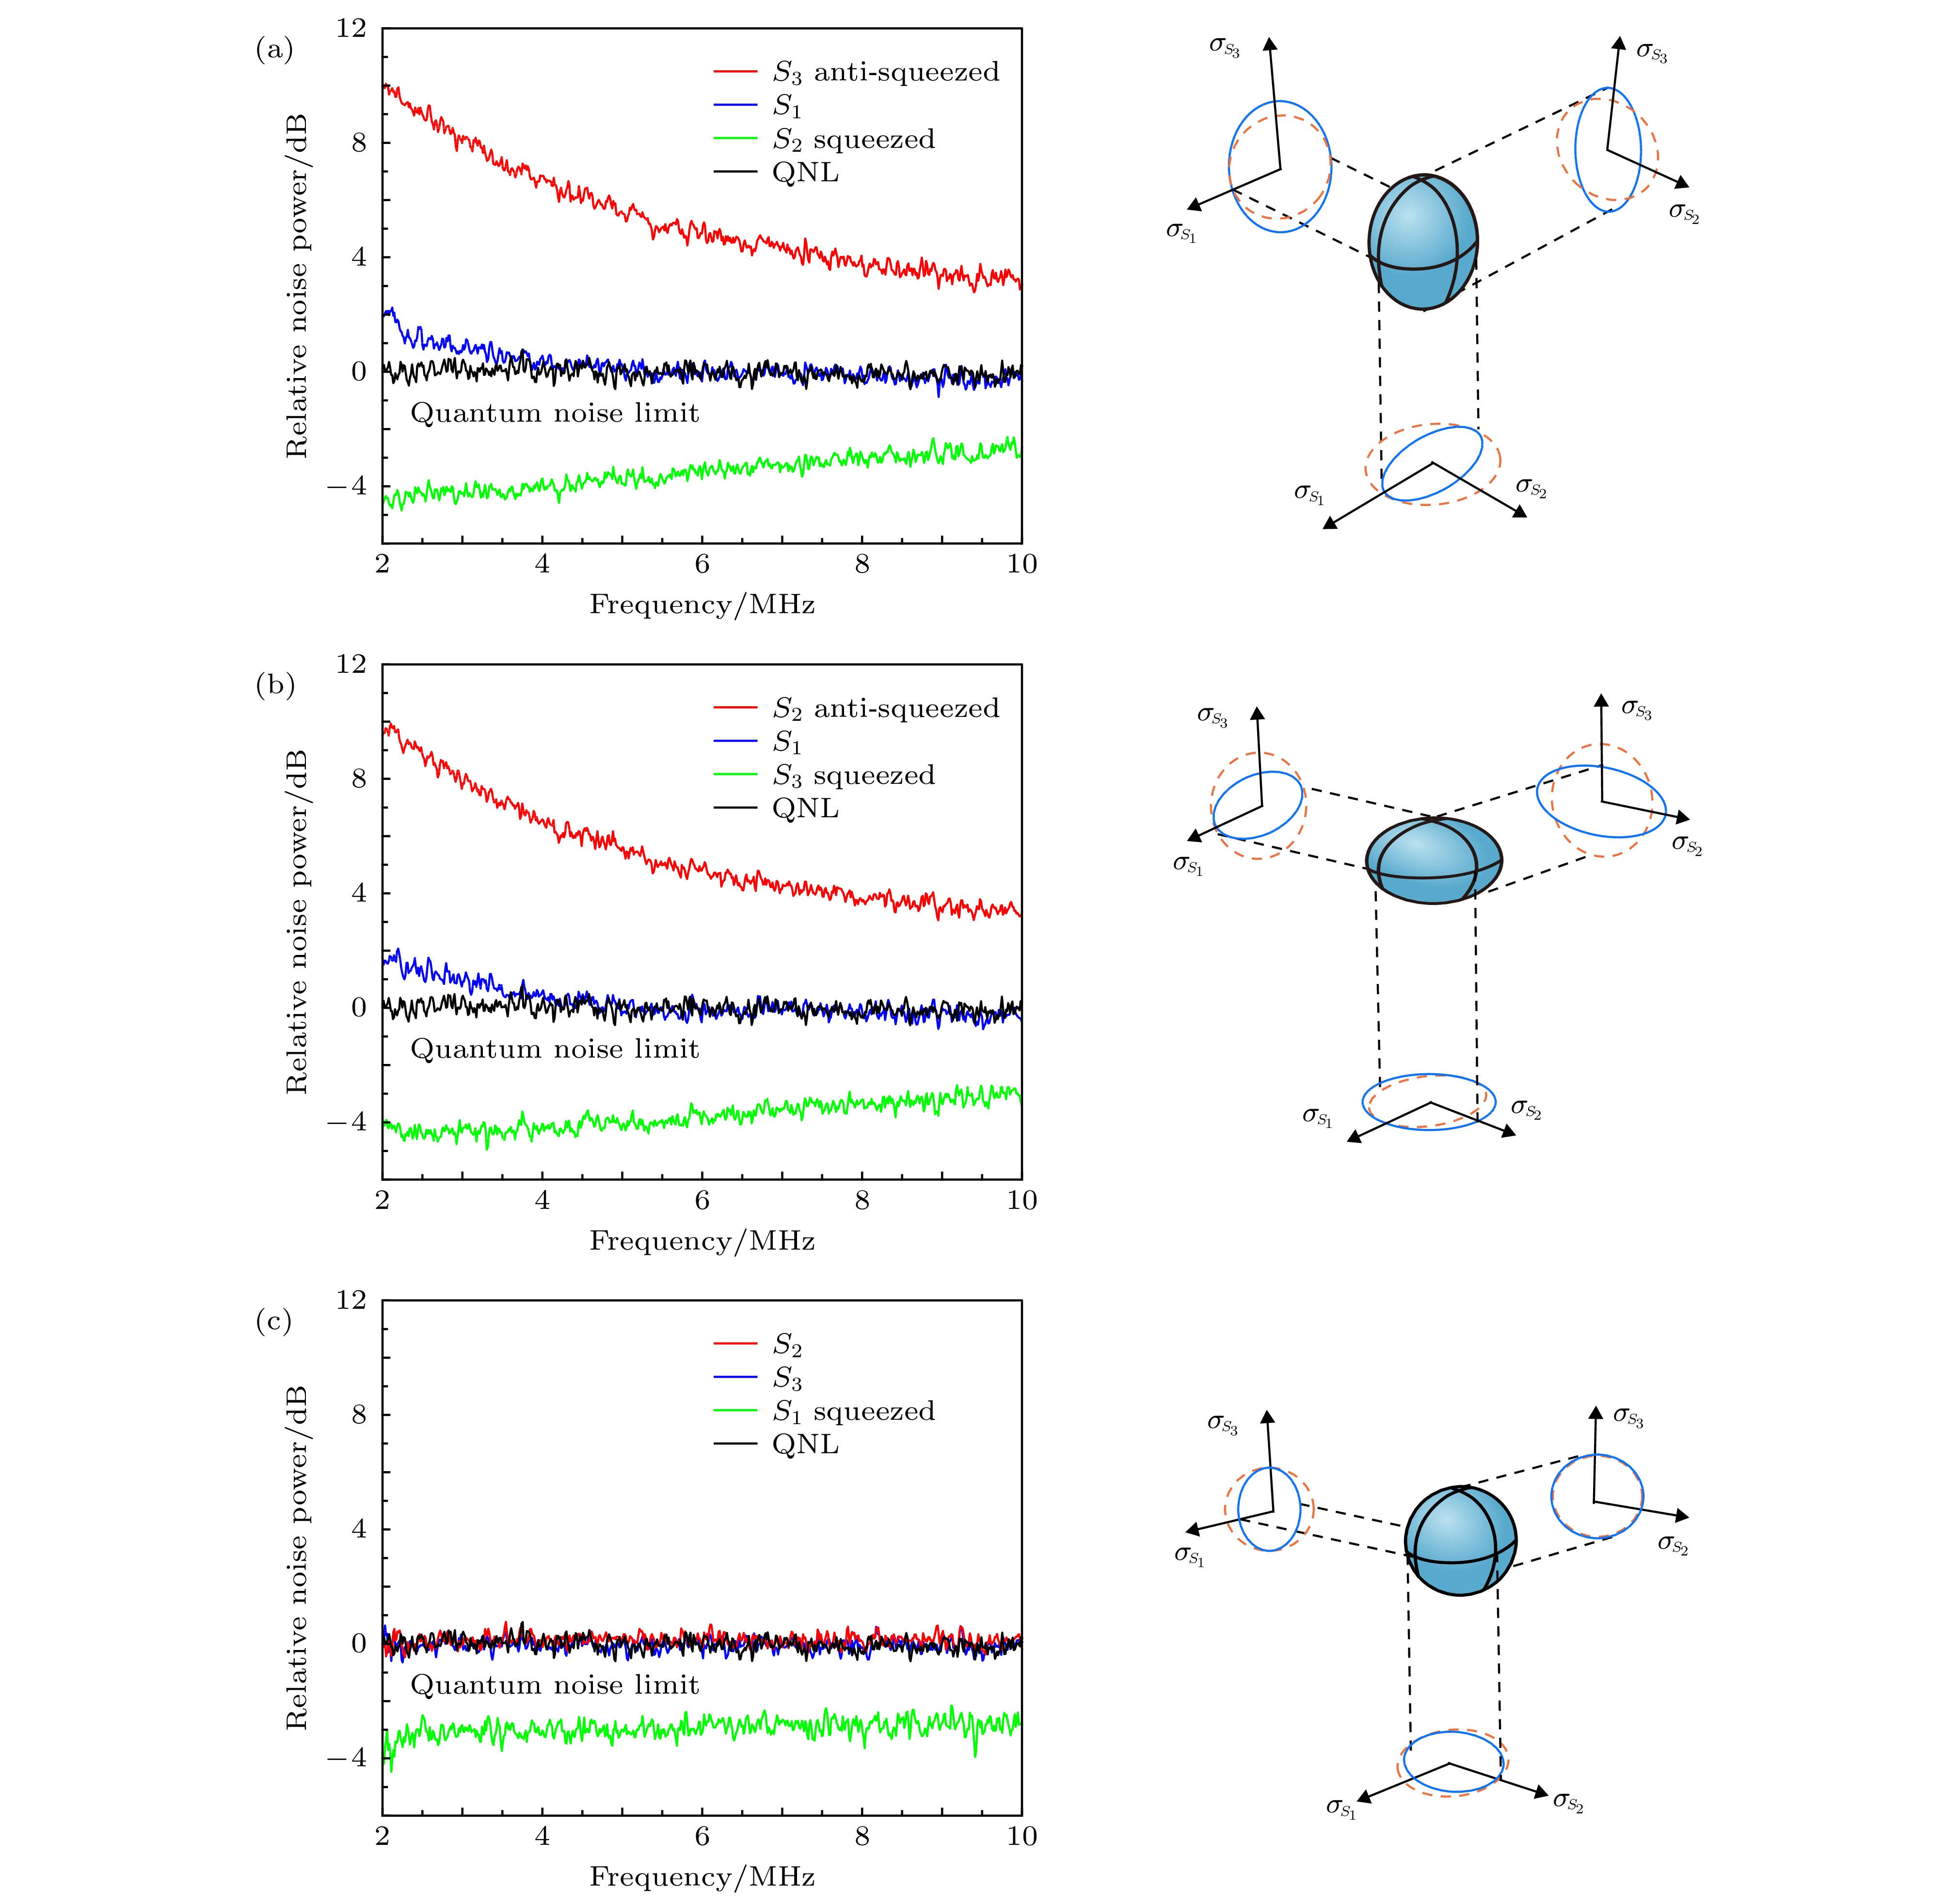 图 7 不同斯托克斯参量的噪声测量结果. 其中左图是测量的斯托克斯参量的噪声谱, 已归一化到标准量子噪声基准. 右图是与之对应的噪声分布球及投影噪声分布, 其中蓝色椭球体代表噪声球, 椭圆表示噪声球投影到各个面上的噪声分布. 红色虚线表示相干光对应的噪声, 蓝色实线表示偏振压缩光 (a)


