HTML
--> --> -->There is above 40% disagreement between measuring the
The precision measurement of the 85Rb(n, 2n)84Rb reaction cross-section is a difficult task because of the long half-life of the products, the low neutron flux, variety of neutron fluxes in the sample position, and the effect of neutron scattering. A two-ring orientation assembly had been designed and successfully used to measure the (n, 2n) reaction cross-section data for several nuclei [7]. To obtain the precision sample positions to reduce the uncertainty of neutron energies by the sample positions, two improvements were achieved in the present work. First, the two-ring orientation assembly was fixed with the target tube using a stainless steel sleeve to avoid the moving of the two-ring orientation assembly during irradiation. Second, two center orientation poles were added in the two-ring orientation assembly to obtain a precision angle of each sample.
The neutron flux was monitored by the BF
2.1.Irradiation field
The 12ЈC20 MeV neutrons were produced by the D-T reaction on the target assembly at 5SDH-2 1.7MV Tandem accelerator in the China Institute of Atomic Energy. The incident deuteron beam energy and intensity were 3.276 MeV and about 7 ІЬA, respectively. To reduce the scattered neutrons caused by target assembly, the neutron source target is a titanium-tritide (TiT) foil with 12-mm diameter, and mounted on the end of a tube, which is 21 mm in diameter, 1-mm wall thickness, and 50-cm length. The target is cooled by an air-cooled device. The TiT target is 3 m from the ground and 5 m from the wall and ceiling. The arrangement of the TiT target and the samples for the reaction cross-section measurement are shown in Fig. 1 and Fig. 2. Each sample is 5 cm from the center of the TiT target.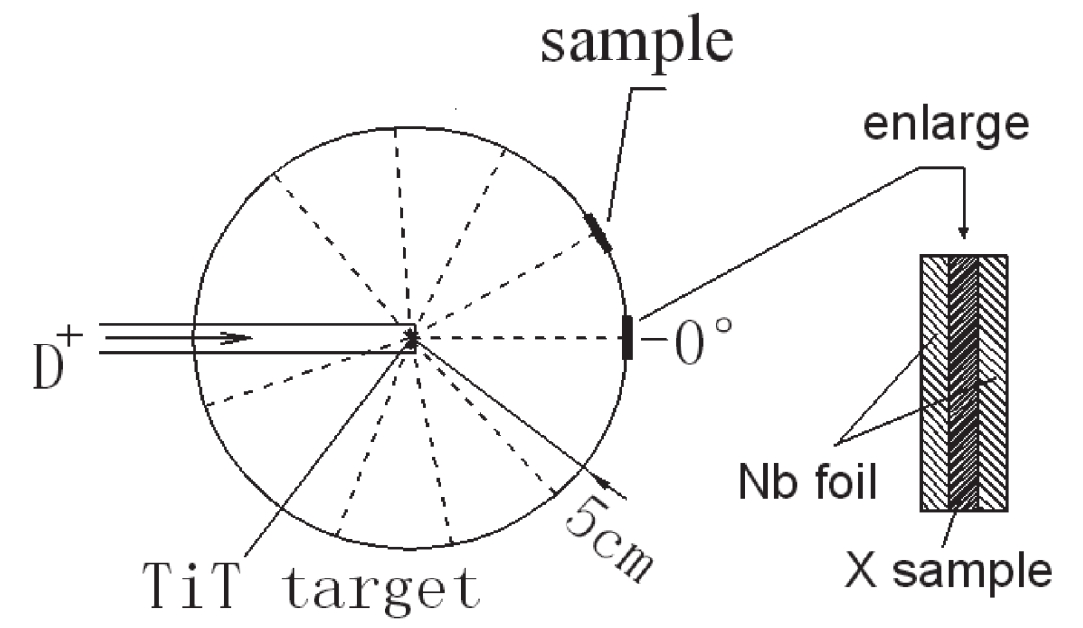 Figure1. Sample position.
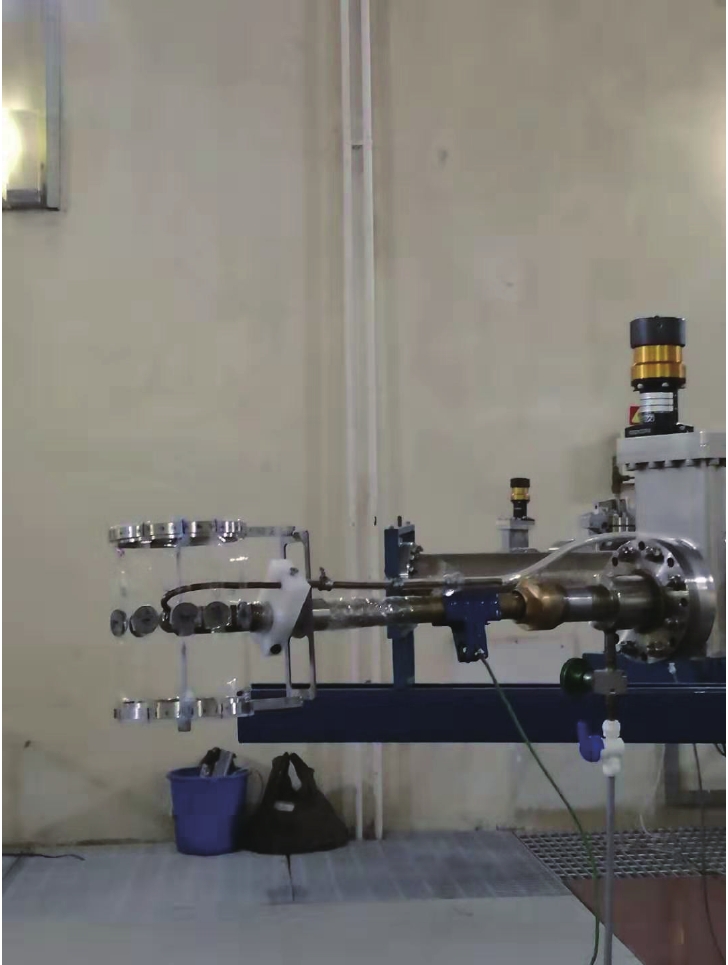 Figure2. (color online) Photograph of TiT target and sample arrangement.
Each sample was sandwiched between two niobium foils with a thickness of 0.5 mm. The same diameter was machined for the RbCl sample and niobium foils, such that the neutron flux of the RbCl sample position was equal to that of niobium foils. The samples are placed at the angles of 0Ёу, 29Ёу, 48Ёу, 64Ёу, 79Ёу, 94Ёу, 110Ёу, 129Ёу, and 161Ёу with respect to the deuteron beam direction and TiT target center. The neutron energy of angles ranging from 0Ёу to 161Ёу were: 19.8, 19.2, 18.2, 17.2, 16.1, 15.0, 14.0, 13.0, and 12.0 MeV, such that simultaneous irradiations could be fulfilled in the neutron range of 12ЈC19.8 MeV.
After deducting the beam energy loss in the half-target, the energy was calculated based on the high voltage of the accelerator and the thickness of the TiT target. The neutron energy and energy resolution of the 0Ёу direction were calculated by the TARGET program based on the geometry parameter of the target tube in this experiment. The neutron energy-angle distribution from the 0Ёу to 180Ёу direction with 5-cm distance from the titanium-tritide target to sample was calculated by the NEUYIE program in the DROSG-200 program package. The calculated results of the neutron energy-angle distribution from the 0Ёу to 180Ёу direction are shown in Fig. 3.
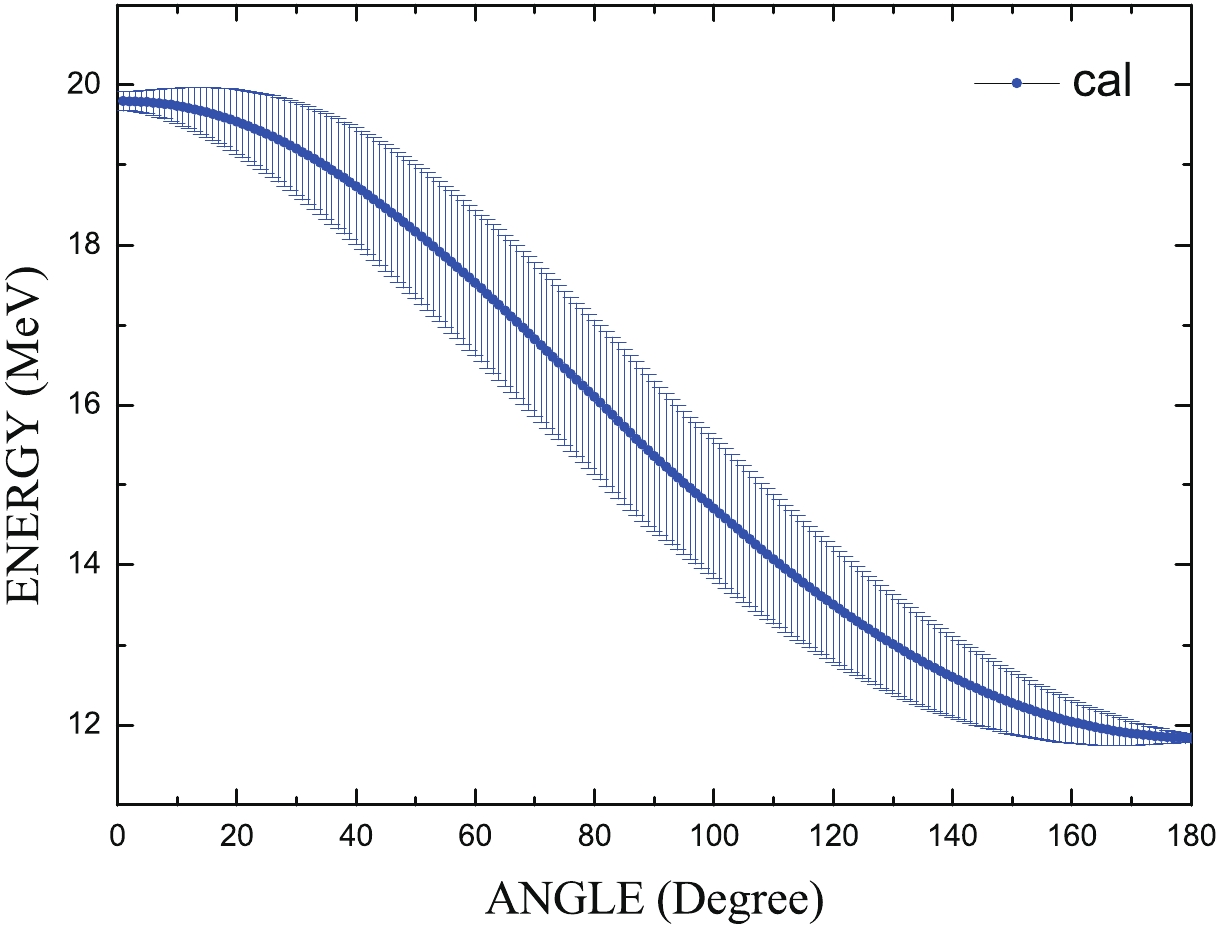 Figure3. (color online) Neutron energy-angle distribution.
The neutron flux was obtained by monitoring neutrons with the BF3 detector located in the direction of 0Ёу and at about 5-m distance. The irradiation time was about 107 h. The irradiation history can be divided into any number of separate parts, each with a relative neutron flux given by the counts. The total neutron flux, as measured by the 93Nb(n, 2n)
2
2.2.Sample preparation
Samples were procured from Beijing General Research Institute for Nonferrous Metals. The niobium purity was 99.999%. The RbCl sample with thickness of 1 mm was made by pressing RbCl powder with purity of 99.5%. Table 1 lists the purity, isotopic composition, thickness, and diameter for each sample [11].| sample | purity (%) | isotopic composition (%) | thickness /mm | diameter /mm |
| Niobium | 99.999 | 100 (93Nb) | 0.5 | 20 |
| Rubidium | 99.50 | 72.17 (85RbCl) | 1.0 | 20 |
| 27.83 (87RbCl) |
Table1.Sample characteristics.
2
2.3.Radioactivity measurements
After irradiation, a high resolution Ge detector (type: ORTEC GEM60P) with high efficiency (relative efficiency of 60%) was used to measure the radioactivity of the sample. The details of these measurements are given in Table 2 [12]. The efficiency calibration of Ge has been done carefully with a set of standard| nucleus | half-life /d |   |   |
  | 10.15 | 934.44 | 0.9915 |
| 84Rb | 32.82 | 881.60 | 0.689 |
Table2.Details of radioactivity constants used in analysis of experimental data.
3.1.Reaction cross-section calculation
The measured cross-section is given by: $ \begin{split} \sigma_{\rm X} = & \frac{\lambda_{\rm X}N_{\rm X}A_{\rm X}}{\lambda_{\rm Nb}N_{\rm Nb}A_{\rm Nb}}\frac{W_{\rm Nb}P_{\rm Nb}}{W_{\rm X}P_{\rm X}} \frac{\eta_{\rm Nb}f_{s{\rm Nb}}f_{\rm Nb}\varepsilon_{\rm Nb}}{\eta_{\rm X}f_{s{\rm X}}f_{\rm X}\varepsilon_{\rm X}}\\ &\times kF_{\phi}\frac{1-{\rm e}^{-\lambda_{\rm Nb}t_{m{\rm Nb}}}}{1-{\rm e}^{-\lambda_{\rm X}t_{m{\rm X}}}}\sigma_{\rm Nb}, \end{split} $  | (1) |
It is assumed that the induced radioactivities are uniformly distributed in a sample. Since the distance between the sample and the detector is about 8.2 cm, and the thickness of the sample is at most 0.5ЈC1.0 mm, the one-dimensional treatment is reasonably accepted. The
$ f_{s} = \frac{1-{\rm e}^{-{\mu}t}}{{\mu}t}, $  | (2) |
$ F_{\phi} = \frac{\displaystyle\sum\limits_{i = 1}^l N_{{\phi}i}{(1-{\rm e}^{-\lambda_{\rm Nb}T_{i}})}{\rm e}^{-{\lambda_{\rm Nb}}t_{i}}} {\displaystyle\sum\limits_{i = 1}^l N_{{\phi}i}{(1-{\rm e}^{-\lambda_{\rm X}T_{i}})}{\rm e}^{-{\lambda_{\rm X}}t_{i}}}, $  | (3) |
The used standard cross-section data of 93Nb(n, 2n)
2
3.2.Uncertainty estimation
The main uncertainty sources were due to theThe cross-section values were calculated using the default nuclear reaction models and parameters as well as various models for the level density. For the optical model potential, the local parameterization of Koning and Delaroche [15] was used. Since 85Rb is an odd-A nucleus, to take into account direct inelastic scattering, the distorted wave born approximation and the weak coupling model were implemented. Meanwhile, the two-component exciton model for pre-equilibrium processes [16] and the Hauser-Feshebach theory with the Moldauer model for width fluctuation corrections [17, 18] for compound processes were performed. Six different models of the level density were tested. These are the constant temperature and the Fermi gas model [19], the back-shifted Fermi gas model [20], the generalized superfluid model [21, 22], and the other three microscopic models [23-25]. In these level density models, the optimal global and local parameters are based on the mean resonance spacings
The results of calculations are compared with the present cross-section data in Fig. 4. The calculated 85Rb(n, 2n)84Rb reaction cross-section values using different level density models have significant differences between each other, and none of these can reproduce the present data within experimental uncertainties in the entire energy region. At 12 MeV, the microscopic model based on temperature-dependent Hartree-Fock-Bogolyubov calculations using the Gogny force [25] efficiently describes the cross-section. At 13ЈC16 MeV, the calculated data from the back-shifted Fermi gas model and the microscopic model based on Hartree-Fock calculations using the Skyrme force [23] are in good agreement with the present data. At 17ЈC20 MeV, the calculated data from the constant temperature and Fermi gas model are consistent within the experimental uncertainty with the present data. The cross-section data are overestimated below 15 MeV and underestimated above 15 MeV by the microscopic model based on the combinatorial model [24].
 Figure4. (color online) Comparison of theoretically calculated 85Rb(n, 2n)84Rb reaction cross-section with present data (six level density models).
From the calculations, it is evident that the (n, 2n) reaction is in competition with all other open reaction channels, as shown in Fig. 5. For 85Rb, the inelastic scattering is the main competitive channel at the energy range from the (n, 2n) reaction threshold up to 20 MeV. Therefore, the calculated 85Rb(n, 2n)84Rb reaction cross-section values are related to the calculated values of total, elastic scattering, and inelastic scattering cross-sections. The models and parameters of the optical model and level density are crucial for a reliable theoretical calculation. Further, numbers of the discrete level, deformation parameters, and pre-equilibrium strength are important. Since there are not sufficient experimental data for 85Rb, in particular the experimental cross-section data of total, elastic, and inelastic and experimental angular distributions of scattering, as well as the experimental
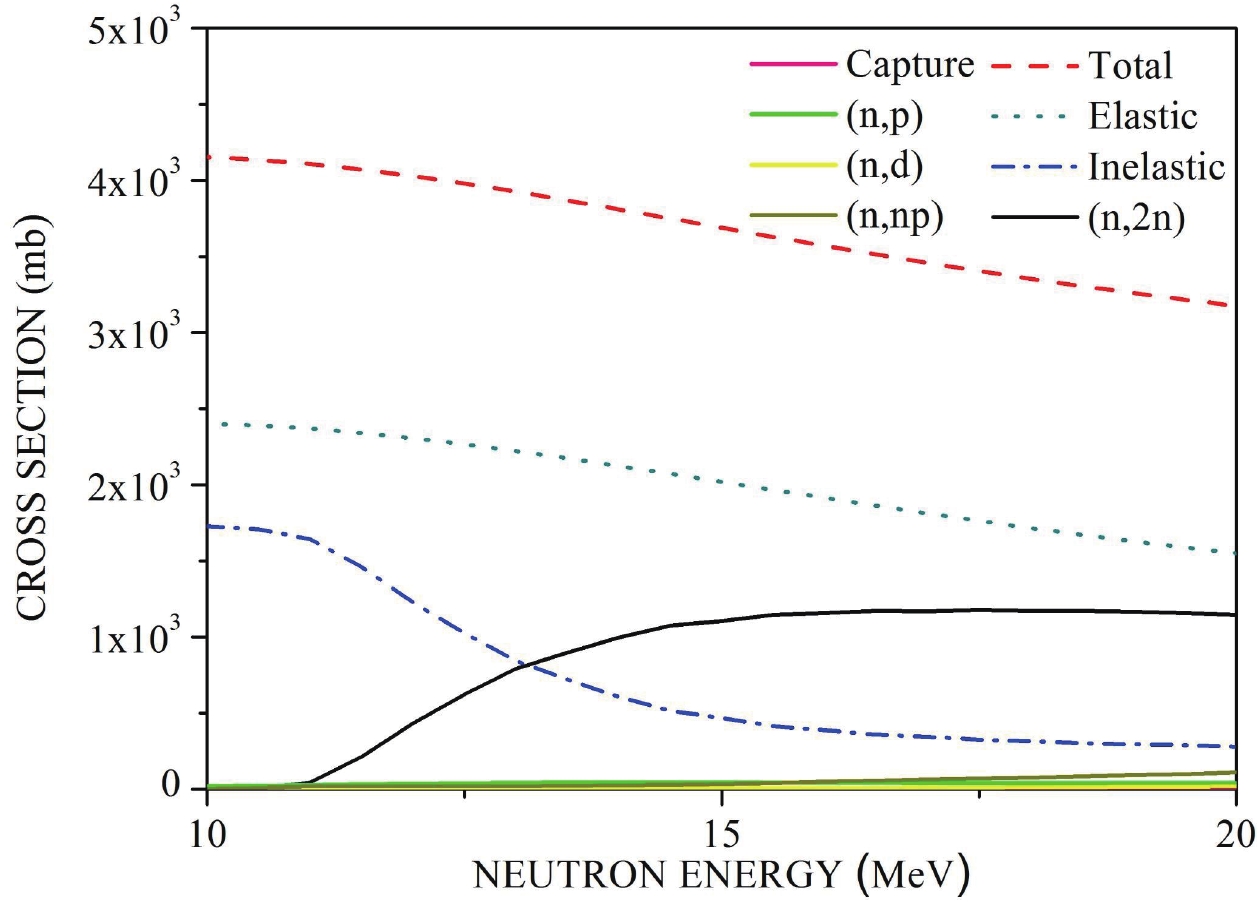 Figure5. (color online) Theoretically calculated values of open channels for neutron induced 85Rb reaction.
| energy /MeV | uncertainty /MeV |   | uncertainty /mb |
| 12.0 | 0.23 | 336 | 18 |
| 13.0 | 0.62 | 785 | 41 |
| 14.0 | 0.81 | 991 | 51 |
| 15.0 | 0.89 | 1126 | 58 |
| 16.1 | 0.96 | 1214 | 62 |
| 17.2 | 0.94 | 1279 | 66 |
| 18.2 | 0.83 | 1296 | 66 |
| 19.2 | 0.58 | 1295 | 65 |
| 19.8 | 0.12 | 1300 | 67 |
Table3.85Rb(n, 2n)84Rb reaction cross-sections from this work.
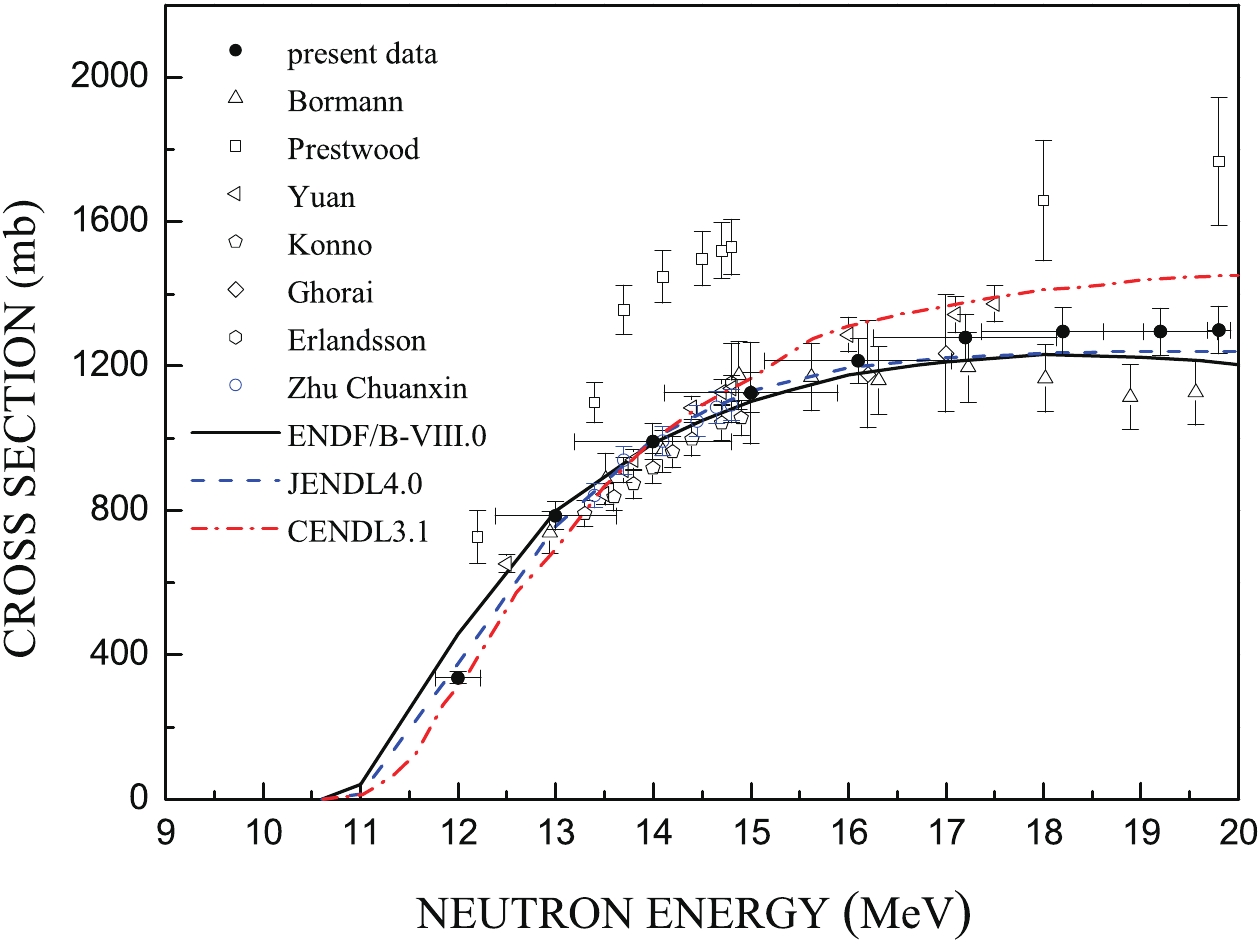 Figure6. (color online) Comparison of cross-section for 85Rb(n, 2n)84Rb reaction.
The experimental data of Ref. [1] are about 40% higher than the ones reported in the present work at 12ЈC20 MeV. The experimental data of Refs. [3, 4, 6, 7] are in agreement with the present work. The experimental data of Ref. [5] are about 3%ЈC6% higher than the ones reported in the present work at 15ЈC17 MeV. The experimental data of Ref. [2] are in good agreement with the present work at 13ЈC15 MeV, and they are about 7%ЈC13% lower than the ones reported in the present work at 15ЈC20 MeV.
The evaluated data from ENDF/B-VIII.0 overestimate the present data at 12 MeV by about 36% and underestimate the present data at 17ЈC20 MeV by 4%ЈC8%. Good agreements are observed between the ENDF/B-VIII.0 data and the present data at 13ЈC16 MeV. The evaluated data from JENDL4.0 are consistent within experimental uncertainty with the present data at 12ЈC16 MeV and underestimate the present data at 17ЈC20 MeV by 4%ЈC8%. The evaluated data from CENDL3.1 are in good agreement with the present data only at 12 MeV and 14 MeV, underestimate the present data at 13 MeV by about 12% and overestimate the present data at 15ЈC20 MeV by 3%ЈC12%. Notably, the total cross-sections from the above mentioned evaluated data libraries are inconsistent. To obtain the evaluated (n, 2n) reaction cross-sections, the level density parameters had to be adjusted according to different experimental data in each evaluation.
The authors are indebted to the accelerator staff, Zhiqiang Wang, Hailong Luo, and Yina Liu for the deuteron beam at the 5SDH-2 1.7MeV Tandem accelerator.
