 ,, 谢紫寒, 王泽宏中山大学地理科学与规划学院 广东省城市化与地理环境空间模拟重点实验室,广州 510275
The spatiotemporal pattern evolution and influencing factors of CO2 emissions at the county level of China
WANG Shaojian,, XIE Zihan, WANG ZehongGuangdong Provincial Key Laboratory of Urbanization and Geo-simulation, School of Geography and Planning, Sun Yat-sen University, Guangzhou 510275, China收稿日期:2021-03-15修回日期:2021-08-17
| 基金资助: |
Received:2021-03-15Revised:2021-08-17
| Fund supported: |
作者简介 About authors
王少剑(1986-), 男, 河南驻马店人, 博士, 副教授, 博士生导师, 中国地理学会会员(S110011019M), 研究方向为城市地理、城市与区域规划。E-mail:

摘要
关键词:
Abstract
Keywords:
PDF (4458KB)元数据多维度评价相关文章导出EndNote|Ris|Bibtex收藏本文
本文引用格式
王少剑, 谢紫寒, 王泽宏. 中国县域碳排放的时空演变及影响因素. 地理学报, 2021, 76(12): 3103-3118 doi:10.11821/dlxb202112016
WANG Shaojian, XIE Zihan, WANG Zehong.
1 引言
碳排放增多引发的全球气候变化已成为各界关注的焦点,推动碳减排政策措施落实到区县一级,是中国促进绿色低碳循环发展和实现可持续城镇化的重要举措。碳排放增多主要源于经济规模扩张[1],而经济增长导致的大规模城镇化进一步刺激了中国能源消费和碳排放的持续增长[2,3],中国已在2009年成为世界第一大碳排放国,2017年碳排放总量占全球比重达23.87%,减排压力巨大。尽管中国正稳步推进碳减排工作,但在保持经济中高速增长的同时实现低碳循环发展,对中国而言依旧是严峻的挑战[4,5]。县域是经济发展和产业转移的基本空间单元和承载体[6],对于实现中国经济结构和发展方式的调整及转变具有重要意义[7],同时也是未来城镇化发展的重要环节[8]。开展县域碳排放研究,精细刻画县域尺度下碳排放时空演变规律及其影响因素,对于促进区域低碳协调发展,提高节能减排政策的科学性、针对性、可操作性具有重要参考价值[9,10]。已有研究在不同视角和地理尺度下测算了碳排放的总量[11]、足迹、强度[12]和绩效,并揭示了碳排放的时空格局演变特征和驱动因素[13]。碳排放测算方面,学界关注的焦点不仅集中于工业[14]、农业[15]、旅游业[13]、交通[16]等不同行业部门,而且近年来能源消费碳排放、土地利用碳排放和贸易隐含碳排放[17,18]方面的文章也逐渐增多,极大丰富了碳排放领域的研究。省域尺度下的碳排放时空格局演变研究表明,中国碳排放具有显著的空间分异和集聚效应,能源消费和交通碳排放的重心均分布在东部沿海地区[19,20]。地级市尺度的研究同样表明碳排放的时空分布具有明显的空间集聚特征,北京、上海、天津、苏州、重庆、成都等大城市的碳排放远高于其他城市[21]。与此同时,马尔科夫转移矩阵表明中国城市碳排放及碳排放强度均具有空间溢出效应,邻近城市间的变动会产生相互影响[12, 22]。碳排放的社会经济影响因素复杂多样[23],****们在扩展STIRPAT框架[24]和引入环境库兹尼茨曲线(EKC)[25]的基础上,主要通过指数分解模型(如对数平均迪氏指数法(LMDI)[26])、结构分解模型(如投入产出分析法[27])和空间计量经济模型[28]综合探讨不同视角下社会经济发展对碳排放的影响。学界主要观点认为经济增长无论在长期上还是在短期上都促进碳排放的增加[29],第二产业为主导的产业结构是碳排放增多的主要原因[1],而技术进步能够有效减少碳排放[30],且相对于发达国家关注碳排放绝对量的减少,中国现阶段的碳减排应主要在于碳排放强度的下降,因此提升能源效率是现阶段保持经济增长的同时实现碳减排目标的主要途径[31],城镇化引发的人口集聚对碳排放同样具有显著的促进作用[32]。此外,交通运输[33]、对外开放[22]和资本投入[34]等也被证实是抑制或促进碳排放的因素。
总体而言,学界针对碳排放已开展了较为系统的研究并取得丰富的成果,对本文具有重要的借鉴作用。但现有研究主要集中于国家和省域尺度,由于能源利用统计数据的缺乏,对县域尺度的研究较少,且已有县域碳排放研究仅仅关注特定区域[9, 35],尚未有研究从全国视角来探讨县域碳排放。其次,多数现有研究仅简单揭示碳排放与社会经济因素间的线性关系,中国区县数量庞大、社会经济背景复杂,延续已有研究的方式难免忽略发展阶段和区域差异,不利于国家及各级政府在提高经济发展质量和稳步推动城镇化进程的基础上,因地制宜地制定切实可行的降碳减污方案。
基于此,本文以中国1908个区县的人均碳排放为研究对象,在分析人均碳排放的整体变化的基础上,通过空间自相关、时空跃迁矩阵等方法在县域尺度下更为精细地刻画碳排放的时空格局演变,完善碳排放时空分布格局在不同尺度下的差异性认识;进一步基于STIRPAT理论框架和EKC假说,采用面板分位数回归模型量化社会经济因素对县域人均碳排放的非线性影响,以揭示不同碳排放水平下节能减排措施实施效果的差异性,为推行阶段化的碳减排措施提供理论基础。
2 研究方法与数据来源
2.1 IPAT模型及其扩展
IPAT(Impact, Population, Affluence, Technology)模型最初由Ehrlich和Holdren提出,用于分析人类发展与环境问题之间的因果关系[36]。在实际运用过程中,IPAT模型被****们不断地补充扩展,并衍生出ImPAT模型和STIRPAT模型。STIRPAT模型是IPAT等式的随机形式表示,可用于EKC曲线等非线性假说的验证并支持对相关变量进行分解和改进[37],其基本表达式为:式中:P、A、T分别表示对环境压力因子I产生影响的人口、财富和技术因素;a代表模型系数;b、c、d代表影响因素指数;e为误差项。
参考已有研究,本文对STIRPAT模型进行相应扩展。研究证实人口因素为碳排放的主要驱动力之一[38,39,40],人口通过生产与消费行为对碳排放产生影响[24]且具有双向效应[41]。相比较人口规模、结构和城市化率等指标,人口密度更反映城镇化进程下人口变动对碳排放水平的影响[42],因此本文选取人口密度(PopDen)表征人口因素。国民富裕程度的提升将使得生产与消费模式产生变动,进而改变碳排放水平[24],本文选取人均GDP(PGDP)和政府一般公共财政支出(PFE)表征影响环境压力的富裕度水平。此外,人均GDP的二次项和三次项被纳入模型中用于检验经济发展与人均碳排放的关系是否符合EKC假说。工业化对于减少碳排放具有决定性作用,而能源利用效率的提升是实现碳减排的关键手段之一[43,44],本文选取碳排放强度(CI)用于表征技术进步对碳排放的影响。由于偏重第二产业的经济结构是中国碳排放的助长因素[22],因此进一步引入第二产业产值规模(IS)指标用于探讨第二产业对县域人均碳排放的影响。为消除通货膨胀等价格因素的影响,人均GDP、财政支出和第二产业产值规模折算成2000年不变价。主要社会经济因素如表1所示,对各变量取自然对数后等式为:
式中:
Tab. 1
表1
表1研究数据概况及来源(2000—2017年)
Tab. 1
| 变量维度 | 变量名称 | 缩写 | 单位 | 区县数量(个) | 来源 |
|---|---|---|---|---|---|
| 环境压力(I) | 人均碳排放量 | PCO2 | t/人 | 1908 | 中国碳核算数据库 |
| 城镇化水平(P) | 人口密度 | PopDen | 人/km2 | 1908 | 人口规模/城市行政面积 |
| 经济发展(A) | 人均地区生产总值 | PGDP | 元 | 1908 | 《中国县域统计年鉴》 |
| 财政投入(A) | 一般公共预算支出 | PFE | 万元 | 1908 | 《中国县域统计年鉴》 |
| 产业结构(T) | 第二产业产值规模 | IS | 万元 | 1908 | 《中国县域统计年鉴》 |
| 技术进步(T) | 碳排放强度 | CI | - | 1908 | 碳排放量/地区生产总值 |
| 变量对数 | 最小值 | 最大值 | 均值 | 标准差 | 样本量 |
| lnPCO2 | -15.7614 | 5.2985 | 1.2207 | 1.1359 | 34344 |
| lnCI | -15.0003 | 11.4358 | 1.0121 | 0.9231 | 34344 |
| lnPopDen | -2.2965 | 9.0840 | 5.1626 | 1.3639 | 34344 |
| lnPGDP | 6.4935 | 13.0268 | 9.0633 | 0.7902 | 34344 |
| lnIS | 4.6052 | 16.0759 | 11.6039 | 1.5056 | 34344 |
| lnPFE | 6.1070 | 15.9838 | 10.4047 | 0.9487 | 34344 |
新窗口打开|下载CSV
2.2 面板分位数回归
通过面板分位数回归旨在量化主要影响因素对不同发展阶段和排放水平区县的人均碳排放影响程度。一般面板回归遵循普通最小二乘法(OLS)估计原理,其本质是条件均值回归[30]。当回归的随机误差项符合正态分布、零均值和齐次方差的古典计量经济学假设时,OLS才满足方差最小的无偏估计条件。当变量存在时空异质性时,数据容易在分布上呈现高峰值、异方差和首尾两端数据偏离大的非正态分布,这种情况在OLS估计过程中容易被忽视从而形成有偏估计[45]。当数据分布为非正态分布或不同分位上回归系数波动较大时,采用分位数回归能够捕捉到被解释变量y在不同分位点水平上受影响的程度,使估计结果更稳健。本文使用含固定效应的面板分位数回归,回归结果不易受异常值的影响且能够更全面地涵盖个体异质性,具体表达式如下:
式中:Yi为人均碳排放;
Koenker[46]通过在模型中引入带有调整参数λ的惩罚项
式中:K为分位数指数;T为变量的观测数量;N为样本区县;X为解释变量矩阵;wk是第k分位数上的权重;
2.3 数据来源
基于数据获取的可行性和完整性,本文选取中国1908个区县作为研究对象,涵盖30个省、直辖市和自治区(受限于数据的可得性,暂未包括西藏自治区、台湾省、香港和澳门特别行政区)。县域碳排放数据来源于中国碳核算数据库(CEAD)(3 中国县域碳排放的时空演变与集聚特征
3.1 县域碳排放的时间序列变化分析
2000—2017年中国县域人均碳排放整体上呈现出以2011年为分界点的“先急后缓”的持续增长状态(图1)。2000—2017年中国平均县域人均碳排放从2.41 t/人增长至8.47 t/人,总体增长率达251.45%,年均增长14.79%。尤其是2001—2011年增长速度较快,年均增长率达21.66%。而“十二五”规划的节能减排具体目标为淘汰落后产能以及促进污染企业升级改造提供了强有力的政策约束,使得2011年后县域人均碳排放增速明显放缓,且在2015年出现明显的回落,2011—2017年的年均增长率仅为1.50%。图1
 新窗口打开|下载原图ZIP|生成PPT
图12000—2017年中国人均碳排放及区域碳排放总量变化趋势
Fig. 1The tendency of per capita CO2 emissions and the total CO2 emissions in the four economic regions of China, 2000-2017
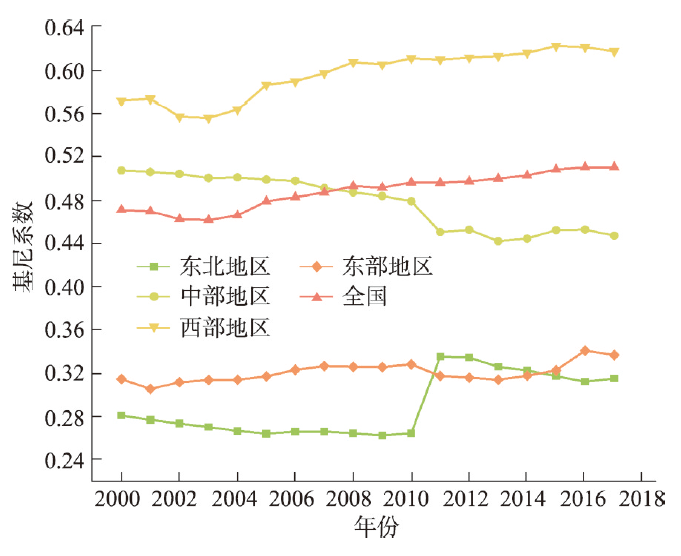
根据四大经济区域的地理划分,核算各区县所在地区碳排放的占比以揭示区域差异(暂未包括西藏自治区、台湾省、香港和澳门特别行政区)(图1)。2000—2017年东部地区碳排放占全国总量的比例维持在40%左右波动,是中国主要的碳排放来源地。相对而言,中部地区和东北地区的碳排放占全国总量的比例在研究期间略微降低;东北地区碳排放总量占全国总量比例在2000年为12%,2017年降至8%,且下降趋势较为平缓,主要原因在于重工业的衰退、生态环境修复的推进与产业结构调整[48];自2006年起,中部地区排放总量占全国总量比例一直维持在18%。伴随着西部大开发战略和丝绸之路经济带的建设,西部地区近年来发展机会与经济投资增多[49],碳排放总量占全国总量的比例在研究期间上升8%。总体来看,中西部地区对中国碳排放总量的贡献越来越大,而东北和东部地区呈现下降趋势。
本文采用基尼系数①(①基尼系数计算公式为:
图2
 新窗口打开|下载原图ZIP|生成PPT
图22000—2017年中国四大经济区域人均碳排放基尼系数变化
Fig. 2The change in Gini coefficients of per capita CO2 emissions in the four economic regions of China, 2000-2017
3.2 县域碳排放的空间分布与集聚特征分析
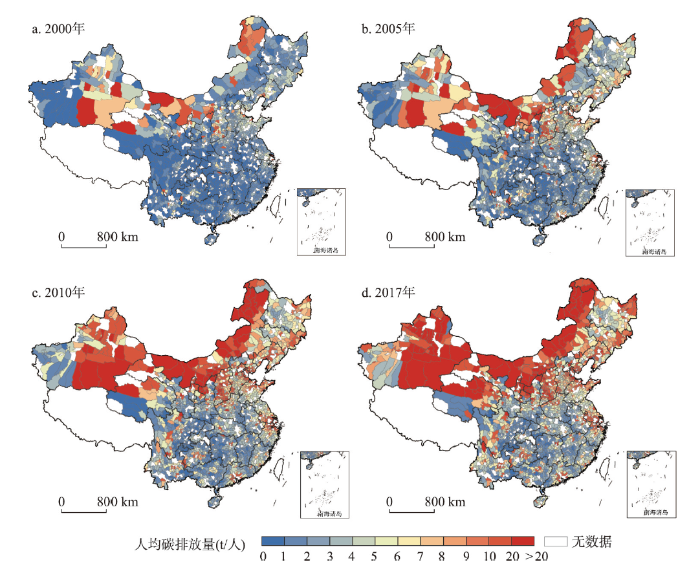
2000—2017年中国各区县的人均碳排放量均有提升,空间分布逐渐趋于稳定,并具有显著的南北分异和空间集聚特征(图3)。区别于已有研究认为中国碳排放总量大致为以胡焕庸线为界呈“东南高西北低”的空间分布格局[50,51],本文发现县域人均碳排放总体上呈现北高南低的空间分布格局。人均碳排放水平高的区县主要集中于内蒙古、新疆、青海、陕西、东北三省等地区。其原因可能在于这些地区煤炭和石化能源丰富,属于传统能源开采和消耗多的省份,城市发展高度依赖碳密集型产业,且相对于东南地区的人口密集县域,上述地区的人口外流情况严重,加上以煤炭为主的能源利用方式相对粗放,使得人均排放保持较高水平。另一方面,相比现有研究认为碳排放高的城市主要集中于中国北部地区和东部沿海城市群[22],在县域尺度下的人均碳排放时空分布表明,除京津冀地区、山东半岛城市群、长三角地区、珠三角地区的人均碳排放水平较高之外,大部分区域人均碳排放水平较高的区县主要以省会城市及其相邻的区县为主。伴随着经济发展和人口集聚,能源需求也不断提升,经济发达区县的人均碳排放水平也逐步上涨,碳排放的“核心—边缘”结构愈发突显。因此,经济发达地区的低碳发展对于中国整体碳减排目标的实现和带动周边地区实现绿色低碳转型的作用越来越重要。图3
 新窗口打开|下载原图ZIP|生成PPT
图32000—2017年中国县域碳排放的时空演变
注:基于自然资源部标准地图服务网站GS(2020)3184号标准地图制作,底图边界无修改。
Fig. 3Spatiotemporal evolution of CO2 emissions in China's counties, 2000-2017
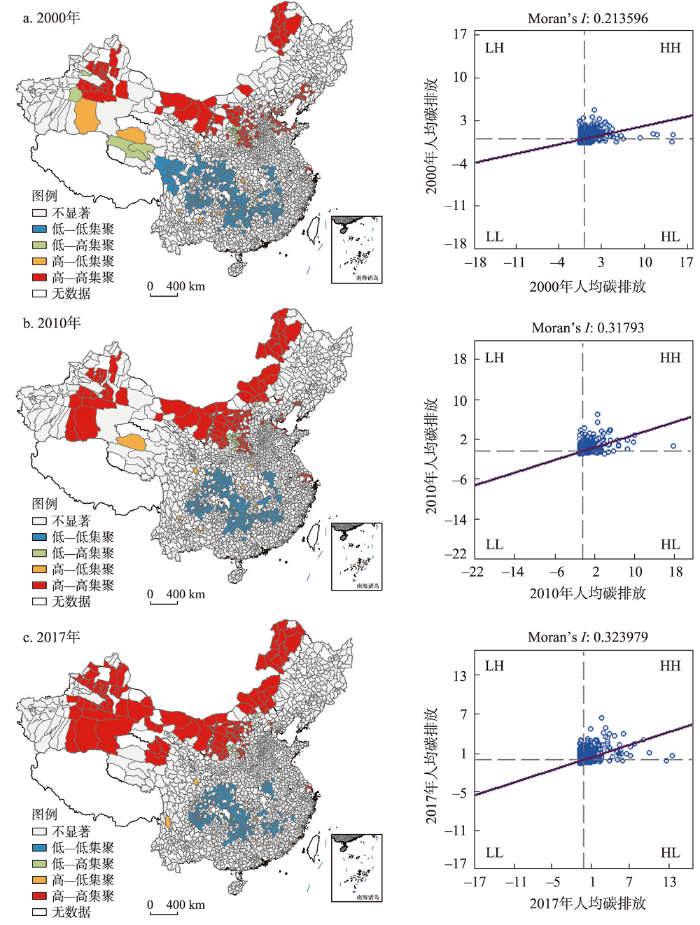
本文采用全局Moran's I指数和LISA分布检验县域碳排放的空间相关性,并刻画其空间集聚特征(图4)。2000—2017年中国县域人均碳排放具有显著的空间自相关性,且相关性不断增强并趋于稳定,空间集聚的模式较为固定。中国县域人均碳排放的Moran's I指数均大于零且在95%的水平上通过显著性检验,人均碳排放水平相似的区县倾向于集中分布(图4)。同时,2000—2017年Moran's I指数逐渐递增,且指数递增速度前期高于后期(Moran's I指数从2000年的0.214上涨至2010年的0.318,2017年为0.324),即县域人均碳排放的空间集聚水平不断提升,并在后期逐渐趋于稳定状态。
图4
 新窗口打开|下载原图ZIP|生成PPT
图42000—2017年中国县域人均碳排放LISA和莫兰散点图
注:基于自然资源部标准地图服务网站GS(2020)3184号标准地图制作,底图边界无修改。
Fig. 4The LISA distribution and Moran's I scatter plot of per capita CO2 emissions in China's counties, 2000-2017
进一步采用LISA图分析县域人均碳排放在局部空间上的集聚和分散情况(图4),发现县域人均碳排放空间聚类分布与地级市人均碳排放[52]及省域人均碳排放[28]的空间聚类分布类似度高。总体上看,县域人均碳排放的空间集聚模式较为固定,高—高集聚(HH)和低—低集聚(LL)是主要的局部空间自相关类型,且高—高集聚的区县数量明显增加,而低—低集聚的区县数量则逐渐减少。一方面,高—高集聚(HH)的区县的分布重心在研究期间逐渐向西北转移,原有的环渤海高—高集聚(HH)区消失,高—高集聚(HH)的区县在后期主要分布在宁夏、山西、内蒙古、新疆、青海等省份;另一方面,低—低集聚(LL)区则在研究期间逐步趋于集中,低—低集聚(LL)的区县在研究后期主要集中于四川、重庆、湖南和江西等地。主要原因可能在于,随着京津冀地区“退二进三”的工业结构调整和环境污染治理工作的展开,碳排放水平正逐步得到有效地控制;而中南地区相对清洁的能源消费结构和碳密集程度较低的制造工业是该地区人均碳排放水平较低的主要原因;但由于东部地区向中西部地区的产业转移主要以高消耗、高排放产业为主,且西部地区逐渐成为中国重要的能源基地,因此使得高—高集聚(HH)的区县的分布重心向西北转移的同时低—低集聚(LL)的区县数量也在减少。此外,西北地区能源消费水平随着城市发展得到较大提高,但能源利用和降碳技术的改进相对发达地区的区县具有滞后性,在一定时期内的碳排放水平突破路径依赖的瓶颈具有难度。
为揭示县域人均碳排放集聚类型的转移情况,采用LISA时空跃迁矩阵追踪县域人均碳排放空间关联类型的相互转移过程。时空跃迁的类型分为4类,类型Ⅰ为仅县域城市本身发生跃迁;类型Ⅱ为县域城市本身未跃迁,邻域县市发生跃迁;类型Ⅲ是县域城市和邻域县市均发生跃迁;类型Ⅳ是县域城市本身和邻域县市均未发生跃迁。空间的凝聚程度越高,则发生跃迁的概率越小,人均碳排放的路径依赖效应也就越显著。从表2判断,2000—2017年以Ⅳ类型跃迁为主,不同类型间的时空跃迁发生次数很少。2000—2005年空间凝聚度达99.005%,2005—2017年人均碳排放的时空结构存在很强的空间锁定效应和“俱乐部趋同”现象,并且呈现相当稳定的状态。
Tab. 2
表2
表22000—2017年中国县域尺度人均碳排放的时空跃迁矩阵
Tab. 2
| 年份 | 空间关联模式 | HHt+1 | HLt+1 | LLt+1 | LHt+1 |
|---|---|---|---|---|---|
| 2000—2005 | HHt | Ⅳ(147) | Ⅱ(0) | Ⅲ(0) | Ⅰ(0) |
| HLt | Ⅱ(2) | Ⅳ(7) | Ⅰ(1) | Ⅲ(0) | |
| LLt | Ⅲ(0) | Ⅰ(1) | Ⅳ(227) | Ⅱ(0) | |
| LHt | Ⅰ(0) | Ⅲ(0) | Ⅱ(0) | Ⅳ(17) | |
| 2005—2010 | HHt | Ⅳ(136) | Ⅱ(0) | Ⅲ(0) | Ⅰ(0) |
| HLt | Ⅱ(0) | Ⅳ(10) | Ⅰ(0) | Ⅲ(0) | |
| LLt | Ⅲ(0) | Ⅰ(0) | Ⅳ(207) | Ⅱ(0) | |
| LHt | Ⅰ(0) | Ⅲ(0) | Ⅱ(0) | Ⅳ(13) | |
| 2010—2017 | HHt | Ⅳ(110) | Ⅱ(0) | Ⅲ(0) | Ⅰ(0) |
| HLt | Ⅱ(0) | Ⅳ(5) | Ⅰ(0) | Ⅲ(0) | |
| LLt | Ⅲ(0) | Ⅰ(0) | Ⅳ(163) | Ⅱ(0) | |
| LHt | Ⅰ(0) | Ⅲ(0) | Ⅱ(0) | Ⅳ(5) |
新窗口打开|下载CSV
4 中国县域人均碳排放的影响因素分析
4.1 模型检验
在回归分析前对变量的相关性、多重共线性、正态分布及序列单位根情况进行检验,以确保模型的稳健性和回归结果的可信度。变量间的方差膨胀因子(VIF)的最大值为4.50,均值为2.41,低于10这一警戒值,说明不存在严重的共线性问题。数据正态检验方面,所有变量的偏度值在偏离程度和方向上均符合正态分布假设。在分位数Q-Q图中,部分变量与Y = X的正态分布线拟合程度较差,分位数回归相比OLS回归更具适用性,变量一阶差分后呈现平稳状态且不存在单位根。4.2 人口,财富和技术因素对人均碳排放的效应分析
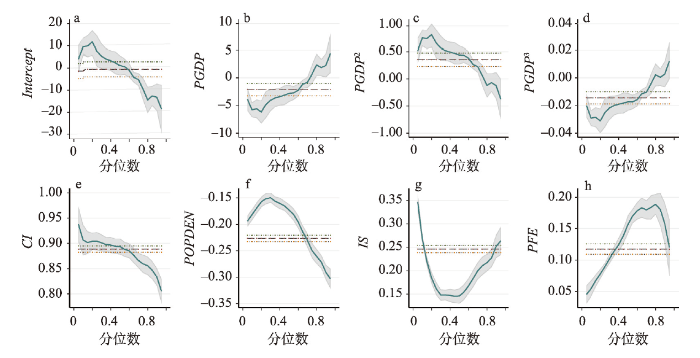
参考Lin等[53]的研究,本文设置10th、25th、50th、75th和90th 5个分位数指数来评估影响因素之间的关系和人均碳排放的不同条件分布。表3为人均碳排放的影响因素面板分位数回归结果,图5为影响因素的弹性系数分布。Tab. 3
表3
表3人均碳排放的影响因素面板分位数模型回归估计结果
Tab. 3
| 影响因素 | 分位数 | 固定效应 | ||||
|---|---|---|---|---|---|---|
| 10th | 25th | 50th | 75th | 90th | ||
| lnPopDen | -0.18218*** (-28.555) | -0.15187*** (-21.685) | -0.17282*** (-27.010) | -0.24991*** (-54.692 ) | -0.29087*** (-39.553) | -0.20069*** (-76.88) |
| lnCI | 0.90664*** (158.487) | 0.90433*** (171.892) | 0.89386*** (205.112) | 0.85964*** (153.908) | 0.83368*** (113.389) | 0.95526*** (342.30) |
| lnIS | 0.26706*** (25.618) | 0.16169*** (19.225) | 0.14599*** (18.188) | 0.21041*** (30.355) | 0.25208*** (34.522) | 0.30189*** (78.71) |
| lnPFE | 0.05451*** (-10.758) | 0.08925*** (26.564) | 0.15641*** (24.127) | 0.18372*** (29.201) | 0.15736*** (13.609) | -0.05577*** (-9.77) |
| lnPGDP | -5.78257*** (12.350) | -4.82953*** (-3.245) | -2.84177 *** (-4.162) | 0.65888 (0.555) | 2.23077 (1.620) | 1.48360*** (3.06) |
| lnPGDP2 | 0.74913*** (-12.793) | 0.65329*** (3.775) | 0.43963 *** (5.697) | 0.06170 (0.456) | -0.12378 (-0.788) | -0.10288 (-1.95) |
| lnPGDP3 | -0.02913*** (6.010) | -0.02523*** (-3.775) | -0.01738 *** (-5.991) | -0.00433 (-0.847) | 0.00265 (0.447) | 0.00335 (1.76) |
新窗口打开|下载CSV
图5
 新窗口打开|下载原图ZIP|生成PPT
图5人均碳排放的影响因素回归弹性系数分布
Fig. 5Quantile regression flexibility coefficients distribution of independent variables on per capita CO2 emissions
人口密度的回归系数为负,且在1%的置信水平上显著,表明人口集聚对于人均碳排放具有抑制作用,相对中低分位区县,人口密度对碳排放的抑制作用在高分位区县更为显著。城镇化带动了人口和其他资源的集聚,人口的集聚使能源利用和交通方式产生改变[54],通过规模效应降低了边际减排成本[55],因此,当经济正外部性溢出明显时,人口密度的提升有利于能源资源的有效配置和集约利用[32],进而降低县域人均碳排放水平。碳排放强度与第二产业产值规模对县域人均碳排放在不同分位数上均存在1%显著水平的正效应,表明第二产业产值和碳排放强度的提升会促进县域人均碳排放的增多。第二产业产值规模反映了地区工业产业的发达程度,碳排放强度反映了能源利用效率。一方面,碳排放强度回归系数随分位提高而变小,碳排放强度的正效应逐渐减弱,表明在区县碳排放水平由低变高过程中通过改进生产技术能有效抑制碳排放量增速。工业化在带动经济发展的同时也刺激了碳排放,工业部门对高分位和低分位区县的碳排放具有更明显的驱动作用,产业结构调整是处于高分位和低分位区县实现碳减排和发展转型的关键[44]。另一方面,碳排放强度对于县域人均碳排放的影响在各个分位上均远高于其他社会经济因素,即相对于单一地调整产业结构,现阶段中国大部分区县应该通过提高能源利用效率,降低单位产值的碳排放量,才能够在维持自身发展的同时通过技术创新、降低高耗高排产业比重、能源消费结构调整等手段逐步实现绿色转型发展。
政府公共财政投入对于县域人均碳排放具有显著的负效应,模型回归系数表明,财政投入对中高分位区县碳排放的抑制作用尤其关键。财政对公共环境卫生事业和基础设施建设的支出,如公共交通设施、水电设施和重大生态环境项目投资等方面具有正外部经济效应时,有利于社会和生态环境的优化。人均GDP与县域人均碳排放水平呈非线性关系。在10th、25th和50th分位上人均GDP与人均GDP的二次方、三次方弹性系数分别为负、正、负,且在1%的可信度水平上显著,表明中低分位区县的经济发展水平与县域碳排放之间存在典型的倒“N”型曲线关系,文章结果与邵帅等[5]的发现一致。在地区发展的早期阶段,产业集聚具有正外部性,经济活动集聚产生的规模经济效应能够有效抑制县域人均碳排放的增加。当经济发展越过第一个拐点时,产业规模的扩大和能源消费的增长明显刺激了碳排放水平的上升,尤其是在能源密集型产业为主导产业的地区;并且,此阶段的环境规制尚未完善,企业用能和污染排放较为随意,将进一步加重资源紧缺和环境压力。当经济发展水平到达第二个拐点后,由于原有经济增长的传统动力衰竭,在新兴产业和节能环保技术迅速发展背景下,产业集聚的正外部性再次现显,加之更加严苛和完善的环境政策,从而倒逼经济发展转型和企业生产技术更新,因此经济发展水平的提高在此阶段对人均碳排放又呈现抑制效应。
与此同时,分位数回归系数分布图(图5)揭示了社会经济因素对于县域人均碳排放的影响具有阶段性差异:人口密度和政府财政投入对中高分位区县的人均碳排放的抑制效应大于低分位区县;碳排放强度和第二产业产值规模对低分位区县的碳排放增加有更显著的促进作用。相比较面板分位数回归的结果,OLS固定效应回归所估计的人口密度、碳排放强度和第二产业产值规模对县域人均碳排放的正负效应相同,政府财政投入对县域人均碳排放的作用相反,且经济发展水平与县域人均碳排放间呈不显著的“N”型曲线关系,这与分位数回归模型结果有所差异。
5 结论与讨论
5.1 结论
本文以县域人均碳排放为研究对象,首先分析中国县域人均碳排放变化趋势和区域差异,其次探讨县域人均碳排放的时空分布格局和空间集聚特征,最后基于STIRPAT模型和EKC假说通过面板分位数回归讨论了县域人均碳排放的影响因素。主要结论如下:(1)2000—2017年中国县域人均碳排放整体上呈现“先急后缓”的持续增长状态,2011年为分界点;中部地区与东北地区碳排放量占比所有减少,西部地区碳排放量占比稳步提升,东部地区碳排放量占比维持在40%左右;全国县域人均碳排放基尼系数高于0.4的警戒值,且呈上升趋势,东部地区与东北地区的县域人均碳排放基尼系数较低,内部差异小,中部地区人均碳排放基尼系数逐步下降但内部差距仍较大,西部地区县域人均碳排放差距悬殊,且上升趋势明显。
(2)中国县域人均碳排放具有明显的南北分异,整体上北部区县的人均碳排放高于南部地区,且县域人均碳排放的空间极化趋势显著,东部沿海各大城市群和省会城市等经济发达区县的人均碳排放远高于其他区县;县域人均碳排放具有显著的空间正相关性,高—高集聚(HH)地区数量逐渐增多且重心向西北移动,低—低集聚(LL)地区数量有所减少,主要分布于中南地区;此外,LISA时空跃迁矩阵表明人均碳排放存在“俱乐部趋同”效应。相比已有研究认为高碳排放地区主要集中于中国北部地区和东部沿海城市群,本文通过县域人均碳排放研究完善了碳排放时空分布格局在不同尺度下的差异性认识,发现东部沿海各大城市群和省会城市等经济发达区域的人均碳排放更高,这些区域对中国现阶段和未来碳减排的作用不容忽视。
(3)人口集聚、政府公共财政支出有助于抑制县域人均碳排放,而碳排放强度和第二产业产值规模同人均碳排放具有显著的正向关系,碳排放强度对县域人均碳排放的影响远高于第二产业产值规模,因此相比单一地进行产业结构调整,通过生产技术改进降低碳排放强度对于碳减排具有更重要的作用;中低分位区县的经济发展与碳排放之间存在倒“N”型曲线关系,长远来看,通过政策调控和市场手段相互配合,加快经济发展经过第二次拐点有利于提前实现社会可持续的低碳发展模式。人口集聚和财政投入对中高分位区县碳排放的抑制作用相对低分位区县更明显,碳排放强度和第二产业产值规模对低分位区县的影响大于中高分位区县。碳减排政策的制定和实施应考虑县域发展的阶段性差异,社会经济发展结构的调整是实现整体碳减排的关键。一方面,科学合理的促进人口向城镇集聚以及增加政府公共财政投入对于人均碳排放水平较高的区县实现绿色低碳发展具有显著的推动作用;另一方面,应通过技术创新降低高耗高排产业比重、优化能源消费结构等手段实现低人均碳排放区县的可持续低碳发展。
5.2 讨论
本文所使用的CEAD夜间灯光反演碳排放数据为区县级尺度研究提供了更精准的数据基础,通过采用粒子群优化—反向传播(PSO—BP)算法实现了DMSP/OLS和NPP/VIIRS两套卫星影像数据的衔接[56],将能源相关碳排放的测算推进至2017年,提高了数据的时效性。该数据填补了统计数据在微观尺度的能源数据的空白,被国内外****广泛应用于城市扩张、人口和交通等社会经济因素评估、污染物和碳排放量的测算等研究中[50,51]。但由于缺乏真实县域碳排放数据,故该数据也缺乏稳健性验证。“十四五”时期是实现碳达峰碳中和目标的重要机遇期,推动能源消费结构性改善和减污降碳政策落实到区县,是改善生态环境和可持续发展的关键举措。县域城市因社会经济发展阶段差异,碳排放水平存在明显的空间异质性,且社会经济活动向大都市圈、城市群的集聚趋势愈发明显,经济发达区县的碳排放量也将持续大幅度增加,因此需要重视这些地区在碳减排中的先导作用。首先,通过区县合作和地方政策解锁“俱乐部趋同”效应,促进东部发达区县对西北后发区县的技术和资金溢出和带动,实现区域间社会经济和生态环境的协调发展。其次,经济发展与县域人均碳排放之间的倒“N”型关系启示,应发挥集聚效应和规模效应的优势,加快越过第二次拐点,实现社会经济发展与碳排放的解耦。再次,碳排放强度的提高促进碳排放量增加,在生产活动中需加快传统能源利用技术的转换升级,降低单位产值的能耗和排放水平。提高清洁能源在能源构成中的比重,通过引导能源消费结构的多元化来优化能源生产结构达到碳减排目的。此外,人口政策的制定需考虑地区差异,引导人均碳排放水平高的区县人口适当向城镇集聚,提高城市建设的紧凑度,实现公共资源和设施的集约利用。最后,财政支持需从中央落实到区县政府乃至乡镇政府,推动城镇基础设施服务的绿色化和鼓励企业改进生产技术,实现高碳排放区县社会经济发展的低碳转型。中国的大部分县域处于碳排放的中分位区,是采取碳减排行动最有效的时期,由于在短期内难以改变以煤炭为主的能源结构,发挥市场规模优势,降低碳减排技术推广成本,通过技术创新降低碳排放强度是当前中国碳减排的主要路径。
参考文献 原文顺序
文献年度倒序
文中引用次数倒序
被引期刊影响因子
DOI:10.11820/dlkxjz.2012.04.007 [本文引用: 2]

Against the background of global climate change, studies on the carbon emissions, economic growth and industrial structure interrelate and interact with each other as a whole. Scholars in the global climate change area have been paying more and more attention to the interaction and mechanism effects of the complex system. On the basis of reviews of studies at home and abroad, this paper clarifies the interactive and mutual restraint relationship between carbon emissions and the two factors mentions above. The article also reviews and summaries relevant research methods on this topic. According to the comprehensive reviewing, the main contents are as follows: economic analysis of the carbon emissions, the relationship study between industrial development and carbon emissions, the economic losses on the carbon emission reduction, and the research on the low-carbon economy, low-carbon development, urbanization and carbon emissions, and international carbon flow. The main research methods include: econometrics, mathematical statistics, scenario analysis, model simulation, input-output analysis, carbon footprint, and so on. The quantitative and qualitative investigations complement each other. As regards to the research progress, the contents shift from basic analysis to practical application; the theories shift from sustainable development and circulation economy to low carbon economy; research methods tends to be integrated; research perspective starts to involve the community, the family and the individual behavior at the micro-scale. In the future, the writers think that the research theoretical system on carbon emissions and economic- industrial system, methodological innovation and regional studies should be enhanced. Simultaneously, the research should explore our research models and frameworks that are suitable for China. Further work is expected to be the research scale to fill research gaps and offset weaknesses.
[本文引用: 2]
URL [本文引用: 2]
DOI:10.1021/acs.est.9b00103URL [本文引用: 1]
DOI:10.13249/j.cnki.sgs.2021.08.003 [本文引用: 2]
Carbon emission control is the main problem and measure of ecological protection and high-quality development in the Yellow River Basin. Carbon emission at county level research can provide more accurate theoretical support for collaborative governance and sustainable development of the Yellow River Basin. Spatial panel model, spatial autocorrelation analysis and spatial Markov chain with regional background and nearest neighbor as spatial lags were used to analyze the spatiotemporal pattern and spatial effect of carbon emissions in counties of the Yellow River Basin from 2000 to 2017, the results showed that: 1) the carbon emission in the Yellow River basin has increased dramatically since 2000; the high carbon emissions areas, Shandong province and the boundary between Shaanxi, Gansu, Ningxia and Inner Mongolia, expands to the outer circle layer and the axial direction, forming the spatial pattern of high in the east and low in the west; 2) there is a phenomenon of “club convergence”; the high carbon emission counties converge in Shandong province and the boundary between Shaanxi, Gansu, Ningxia and Inner Mongolia; the low carbon emission counties converge in the southwest; the comparison between 2000 and 2017 shows that county carbon emission type has strong stability; counties which tranfered from higher carbon emission type to lower carbon emission type are concentrated in the southeast region, while counties that change in the opposite direction are concentrated in Inner Mongolia. 3) high carbon spillover effect and low carbon locking effect are important forces to shape the spatiotemporal pattern and the former is stronger; the regional background enhances “club convergence” and the convergence of surrounded outliers and its acting force was stronger than the nearest neighbor; the probability of carbon emission type transition in insignificant regions increased; 4) the spatial panel model shows that increase of carbon emissions and its spatial effect are promoted by young population structure, large economy, industrial structure dominated by the secondary industry, high living standard and high public expenditure; economy and industrial structure are important driving factors.
[本文引用: 2]
[本文引用: 2]
[本文引用: 2]
DOI:10.11821/dlyj020171169 [本文引用: 1]
As the basic spatial unit and industrial carrier, the county bears significant importance in Chinese economic system, and the spatial disparity of county economic development played a vital role in understanding the evolution of spatial pattern of regional economic development. Therefore, the study on its spatial-temporal difference and the analysis of its influencing factors seem distinctly important. This paper analyzed the dynamics of spatial cluster of county economic development and its spatial-temporal evolution pattern by adopting spatial analysis of ArcGIS, and taking the NICH index and per capita real GDP as measure indicators. The results showed that: From 2001 to 2015, the spatial pattern of economic growth vitality and economic development level is basically consistent; as for the economic growth vitality, the county and city unevenly developed and its overall vitality declined, making county economic revitalization facing great challenge. Hot spot analysis helped us to understand spatial economic agglomeration state of counties in Gansu. The hot and cold spots of economic growth vitality remain relatively stable, which showed a "dumbbell-shaped" spatial pattern whose gravity center leaned towards northwest, and this pattern was gradually strengthened. The hot spots showed a clear "pole-axis" spatial pattern. The cold spots were mainly distributed in the south part of Longdong Region and the Southern Minority Region, which are spatially aggregated beyond the development axis. The main driving factors of the spatial difference of county economy included regional investment level, economic basis, and market scale. In addition, the obvious interaction between the influencing factors improved the contribution of the single factor. There were obvious regional differences in the leading factors influencing county economy development. Based on the dominant mechanism of driving factors, this study could provide scientific reference for functional orientation of county economy and its integrated development in Gansu province.
[本文引用: 1]
[本文引用: 1]
[本文引用: 1]
DOI:10.11821/dlxb201502001 [本文引用: 1]
The "National New Urbanization Planning (2014-2020)" (hereinafter referred to as "Planning") marks a significant transformation in China's urbanization development process, with the core of human urbanization, and the general requirement of seeking advance in stability. This paper elaborates the authors' preliminary thoughts on the formation of the "Planning" mainly from the speed and quality aspects of the urbanization development. Urbanization level should be consistent with industrial restructuring, the amount of new jobs, the actual ability of absorbing rural population, and water-soil resource and environment capacity of the urban area, etc. The large scale and high speed urbanization development in China has resulted in severe environment pollution, great pressures on the infrastructure, and huge challenge to the supporting capacity of natural resources. Urbanization is an important frontier scientific issue with obvious cross disciplinary feature, which is also a complex system. The interdisciplinary human economic geography has outstanding advantages and solid research foundation in the field of urbanization research. Therefore, facing the significant realistic demand of the national new urbanization, we should do some in-depth research and tracking studies in this field.
[本文引用: 1]
DOI:10.1021/es001204iURL [本文引用: 2]
[本文引用: 2]
[本文引用: 1]
[本文引用: 1]
[本文引用: 1]
[本文引用: 1]
DOI:10.11821/dlxb201906005 [本文引用: 3]
Since the Paris Climate Change Conference in 2015, reducing carbon emission and lowering carbon intensity has become a global consensus to deal with climate change. Due to different economic development stages, carbon intensity is regarded as a better index to measure regional energy-related carbon emissions. Although previous scholars have made great efforts to explore the spatiotemporal patterns and key driving factors of carbon intensity in China, the results lack the perspective from city level because of limited availability of statistical data of city-level carbon emission. In this study, based on carbon intensity of 283 cities in China from 1992-2013, we used the kernel density estimation, spatial autocorrelation, spatial Markov-chain and quantile regression panel model to empirically reveal its spatial spillover effects and explore the critical impact factors of carbon intensity at the city level. Our result indicates that although the total carbon emission increased during the study period, carbon intensity saw a gradual decline and regional differences were shrinking. Secondly, the city-level carbon intensity presented a strong spatial spillover effect and diverse regional backgrounds exerted heterogeneous effects on regions. Thirdly, quantile panel data analysis result showed that for low-intensity cities, on the one hand, FDI and transport sector were main contributing factors, and economic growth, technical progress and high population density negatively affected carbon intensity. On the other hand, industrial activity, extensive growth of investment and urban sprawl were key promoting factors for high-intensity cities, and population density was beneficial to emission reduction task. Furthermore, technological advance has not exerted negative influence on carbon intensity in high-intensity cities. At last, we suggested that Chinese government should take different carbon intensity levels into full consideration before policy making.
[本文引用: 3]
[本文引用: 2]
[本文引用: 2]
[本文引用: 1]
[本文引用: 1]
[本文引用: 1]
[本文引用: 1]
DOI:10.11821/dlxb201802010 [本文引用: 1]
Numerous studies have examined the influencing factors of CO2 emissions from transportation at the national, city and community levels. However, fewer studies have considered the effect of residential self-selection. Ignoring this effect is likely to result in underestimating the role of the built environment, thus affecting relevant planning and policy development. Is the effect of residential self-selection in Chinese cities the same as in Western cities? How and to what extent does the built environment affect CO2 emissions from travel after controlling for the effect of residential self-selection? To address these questions, this paper first measures the CO2 emissions from travel on the basis of the Travel Intelligent Query System (TIQS) developed by us on the Baidu map LBS (Location Based Service) open platform, and 1239 questionnaires conducted in 15 communities in Guangzhou in 2015. It develops a structural equation model (SEM) to examine the effects of the influencing factors on CO2 emissions of trips with different purposes. The results show that the effect of residential self-selection also exists in Chinese cities. Changing residents' preference of travel mode will help reduce travel-related CO2 emissions. After controlling the effect of residential self-selection, the built environment still has significant effects on CO2 emissions from travel. Although some of them are direct effects, others are indirect effects that work through mediating variables, such as car ownership and travel distance. For different trip purposes, the mechanisms of CO2 emissions are not the same. Specifically, the distance to city public centers has a significant positive total effect on CO2 emissions from commuting trips, which is an indirect effect. Residential density significantly affects CO2 emissions from social, recreational and daily shopping trips, but it has no significant effect on CO2 emissions from commuting trips. Bus stop density is positively associated with CO2 emissions from commuting trips, and negatively associated with CO2 emissions from social and daily shopping trips. In addition, land-use mix has a negative effect on CO2 emissions from commuting, social and daily shopping trips, and metro station density and road network density have significant negative effects on CO2 emissions from all types of trip. These results suggest that it is necessary to comprehensively consider the effects of the built environment on CO2 emissions from different types of trip, and carry out targeted intervention on the built environment in related planning and policy development so as to guide the public to change their travel behavior and to promote low-carbon travel.
[本文引用: 1]
[本文引用: 1]
[本文引用: 1]
[本文引用: 1]
[本文引用: 1]
[本文引用: 1]
[本文引用: 1]
DOI:10.18306/dlkxjz.2016.06.008 [本文引用: 1]
Global warming due to greenhouse gases (such as CO2) emissions posts serious challenges to the sustainable development of the human society. Based on the reference method provided by the Intergovernmental Panel on Climate Change, this study calculated the CO2 emissions of energy consumption in 30 provinces of China (excluding Tibet) from 1995 to 2014. Using exploratory spatial data analysis (ESDA), LISA time path, spatiotemporal transitions, and standard deviation ellipse analysis methods, the authors analyzed the spatiotemporal dynamics of carbon emissions of energy consumption. The results show that: (1) there was a significant positive spatial correlation of carbon emissions of energy consumption in China’s provinces during 1995-2014. The inter-provincial carbon emissions differences first decreased then increased; (2) by means of LISA time path analysis, this study found that the majority of the Chinese provinces had a stable spatial structure of carbon emissions. Eighteen provinces had shorter than average time path lengths in 1995-2001 and 2002-2014. The majority of the southern provinces showed a fluctuating spatial dependence with increasing amplitude over time, while most of the northern provinces showed a relatively stable trend; (3) according to the directional Moran scatter plot, the number of provinces that showed the same trend decreased from 13 in 1995-2001 to 10 in 2002-2014, indicating that the spatial coherence of carbon emissions change at the provincial level had weakened; (4) spatial correlation patterns and clustering of carbon emissions by energy consumption at the provincial level were relatively stable and showed certain degree of path-dependence or lock-in character; (5) carbon emissions gravity center was between 113.739°~114.324°E, 34.475°~35.036°N and was moving to the northwest. The spatial distribution of provincial emissions presented a northeast-southwest pattern, and had the tendency of shifting to a north-south pattern. The focus of carbon emission reduction in China is to accelerate the development of clean energy, improve energy efficiency, promote the optimization and upgrading of energy and industrial structures in all provinces, make differentiated carbon emission reduction policies for different provinces, and establish carbon trading market.
[本文引用: 1]
URL [本文引用: 1]
DOI:10.11821/dlxb201803003 [本文引用: 4]
Carbon emissions are increasing due to human activities related with the energy consumptions for economic development. Thus, attention has been paid to the reduction of the growth of carbon emissions and formulation of policies for addressing climate change. Although most studies have explored the driving forces behind carbon emissions in China, literature lacks studies at the city-level due to a limited availability of statistics on energy consumptions. In this study, based on China's city-level remote sensing carbon emissions from 1992 to 2013, we applied the spatial autocorrelation, spatial Markov-chain transitional matrices, dynamic spatial panel model and Sys-GMM to empirically estimate the key determinants of carbon emissions at the city-level and discuss its spatial spillover effects in consideration of spatiotemporal lag effects and different geographical and economic weighting matrices. Results indicated that the regional inequalities of city-level carbon emissions decreased over time and presented an obvious spatial spillover effect and high-emission "club" agglomeration. In addition, the evolution of the emission pattern has the characteristic of obvious path dependence. Panel data analysis results indicated that there was a significant U-shaped curve that can reflect the relationship between carbon emissions and GDP per capita. In addition, carbon emissions per capita are increasing with economic growth for most cities. High-proportion of secondary industry and extensive growth of investment exerted significantly positive effects on China's city-level carbon emissions. Conversely, rapid population agglomeration, the improvement of technology level, the increase of trade openness and road density play an inhibiting role in carbon emissions. Therefore, in order to reduce carbon emissions, the Chinese government should inhibit the effects of promotion factors and enhance the effects of mitigation factors. Combining with the analysis of results, we argued that optimizing the industrial structure, streamlining the extensive investment, increasing the level of technology and improving the road accessibility are the effective ways to increase energy savings and reduce carbon emissions in China.
[本文引用: 4]
DOI:10.11820/dlkxjz.2015.02.004 [本文引用: 1]
Climate change has in recent years become an environmental issue globally. Through deepening research into and analysis of the phenomenon, most climate scientists now identify greenhouse gases, most notably CO2 emissions, as constituting the main cause of global warming. Based on literature study and comparative analysis, this article discusses the progress of the research of CO2 emissions from a multidisciplinary perspective and analyzes the calculation methods, intensity, performance, influencing factors, and forecasting methods of CO2 emissions. This article also discusses the remaining issues and future directions of the research on CO2 emissions. Results indicate that the research of CO2 emissions has gained fruitful achievements and has experienced rapid development in recent years. CO2 emission is an integrated, complex, interdependent system engineering of numerous variables interplay between different factors. Under the framework of multidisciplinary integration, geographical and spatial factors have however received insufficient attention. Research scale has mainly focused on global and international levels, although recent studies have begun to highlight multi-scale research and pay attention to scale effect. Panel study of provincial and city scales is still scarce. Panel data are gradually receiving attention; however, dynamic analysis and comparative assessment still need improvement. Future research should focus on creating more detailed and comprehensive datasets, exploring multi-scale integrated research, and highlighting city scale analysis. Furthermore, future study should emphasize adapting theories to localized practices, employing systemic thinking and methods for differentiated trend research.
[本文引用: 1]
[本文引用: 3]
[本文引用: 3]
[本文引用: 1]
[本文引用: 1]
[本文引用: 1]
[本文引用: 1]
[本文引用: 1]
[本文引用: 1]
[本文引用: 2]
[本文引用: 2]
[本文引用: 1]
[本文引用: 1]
URL [本文引用: 2]
[本文引用: 1]
[本文引用: 1]
DOI:10.13249/j.cnki.sgs.2019.04.014 [本文引用: 2]
Urbanization and real estate investment are important influencing factors of carbon emission in a region. Therefore, it is necessary to systematically analyze and test the internal impact mechanism of urbanization and real estate investment on carbon emission. Combining the deformation of Kaya identity and LMDI decomposition, this article decomposes the carbon emission changes of 30 provinces in China (due to data limitation, the data of Hong Kong, Macao, Taiwan and Tibet are not included in the study area) from 1997 to 2015. The spatial evolution characteristics of carbon emissions in Chinese provinces are described by Moran’s I index and LISA spatial agglomeration map. This article further uses the spatial panel data model to empirically test the effects of urbanization and real estate investment on carbon emission from both direct impact and spatial spillover effects. The results are as follow: First, from the time trend, China’s carbon emission has maintained a growth trend from 1997 to 2015. From the perspective of the decomposition factors of carbon emission, the carbon emission coefficient of real estate investment is the main driving factor to curb carbon emissions, while the intensity of urban real estate investment, the level of urbanization and the change of total population in the region have positive effects on carbon emission, and the effects are increasing year by year. Second, from the spatial distribution characteristics of carbon emission, there are significant differences for the carbon emission in the provincial-level, and the distribution characteristics are generally expressed as higher carbon emission in the east and lower in the west. The spatial concentration of provinces with less carbon emission has increased, and the regional differences among them have been shrinking. Third, from the regression results of the spatial panel data model, the direct impact of urbanization on carbon emission is significantly negative, but the spatial spillover effect is significantly positive. The direct effect of the intensity of urban real estate investment on carbon emission is positive, but its spillover effect is not significant. The direct effect and spatial spillover effect of the interaction between urbanization and the intensity of urban real estate investment are significantly negative. The direct effect and spatial spillover effect of economic development on carbon emission are significantly positive. The direct impact of government investment on carbon emission is significantly negative, but the spillover effect is not significant. Industrial structure has no significant direct effect on the carbon emission, but its spatial spillover effect is negatively negative. The degree of opening to the outside world has a significant negative direct effect on the carbon emission, but it has a positive effect on the carbon emission in the adjacent areas. With the improvement of the level of urbanization and economic development, there is a significant U-shaped and inverted U-shaped curve relationship between the two and carbon emission, respectively. This article further proposes countermeasures and suggestions to improve regional carbon emission reduction from the perspective of urbanization and real estate policies.
[本文引用: 2]
[本文引用: 1]
[本文引用: 1]
[本文引用: 1]
[本文引用: 1]
[本文引用: 1]
[本文引用: 1]
PMID:5545198 [本文引用: 1]
DOI:10.1016/S0921-8009(03)00188-5URL [本文引用: 1]
DOI:10.1016/S0921-8009(02)00223-9URL [本文引用: 1]
DOI:10.1016/S0140-6736(12)60958-1URL [本文引用: 1]
DOI:10.1073/pnas.1908513117URL [本文引用: 1]
[本文引用: 1]
[本文引用: 1]
[本文引用: 1]
[本文引用: 1]
[本文引用: 1]
[本文引用: 1]
[本文引用: 2]
[本文引用: 2]
URL [本文引用: 1]
DOI:10.1016/j.jmva.2004.05.006URL [本文引用: 1]
DOI:10.1016/0304-4076(94)01652-GURL [本文引用: 1]
[本文引用: 1]
[本文引用: 1]
[本文引用: 1]
[本文引用: 1]
DOI:10.11821/dlxb202101016 [本文引用: 2]
The global environment issue resulting from carbon emissions has aroused worldwide concern for governments, the public and scientific communities. A precise measurement of the time-resolved and spatial distribution characteristics of carbon dioxide (CO2) and carbon footprint as well as its long-period evolution mechanism, can help clarify the relationship between environmental carbon load and economic growth, and are critical references to the formulation of scientific carbon emission reduction targets with reasonable and differential emission reduction policies. In this study, the mainland of China is taken as the research object. According to the quantitative correlations between DMSP-OLS nighttime light image data and carbon emission statistics, the carbon emission panel data model was simulated for China's carbon emissions in the period 2000-2013, and then the spatiotemporal evolving trend and spatial distribution characteristics of carbon emissions in the 14-year research period were discussed using Theil-Sen Median trend analysis and Mann-Kendall test method. Based on the framework of exploratory spatial-temporal data analysis (ESTDA), the spatial pattern and spatiotemporal dynamic evolution of carbon footprint from 2001 to 2013 were analyzed from the perspective of spatiotemporal interaction. In the three periods, the decoupling effect between environmental carbon load and economic growth of 336 prefecture-level cities were analyzed using the improved Tapio decoupling model. The results show that the overall carbon emissions in China had been on the rise from 2000 to 2013, in which the stable-slow rise type was dominant. China's carbon footprint and carbon deficit increased year by year, and the central and western regions became the focus of the growth of carbon footprint and carbon deficit from 2001 to 2013. At different administrative city scales, the spatial distribution pattern of carbon footprint and carbon deficit show obvious administrative orientated and spatial zonal differentiation characteristics. The annual average of global Moran's I index of each level unit is 0.491, which indicates that there is a significant spatial auto-correlation feature in the carbon footprint of China's prefecture-level units. The relative length of the LISA time path is greater in the north than in the south, and it tends to increase from the coastal areas to the central and western regions. The curvature of LISA time path decreases from coastal areas to inland areas on the whole. The curvature of northeast and central regions is higher, while that of eastern and western regions is lower. There is a different trend of the decoupling effect of environmental carbon load in China. Meanwhile the expansion-connection and expansion of negative decoupling regions continuously increased and spatially agglomerated, presenting an "E"-shaped distribution pattern from the north to the south. The national average decoupling elastic value is gradually increasing, while the coefficient of variation continues to decline, and the decoupling type has a significant evolution trend. Therefore, the unbalanced trend of economic growth and carbon emissions in China will continue for a certain period.
[本文引用: 2]
[本文引用: 2]
[本文引用: 2]
DOI:10.1016/j.apenergy.2017.05.085URL [本文引用: 1]
DOI:10.1016/j.rser.2018.05.065URL [本文引用: 1]
[本文引用: 1]
[本文引用: 1]
[本文引用: 1]
[本文引用: 1]
URL [本文引用: 1]
