 ,1, 宋帅峰2, 张丽娟,1, 王子晴2, 任崇1, 李永生3,4
Changes in global air temperature from 1981 to 2019
SHEN Beibei,1, SONG Shuaifeng2, ZHANG Lijuan,1, WANG Ziqing2, REN Chong1, LI Yongsheng3,4通讯作者:
收稿日期:2020-09-14修回日期:2021-08-31
| 基金资助: |
Received:2020-09-14Revised:2021-08-31
| Fund supported: |
作者简介 About authors
沈贝蓓(1985-), 女, 山东淄博人, 博士生, 主要从事地表过程与环境演变研究。E-mail:

摘要
关键词:
Abstract
Keywords:
PDF (3073KB)元数据多维度评价相关文章导出EndNote|Ris|Bibtex收藏本文
本文引用格式
沈贝蓓, 宋帅峰, 张丽娟, 王子晴, 任崇, 李永生. 1981—2019年全球气温变化特征. 地理学报, 2021, 76(11): 2660-2672 doi:10.11821/dlxb202111005
SHEN Beibei, SONG Shuaifeng, ZHANG Lijuan, WANG Ziqing, REN Chong, LI Yongsheng.
1 引言
以显著变暖为特征的全球气候变化已深刻影响了人类的生存和发展[1,2,3,4,5,6],全球气候变暖已成为全球关注的焦点。IPCC第五次报告指出,1880—2012年全球海陆表面平均温度升高了0.85 ℃[7];2018年10月IPCC进一步提出全球较工业革命前升温1.5 ℃的结论[8],引起了各国政府和社会公众的高度关注。多位****认为20世纪80年代以来是全球陆地气温升高速率最快的时期[9,10,11,12,13,14,15],而有的****认为全球变暖自1998年起已经停滞[16],因此,进一步科学认知20世纪80年代以来的全球陆地气温变化,是全球变化研究关注的关键科学问题,而清晰地界定和比较20世纪80年代以来全球气温变化,是实现建立全球气候治理体系的重要依据。现有研究一致认为20世纪80年代以来气温呈增加趋势,但增温速率有所差异。Hansen等得出1979—2010年全球气温变化速率为0.141~0.321 ℃/10a[11,12,13];基于ERA-Interim数据,Kim等认为1979—2012全球气温变化趋势为0.110 ℃/10a;Chu等[15]分析了MERRA数据,提出1981—2010全球气温变化趋势为0.130 ℃/10a;Wang等[10]、Xu等[17]基于CRUTEM4.4.0.0、CMA-LAST数据,得到1979—2014年全球气温变化速率为(0.304±0.060) ℃/10a、(0.272±0.025) ℃/10a;Sun[9]利用CMA-LASTv1.0、CRUTEM4.1.1、GHCN-V3.2.0数据,分析得到1979—2015年全球气温变化速率分别为0.250 ℃/10a、0.254 ℃/10a、0.273 ℃/10a。综合以上研究结果,得出20世纪80年代以来全球气温变化速率分布在0.110~0.304 ℃/10a之间。
也有****对20世纪80年代以来全球气温的空间变化特征进行了研究。如Chu等[15]采用CMA-LAST数据,认为1979—2014年高纬度地区气温升高最快;Kim等[14]利用ERA-Interim再分析数据明确了1979年以来全球地表最强变暖区域位于北极地区;Screen等[18]发现,1979—2013年北半球高纬度地区(70°N~80°N)升温速率为0.86 ℃/10a,明显高于中纬度地区(30°N~40°N)的升温速率(0.30 ℃/10a)。而Wang等[10]采用CRUTEM4.4.0.0数据进一步得到了,1977—2014年气候变暖覆盖了所有的全球陆地地区的结论。尽管以上****涉及到全球陆地气温空间变化特征,但明确界定国家尺度上气温变化值,尚没有相关研究。因此,本文采用多套再分析数据分析了1981—2019年全球气温变化的空间差异性,并比较了多个国家的气温变化速率及变化量,为全球变化提供科学依据,制定积极应对气候变化的国家战略提供科学支撑。
2 资料来源与处理
目前,国际上已发布了20多套再分析数据集,本文选择空间分辨率较高、连续性好,而且实时更新,可信度较高,应用频率较高的7套再分析数据(CRU、NCEP/NCAR、NCEP/DOE、CFSR、ERA5、GHCN-CAM、JRA55)开展研究。CRU数据由东英吉利大学(East Anglia)气候研究所发布(Climatic Research Unit, CRU),空间分辨率为0.5°×0.5°;NCEP/NCAR由美国国家环境预测中心(National Centers for Environmental Prediction,NCEP)与美国大气研究中心(National Center for Atmospheric Research, NCAR)发布,数据空间分辨率为1.875°×1.875°;NCEP/DOE由美国国家环境预测中心(NCEP)与美国能源部(United States Department of Energy,DOE)联合发布,空间分辨率为1.875°×1.875°;CFSR(Climate Forecast System Reanalysis, CFSR)由美国国家环境预测中心(NCEP)发布,空间分辨率为0.5°×0.5°;ERA5由ECMWF(European Centre for Medium-range Weather Forecast)发布,空间分辨率为0.25°×0.25°;GHCN-CAM(下文简称GHCN)数据是全球历史气候学网络和气候异常监测系统(GHCN+CAMS)收集的两个大型观测站数据集的组合,空间分辨率为0.5°×0.5°;JRA55由日本气象厅JMA(Japan Meteorological Agency)发布,空间分辨率为1.25°×1.25°。分别在
运用ArcGIS 10.5软件对以上数据进行Kriging空间插值及重采样,得到空间分辨率为0.5°×0.5°的栅格数据。
3 分析方法
3.1 趋势分析方法
时间序列的气温长期变化趋势采用线性倾向估计方法分析[19],建立气温变量(y)与所对应时间(x)的一元线性回归方程:式中:a为线性回归系数,表示气温要素变化速率,a为正值表示气温呈上升趋势,a为负值表示气温呈下降趋势。
3.2 方差分析
方差分析是检验多组样本总体平均数的假设测验方法,是将总变异剖分为各个变异来源的相应部分,从而发现各变异原因在总变异中相对重要程度的一种统计分析方法[19]。构成统计量:式中:统计量F服从自由度
4 结果与分析
4.1 全球年平均气温再分析资料的比较与选择
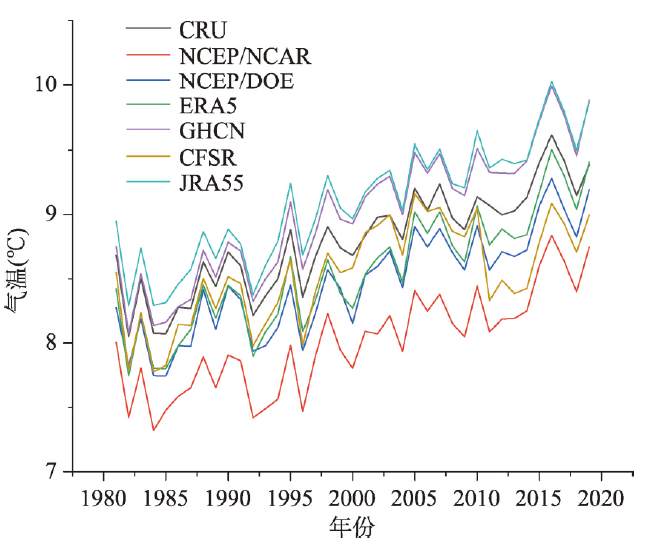
由于再分析数据来源不同,本文首先对7套再分析数据进行比较和筛选,以免影响分析结果的准确性。相关分析结果表明,数据之间相关系数为0.858~0.996,均为极显著相关(P < 0.01,表1),方差分析结果也表明7套再分析数据无显著差异(P > 0.05),说明7套再分析数据可同时用于分析全球气温变化特征。因此,本文选用7套再分析数据进行后续计算。7套再分析数据年平均气温时序变化曲线如图1所示。Tab. 1
表1
表1全球7套再分析气温数据间相关系数
Tab. 1
| CRU | NCEP/NCAR | NCEP/DOE | ERA5 | GHCN | CFSR | JRA55 | |
|---|---|---|---|---|---|---|---|
| CRU | 1 | 0.974** | 0.983** | 0.987** | 0.993** | 0.872** | 0.992** |
| NCEP/NCAR | 1 | 0.984** | 0.982** | 0.968** | 0.866** | 0.975** | |
| NCEP/DOE | 1 | 0.989** | 0.977** | 0.884** | 0.978** | ||
| ERA5 | 1 | 0.983** | 0.858** | 0.988** | |||
| GHCN | 1 | 0.865** | 0.996** | ||||
| CFSR | 1 | 0.863** | |||||
| JRA55 | 1 |
新窗口打开|下载CSV
图1
 新窗口打开|下载原图ZIP|生成PPT
图11981—2019年全球平均气温时序变化
Fig. 1Changes of global annual temperature reanalysis data from 1981 to 2019
4.2 1981—2019年全球年平均气温变化特征
4.2.1 全球年平均气温的时序变化特征 7套再分析数据表明(表2),1981—2019年全球年平均气温变化速率分别为0.310 ℃/10a(CRU)、0.283 ℃/10a(NCEP/NCAR)、0.307 ℃/10a(NCEP/DOE)、0.347 ℃/10a(ERA5)、0.403 ℃/10a(GHCN)、0.231 ℃/10a(CFSR)、0.358 ℃/10a(JRA55),均呈极显著增温趋势(P < 0.01),介于0.231~0.403 ℃/10a之间,7套数据的气温变化速率平均为0.320 ℃/10a,呈极显著升高趋势(P < 0.01)。1981—2019年,全球陆地年平均气温分别由8.518 ℃增加到9.353 ℃,增加了0.835 ℃。7套数据平均结果表明,南、北半球年平均气温变化速率平均为0.147 ℃/10a、0.362 ℃/10a,呈极显著增加趋势(P < 0.01),北半球年平均气温增加速率远远大于南半球。Tab. 2
表2
表21981—2019年全球、北半球和南半球平均气温和变化速率
Tab. 2
| CRU | NCEP/NCAR | NCEP/DOE | ERA5 | GHCN | CFSR | JRA55 | 平均值 | ||
|---|---|---|---|---|---|---|---|---|---|
| 平均气温 (℃) | 全球陆地 | 8.793 | 8.008 | 8.460 | 8.556 | 9.002 | 8.541 | 9.093 | 8.636 |
| 北半球 | 5.612 | 4.974 | 5.397 | 5.488 | 5.939 | 5.579 | 6.139 | 5.590 | |
| 南半球 | 21.623 | 20.493 | 21.063 | 21.179 | 21.532 | 20.795 | 21.450 | 21.162 | |
| 气温变化速率(℃/10a) | 全球陆地 | 0.310** | 0.283** | 0.307** | 0.347** | 0.403** | 0.231** | 0.358** | 0.320** |
| 北半球 | 0.347** | 0.332** | 0.364** | 0.380** | 0.439** | 0.271** | 0.403** | 0.362** | |
| 南半球 | 0.161** | 0.081** | 0.072* | 0.211** | 0.267** | 0.066 | 0.169** | 0.147** |
新窗口打开|下载CSV
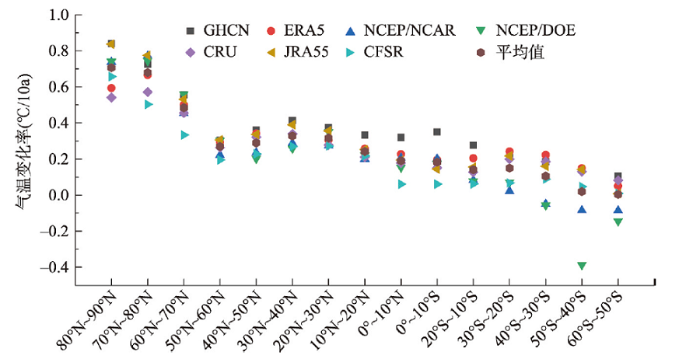
7套再分析数据表明(图2),北半球各纬度年平均气温增加速率均大于南半球相应纬度。除南半球部分纬度外,其余各纬度均呈显著增温趋势。7套数据分析结果均一致表明北半球高纬度地区年平均气温升高速率最大,升高速率最大的区域位于80°N~90°N,速率为0.707 ℃/10a,其次是70°N~80°N和60°N~70°N区域,速率分别为0.680 ℃/10a、0.484 ℃/10a;40°N~50°N和50°N~60°N区域,升温速率变小(表3)。南半球年平均气温增加速率随纬度增加而减小,但30°S~60°S区域,NCEP/NCAR和NCEP/DOE资料显示出年平均气温的降温趋势。
图2
 新窗口打开|下载原图ZIP|生成PPT
图21981—2019年全球不同纬度气温变化速率分布
Fig. 2Distribution of temperature change rate at different latitudes from 1981 to 2019
Tab. 3
表3
表31981—2019年全球各纬度年平均气温变化量及变化速率
Tab. 3
| 纬度范围(°N) | 变化速率(℃/10a) | 变化量(℃) | 纬度范围(°S) | 变化速率(℃/10a) | 变化量(℃) |
|---|---|---|---|---|---|
| 80~90 | 0.707** | 2.757 | 0~10 | 0.182** | 0.710 |
| 70~80 | 0.680** | 2.652 | 20~10 | 0.141** | 0.550 |
| 60~70 | 0.484** | 1.888 | 30~20 | 0.150** | 0.585 |
| 50~60 | 0.270** | 1.053 | 40~30 | 0.105** | 0.410 |
| 40~50 | 0.289** | 1.127 | 50~40 | 0.02 | 0.078 |
| 30~40 | 0.328** | 1.279 | 60~50 | 0.004 | 0.016 |
| 20~30 | 0.316** | 1.232 | |||
| 10~20 | 0.242** | 0.944 | |||
| 0~10 | 0.191** | 0.745 |
新窗口打开|下载CSV
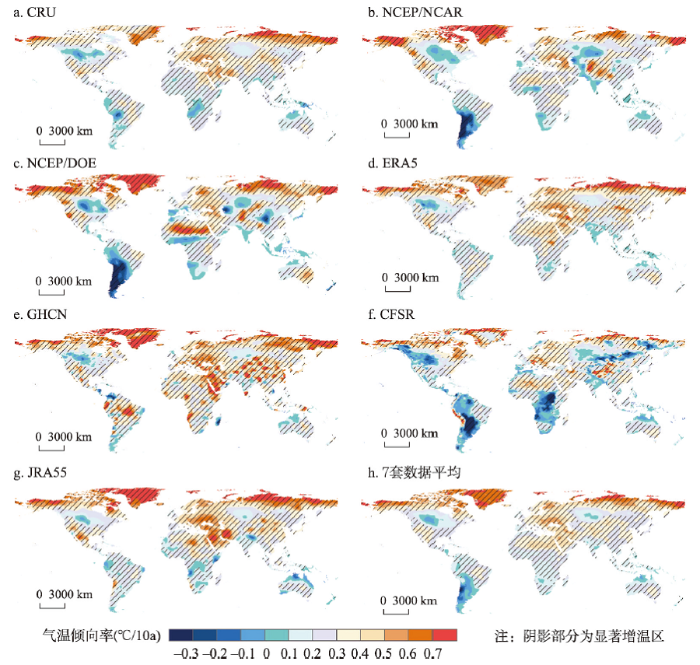
4.2.2 全球年平均气温变化的空间变化特征 7套全球再分析数据年平均气温空间变化表明(图3),1981—2019年全球陆地表面具有增温趋势面积占陆地面积的比例分别达到98.176%(CRU)、94.490%(NCEP/NCAR)、91.428%(NCEP/DOE)、99.405%(ERA5)、98.324%(GHCN)、85.373%(CFSR)、98.225%(JRA55),且气温显著升高区域(P < 0.05)的面积分别占陆地面积比例为82.543%(CRU)、68.874%(NCEP/NCAR)、67.889%(NCEP/DOE)、82.373%(ERA5)、83.454%(GHCN)、54.519%(CFSR)、81.043%(JRA55),说明全球陆地表面气温基本呈增加趋势,7套数据平均值显示显著增温区达到80%以上。
图3
 新窗口打开|下载原图ZIP|生成PPT
图31981—2019年全球再分析气温变化速率空间分布
Fig. 3Spatial distribution of global reanalysis temperature tendency rate from 1981 to 2019
为了进一步确定全球气温显著增加区的空间分布特征,本文将7套再分析平均气温的显著增温区进行叠加,提取重叠区,进行1981—2019年全球显著增温区的空间描述(图3h)。可以看出,1981—2019年全球年平均气温显著增加区主要集中分布在北美洲的加拿大东部及北部(0.594 ℃/10a)、格陵兰岛部分地区(0.687 ℃/10a)、亚洲的俄罗斯东部(0.692 ℃/10a)和北部(0.594 ℃/10a)、中东地区(0.446 ℃/10a)、非洲的北部(0.435 ℃/10a)、欧洲南部(0.469 ℃/10a)等区域,括号内的值代表区域的平均值。其中,俄罗斯东部地区是全球气温升高速率最大的区域。4.2.3 全球主要国家或地区的年平均气温空间变化特征 为进一步探究全球年平均气温空间变化的差异性,提取各个国家或地区年平均气温的变化特征。为了保证数据精度,本文舍弃国土面积较小的国家,共得到146个国家或地区的气温变化率和气温变化量。结果表明,1981—2019年146个国家中表现出增温趋势的国家或地区所占比例分别为98.630%(CRU)、97.945%(GHCN)、95.205%(NCEP/NCAR)、91.096%(NCEP/DOE)、100%(ERA5)、95.890%(JRA55)、88.356%(CFSR),其中呈显著增温趋势的所占比例分别可达95.205%(CRU)、95.890%(GHCN)、84.247%(NCEP/NCAR)、67.808%(NCEP/DOE)、97.260%(ERA5)、87.671%(JRA55)、65.735%(CFSR)。将7套数据计算结果进行平均,按平均值计算气温变化率,然后进行比较(表4)。结果显示,全球统计的146个国家或地区中,1981—2019年有136个国家或地区年平均气温呈显著增加趋势(P < 0.05)占93.151%,其中,呈极显著增温(P < 0.01)国家或地区130个,比例达89.041%;气温无显著变化(P > 0.05)国家比例仅为6.849%;仅有3个国家气温呈下降趋势(阿根廷、智利和巴拉圭)(P > 0.05),占2.055%。全球气温不显著变化或降温变化的国家均位于南半球,主要分布在南美洲大陆西岸和非洲南部等地,其它区域气温均呈显著增加趋势。增温最快的地区主要位于40°N以北地区,气温变化速率超过0.45 ℃/10a。其中格陵兰、俄罗斯等高纬度国家和地区增温速率较快,尤以格陵兰地区增加速率最快,变化速率为0.654 ℃/10a(图4)。增温最慢的地区主要位于新西兰和赤道附近的南美洲、东南亚、非洲南部等地,气温变化速率不足0.15 ℃/10a。
Tab. 4
表4
表41981—2019年全球主要国家和地区气温变化速率7套数据平均值(℃/10a)
Tab. 4
| 国家或地区 | 变化速率 | 国家或地区 | 变化速率 | 国家或地区 | 变化速率 | 国家或地区 | 变化速率 |
|---|---|---|---|---|---|---|---|
| 格陵兰 | 0.654** | 克罗地亚 | 0.365** | 西撒哈拉 | 0.232** | 南非 | 0.169** |
| 乌克兰 | 0.533** | 拉脱维亚 | 0.363** | 缅甸 | 0.232** | 刚果(金) | 0.167** |
| 俄罗斯 | 0.523** | 丹麦 | 0.361** | 哈萨克斯坦 | 0.230* | 塞拉利昂 | 0.167** |
| 罗马尼亚 | 0.517** | 比利时 | 0.356** | 科特迪瓦 | 0.230** | 厄瓜多尔 | 0.162** |
| 斯洛伐克 | 0.511** | 蒙古 | 0.330** | 中非 | 0.225** | 多米尼加 | 0.158** |
| 匈牙利 | 0.504** | 苏丹 | 0.329** | 乌干达 | 0.217** | 赞比亚 | 0.153** |
| 芬兰 | 0.503** | 阿富汗 | 0.329** | 老挝 | 0.214** | 安哥拉 | 0.150** |
| 塞尔维亚 | 0.502** | 吉布提 | 0.327** | 喀麦隆 | 0.211** | 秘鲁 | 0.146** |
| 亚美尼亚 | 0.474** | 希腊 | 0.326** | 坦桑尼亚 | 0.211** | 马来西亚 | 0.146** |
| 波黑 | 0.473** | 黑山 | 0.323** | 印度 | 0.207** | 爱尔兰 | 0.145* |
| 挪威 | 0.471** | 阿尔及利亚 | 0.322** | 几内亚 | 0.207** | 圭亚那 | 0.144** |
| 保加利亚 | 0.459** | 不丹 | 0.320** | 加蓬 | 0.203** | 苏里南 | 0.142** |
| 阿塞拜疆 | 0.455** | 科索沃 | 0.317** | 英国 | 0.199** | 博茨瓦纳 | 0.142 |
| 吉尔吉斯斯坦 | 0.454** | 美国 | 0.316** | 柬埔寨 | 0.199** | 葡萄牙 | 0.141* |
| 叙利亚 | 0.453** | 乍得 | 0.309** | 泰国 | 0.197** | 津巴布韦 | 0.132* |
| 土耳其 | 0.446** | 埃塞俄比亚 | 0.296** | 索马里 | 0.196** | 古巴 | 0.130** |
| 白罗斯 | 0.444** | 中国 | 0.293** | 西班牙 | 0.193** | 哥伦比亚 | 0.129** |
| 约旦 | 0.442** | 尼泊尔 | 0.293** | 南苏丹 | 0.192** | 斯里兰卡 | 0.124** |
| 沙特阿拉伯 | 0.441** | 也门 | 0.288** | 马达加斯加 | 0.192** | 印度尼西亚 | 0.121** |
| 伊朗 | 0.440** | 瑞士 | 0.278** | 纳米比亚 | 0.191** | 孟加拉国 | 0.121** |
| 波兰 | 0.435** | 土库曼斯坦 | 0.276** | 布隆迪 | 0.19** | 哥斯达黎加 | 0.115** |
| 伊拉克 | 0.434** | 肯尼亚 | 0.275** | 巴西 | 0.187** | 伯利兹 | 0.114** |
| 捷克 | 0.433** | 马里 | 0.275** | 摩洛哥 | 0.187** | 菲律宾 | 0.105** |
| 阿联酋 | 0.420** | 毛里塔尼亚 | 0.269** | 布基纳法索 | 0.184** | 巴拿马 | 0.104* |
| 冰岛 | 0.408** | 意大利 | 0.264** | 塞内加尔 | 0.182** | 莱索托 | 0.096 |
| 厄立特里亚 | 0.406** | 韩国 | 0.264** | 马拉维 | 0.181** | 巴布亚新几内亚 | 0.09** |
| 埃及 | 0.402** | 乌兹别克斯坦 | 0.263** | 刚果(布) | 0.181** | 尼加拉瓜 | 0.081* |
| 德国 | 0.402** | 巴基斯坦 | 0.262** | 危地马拉 | 0.180** | 新西兰 | 0.069 |
| 瑞典 | 0.401** | 墨西哥 | 0.262** | 尼日利亚 | 0.180** | 洪都拉斯 | 0.055 |
| 加拿大 | 0.393** | 朝鲜 | 0.262** | 越南 | 0.178** | 玻利维亚 | 0.047 |
| 爱沙尼亚 | 0.390** | 法国 | 0.261** | 加纳 | 0.176** | 乌拉圭 | 0.044 |
| 奥地利 | 0.387** | 阿尔巴尼亚 | 0.253** | 利比里亚 | 0.174** | 东帝汶 | 0.024 |
| 荷兰 | 0.387** | 索马里兰 | 0.250** | 几内亚比绍 | 0.174** | 巴拉圭 | -0.005 |
| 尼日尔 | 0.386** | 塔吉克斯坦 | 0.249** | 莫桑比克 | 0.174** | 阿根廷 | -0.022 |
| 利比亚 | 0.381** | 阿曼 | 0.244** | 澳大利亚 | 0.174** | 智利 | -0.114 |
| 立陶宛 | 0.366** | 日本 | 0.243** | 委内瑞拉 | 0.172** | ||
| 格鲁吉亚 | 0.365** | 突尼斯 | 0.233** | 贝宁 | 0.171** |
新窗口打开|下载CSV
图4
 新窗口打开|下载原图ZIP|生成PPT
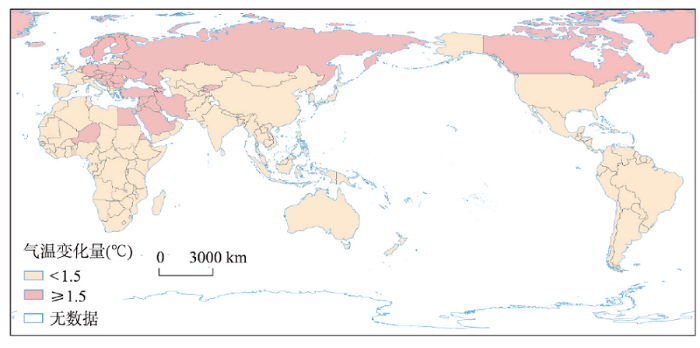
图41981—2019年全球年平均气温升温1.5 ℃以上的国家和地区分布
注:基于自然资源部标准地图服务网站GS(2016)1667号的标准地图制作,底图边界无修改。
Fig. 4Spatial distribution of countries and regions of the warming of 1.5 ℃ from 1981 to 2019
1981—2019年7套数据平均值显示,年平均气温升高2.0 ℃以上的国家或地区有4个;1.5~2.0 ℃的国家有30个;升高1.0~1.5 ℃的国家或地区有34个;升高0.5~1.0 ℃的国家有60个;升高0~0.5 ℃以下的国家或地区有15个;降温0~1.0℃国家有3个。即1981—2019年全球增温在1.5 ℃以上的国家34个,增温在1.0 ℃以上的国家68个,分别占统计的国家的23%和47%,升温1.5 ℃以上的国家占1/4,1.0 ℃以上的国家约占50%(表4)。
5 讨论
(1)不同****采用不同数据源,分析了不同时段全球气温变化率(表5),与本文研究结果进行比较。可以看出,采用的数据源不同,分析时段不一样,其结果稍有差异。本文基于7套再分析数据,得出1981—2019年全球陆地气温年变化速率为0.231~0.403 ℃/10a,与已有研究分析结果相比,其值略高。分析其原因,主要是因为研究时段不一样。同样,比较北半球和南半球陆地气温变化率的研究结果,出现差异的原因同样是由于研究时段和所采用的数据源不同造成的,但结果均在合理的范围内。Tab. 5
表5
表520世纪80年代以来不同作者研究结果比较
Tab. 5
| 研究区域 | 研究时段 | 研究数据 | 气温变化速率(℃/10a) | 文献来源 | 研究区域 | 研究时段 | 研究数据 | 气温变化速率(℃/10a) | 文献来源 |
|---|---|---|---|---|---|---|---|---|---|
| 全球 | 1979—2010 | GISS | 0.171 | [13] | 北 半 球 | 1979—2015 | CMA-LASTv1.0 | 0.319 | [19] |
| GHCN | 0.175 | 1979—2014 | CMA-LAST | 0.305±0.030 | [17] | ||||
| HadCRUT3v | 0.170 | 1979—2010 | CRUTEM4 | 0.350 | [20] | ||||
| RSS | 0.157 | 1979—2010 | ERA-Interim | 0.380 | |||||
| UAH | 0.141 | 1981—2019 | CRU | 0.347 | 本文 | ||||
| 1979—2015 | CMA-LASTv1.0 | 0.250 | [9] | NCEP/NCAR | 0.332 | ||||
| CRUTEM4.1.1 | 0.254 | NCEP/DOE | 0.364 | ||||||
| GHCN-V3.2.0 | 0.273 | ERA5 | 0.380 | ||||||
| 1979—2014 | CRUTEM4.4.0.0 | 0.304±0.060 | [10] | GHCN | 0.439 | ||||
| 1979—2014 | CMA-LAST | 0.272±0.025 | [9] | CFSR | 0.271 | ||||
| 1979—2010 | GISS | 0.254±0.049 | [11] | JRA55 | 0.403 | ||||
| 1979—2010 | GHCN | 0.273±0.047 | [12] | 平均 | 0.362 | ||||
| 1979—2012 | ERA-Interim | 0.110 | [14] | 南 半 球 | 1979—2015 | CMA-LASTv1.0 | 0.142 | [9] | |
| 1981—2010 | MERRA | 0.130 | [15] | 1979—2010 | CRUTEM4 | 0.13 | [20] | ||
| 1981—2019 | CRU | 0.310 | 本文 | 1979—2010 | ERA-Interim | 0.12 | |||
| NCEP/NCAR | 0.283 | 1979—2014 | CMA-LAST | 0.142±0.021 | [17] | ||||
| NCEP/DOE | 0.307 | 1981—2019 | CRU | 0.161 | 本文 | ||||
| ERA5 | 0.347 | NCEP/NCAR | 0.081 | ||||||
| GHCN | 0.403 | NCEP/DOE | 0.072 | ||||||
| CFSR | 0.231 | ERA5 | 0.211 | ||||||
| JRA55 | 0.358 | GHCN | 0.267 | ||||||
| 平均 | 0.320 | CFSR | 0.066 | ||||||
| JRA55 | 0.169 | ||||||||
| 平均 | 0.147 |
新窗口打开|下载CSV
(2)图1中7套数据计算全球年平均气温时存在差异,可能原因如下:已有的研究认为,再分析资料的精度主要受到三方面误差的影响,包括观测误差、预报误差和同化误差[21,22]。例如,JRA55数据偏高可能因为采用了耦合气候预报模式和同化系统,同化了观测资料、海冰和气溶胶,且南半球面积小数据覆盖有限[23]。GHCN与CRU数据是基于全球气象站数据插值得来的,因此相较于ERA5、CFSR、NCEP/DOE和NCEP/NCAR数据结果偏高。NCEP/NCAR是第一代再分析资料,由于在数据同化中没有加入地表变化的信号,因此与NCEP/DOE和ERA5资料相比结果偏低[24]。(3)本文对146个国家或地区1981—2019年的气温变化率及气温变化量进行了分析,遴选出气温显著变化的国家或地区,发现与已有研究中的这些国家同时段气温变化特征相似(表6)。
Tab. 6
表6
表6不同国家气温变化研究结果比较
Tab. 6
| 国家 | 数据源 | 研究时段 | 升温速率(℃/10a) | 本文结论(℃/10a) | 文献来源 |
|---|---|---|---|---|---|
| 斯洛文尼亚 | 气象站 | 1959—2008 | 0.15~0.36 | 0.23** | [25] |
| 瑞士 | 气象站 | 1959—2008 | 0.35 | 0.28** | [26] |
| 尼日利亚 | CRU | 1901—2000 | 0.03 | -0.002 | [27] |
| 日本 | 气象站 | 1979—2013 | 0.29 | 0.35** | [28] |
| 加拿大 | 气象站 | 1953—2005 | 1.2 | 1.29** | [29] |
| 印度 | 气象站 | 1941—1999 | 0.42 | 0.57* | [30] |
| 韩国 | 气象站 | 1960—2010 | 0.2 | 0.22** | [31] |
| 沙特阿拉伯 | 气象站 | 1979—2009 | 0.51 | 0.407** | [32] |
| 中亚 | 气象站 | 1979—2011 | 0.41 | 0.364** | [33] |
| 柬埔寨 | 气象站 | 1951—2001 | 0.23 | 0.147** | [34] |
| 亚美尼亚 | 气象站 | 1961—2014 | 0.18 | 0.19** | [35] |
| 中国 | 气象站 | 1951—2010 | 0.21±0.02 | 0.22** | [36] |
| 气象站 | 1998—2012 | -0.221 | -0.192 | [37] |
新窗口打开|下载CSV
(4)1981—2019年全球增温速度最快的国家或地区主要位于北半球高纬度地区。而在南半球,年平均气温增加速率随纬度增加而减小,在30°S~60°S,NCEP/NCAR和NCEP/DOE资料显示出年平均气温的下降趋势。关于北极变暖的原因,主要体现在局地反馈和向极热输送两方面[38]。海冰减少导致区域反照率下降,海洋表面向大气释放更多的热量使得近地面气温增加,形成了海冰—反照率的正反馈机制[39];海冰变薄对北极气温升高,贡献率高达37%[40];云和水汽的增多导致长波辐射增加使得北极变暖加剧[41];太平洋年代际振荡和大西洋年代际振荡也是导致北极地区变暖的重要因子[42]。另外,极涡减弱、西伯利亚高压中心北移导致南风增强和暖空气向极输送也是主要原因[43,44]。
1981—2019年全球年平均气温下降速率最快的国家和地区位于30°S~60°S南美洲西部和南部,如智利、阿根廷、巴拉圭等地。这与Falvey等[45]得出的1979—2006年南美洲东南太平洋沿岸地区降温速率为0.2 ℃/10a的结论基本一致。这种变化归因于太平洋年代内振荡以及东南太平洋反气旋的强度加强有关[46,47];此外,太平洋东南沿海地区上升流补偿流加强,导致海表温度下降和近海岸国家气温降低[48]。
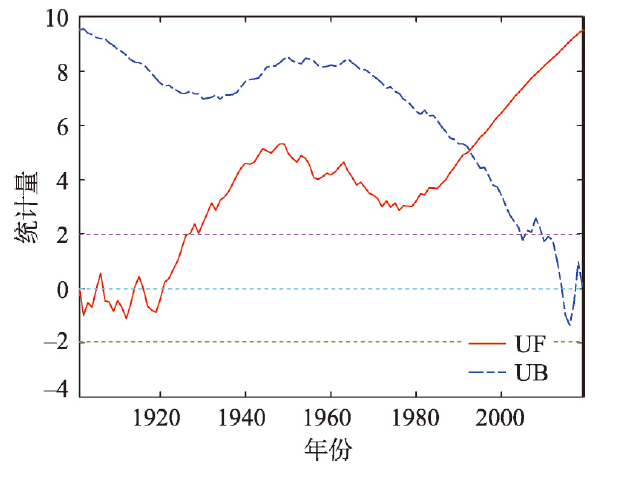
(5)在全球变暖被普遍关注和认可的同时,也有的****提出全球年平均表面温度上升趋势自1998年以来显示出停滞状态,即变暖趋缓(Hiatus)现象[49],引起了国际社会的广泛关注。但这个结论也受到了****的质疑[50,51],认为全球变暖的长期变化趋势没有完全停滞,并且全球平均表面温度在2014年和2015年连续两次创下历史新高。本文对1901—2019年全球年平均气温进行突变检验分析,结果表明,1901—2019年正序曲线UF与反序曲线UB虽然在1998年前后有交点,但未在95%水平置信度区间内,所以1998年不是气温突变点(图5)。目前已有研究认为1998年以来显示出停滞状态主要是指1998—2012年,本文也进一步分析了1998—2012年的气温变化特征,认为1998—2012年全球陆地气温变化速率为0.207 ℃/10a,为不显著增温趋势(P > 0.05)。但是如果把时间段延长到2019年,1998—2019年全球陆地气温变化速率为0.279 ℃/10a,为显著增温趋势(P < 0.05),是百年来增温速率最快的时段。因此,可以判断,1998—2012年全球气温没有升高,是由于统计时段内气温分布产生的统计结果,如果时段延长到2019年,1998—2019年气温仍为显著升高趋势。因此,本文认为1998年以来全球并没有出现气温变暖停滞。
此外,由于本文所用7套数据的空间分辨率不同,因此在数据重采样过程中会造成一定的误差。在数据矢量化过程中会出现图形纠正、边界跟踪误差;在图层裁切、拼接等过程中也会出现误差。因此,在数据提取中,也会进一步影响气温变化率的准确性。
图5
 新窗口打开|下载原图ZIP|生成PPT
图51901—2019年全球平均气温Mann-Kendall突变检验结果
Fig. 5Mann-Kendall mutation tests from 1901 to 2019
6 结论
(1)1981—2019年全球陆地年平均气温变化速率为0.320 ℃/10a,呈极显著升高趋势,年平均气温增加了0.835 ℃。南、北半球年平均气温变化速率为0.147 ℃/10a、0.362 ℃/10a,均呈极显著增加趋势,分别增加了0.874 ℃、0.828 ℃。北半球各纬度年平均气温增加速率均大于南半球相应纬度。全球升高速率最大的区域位于80°N~90°N,气温升高速率平均为0.707 ℃/10a,其次是70°N~80°N、60°N~70°N。本文认为1998年以来全球并没有出现气温变暖停滞的现象。(2)1981—2019年近97%的全球陆地表面具有增温趋势,其中80%陆地表面为显著增温趋势。显著增温区主要集中分布在北美洲的加拿大东部及北部、格陵兰岛部分地区、亚洲的俄罗斯东部和北部、中东地区、非洲的北部、欧洲南部大部分地区等区域。
(3)1981—2019年,统计的146个国家或地区中,136个国家或地区年平均气温呈显著增加趋势,占93.151%;10个气温无显著变化国家或地区比例占6.849%,其中仅有3个国家气温呈下降趋势,占2.055%。年平均气温升高1.5 ℃以上的国家共有34个,约占23.288%;升高1.0℃以上的国家共68个,约占46.575%;升高0.5 ℃以上的国家共128个,约占87.671%。
参考文献 原文顺序
文献年度倒序
文中引用次数倒序
被引期刊影响因子
DOI:10.11821/dlxb201907001 [本文引用: 1]

Medieval Climate Anomaly (MCA, 950-1250 A.D.) was the most recent and lasting hundreds of years warm period, which has aroused more attention from climate scholars, because MCA provided similar patterns to research on the impact and adaption of global and regional warming. In this study, we investigate the characteristics of temperature variation on inter-decadal to centennial scale during MCA in four regions (including Northeast, Northwest, Central-east and Tibetan Plateau) in China based on high-resolution temperature reconstructions longer than 1000 years and related warm-cold records from historical documents. Ensemble empirical mode decomposition method is used to analyze the cycles and fluctuations of four regional temperature series. The results show that the longest warm period during the last 2000 years occurred in the 10th-13th centuries over the whole country, although there existed several cold decadal intervals in the mid to late 12th century, different starting-ending warming periods and warming magnitudes in four regions. On quasi-30-year scale, regional temperature variations were similar during 950-1130 A.D. while their amplitudes became smaller and the phases did not match well each other in 1130-1250 A.D. On centennial scale, all the four regions began a warm period in the early 10th century and experienced two cold intervals during MCA. However, temperature variations of Northwest and Central-east kept in phase each other, but out phase in Northeast and Tibetan Plateau, where the ending of the warm period was earlier about 40-50 years than that of Northwest and Central-east. On multi-centennial scale, the mean temperature difference between MCA and Little Ice Age in Northeast and Central-east is significant, but did not appear in Northwest and Tibetan Plateau. Compared with the mean temperature of the 20th century, Central-east had a comparable warming level, Northeast was a little cooler, and both Northwest and Tibetan Plateau had significantly lower temperatures in MCA.
[本文引用: 1]
[本文引用: 1]
[本文引用: 1]
DOI:S0306-4565(17)30369-8PMID:29549991 [本文引用: 1]
Temperature increases can impact biodiversity and predicting their effects is one of the main challenges facing global climate-change research. Ectotherms are sensitive to temperature change and, although predictions indicate that tropical species are highly vulnerable to global warming, they remain one of the least studied groups with respect to the extent of physiological variation and local extinction risks. We model the extinction risks for a tropical heliothermic teiid lizard (Kentropyx calcarata) integrating previously obtained information on intraspecific phylogeographic structure, eco-physiological traits and contemporary species distributions in the Amazon rainforest and its ecotone to the Cerrado savannah. We also investigated how thermal-biology traits vary throughout the species' geographic range and the consequences of such variation for lineage vulnerability. We show substantial variation in thermal tolerance of individuals among thermally distinct sites. Thermal critical limits were highly correlated with operative environmental temperatures. Our physiological/climatic model predicted relative extinction risks for local populations within clades of K. calcarata for 2050 ranging between 26.1% and 70.8%, while for 2070, extinction risks ranged from 52.8% to 92.8%. Our results support the hypothesis that tropical-lizard taxa are at high risk of local extinction caused by increasing temperatures. However, the thermo-physiological differences found across the species' distribution suggest that local adaptation may allow persistence of this tropical ectotherm in global warming scenarios. These results will serve as basis to further research to investigate the strength of local adaptation to climate change. Persistence of Kentropyx calcarata also depends on forest preservation, but the Amazon rainforest is currently under high deforestation rates. We argue that higher conservation priority is necessary so the Amazon rainforest can fulfill its capacity to absorb the impacts of temperature increase on tropical ectotherms during climate change.Copyright © 2018 Elsevier Ltd. All rights reserved.
DOI:10.1007/s11356-018-2305-7URL [本文引用: 1]
DOI:10.15171/ijoem.2017.963URL [本文引用: 1]
DOI:10.11821/dlxb201707002 [本文引用: 1]
Based on the daily average temperature of 48 meteorological stations in Chinese oases of the distribution area of Populus euphratica, we analyzed spatio-temporal response of the onset and upset date of P. euphratica, and the dates of growing season to climate change, with the aid of methods including a multi-year trend line, Mann-Kendall mutation test, IDW under the ArcGIS software, Morlet wavelet power spectrum, and correlation analysis. The results indicate that in the past 56 years, the onset date of the growing season has advanced and the upset date has postponed; the dates of the growing period have gradually prolonged, with the trend rates being -1.34 d/10a, 1.33 d/10a, 2.66 d/10a (α≥ 0.001), respectively. The spatial difference is extremely significant, which presents the following law: from the southwest to the northeast in Chinese oases, the onset date has postponed, the upset date advanced, and the growing period shortened. The mutation point of the onset and upset dates and growing period is observed in 2001, 1989, and 1996, respectively, and the upset date is more sensitive to climate warming. The cycles of the growing season of P. euphratica are 3.56-7.14 years, which is consistent with the cycle of the El Nino event, and the onset date cycles of 3.56 years and 4.28 years are consistent with that of atmospheric circulation. Cause analysis shows that the Asian polar vortex area index, the Qinghai-Tibet Plateau index, Westerly Circulation index, and the carbon dioxide emissions are the main reasons for the change of the growing season for P. euphratica, and consistent with the results of the periodic analysis. In addition, the influence of latitude in the growing season is significantly larger than that of altitude, while the onset date is more significant than the upset date in terms of latitude and altitude. Additionally, the onset and upset dates and growing period are significantly correlated with the average temperature of corresponding month, with the correlation coefficients being -0.875, 0.770, and 0.897, respectively (α≥ 0.001). Specifically, if the March average temperature increases by 1 ℃, the onset date will occur about 2.21 days earlier; if the October average temperature increases by 1 ℃, the upset date will delay for 2.76 days; if the average temperature of March to October increases by 1 ℃, the growing period will prolong for 7.78 days. This indicates that the change of P. euphratica in the growing season has a sensitive response to regional warming. This study is of great theoretical significance in understanding the response of Chinese vegetation to climate warming and ecological restoration.
[本文引用: 1]
[本文引用: 1]
[本文引用: 1]
[D].
[本文引用: 5]
[D].
[本文引用: 5]
DOI:10.1002/joc.2018.38.issue-S1URL [本文引用: 4]
[本文引用: 3]
URL [本文引用: 3]
URL [本文引用: 3]
DOI:10.3724/SP.J.1085.2013.00326URL [本文引用: 3]
[本文引用: 4]
[本文引用: 4]
DOI:10.1038/516300aURL [本文引用: 1]
DOI:10.1007/s00382-017-3755-1URL [本文引用: 3]
DOI:10.1038/nclimate2268URL [本文引用: 1]
[本文引用: 3]
[本文引用: 3]
[本文引用: 2]
DOI:10.1175/BAMS-D-13-00043.1URL [本文引用: 1]
DOI:10.1175/BAMS-D-14-00226.1 [本文引用: 1]
Are there important differences between reanalysis data and familiar observations and measurements? If so, what are they? This essay evaluates four possible answers that relate to the role of inference, reliance on forecasts, the need to solve an ill-posed inverse problem, and understanding of errors and uncertainties. The last of these is argued to be most significant. The importance of characterizing uncertainties associated with results whether those results are observations or measurements, analyses or reanalyses, or forecasts is emphasized.
DOI:10.2151/jmsj.2015-001URL [本文引用: 1]
DOI:10.1002/qj.v146.730URL [本文引用: 1]
DOI:10.1007/s10113-012-0365-7URL [本文引用: 1]
DOI:10.1002/joc.2260URL [本文引用: 1]
DOI:10.1007/s00703-012-0199-3URL [本文引用: 1]
DOI:10.2151/sola.2015-002URL [本文引用: 1]
DOI:10.1175/JCLI4293.1URL [本文引用: 1]
[本文引用: 1]
[本文引用: 1]
DOI:10.1016/j.atmosres.2012.02.013URL [本文引用: 1]
DOI:10.1175/JCLI-D-13-00064.1URL [本文引用: 1]
DOI:10.1016/j.wace.2015.02.001URL [本文引用: 1]
URL [本文引用: 1]
DOI:10.1007/s10584-013-0867-4URL [本文引用: 1]
DOI:10.11821/dlxb201809011 [本文引用: 1]
The global warming hiatus during 1998-2012 has aroused a great public interest in past several years. Based on the air temperature at 622 meteorological stations in China, the response of temperature to global warming hiatus was analyzed on national and regional scales. The main results were as follows: (1) The trend magnitude of air temperature in China was -0.221 ℃/10 a during 1998-2012, which was lower than the long-term trend during 1960-1998 by 0.427 ℃/10 a. There was a warming hiatus in China that was more obvious than the global mean. Winter played a dominant role (contribution rate was 74.13%) in the nationwide warming hiatus, and the contribution of summer was the least among the four seasons. (2) The warming hiatus was spatial incoherent in different climate backgrounds in China. Among the three natural zones in China (the monsoon region of eastern China, the arid region of northwestern China and the high frigid region of Tibetan Plateau), there was a significant cooling in the eastern and northwestern China, especially the eastern China with a contribution rate of 53.79%. In the eastern China, the trend magnitudes were 0.896 ℃/10 a in winter and 0.134 ℃/10 a in summer, respectively. In the Tibetan Plateau, the air temperature has increased by 0.204 ℃/10 a without significant warming hiatus. (3) The warming hiatus in China may be associated with the negative phase of PDO as well as the reduction of sunspot numbers and total solar radiation. (4) Although warming hiatus occurred in China during 1998-2012, the air temperature has rapidly increased after 2012 and is likely to be continuously warming in the next few years.
[本文引用: 1]
[本文引用: 1]
[本文引用: 1]
DOI:10.1175/JCLI-D-16-0470.1URL [本文引用: 1]
DOI:10.1002/2016GL071274URL [本文引用: 1]
URL [本文引用: 1]
DOI:10.1073/pnas.1615880114PMID:28559341 [本文引用: 1]
With amplified warming and record sea ice loss, the Arctic is the canary of global warming. The historical Arctic warming is poorly understood, limiting our confidence in model projections. Specifically, Arctic surface air temperature increased rapidly over the early 20th century, at rates comparable to those of recent decades despite much weaker greenhouse gas forcing. Here, we show that the concurrent phase shift of Pacific and Atlantic interdecadal variability modes is the major driver for the rapid early 20th-century Arctic warming. Atmospheric model simulations successfully reproduce the early Arctic warming when the interdecadal variability of sea surface temperature (SST) is properly prescribed. The early 20th-century Arctic warming is associated with positive SST anomalies over the tropical and North Atlantic and a Pacific SST pattern reminiscent of the positive phase of the Pacific decadal oscillation. Atmospheric circulation changes are important for the early 20th-century Arctic warming. The equatorial Pacific warming deepens the Aleutian low, advecting warm air into the North American Arctic. The extratropical North Atlantic and North Pacific SST warming strengthens surface westerly winds over northern Eurasia, intensifying the warming there. Coupled ocean-atmosphere simulations support the constructive intensification of Arctic warming by a concurrent, negative-to-positive phase shift of the Pacific and Atlantic interdecadal modes. Our results aid attributing the historical Arctic warming and thereby constrain the amplified warming projected for this important region.
[本文引用: 1]
DOI:10.1175/JCLI-D-16-0320.1URL [本文引用: 1]
[本文引用: 1]
DOI:10.1016/j.gloplacha.2018.01.005URL [本文引用: 1]
DOI:10.1002/2015JD023126URL [本文引用: 1]
DOI:10.1016/j.pocean.2016.11.004URL [本文引用: 1]
DOI:10.1038/nature22315URL [本文引用: 1]
DOI:10.1016/j.earscirev.2018.12.005URL [本文引用: 1]
[本文引用: 1]
