 ,1,2,3, 陈玉福1,2,31.
 2.
3.
Theory and measurement of regional multidimensional poverty
LI Xunhuan1,2,3, ZHOU Yang,1,2,3, CHEN Yufu1,2,31. 2.
3.
通讯作者:
收稿日期:2019-05-29修回日期:2020-02-10网络出版日期:2020-04-25
| 基金资助: |
Received:2019-05-29Revised:2020-02-10Online:2020-04-25
| Fund supported: |
作者简介 About authors
李寻欢(1998-),男,重庆彭水人,硕士生,主要从事农村减贫与发展研究E-mail:lixh.19s@igsnrr.ac.cn。

摘要
关键词:
Abstract
Keywords:
PDF (4493KB)元数据多维度评价相关文章导出EndNote|Ris|Bibtex收藏本文
本文引用格式
李寻欢, 周扬, 陈玉福. 区域多维贫困测量的理论与方法. 地理学报[J], 2020, 75(4): 753-768 doi:10.11821/dlxb202004007
LI Xunhuan.
1 引言
贫困是全球性重大社会问题和现实难题[1],消除贫困、促进人类社会全面发展、实现共同富裕是国际社会一致的期盼与追求[2]。20世纪90年代以来,全球减贫事业取得了巨大进展,贫困人口不断减少,贫困发生率大幅下降。然而全球仍有大量的极端贫困人口,据世界银行统计2015年全球仍有7.36亿极端贫困人口,贫困发生率为10%[3]。2015年联合国发布了《2030年可持续发展议程》,并将“消除一切形式的极端贫困”列为17个可持续发展目标的首要目标[4]。中国曾经是世界上贫困问题最为突出的国家之一。1978年改革开放政策实施以来,中国政府高度重视扶贫开发工作,减贫事业取得了举世瞩目的成就,成为世界上首个实现联合国贫困人口减半千年发展目标的发展中国家。可以肯定的是,短期性(暂时性)的绝对贫困容易被消除,但长期性的相对贫困将会持续存在。摆脱贫困是乡村振兴的前提和基础,如何解决贫困人口集中连片难题,实现深度贫困地区贫困人口长期、稳定脱贫目标,促进深度贫困地区转型发展和乡村振兴,正成为各界高度关注的焦点。贫困具有多维性、区域性和动态性特征[2]。学界对贫困的认知经历了从单一维度收入/消费贫困向多维贫困(包含收入、教育、健康、就业和居住条件)的转变过程。20世纪初,Rowntree[5]在《贫困:城镇生活研究》一书中首次提出了贫困的概念,即一个家庭的收入不足以维持其生理功能的最低需求,包括食物、住房、衣物及其他生活必需品。随着贫困问题研究逐渐深入,学界涌现了一批重要理论成果,包括经济学视角的基本需求理论、社会学视角的社会排斥理论、发展学视角的能力贫困和多维贫困理论、政治学视角的权利贫困和阶级理论等[6,7,8]。其中,以Amartya Sen为代表的多维贫困理论最具影响力[7]。该理论认为贫困不仅是收入低下,更是对人的基本可行能力的剥夺[9]。随着对贫困基础理论研究的不断深入,贫困测量方法也在不断的创新发展。目前最有代表性的贫困测量方法包括收入/消费标准法[10]、人类发展指数(Human Development Index, HDI)[11]、脆弱性—可持续生计分析框架[12]、多维贫困指数(Multidimensional Poverty Index, MPI)[13,14]等,其中HDI和MPI在世界银行和联合国开发计划署等国际机构和组织得到广泛运用。
地理学研究具有综合性和区域性特点[15]。不同于经济学和社会学,地理学主要关注贫困地区的形成、分布格局、区域特征,以及贫困与环境之间的关系[2]。贫困人口分布的区域集聚性特征也表明,以空间分析见长的地理学在贫困研究中可以体现其重要的学科价值[16]。然而,中国贫困地理研究要晚于扶贫开发实践。直到20世纪80年代末,国内地理学界才开始重视贫困地理研究[17]。2013年精准扶贫战略提出以来,大批地理****和青年学生参与到国家精准扶贫成效第三方评估工作中,贫困地理学的研究成果和学科影响力迈上了新台阶。近年来,贫困地理研究成果不断涌现,主要涉及贫困与环境的关系[18]、贫困地理格局与贫困化过程[19,20]、贫困地域类型与减贫路径和模式[18, 21-22]、区域贫困测量[23,24]、贫困发生机制与减贫策略[25,26,27,28]等。贫困的多维性、区域性和复杂性不仅为地理学关注贫困问题提供了机遇,也提出了严峻的挑战[16, 29]。与此同时,与经济学、社会学相比,地理学在贫困基础理论与测量方法上仍不成熟,理论创新性不强,地理学的综合性研究特色尚未得以体现[2, 16]。
复杂多样的地理环境决了中国区域发展差异明显,区域性贫困问题突出,贫困人口集中连片,特别是深度贫困地区贫困人口高度集中[1, 18]。由于地理位置偏远、生存环境恶劣、致贫原因复杂,深度贫困地区贫困人口多、贫困程度深、脱贫难度大。2017年习近平总书记在深度贫困地区脱贫攻坚座谈会上指出“深度贫困地区是脱贫攻坚的坚中之坚”。2018年8月中共中央、国务院发布的《关于打赢脱贫攻坚战三年行动的指导意见》明确指出,要“集中力量支持深度贫困地区脱贫攻坚”。深度贫困是脱贫攻坚最突出的短板,也是最薄弱的区域。深度贫困地区不仅是个体贫困的问题,更是区域贫困的集中表现,致贫原因复杂、贫困程度深、脱贫难度大,不仅表现在经济、社会维度的“深”,更有地理环境维度的深层次原因。因此,本文从地理学的综合性、区域性视角出发,立足于空间贫困理论和人地关系地域系统理论,以中国334个深度贫困县为研究对象,建立了区域多维贫困测度理论框架、指标体系和评估方法,刻画了深度贫困地区的多维贫困地理格局,揭示深度贫困地区的贫困发生机理,以期为中国如期打赢脱贫攻坚战和实现深度贫困地区转型发展与振兴提供理论依据和决策支持。
2 理论基础
2.1 空间贫困理论
贫困地理学研究的核心是贫困与地理环境要素之间的关系[2, 16, 18]。20世纪90年代,GIS技术的发展为空间要素的可视化表达提供了便利,空间贫困研究进展迅速,“地理资本”“空间贫困”“贫困制图”等一系列重要的概念和术语相继出现[30,31]。其中对贫困地理学发展具有重要影响的理论是“空间贫困陷阱”(Spatial Poverty Traps, SPT)。Jallan等开创了空间贫困陷阱研究的先河,首次提出了“空间贫困陷阱”概念,并用一个包含地理资本的微观模型验证了空间贫困陷阱的存在[32,33]。Daimon认为空间贫困陷阱是由于地理位置偏远或迁移成本过高所导致的一种持续性贫困状态[34]。Bird等指出空间贫困陷阱常出现在地理资本低、贫困水平高的地区[35]。曼彻斯特大学“持续性贫困研究中心”(The Chronic Poverty Research Centre, CPRC)把空间贫困陷阱的特征概况为:地理位置偏远、农业生态与气候条件较差、经济系统脆弱、政治性优惠缺乏[36]。空间贫困陷阱理论较好地诠释了贫困人口分布的空间集聚性,为地理学关注贫困地理格局和分异机制奠定了理论基础。近年来,中国减贫事业取得了举世瞩目的成就,地理学贫困问题研究在理论创新与实践运用上迎来了发展的黄金期。刘彦随等[1]****提出了农村贫困演化的“孤岛效应”理论。“孤岛效应”是指当一个区域较少或难以和外界进行物质、信息、人员的交流,长期处于封闭或半封闭的状态时,会出现空间上孤立存在、形似岛状的地域性贫困现象[1, 20]。“孤岛效应”理论从地域系统格局演化的视角,解释了贫困人口在山地丘陵区、干旱高寒区、生态脆弱区、边境地区等区域的集聚现象。该理论在“空间贫困陷阱”的基础上,不仅强调了贫困人口的空间集聚性,更是揭示了贫困人口集聚分布的深层原因——区域封闭性,为着力解决区域贫困问题提供了智力支持。
2.2 区域贫困与个体贫困
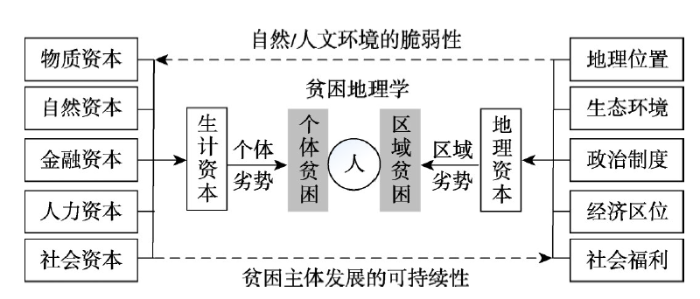
区域贫困(Regional Poverty)与个体贫困(Individual Poverty)是贫困地理学研究的两大基本内容[2, 23, 37],两者基于不同的视角审视贫困问题(图1)。个体贫困的瞄准对象是个人、群体或家庭,区域贫困瞄准的是贫困人口分布的特定地域或空间范围。个体贫困研究的核心观点认为贫困是由于个人资源、能力、权力和机会的缺失所导致的一种社会经济现象,主要表现在生计资本的匮乏或发展机会的剥夺,包括收入低下、受教育程度低、失业、公共服务缺失、身体健康状况差等经济和社会两个维度[38]。区域贫困研究关注贫困发生的场所,即贫困人口的空间分布,核心在于贫困与环境(自然环境/人文环境)的关系。区域贫困是地理资本缺失带来区域劣势的集中体现,包括地理位置劣势、生态环境劣势、经济劣势、制度安排劣势、社会福利劣势等经济、社会、环境维度。从地理学“人地关系”视角来看,区域贫困的本质是“人”“业”“地”三者耦合失调的过程和状态[2, 16, 18, 37]。区域贫困瞄准的是贫困地区,个体贫困瞄准的是贫困地区的特殊困难群体,即贫困人口。图1
 新窗口打开|下载原图ZIP|生成PPT
图1区域贫困与个体贫困对比和联系
Fig. 1Comparison and connection between regional poverty and individual poverty
区域贫困和个体贫困相互影响、相互制约。个体贫困表现为个体生计资本和可行能力的缺失,是区域贫困的一种外在表现。个体贫困具有累积放大效应,当个体贫困累积达到一定程度时,会形成区域性贫困,而由于交通基础设施落后、公共服务供给不足、区位条件差、生态环境脆弱等因素导致的区域贫困又反过来影响贫困群体摆脱贫困的能力,迫使贫困群体处于不利的地位。区域贫困和个体贫困均具有多维性、动态性和复杂性特征。减贫实践中既需要关注区域贫困,也需要关注贫困区域中的贫困个体,且两者减贫的侧重点和途径有所不同;区域贫困的减轻更多的是通过营造区域发展环境,促进贫困群体增收致富,而个体贫困的减轻侧重于个体内生发展能力的培育。
2.3 贫困地域系统与区域多维贫困
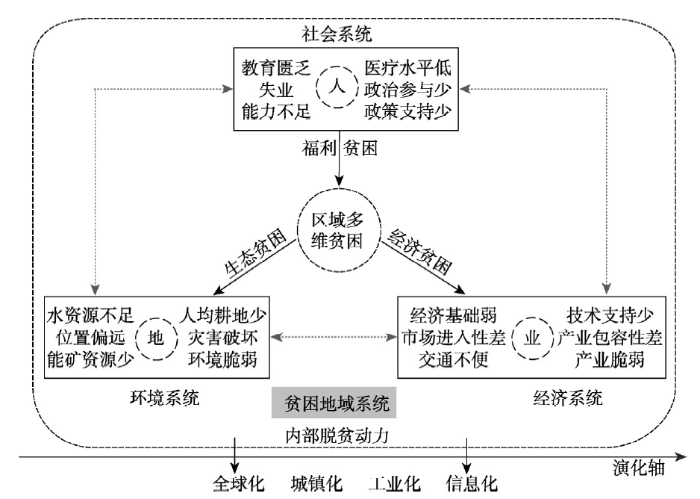
人地关系地域系统是地理学的研究核心。作为人文地理学的分支学科,贫困地理学的研究核心则是贫困地域系统(Impoverished Areal System, IAS),重点关注贫困地域系统的形成、演化特征及系统内各要素交互作用机理[2]。贫困地域系统是在特定贫困地域内,由地理区位、生态环境、资源禀赋、经济水平、社会福利等要素相互作用构成的,具有一定功能和结构的复杂系统。它包括3个子系统(图2):① 以“人”为核心要素的社会子系统,表现为个人或群体在医疗、教育、就业、政治参与、社会制度与公共政策安排等综合福利的缺失;② 以“地”为核心要素的环境子系统,表现为区域资源禀赋的劣势和生态环境的脆弱性;③ 以“业”为核心要素的经济子系统,表现为经济发展基础、市场进入机会、交通可达性、产业等方面的劣势。贫困地域系统具有开放性和动态性的特点,在全球化、城镇化、工业化、信息化等外部环境变化以及内部脱贫动力的共同调控下,各要素之间、子系统与子系统之间、子系统与系统之间通过信息传输、能量流动和物质交换的方式不断发展演化。贫困地域系统不是先天就存在的系统,系统的边界也不固定。贫困地域系统是一个复杂的动态系统,其演化过程遵循形成、成长、稳定、成熟、衰退的生命周期规律。图2
 新窗口打开|下载原图ZIP|生成PPT
图2贫困地域系统与区域多维贫困的理论内涵
Fig. 2Theoretical connotation of impoverished areal system and regional multidimensional poverty
区域贫困是贫困地域系统发展演化过程中“人”“地”“业”三个核心要素耦合失调的一种外在表现形式,刻画了社会、经济、环境等子系统综合作用下的多要素贫困格局。据此,区域多维贫困可以从生态贫困、经济贫困、福利贫困3个维度来刻画。其中,福利贫困反映了社会子系统中“人”这一主体性要素的福利缺失水平,表达了公共服务、社会制度等致贫因子作用于区域贫困的强弱程度;生态贫困反映了环境子系统中“地”这一客体性要素的劣势水平,表达了资源禀赋、生态环境等致贫因子的强弱程度;经济贫困反映了经济子系统中“业”这一中介性要素的劣势水平,表达了经济区位、交通、产业等致贫因子的强弱程度。贫困地理学研究应基于贫困地域系统的理论认知,重点探究区域贫困化的过程与格局、区域贫困化与地理环境演变之间交互作用的机理以及反贫困措施、对策及其减贫效应,而区域多维贫困测量则是综合减贫的前提和基础。
3 研究区与研究方法
3.1 研究区概况
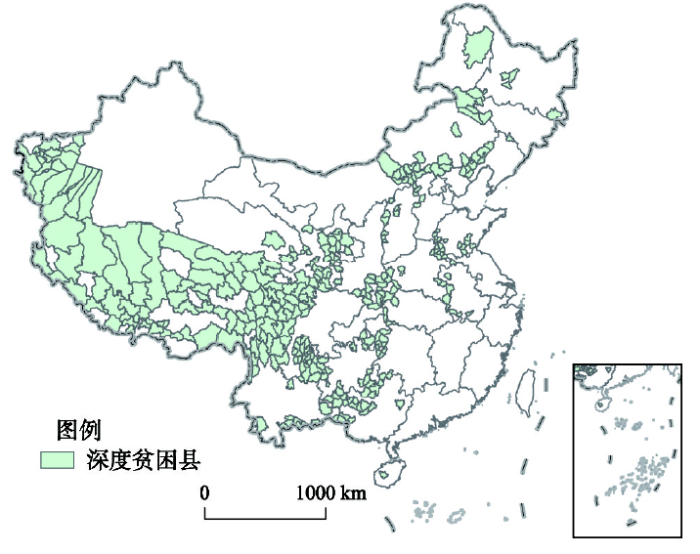
深度贫困地区是脱贫攻坚的重点、难点和关键点。2017年中国将贫困发生率高于18%的县确定为深度贫困县,共识别出334个深度贫困县(下文简称“深度贫困地区”),主要分布在中西部22个省、自治区、直辖市,包括集中连片分布的西藏、四川藏区、新疆南疆四地州和四川凉山州、甘肃临夏州、云南怒江州(下文简称“三区三州”),以及零散分布在地势二三级阶梯交界处的贫困县(图3)。其中,位于三区三州的深度贫困县共116个,非三区三州的深度贫困县共218个。深度贫困地区辖区面积约265.31万km2,占国土面积的27.54%。2016年,深度贫困地区有1.2亿人口,人均GDP为19531元,平均固定资产投资约67亿元,人均公共财政预算收入为1554元,分别占全国的8.68%、36.37%、32.02%、13.47%。2018年底深度贫困地区仍有624.31万贫困人口,约占全国的37.6%,贫困发生率为7.12%,显著高于全国平均水平(1.7%)。其中,“三区三州”共172万贫困人口,占全国的12.5%,贫困发生率比全国高出6.6个百分点。深度贫困地区的部分区县2020年如期实现现行标准下贫困人口全部脱贫、贫困县全部摘帽的目标面临着巨大挑战。图3
 新窗口打开|下载原图ZIP|生成PPT
图32017年中国334个深度贫困县
注:基于国家测绘地理信息局标准地图服务网站下载的审图号为GS(2016)2893号的标准地图制作,底图无修改。
Fig. 3334 severely impoverished counties in China in 2017
3.2 指标体系与数据来源
根据上述理论分析,区域多维贫困是特定地域在生态环境劣势、经济劣势、社会福利劣势上的综合表现,包括生态贫困、经济贫困和福利贫困3个维度。区域多维贫困测量是以一定尺度的地理单元为评价对象,综合测量某个区域在生态环境条件、社会经济发展、公共福利供给等方面的劣势程度。本文选取了反映区域自然环境条件、生态脆弱性、经济、交通、公共服务等方面的14个测量指标(表1)。研究数据包括深度贫困地区的社会经济统计数据、行政区边界矢量数据、DEM数据以及土地利用/土地覆被高分辨率遥感影像数据,基准年份为2016年。DEM数据来源于地理空间数据云,通过分区统计、坡度分析得到每个贫困县的平均高程、起伏度、坡度,对坡度进行重分类,提取每个县坡度大于25°的面积。生态脆弱区包括土地沙化区和土壤强度侵蚀区两类。土地沙化和土壤侵蚀栅格数据来源于中国科学院资源环境科学数据中心,通过重分类提取沙地和土壤侵蚀强度为强度及其以上地区,计算生态脆弱区面积占比。土地利用遥感影像来源于中国科学院资源环境科学数据中心,时间为2015年,空间分辨率为100 m。全国交通路网数据通过地图矢量化获取。其他社会经济统计数据来源于《中国县域统计年鉴2017》以及对应省份2017年的统计年鉴,少数缺失的数据用相邻年份或省级平均数据填补。Tab. 1
表1
表1区域多维贫困测量指标
Tab. 1
| 维度 | 编码 | 指标 | 指标释义 |
|---|---|---|---|
| 生态贫困 | X1 | 平均海拔(m) | 县域平均DEM高程 |
| X2 | 地表起伏度(m) | 县域栅格单元的高程范围 | |
| X3 | 坡度大于25°土地面积占比(%) | 地表坡度大于25°的土地面积占比 | |
| X4 | 生态脆弱区面积占比(%) | 土地沙化区和土壤强度侵蚀区的面积占比 | |
| X5 | 人均耕地面积(m2/人) | 水田、旱地的总面积除以户籍人口 | |
| 经济贫困 | X6 | 人均GDP(元) | 地区生产总值/常住人口 |
| X7 | 人均财政收入(元) | 公共财政预算收入/户籍人口 | |
| X8 | 固定资产投资(万元) | 社会固定资产投资总额 | |
| X9 | 路网密度(km/km2) | 县域交通道路里程/总面积 | |
| X10 | 到铁路干线的最短距离(km) | 县域几何中心到铁路干线的最短距离 | |
| 福利贫困 | X11 | 在校学生数(人) | 普通中学、中职、小学在校学生总数 |
| X12 | 平均受教育年限(年) | 居民受教育的平均年限长度 | |
| X13 | 医疗卫生机构床位数(床/千人) | 医疗卫生机构床位数/常住人口 | |
| X14 | 社会福利性单位床位数(床/千人) | 社会福利性单位床位数/常住人口 |
新窗口打开|下载CSV
3.3 研究方法
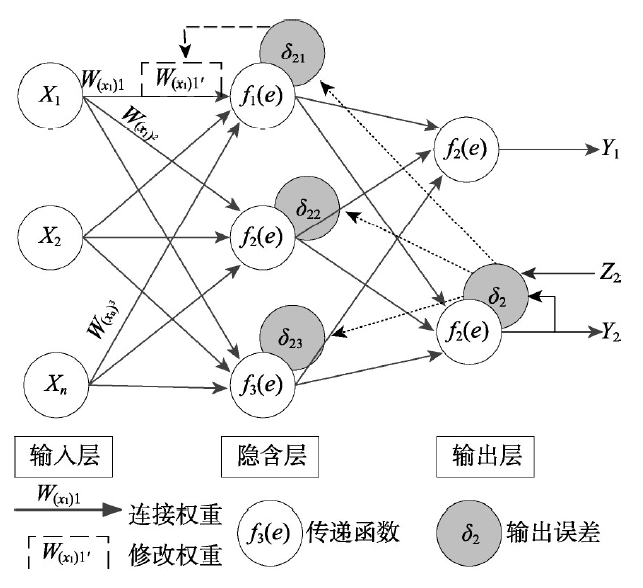
3.3.1 BP神经网络 区域多维贫困测量需要考虑多个维度、多个指标。维度之间、指标之间相互联系、相互影响,存在着复杂的网络关系。人工神经网络(Artificial Neural Network)是区域贫困化模拟过程中一种可行的、客观的评价方法,在多指标综合评价时可以尽可能地降低人为因素对指标权重的影响,最大程度地反映被评价对象的真实情况[39]。BP神经网络(Back Propagation Neural Network)是一种误差反向传播的多层前馈式网络,网络的学习过程包括正向传播和反向传播[40]。在正向传播过程中,输入信息从输入层经隐含层加权处理传向输出层,经作用函数运算后将得出的输出值与期望值进行比较,若有误差,则误差反向传播,沿原先的连接路径返回,通过逐层修改各层神经元的加权系数,减少误差,不断循环直到输出满足结果目标要求为止。BP神经网络的工作原理如图4所示。图4
 新窗口打开|下载原图ZIP|生成PPT
图4BP神经网络工作原理
Fig. 4Principle of back propagation neural network
BP神经网络具有构建简单、训练算法丰富等优点,是人工神经网络技术中运用最为广泛的一种网络类型,在模拟仿真、评价、预测预报、分类等方面最为适用[41]。本文基于MatlabR2017编程环境构建了区域多维贫困评价的BP神经网络模型[42]。主要步骤如下:
(1)构建网络。1989年Robert[43]在理论上证明了只有一个隐含层的BP神经网络也可以实现任意n维到m维的映射。因此,本文构建了包括1个输入层、1个隐含层、1个输出层的3层神经网络。输入层为各维度的评价指标,神经元个数由评价指标的数目确定;输出层为单维度贫困指数,神经元个数为1。隐含层神经元数目的确定目前还没有统一的标准和公式,本文结合公式(1),按照训练次数最少即最优的原则,通过多次反复试验,最终确定生态贫困指数(Natural Poverty Index, NPI)、经济贫困指数(Economic Poverty Index, EPI)、福利贫困指数(Welfare Poverty Index, WPI)在模拟过程中隐含层神经元数分别为8、6、8。NPI、EPI、WPI构建的网络结构分别为5×8×1、5×6×1、4×8×1。网络参数设置包括:隐含层的传递函数为Tansig函数,输出层的传递函数为Purelin函数,学习函数为Learngdm函数,性能函数为均方误差。
式中:n为隐含层节点数;ni为输入层节点数;n0为输出层节点数;a为1~10之间的常数。
(2)训练网络。区域多维贫困测量属于人工神经网络中的评价型工作。在评价型工作中,网络训练数据常由研究对象的评价标准构成,如水质和大气质量国家或地方标准等[41]。由于区域贫困测量尚未形成通用的评价标准,本文采用自然断点法设定线性影响等级,通过Spline函数进行线性内插,扩大样本数量,构建BP神经网络的训练数据(表2)。网络训练的参数设置包括:训练函数为Trainlm函数,最大迭代次数为10000次,最大误差为0.00001,其他参数采取默认值。
Tab. 2
表2
表2区域贫困指数BP网络模型的评价标准
Tab. 2
| NPI | X1 | X2 | X3 | X4 | X5 | 等级 | |||
|---|---|---|---|---|---|---|---|---|---|
| 1 | 1 | 1 | 1 | 1 | 5(高) | ||||
| 0.8001 | 0.5126 | 0.6636 | 0.6218 | 0.9946 | 4(较高) | ||||
| 0.5605 | 0.3317 | 0.3932 | 0.3468 | 0.9767 | 3(中) | ||||
| 0.3331 | 0.2176 | 0.2336 | 0.1735 | 0.9260 | 2(较低) | ||||
| 0.1533 | 0.1151 | 0.0896 | 0.0614 | 0.0000 | 1(低) | ||||
| EPI | X6 | X7 | X8 | X9 | X10 | 等级 | |||
| 1 | 1 | 1 | 1 | 1 | 5(高) | ||||
| 0.8504 | 0.9760 | 0.9159 | 0.4288 | 0.9318 | 4(较高) | ||||
| 0.7531 | 0.9493 | 0.8129 | 0.2366 | 0.8694 | 3(中) | ||||
| 0.6383 | 0.8901 | 0.6665 | 0.1153 | 0.7630 | 2(较低) | ||||
| 0.4488 | 0.4202 | 0.3832 | 0.0425 | 0.4770 | 1(低) | ||||
| WPI | X11 | X12 | X13 | X14 | 等级 | ||||
| 1 | 1 | 1 | 1 | 5(高) | |||||
| 0.9250 | 0.7248 | 0.9245 | 0.9609 | 4(较高) | |||||
| 0.8312 | 0.5046 | 0.8763 | 0.9181 | 3(中) | |||||
| 0.6857 | 0.3224 | 0.7686 | 0.8423 | 2(较低) | |||||
| 0.3970 | 0.1992 | 0.0000 | 0.0000 | 1(低) | |||||
新窗口打开|下载CSV
(3)模拟评价。为了消除不同量纲、正负向指标的影响,本研究采用极差标准化对334个深度贫困县的评价指标进行归一化处理。将归一化处理后的样本数据输入训练好的BP神经网络,模拟函数选择Sim函数,得到各贫困县的生态贫困指数、经济贫困指数、福利贫困指数,最后加总求和计算区域多维贫困指数(Regional Multidimensional Poverty, RMP):
3.3.2 探索性空间数据分析 探索性空间数据分析(Exploratory Spatial Data Analysis, ESDA)可以深入探究地理事物和地理现象的空间依赖性和集聚特征。本文采用全局Moran's I指数判断深度贫困县区域多维贫困指数的空间自相关性。Moran's I指数为正,呈正相关;Moran's I指数为负,呈负相关。具体计算公式见参考文献[40]。在全局空间自相关性判断的基础上,使用局部G统计量Gi来检测局部的空间依赖性和集聚特征。Gi值显著为正,表示高观测值的空间单元趋于集聚,为“热点地区”;显著为负,表示低观测值的空间单元趋于集聚,为“冷点地区”。Gi的计算公式如下:
式中:wij为空间权重矩阵,空间相邻取值为1,不相邻取值为0;xj为j县的观测值。
3.3.3 匹配系数 2013年国家提出精准扶贫战略以来,全国各地按照“两不愁、三保障”的标准精准识别农村贫困人口,以每个县农村人口的贫困发生率反映其贫困状况,即个体贫困。本文将区域多维贫困指数与贫困发生率进行对比,可以分析区域多维贫困和个体多维贫困在贫困测量与瞄准上的差异。为了消除不同量纲的影响,比较两者的相对差异,本文将334个深度贫困县的区域多维贫困指数和2016年贫困发生率按照降序进行排序,即区域多维贫困指数和贫困发生率越大、贫困程度越高、排名则越靠前。然后,计算两者的匹配系数M,公式如下:
式中:Mi表示i县的匹配系数;Pi表示i县的贫困发生率排名;Ri表示i县的区域多维贫困指数排名;n为深度贫困县的数量。Mi为正,表示区域多维贫困程度高于个体多维贫困程度;Mi为负,表示个体多维贫困程度高于区域多维贫困程度。Mi的绝对值越大,匹配程度越低;Mi的绝对值越小,匹配程度越高;Mi = 0表明两者之间完全匹配。
4 结果分析
4.1 深度贫困地区多维贫困格局
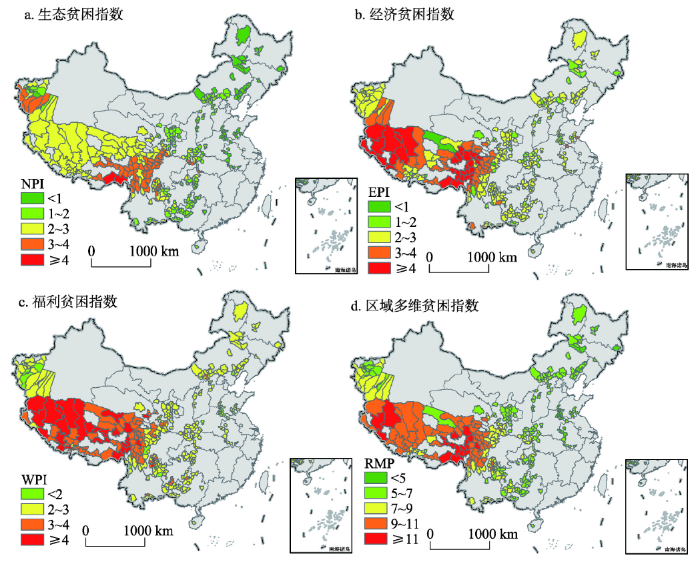
4.1.1 生态贫困指数(NPI) 生态贫困指数综合反映了一个地区的地形条件、生态脆弱性和耕地资源禀赋,是区域贫困状况在环境维度上的体现,表达了贫困地区在生产生活中的先天性劣势。在Matlab中运用BP神经网络建立并训练生态贫困指数的评价模型,输入5个测量指标的样本数据得到深度贫困地区的生态贫困指数(图5a)。从计算结果来看,深度贫困地区的平均生态贫困指数为1.89,生态贫困状况处于较低水平。从地域分布来看,南疆三地州(和田地区、喀什地区、克孜州)、四川凉山州、四川藏区和横断山区的生态贫困指数较高。其中墨脱县和察隅县的生态贫困指数最高,分别为4.22、4.23。东北地区、燕山山脉、大别山区的深度贫困县,由于地势起伏相对较小、农业生产的水热条件较好,经济发展受地形、气候等自然环境的制约作用弱,生态贫困指数较低。图5
 新窗口打开|下载原图ZIP|生成PPT
图5中国深度贫困地区多维贫困测量
注:基于国家测绘地理信息局标准地图服务网站下载的审图号为GS(2016)2893号的标准地图制作,底图无修改。
Fig. 5Multidimensional poverty measurement in severely impoverished counties
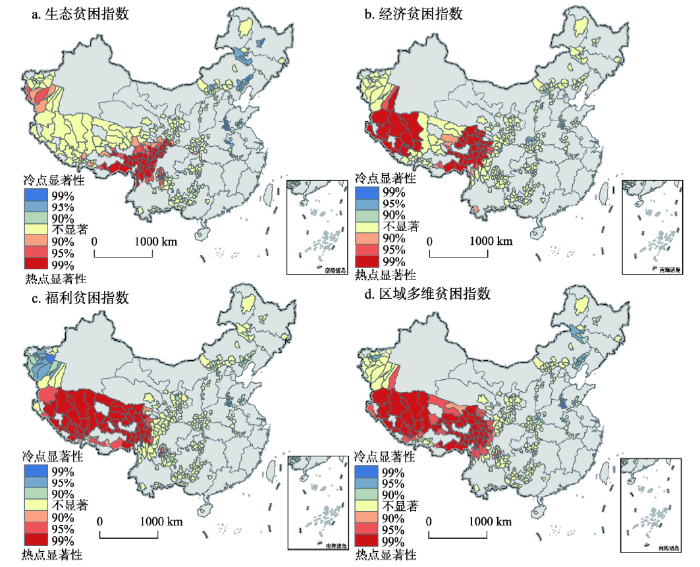
在NPI指数计算的基础上,通过探索性空间数据分析定量评价生态贫困指数的空间集聚特征。首先,计算NPI的全局Moran's I指数。结果显示,NPI的Moran's I指数为0.85,这说明生态贫困指数具有很强的空间自相关性。然后通过冷热点分析判断NPI的局部集聚特征。如图6a所示,南疆两地(和田、喀什地区)、凉山州、四川藏区、横断山区是NPI指数分布的“热点地区”,呈显著的“高—高集聚”态势。上述地区均为深山区、高寒干旱区,自然条件恶劣、生态环境脆弱,干旱、地震、滑坡、泥石流等自然灾害多发,资源开发利用的难度较大,生态保护与经济发展的矛盾十分突出,贫困人口高度集中,是空间贫困的生态陷阱区。NPI指数的“冷点地区”零散分布在东北、内蒙古、安徽以及鲁豫交界地带,其余深度贫困县NPI指数的空间依赖性不显著。生态贫困指数揭示了深度贫困地区在自然资源与生态环境方面的劣势程度。在未来减贫事业中,政府应重视生态贫困陷阱区环境保护与经济发展之间的尖锐矛盾。特别是在全球气候变暖的大背景下,政府应加大力度推进生态脆弱区的环境保护与生态修复,全面提高贫困人口应对自然灾害的抗风险能力,通过移民搬迁、环境综合治理、重大灾害防范等多种手段,帮助贫困人口走出生态贫困陷阱。
图6
 新窗口打开|下载原图ZIP|生成PPT
图6中国深度贫困地区多维贫困的冷热点分析
注:基于国家测绘地理信息局标准地图服务网站下载的审图号为GS(2016)2893号的标准地图制作,底图无修改。
Fig. 6Hot spot analysis of regional multidimensional poverty in severely impoverished areas of China
4.1.2 经济贫困指数(EPI) 经济贫困指数综合反映了区域的经济发展水平、基础设施建设和交通可达性,是区域贫困状况在经济维度上的体现,表征了贫困地区在经济区位和交通区位上的劣势程度。根据前文的评价方法建立经济贫困指数的BP神经网络,当网络通过训练达到精度要求后,将5个测量指标的样本数据输入模型得到深度贫困地区的经济贫困指数(EPI),并结合ArcGIS制作EPI指数的可视化地图(图5b)。计算结果显示,深度贫困地区的平均EPI指数为2.66,在经济贫困维度上处于中等水平。在地域分布上,川—青—藏三省交界地区、西藏西部以及南疆和田地区的经济贫困指数较高,其余大部分深度贫困县的EPI指数处于中等水平。其中普兰县和改则县是经济贫困程度最深的两个县,EPI指数分别为4.88、4.68。全国大多数深度贫困县的经济贫困指数均高于生态贫困指数,说明经济发展与收入增加仍是深度贫困地区贫困人口当前面临的最为紧迫的关键问题和现实难题。
在EPI指数计算的基础上通过探索性空间数据分析判断经济贫困指数的空间依赖性和集聚特征。结果显示,EPI的全局Moran's I指数为0.81,这表明深度贫困地区的经济贫困指数在整体上具有显著的空间集聚性。然后通过冷热点分析探测EPI指数的局部集散特征及其显著性。如图6b所示,经济贫困指数的“热点地区”集中分布在青藏高原的东西两侧,且显著性水平均在95%以上。该地区位于青藏高原特别是高原边缘的山脉附近,地形条件复杂,基础设施建设的技术要求高、难度大,交通可达性很差,对外的物质信息交流弱,长期处于封闭半封闭状态,属于农村贫困化的孤岛。“冷点地区”则零散分布在秦岭山区、鲁豫交界地区、山西、内蒙古的少数深度贫困县,大多数深度贫困县EPI的空间集聚性不显著。经济贫困的“热点地区”将成为中国未来10年减贫瞄准的重点区域。在项目安排上,政府应重点关注贫困地区的区域封闭性,集中人力、资金和技术攻克高原深山区在区际联系上的困境,改善当地经济发展的区位条件,提高贫困人口脱贫致富的自我发展能力和内生动力。
4.1.3 福利贫困指数(WPI) 福利贫困指数反映了区域内居民所享有的社会福利条件和公共服务水平,是区域贫困状况在社会维度上的体现,表达了居民在教育、医疗卫生、社会保障等公共福利上的缺失程度。将福利贫困维度的4个测量指标输入BP神经网络,得到深度贫困地区的福利贫困指数(图5c)。从WPI的计算结果来看,深度贫困地区的平均福利贫困指数为2.77,福利贫困状况处于中等水平。在地域分布上,福利贫困处于较高水平(WPI > 3)的深度贫困县共98个,主要集中在青藏高原地区以及四川凉山州,其余大部分贫困县的福利贫困程度处于中等水平。其中聂荣县和石渠县是福利贫困程度最深的两个县,WPI指数分别为4.88、4.80。深度贫困县的福利贫困指数在3个单维贫困指数中总体得分最高,这说明深度贫困地区的公共服务建设已经成为其社会经济发展的最大短板。深度贫困地区不仅“深”在其经济落后与收入不足,更是“深”在社会福利与公共服务的短缺。
在WPI指数计算的基础上,通过Moran's I指数和冷热点分析判断福利贫困指数的空间集聚特征和聚集区域。结果显示,WPI的全局Moran's I指数为0.88,这说明深度贫困地区福利贫困的空间相关性极强。从冷热点分析的结果来看(图6c),WPI指数的“热点地区”主要集中在青藏高原,且绝大多数贫困县WPI高值集聚的显著性水平高达99%。青藏高原地区由于自然环境条件恶劣,公共设施建设的难度大、成本高,再加上地广人稀,学校、医院、养老机构等公共设施建成后产生的社会效益低下,同时区域环境的封闭性提高了居民享受外地优质公共资源的成本,自身薄弱的经济基础对社会事业发展的支撑作用不足,公共服务整体水平较低。南疆三地州和鲁豫交界地区是WPI指数的“冷点地区”,显著性水平为95%,其余深度贫困县在福利贫困维度的集聚特征不明显。WPI指数的高度集中,反映了福利贫困已成为青藏高原地区普遍存在的社会问题。教育、医疗等公共事业的发展是贫困人口稳定脱贫的重要保障。在未来减贫项目安排中,政府应加大对深度贫困地区公共事业发展的支持力度[44],通过多地区联动、多部门协作,全面提升深度贫困地区的公共服务水平,帮助贫困人口走出福利贫困的陷阱。
4.1.4 区域多维贫困指数(RMP) 区域多维贫困指数反映了一个区域在经济、社会、环境维度上的总体劣势,是区域贫困程度的综合表现。在3个单维贫困指数计算的基础上,通过公式(2)得到深度贫困地区的区域多维贫困指数(图5d)。从计算结果来看,深度贫困地区RMP的平均值为7.31,多维贫困程度总体处于中等水平。RMP > 11的深度贫困县有18个,主要分布在川—青—藏三省交界地区以及西藏西部。其中,察隅县和左贡县的RMP指数最高,分别为12.69、12.52。从地域分布上看,青藏高原地区深度贫困县的区域多维贫困指数较高,多维贫困问题最突出,其他地区的区域多维贫困指数较低。
在RMP指数计算的基础上,通过空间自相关和冷热点分析判断区域多维贫困指数的空间集聚特征。结果显示,RMP的全局Moran's I指数为0.96,具有极其显著的集聚特征。多维贫困指数来看,深度贫困地区多维贫困指数的“热点地区”为青藏高原,且大多数贫困县RMP高值集聚的显著性水平高达99%(图6d)。鲁豫交界、内蒙古东部、秦岭北部、新疆阿克苏等地区的深度贫困县是区域多维贫困指数的“冷点地区”,其余地区的冷热点分析均不显著。由于地理位置偏远、自然条件恶劣,经济发展基础薄弱,公共服务建设落后,青藏高原地区在生态贫困、经济贫困和福利贫困3个维度上均高于其他地区,尤以福利贫困表现最为明显。3个维度之间相互联系、相互作用,加深了青藏高原区域贫困的程度,提高了脱贫攻坚的难度。区域多维贫困指数可为国家宏观层面上的减贫瞄准和项目安排提供参考依据。在未来的减贫战略中,政府应根据不同地区不同维度的贫困状况,因地制宜、科学合理地布局扶贫项目,重点关注多维贫困集中分布的热点地区。
4.2 区域多维贫困与个体多维贫困的空间分布
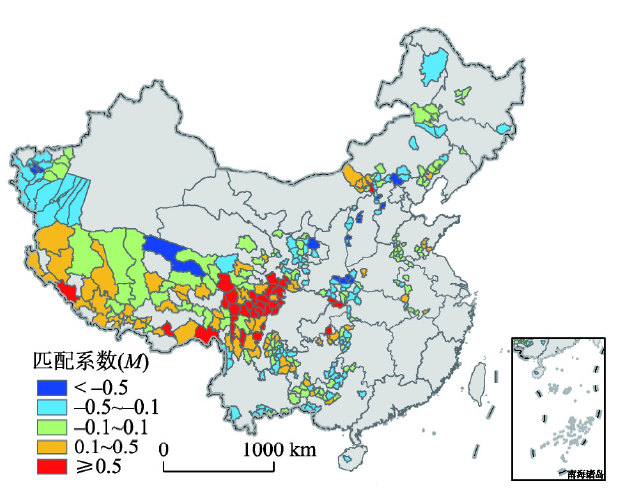
区域瞄准与个体瞄准是贫困瞄准的两大手段。哪种瞄准方法更为科学、有效?学界至今仍没有统一的结论。本文在区域多维贫困测量的基础上,将深度贫困地区的区域多维贫困指数与贫困发生率按照降序进行排名,计算了两者的匹配系数M(图7)。结果显示,M > 0(区域多维贫困强于个体多维贫困)的深度贫困县共164个,M < 0(个体多维贫困程度高于区域多维贫困)的有169个,说明深度贫困地区在区域贫困与个体贫困在空间上分布较为一致;-0.1< M < 0.1说明两者的匹配程度较高,此类贫困县共113个,占所有样本量的33.83%;M ≥ 0.5,说明区域多维贫困程度显著高于个体多维贫困;M < -0.5,说明个体多维贫困程度显著高于区域多维贫困程度。全国深度贫困县中,匹配系数M > 0.5的有32个,主要分布在川西地区、藏南边界以及巫山地区;M < -0.5的贫困县有17个,零散分布在秦岭北部、山西、河北、青海玉树州、新疆阿克苏等地区。匹配系数M为贫困瞄准方式的选择提供了参考。匹配系数较高的地区,大多是地理位置偏远、生态环境极其脆弱、区域劣势突出的地区,应从区域多维贫困的视角重点瞄准贫困地区。反之,匹配系数较低的地区,由于其区位条件相对较好、区域整体性劣势较弱,个体发展的生计资本差异较大,应从个体多维贫困的视角重点瞄准贫困个体或群体。图7
 新窗口打开|下载原图ZIP|生成PPT
图7中国区域贫困与个体贫困匹配系数
注:基于国家测绘地理信息局标准地图服务网站下载的审图号为GS(2016)2893号的标准地图制作,底图无修改。
Fig. 7Matching coefficient between regional poverty and individual poverty in China
5 结论与讨论
区域多维贫困瞄准是科学减贫的基础和前提。本文立足于空间贫困理论和人地关系地域系统理论,在系统解析区域贫困与个体贫困、贫困地域系统与区域多维贫困相互关系的基础上,构建了区域多维贫困测量的理论框架和计量模型,并以全国334个深度贫困县为研究对象,测算了深度贫困地区的多维贫困指数,刻画了深度贫困地区的多维贫困空间格局,揭示了深度贫困地区贫困的发生机理,研究结果可为2020年后国家减贫与发展战略的制定提供决策支持,对当前深度贫困地区打赢脱贫攻坚战具有重要的指导意义和实际价值。主要结论如下:(1)区域贫困和个体贫困是贫困地理学的研究对象。区域贫困和个体贫困均具有多维性特征。个体多维贫困主要表现在人类生计资本的匮乏,包括收入低下、受教育程度低、失业、公共服务缺失、身体健康状况差等经济和社会2大维度;区域多维贫困则是特定地域在生态环境劣势、经济劣势、社会福利劣势上的综合表现,包括生态贫困、经济贫困和福利贫困3个维度。贫困地域系统是贫困地理学的研究核心,包括以“人”“地”“业”为核心要素的社会子系统、环境子系统和经济子系统。贫困地域系统是一个复杂的动态系统,其演化过程遵循形成、成长、稳定、衰退的生命周期规律。
(2)深度贫困地区最“深”的地方在青藏高原,最“深”的短板在基础设施和公共服务。结合BP神经网络和ESDA法分析了深度贫困地区的多维贫困格局。从单一维度的贫困指数来看,福利贫困指数>经济贫困指数>生态贫困指数,三者的平均值分别为2.77、2.66、1.89,贫困人口社会福利和公共服务的缺失已经成为深度贫困地区最突出的问题。从多维贫困指数来看,青藏高原是区域多维贫困指数“高—高集聚”的“热点地区”,在生态贫困、经济贫困和福利贫困上均显著高于其他地区。
(3)区域多维贫困指数能较好地刻画区域贫困状况。深度贫困地区多维贫困指数与贫困发生率的空间匹配结果表明:匹配系数较高的地区,大多是地理位置偏远、生态环境极其脆弱、区域劣势突出的地区,在瞄准方法上应选择区域多维贫困;匹配系数较低的地区,由于其区位条件相对较好、区域整体性劣势较弱,个体发展的生计资本差异较大,在瞄准方法上应选择个体多维贫困。
随着国家精准扶贫战略的实施和推进,国内关于区域贫困问题研究的成果大量涌现。但是,学界对于贫困地理学的基础理论、研究框架、研究范式与方法等方面仍缺乏清晰、统一的认识。本文虽然探讨了区域多维贫困的概念、指标体系和测量方法,但受制于数据的可获得性,多维贫困测量指标体系有待进一步完善。同时,缺少对区域多维贫困演化过程、发生机理和减贫路径的深入探讨,未来还须结合典型案例区加强微观层面上区域多维贫困的机理研究。此外,贫困不是农村特有的现象,城市贫困问题也制约着城乡一体化发展。在城乡融合发展的大背景下,亟需强化城乡统一的空间贫困问题研究,这为贫困地理学研究提供了机遇和挑战。面向联合国2030年可持续发展消除贫困的目标,地理****不仅要关注多维贫困测度的理论与方法、区域贫困格局与过程、区域贫困化与地理环境演变的关系、反贫困对策与措施(如交通基础设施和公共设施建设)及其减贫效应,还需要积极探索贫困地区精准脱贫与乡村振兴有机衔接和解决相对贫困的长效机制,推动贫困地区转型和可持续发展。
参考文献 原文顺序
文献年度倒序
文中引用次数倒序
被引期刊影响因子
[本文引用: 4]
[本文引用: 4]
URL [本文引用: 8]
[本文引用: 1]
[本文引用: 1]
[本文引用: 1]
[本文引用: 1]
[本文引用: 1]
DOI:10.2307/135247URL [本文引用: 2]
[本文引用: 1]
[本文引用: 1]
[本文引用: 1]
[本文引用: 1]
[本文引用: 1]
[本文引用: 1]
DOI:10.18306/dlkxjz.2017.02.005URL [本文引用: 1]

Targeted poverty alleviation refers to focusing on the poor in anti-poverty programs and enhancing the ability of those who desire to fight against poverty. Sustainable livelihoods framework facilitates exploring the influencing factors and formation of poverty, which is useful in standardized and systematic research on precision poverty alleviation. Based on this framework, our study sets up an analytical framework to divide precision poverty alleviation into four stages and five links in order to assist the poor to reduce poverty; it also discusses the basic components of multidimensional poverty identification index (MPII) from the perspective of internal and external causes of difficulties in farmers' livelihood. Taking Liangshan Yi Autonomous Prefecture in Sichuan Province as the example, we establish a unique MPII index system. A total of 420 households are identified as impoverished families. About 80% of the designated poor households (who are registered at the government office) overlap with the identified families; and the identified poor households are the poorest among those who have been registered, both in individual dimensions and the integrated dimension, so the identification is more accurate. The poor households can be divided into five types: lack of human capitals, lack of primary capitals, lack of social capitals, lack of multidimensional capitals, and living in severe environmental condition. Corresponding measures have been proposed in accordance with the causes of poverty conditions.
DOI:10.18306/dlkxjz.2017.02.005URL [本文引用: 1]
Targeted poverty alleviation refers to focusing on the poor in anti-poverty programs and enhancing the ability of those who desire to fight against poverty. Sustainable livelihoods framework facilitates exploring the influencing factors and formation of poverty, which is useful in standardized and systematic research on precision poverty alleviation. Based on this framework, our study sets up an analytical framework to divide precision poverty alleviation into four stages and five links in order to assist the poor to reduce poverty; it also discusses the basic components of multidimensional poverty identification index (MPII) from the perspective of internal and external causes of difficulties in farmers' livelihood. Taking Liangshan Yi Autonomous Prefecture in Sichuan Province as the example, we establish a unique MPII index system. A total of 420 households are identified as impoverished families. About 80% of the designated poor households (who are registered at the government office) overlap with the identified families; and the identified poor households are the poorest among those who have been registered, both in individual dimensions and the integrated dimension, so the identification is more accurate. The poor households can be divided into five types: lack of human capitals, lack of primary capitals, lack of social capitals, lack of multidimensional capitals, and living in severe environmental condition. Corresponding measures have been proposed in accordance with the causes of poverty conditions.
DOI:10.1016/j.jpubeco.2010.11.006URL [本文引用: 1]
This paper proposes a new methodology for multidimensional poverty measurement consisting of an identification method rho(k) that extends the traditional intersection and union approaches, and a class of poverty measures M-alpha. Our identification step employs two forms of cutoff: one within each dimension to determine whether a person is deprived in that dimension, and a second across dimensions that identifies the poor by 'counting' the dimensions in which a person is deprived. The aggregation step employs the FGT measures, appropriately adjusted to account for multidimensionality. The axioms are presented as joint restrictions on identification and the measures, and the methodology satisfies a range of desirable properties including decomposability. The identification method is particularly well suited for use with ordinal data, as is the first of our measures, the adjusted headcount ratio M-0. We present some dominance results and an interpretation of the adjusted headcount ratio as a measure of unfreedom. Examples from the US and Indonesia illustrate our methodology. (C) 2010 Elsevier B.V.
DOI:10.1007/s10888-011-9181-4URL [本文引用: 1]
Multidimensional measures provide an alternative lens through which poverty may be viewed and understood. In recent work we have attempted to offer a practical approach to identifying the poor and measuring aggregate poverty (Alkire and Foster, J Public Econ, 2011). As this is quite a departure from traditional unidimensional and multidimensional poverty measurement-particularly with respect to the identification step-further elaboration may be warranted. In this paper we elucidate the strengths, limitations, and misunderstandings of multidimensional poverty measurement in order to clarify the debate and catalyse further research. We begin with general definitions of unidimensional and multidimensional methodologies for measuring poverty. We provide an intuitive description of our measurement approach, including a 'dual cutoff' identification step that views poverty as the state of being multiply deprived, and an aggregation step based on the traditional FGT measures. We briefly discuss five characteristics of our methodology that are easily overlooked or mistaken and conclude with some brief remarks on the way forward.
DOI:10.11821/dlxb201711001URL [本文引用: 1]
Geography is a subject to explore spatial distribution, time evolution and regional characteristics of geographical elements or geographical complexes. Geography is unique in bridging social sciences and natural sciences, and has characteristics of comprehensiveness, interdisciplinary research and regionalism. With the development of geographical science technology and research methods, geography is in the gorgeous historical process towards geographical science. Research themes of geography are focusing on the comprehensive research on the earth surface. The research paradigms of geography are shifting from geography knowledge description, coupling pattern and process, to the simulation and prediction of complex human and earth system. The development of Chinese geography needs to be rooted in the major needs of national strategy, and plays important roles in the studies of urbanization development, coupling ecological processes and services, water resources management and geopolitics. Under the country's major needs, China's geography tends to achieve the geography theory innovation, new method and technology application and developed disciplinary system with Chinese characteristics, and make more contribution to national and global sustainable development.
DOI:10.11821/dlxb201802003URL [本文引用: 5]
Owing to the multidimensional and spatial nature of poverty and the synthetic and visible analysis merits of geography science, there is a great potential for geography science, which is taking human-environment relationships as core topics, to understand regional poverty and guide the poverty alleviation practices. This article tries to explain the connotation, inscapes, patterns, formation process and countermeasures in a view of geography science based on the retrospect of geographical research on domestic and abroad poverty. The main conclusions showed that: (1) Regional poverty can be considered as a status or process of deprivation on the three dimensions of "human", "activities" and "environment", or the disharmony among them under the specific situation; (2) The inscapes of regional poverty contain subjective factor ("human"), intermediated factor ("activities") and objective factor ("environment"), and the poverty patterns were caused by the deprivation of the three factors or their imbalanced coupling; (3) The formation process of regional poverty patterns can be understood as a nonlinear negative accumulative cycle of disorderly coupling of subjective factor, intermediated factor and objective factor. At the same time, it can be considered as a phenomenon that the subjective factor ("human") and objective factor ("environment") can not catch up or match the changes of intermediated factor ("activities") during the transitions of human civilization; (4) Synthetical poverty alleviation needs targeted interventions as well as coordination of all countermeasures, which is similar to the consultation of doctors in hospital, which may be a good way to achieve the goal.
[本文引用: 1]
[本文引用: 1]
DOI:10.1016/j.habitatint.2019.102086URL [本文引用: 5]
URL [本文引用: 1]
In special poverty-stricken rural areas, the primary problem of poverty alleviation is effective targeting and identifying of the poor and their distribution area. In recent years, researchers around the world focused on grasping the essence of multidimensional poverty and measurement. Based on systematic design of multidimensional poverty identifying indices system and algorithm flow, this article takes key country in Nanyang, Henan Province from national contiguous special poverty-stricken areas as the study area, constructs algorithm based on the "dual cutoff" and "dimension aggregated/decomposition" to measure and analyze the multidimensional poverty of the poor at "county-village"scale,uses Kriging method to interpolate results of multidimensional poverty measurements and systematically analyze spatial distribution pattern of multidimensional poverty at village scale in study area.The result shows: in the study area,the trend of multidimensional poverty headcount ratio and multidimensional poverty index(MPI) is that the value of west is higher than that of the east;the MPI of Neixiang country and Xichuan country is the highest,that of Zhenping country is the lowest. Their primary factors contributing to poverty are income and health,contribution of income index to the poverty appears as strip from "northwest-southeast",healthy problem mainly concentrates around Zhenping country. Their secondary factors contributing to poverty are education,schooling and fuel.Besides,the multidimensional poverty incidence is the highest in mountainous area in Xichuan country,MPI is relatively lower around the center of the country.
DOI:10.1016/j.jrurstud.2017.04.002URL [本文引用: 2]
DOI:10.11821/dlxb201710008URL [本文引用: 1]
It is a China's strategic demand to systematically and accurately measure the poverty characteristics of poverty-stricken areas from the perspective of village-level poverty. In this context, this paper constructs a multidimensional poverty evaluation model from the perspective of spatial poverty, and combines the decomposition of indicator contribution degree and linear regression method to explore poverty contributing factors. Then it adopts LSE (Least Square Error) model and geostatistics analysis model to classify the villages' poverty types and spatial distribution difference, so as to grasp the whole poverty characteristics, poverty contributing factors and poverty types of poor villages all over the country and to provide auxiliary decision-making support services for eradicate poverty in 2020. Taking 51461 villages in China as a case, we can draw some conclusions as follows: (1) The distribution of poverty-stricken villages has an obvious regional characteristic from the perspectives of poverty level and poverty size, and most poor villages are concentrated in contiguous destitute areas, showing a pattern of high in the west and low in the east. In view of poverty level, there exists an obvious olive-shaped structure of big in the middle and small on two sides, and nearly half of the poverty-stricken villages are moderately poor. (2) China's poor villages have four main poverty contributing factor dimensions, i.e. , harsh transportation conditions, frequent natural disasters, low income and poor labor force qualities, of which, the significant poverty contributing factors are road access ratio, terrain type, suffered frequency of natural disaster, per capita net income, labor force ratio, ratio of illiterate labor forces, etc. (3) China's poor villages are driven by multiple poverty types, among which, those villages with three-factor dominated, four-factor collaborative and five-factor combined types have a relatively high proportion. (4) "Entire-village Advancement" poverty reduction strategy has achieved an initial performance, improved the village's sustainable development environment and raised the income of poor population. However, each village has its own poverty characteristics, therefore, anti-poverty measures should be adjusted according to its respective local conditions.
DOI:10.11821/dlxb201506012URL [本文引用: 1]
Developing methods for measuring multi-dimensional poverty and improving the accuracy of poverty identification have been the hot topics in international poverty research for decades. In light of the academic thoughts of the vulnerability and sustainable livelihood analysis framework, this paper establishes an index system and a method for geographical identification of multi-dimensional poverty, and carries out a county-level identification in rural China. Furthermore, this study makes a comparison between the identification result, income poverty and the latest designated poor regions by the Chinese government. At last, the identified multi-dimensional poor counties are classified by the similarity of poverty reduction measures. The results show that: (1) Taking the vulnerability and sustainable livelihood analysis framework proposed by DFID as theoretical basis, we build an index system of multi-dimensional poverty identification to reflect the farmers' livelihoods that multiple factors work on. It is feasible to develop a composite Multi-dimensional Development Index (MDI) for the integrated method of geographical identification of multi-dimensional poverty in rural China. (2) A total of 655 counties are identified as multi-dimensional poor counties. They are concentrated and jointly distributed in space, in which the Tibetan Plateau and its neighboring areas of three prefectures in southern Xinjiang, western Loess Plateau, mountainous and gully areas in western Yunnan and Sichuan, are suffering greatly from poverty. Besides, poor counties are mainly in Wumeng-Daliang mountainous areas, Yunnan-Guizhou-Guangxi rocky desertification areas, border mountainous areas in Yunnan, Wuling mountainous areas, Qinling-Daba mountainous areas, Shanxi-Shaanxi gully areas and Yanshan-Taihang mountainous areas. (3) In comparison to the latest designated poor counties, this paper targets at poor counties with more disadvantages at both single and multiple dimensions. Some 71.79% of designated poor counties overlap with identified poor counties. By contrast, the majority of the designated poor counties located in mountainous areas of central or eastern China do not belong to identified poor counties because of much less disadvantage/deprivation dimensions. However, the identified poor counties, which are mainly distributed in marginal areas of plateau or mountainous areas in western China, and suffering from multiple dimensions of disadvantages and deprivations, are not included in the designated poor counties. (4) According to the disadvantage/deprivation situation of different dimensions, multi-dimensional poor counties are classified into eight types, i.e., lack of financial capital, lack of human capital, lack of infrastructure, lack of both financial capital and infrastructure, lack of both human capital and infrastructure, lack of means/strategies of livelihoods, lack of living condition, and lack of development condition.
DOI:10.11821/dlxb201808007URL [本文引用: 2]
Poverty has long been the focus of all countries in the world. To achieve the goal of building a moderately prosperous society in all aspects, Chinese government clearly points out that all rural residents living below the current poverty line should be lifted out of poverty, and poverty should be eliminated in all poverty-stricken counties and regions by 2020. But due to the limitation of development capacity, the improvement of the new poverty standard and living standard, there will still be quite a large number of people in poverty in future and it will exist for a long time. Thus, it is of great significance to study the pattern of rural poverty and the poverty stress at county level in China and investigate anti-poverty targeting after 2020. To this end, we first analyze the mechanism of rural poverty from the perspective of man-land areal system and construct an indicator system of county development index (CDI) to characterize county poverty stress. Then the BP neural network model is applied to measure the poverty stress and identify the county that still need policy-support (CNPS) after 2020 when the goal of eliminating poverty is achieved. Results show that poverty is a manifestation of the imbalance between human system and land system, which can be measured by three aspects, i.e., human development capability, natural resource endowment and socio-economic development. The deficiency of natural resource endowments is one of the main causes of poverty, while socio-economic development and improvement of agricultural production conditions make contribution to poverty alleviation in rural areas. Human development capability, socio-economic level, natural resource endowment and comprehensive development at county level in China show a gradient decrement from the southeast coast to the northwest inland, which can be divided into three agglomerated areas by the three ladders of the terrain. More concretely, high-cold regions of Tibetan Plateau and its periphery, as well as arid areas in the west of South Xinjiang are the low-value areas of CDI. The eastern coastal areas, Sichuan Basin and the middle and lower reaches of the Yangtze River, where the natural condition is good and the level of economic development is high, are the middle-high-/high-value areas of CDI. At last, the standard deviation of CDI is applied to measure poverty stress at county level. Results show that 716 counties need to be further focused by national anti-poverty policies after 2020, most of which are distributed in the high-cold region of Tibetan Plateau, the transition zone of the three ladders and the Karst region in Southwest China. These counties can be roughly divided into four types, i.e., key aiding counties restricted by multidimensional factors (Type Ⅰ), general aiding counties restricted by human development capability (Type Ⅱ), general aiding counties restricted by both natural resource endowment and socio-economic development (Type Ⅲ), and tgeneral aiding counties restricted by both human development capability and socio-economic development (Type Ⅳ). Understanding poverty patterns and its dynamic mechanisms as well as the ways to poverty reduction in the new period can enrich the study of poverty geography.
[本文引用: 1]
[本文引用: 1]
DOI:10.11820/dlkxjz.2014.01.014URL [本文引用: 1]
With the economic integration of the Beijing-Tianjin-Hebei Region, there exists a poverty belt around Beijing and Tianjin within Hebei Province, which has received attention from academia and the public, so as to put the setting standards of poor counties into the spotlight. Despite some applications of not merely economic indicators but also social and natural indexes to identify poverty in academic researches, the setting of poor counties is only based on economic indicators in China. This paper adds indicators in social dimension representing human poverty and in natural dimension representing natural poverty to build a multidimensional poverty index system, and utilizes SOFM (self-organizing feature mapping) nonlinear clustering tool to classify all of the 136 counties in Hebei Province into 5 categories in view of the county poverty degree by the economic dimension & economic-social-natural dimensions separately. Clustering maps are compared with the map of currently poor counties in Hebei Province afterwards. The results show that the counties with low grades are the ones with high poverty degree. Meanwhile, counties with low grades are the majority, suggesting a high poverty degree all over Hebei Province. About the clustering results, whether in the single economic dimension or economic-social-natural dimensions, they are both consistent with the current distribution pattern of poor counties in Hebei Province which helps the transformation of "relative poverty" to "absolute poverty". Besides, in comparison to the results based on the single (economic) dimension, multidimensional (economic-social-natural) evaluation is more comprehensive because it takes current situation and potential of poverty into overall consideration. Furthermore, potential poverty degree in the natural dimension influences the comprehensive poor degree, indicating that both the current and potential poverty degree of poverty areas around Beijing and Tianjin are high and the region should cooperate with Beijing and Tianjin actively. In contrast, the potential poverty degree of poor counties in the south and middle Hebei Province is relatively low and the region is more easily to be lifted out of poverty. Moreover, these regions covers many counties that are not considered to be poor ones but very likely to become poor ones. Therefore, these regions deserve more attention and being treated differently. To make advances in the poverty relief and development work, the government should not only deal with things distinctively but also combine prevention with treatment and link the areas together. In this way we can expect the achievement of Beijing-Tianjin-Hebei coordinated development and the harmoniously simultaneous growth of wealth of society.
DOI:10.11821/dlxb201810003URL [本文引用: 1]
Targeted poverty alleviation is a pillar of China's new and innovative anti-poverty and development strategy. China is an agricultural country with a large but poor rural population. At the village level, poverty alleviation has the potential to affect millions of citizens. The Loess Plateau is a composite of fragile ecological environment and rural poverty communities. As a backward economy often twins with fragile ecology, studying poverty from a multidimensional perspective in tandem with spatial heterogeneity and its influencing factors can provide an effective analysis of poverty in regions with characteristics similar to those of the Loess Plateau. This study features Pengyang, which is a poverty-stricken county located on the Loess Plateau, and relies on the approach by Alkire and Foster to measure multidimensional poverty, using spatial autocorrelation, Geodetector, OLSR and quantile regression (QR) analysis. Results from our investigation show that the study area has a deep level of multidimensional poverty, with a Multidimensional Poverty Index (MPI) score of 0.045. The rates of health, housing, and education dimensions were 0.263, 0.245, and 0.227, respectively. Moran's I of MPI was 0.2, which indicates that multidimensional poverty was positively correlated with a spatial pattern of "north, south, middle; high, high, low". Using Geodetector, the mean distance between villages and the center of town, as well as the mean elevation of the villages and mean distance to a river, were found to be the main factors of spatial heterogeneity within the MPI. The q-values of them were 0.552, 0.396, and 0.326, respectively, and the result of regression analysis conforms to the Geodetector. The interaction of the above factors enabled the creation of a multidimensional poverty spatial heterogeneity mechanism at village level for the Loess Plateau, revealing a lack in welfare of farmers, the poor of infrastructure, the congenital deficiency and stalled development of industry, and weak government functioning at the township level. Our results suggest that new strategies regarding urbanization should be investigated in order to improve and ensure the quality of public services in areas with similar characteristic as the Loess Plateau. These new strategies could enable the resolution of problems from the root, such as designing public goods and services that fill gaps in current health care and housing options, as well as the operation of transport facilities at the village level. This could help to mitigate welfare loss of farmers as well as reduce the negative impact of health, housing, education, and other dimensions of poverty.
DOI:10.1016/j.landusepol.2018.12.024URL [本文引用: 1]
DOI:10.1108/CAER-10-2017-0192URL [本文引用: 1]
DOI:10.11821/dlxb201703014URL [本文引用: 1]
The innovation of spatial poverty measurement method is the key to precisely allocate poverty alleviation resources and improve the quality of rural poverty alleviation. This paper summarized the three-dimensional analysis framework of spatial poverty and constructed the spatial poverty index system at county scale and the method of geographical identification. With Jingyuan county as a study case, the geographical identification of spatial poverty was carried out. The results can be obtained as follows. (1) Spatial poverty index (SPI) in different geographical areas is listed in the order: Plain Area in Valleys Formed by Erosion and Deposition of Rivers (PAVFEDR) (mean value 1.571) > Denudation Structure in Hilly Regions (DSHR) (mean value -0.199) > Erosion Structure in Mountainous Regions (ESMR) (mean value -0.334), indicating that the highest poverty degree is in ESMR, which should be the main area of poverty alleviation. The common feature of spatial poverty in the three geographical areas is economic disadvantage (C4-C7, C17). The main differences are: for PAVFEDR, ecological disadvantage (C25, C16) > economic disadvantage (C5) > location disadvantage (C20) > political disadvantage (C8); for DSHR, economic disadvantage (C5-C7, C17) > location disadvantage > (C18-C20) > ecological disadvantage (C16, C23-C25) > political disadvantage (C8); for ESMR, economic disadvantage (C4-C7, C17) > political disadvantage (C8) > location disadvantage (C18-C20) > ecological disadvantage (C16, C21-C25). (2) The rank of SPI for different ethnic villages is as follows: Han villages (mean value 1.484) > Hui villages (mean value 1.262) > Hui-Han mixed villages (mean value 1.033), indicating that Hui-Han mixed villages at county scale should be the key villages for poverty alleviation. The common feature of spatial poverty in different ethnic villages is the economic disadvantage resulting from the long distance to the nearest market (C17), as well as the ecological disadvantage due to less arable land per capita (C23) and small crop area, especially economical crop area (C24). The main differences of spatial poverty in different ethnic villages are ecological disadvantage resulting from poor living conditions and high disaster loss rate in Han villages, as well as economic disadvantage caused by lack of loans (C5). For Hui villages, it is economic disadvantage caused mainly by low level of knowledge (C12, C13) that leads to the high opportunity cost in entering the market. In Hui-Han mixed villages the differences of production and lifestyle resulted in difficulties in allocation of poverty alleviation resources, consequently the satisfaction rate of poverty alleviation policies (C8) is the lowest for farmers, reflecting that the political disadvantage of spatial poverty is most significant. (3) There are significant differences in spatial poverty among different ethnic villages in the same physical geographical area. The mean values of SPI for Han, Hui, and Hui-Han mixed villages in PAVFEDR are 0.526, 2.557 and 1.644, respectively, which indicates that the Han villages have a high level of poverty and economic disadvantage (C5); the mean values of SPI for Hui and Hui-Han mixed villages in DSHR are 0.321 and -1.934, respectively, which indicates that the poverty level for Hui-Han mixed villages is high, and economic disadvantage (C2, C6, C7) and ecological disadvantage (C16) are both significant; the mean values of SPI in Han, Hui and Hui-Han mixed villages in ESMR are 1.031, -0.029 and -0.842, respectively, which indicates that the poverty level of Hui-Han mixed villages is high, and economic disadvantage (C5-C7, C17), political disadvantage (C8), location disadvantage (C18-C20) and ecological disadvantage (C16, C25) are all present. Therefore, the Han-villages in PAVFEDR, Hui-Han mixed villages in both DSHR and ESMR should be the key villages of poverty alleviation.
URL [本文引用: 1]
Achievements of spatial poverty on the international scale have been becoming richer and richer since 1990s,and gradually becoming the important basis for western developed countries and relevant international organizations to formulate policies on regional poverty alleviation,extending and broadening the research about the geography of poverty of the world on the width and depth greatly. Based on the detailed statement about concept,index system and research methods of spatial poverty,influencing factors and spatial characteristics of spatial poverty,poverty mapping and poverty maps,poverty policy evaluation and design and so on were discussed. Furthermore,domestic status quo and deficiencies of the research about the geography of poverty were analyzed,and suggestions such as geographic capital of spatial poverty,mechanism of spatial poverty trap,development of spatial poverty maps and so on were brought forward to enrich the theories and method systems in China,which would have scientific,theoretical and academic significance for enriching the study of social geography;what is more,it also has significance of decision-making and practical promotion for the sustainability of poverty reduction and building harmonious society.
[本文引用: 1]
[本文引用: 1]
DOI:10.1002/(ISSN)1099-1255URL [本文引用: 1]
[本文引用: 1]
DOI:10.1111/asej.2001.15.issue-4URL [本文引用: 1]
DOI:10.1016/S0305-750X(02)00220-6URL [本文引用: 1]
[本文引用: 1]
DOI:10.1016/j.landusepol.2017.04.037URL [本文引用: 2]
DOI:10.1016/S0305-750X(01)00109-7URL [本文引用: 1]
URL [本文引用: 1]
This paper analyzes the causes of regional poverty and antipoverty process in China. The causes that lead to regional poverty includes regime factors, policy factors and natural environmental factors, and nowadays natural environmental factors become the main causes of regional poverty in China. Using regression model, the relationship between regional poverty and natural environmental factors is established and results show that relief features such as altitude, surface fragmentation are negative correlation, while some socioeconomic factors are positive correlation with dependent variableper captia gross domestic product (GDP). Based on the regression results, we develop the BP model with 6 neurons in input layer and 1 neuron in output layer. Have trained and tested BP model with training data, the natural impoverishing index is evaluated. Compared with the distribution of poor counties, ANN modeling results are more explicit and more fine, which are consistent with the spatial distribution of poverty counties in China at general. According to the geospatial analysis, pattern of natural poverty exhibits the spatial aggregation. The higher natural impoverishing index is mainly distributed in the western arid and cold area, southwestern karst area, Yanshan Mountainous area, Taihang Mountainous area and QinBa Mountainous area. ANN model simulation is a valid approach to study pauperization.
[本文引用: 2]
[本文引用: 2]
DOI:10.11820/dlkxjz.2006.03.010URL [本文引用: 2]
Owing to the fragile eco- environment, terrain fragmentation, and serious soil erosion, the karst area in Southwest China is one of the distinct poor regions. Selecting Maotiaohe watershed as study area, taking villages and towns as studying unit, and using GIS and ANN model, this paper simulates the spatial distribution of natural impoverishing index and socio- economic alleviating impoverishing index, calculates the poverty degree of villages and towns, and reveals the spatial distribution of poverty in order to provide scientific basis for eliminating poverty and ecological reconstruction. The results show that the natural factors such as soil erosion and so on are the main impoverishing indexes, and socio- economic factors are the main alleviating impoverishing indexes. The villages and towns with smaller poverty degree are mainly distributed in the middle and east area of Maotiaohe watershed, and those with larger poverty degree are mainly distributed in the southern and northern area of Maotiaohe watershed. The results also indicate that application of BP neural network to simulating regional poverty is convenient, precise and feasible, which can be an alternative approach to simulating regional poverty.
[本文引用: 1]
[本文引用: 1]
[本文引用: 1]
[本文引用: 1]
[本文引用: 1]
