 , 林齐根
, 林齐根Spatial pattern and influencing factors of casualty events caused by landslides
WANGYing, LINQigen收稿日期:2016-08-1
修回日期:2017-01-15
网络出版日期:2017-07-12
版权声明:2017《地理学报》编辑部本文是开放获取期刊文献,在以下情况下可以自由使用:学术研究、学术交流、科研教学等,但不允许用于商业目的.
基金资助:
作者简介:
-->
展开
摘要
关键词:
Abstract
Keywords:
-->0
PDF (3944KB)元数据多维度评价相关文章收藏文章
本文引用格式导出EndNoteRisBibtex收藏本文-->
1 引言
地质灾害极易造成人员伤亡,中国2000-2012年的13年里共发生地质灾害33.9万起,伤亡45381人,年均伤亡约3500人,仅次于地震、洪水灾害[1]。地质灾害种类较多,但根据2004年国务院颁发的《地质灾害防治条例》[2]规定,地质灾害主要指危害人民生命和财产安全的崩塌、滑坡、泥石流、地面塌陷、地裂缝、地面沉降六种与地质作用有关的灾害,其中崩塌、滑坡、泥石流(简称崩滑流)是引发人员伤亡的三大主要地质灾害,本文的地质灾害主要指崩滑流灾害。2011年,中国地质环境监测院根据环境地质调查数据编制了中国崩塌滑坡灾害图[3]、中国泥石流灾害图[4],并指出,中国崩滑流灾害主要分布于东北、华北丘陵山地,东南丘陵山地,川西北龙门山区,秦巴山区,三峡库区沿岸,黔西南山区、黄土高原,西北山地盆地高原区,青藏高原。但是上述灾害图中,只有该灾害事件的强度,没有相关的灾情记录。而对于灾害风险防范工作,造成人员伤亡的灾害事件,更应引起重视。
国内外研究表明,地质灾害的发生受到自然环境类因素影响,包括地形、岩性、地质、土壤、植被、降水[5-11]等。但是,地质灾害与地震、水旱灾害的不同之处还在于它们的发生与人类自身活动对环境的影响之间有着紧密的联系。例如中国20世纪的地质灾害中,70%以上的大型滑坡与人类活动有密切关系,其中50%的滑坡就是人类活动直接触发的[12]。日本****Ayalew等[13]以道路网络、多个地形因素为自变量,对日本中部山脉进行滑坡危险性评估,发现道路网络是影响滑坡发生和分布重要的决定因素;Jadda等[14]采用概率频率比模型和地理信息技术,综合考虑道路、地质、土壤、地形、水系等因素进行伊朗厄尔布尔士山脉滑坡危险性制图,结果为地质、道路影响最大,距离道路越近滑坡危险性越高;Eeckhaut等[5]的欧洲滑坡危险性分析制图中将土地利用类型分为农田、森林、草地、裸露地、城市用地和常被淹没土地,共6类,以农田为参考类别,森林比农田更容易发生地质灾害,而城市用地则相反。但是,总的来看,上述研究的主要关注点是局部山区,以及道路、土地利用这2个直接触发因素,没有探讨人类综合活动因素对地质灾害的影响。
因此,本文以中国县域为研究单元,基于2000-2012年的主要地质灾害伤亡事件数据,从宏观尺度上,对中国地质灾害人员伤亡事件的空间格局进行研究,定量评估自然因素、人类活动因素对地质灾害伤亡事件的贡献程度。这对于认识中国地质灾害造成人员伤亡事件的主要规律,制定相应的防灾减灾措施极为重要。
2 研究区与研究方法
2.1 研究区和数据
中国地质和地理环境复杂,气候条件时空差异大,地质灾害分布广、危害大[15]。但是,中国的地质灾害事件统计发布,自2011年以后才逐渐规范完善,由中国国土资源部通过《地质灾害灾情险情报告》[16]实时报道发布。年度灾情由地质环境监测院采用《全国地质灾害通报》[17]的方式统计公布。但2011年之前的地质灾害事件数据就较为分散。因此作者分别从民政部国家减灾中心、国土资源部、新闻网站,收集了这些部门统计的2000-2012年共13年造成人员伤亡事件的崩滑泥灾害案例。根据灾害发生的时间、地点,进行校对排重,将每一起地质灾害的类型、发生时间、地点、人员伤亡、灾害损失等信息进行统一整理,建成《中国主要地质灾害伤亡数据库》,共计576起地质灾害伤亡事件,具体数据来源如表1所示。Tab. 1
表1
表1中国主要地质灾害伤亡数据库的数据来源
Tab. 1Data sources of China's geological disaster casualty database
| 数据来源 | 编制单位 | 记录数 | 获得途径 |
|---|---|---|---|
| 地质灾害灾情险情报告[16] | 中国国土资源部 | 95 | 国土资源部网站 |
| 全国地质灾害通报[17] | 中国地质环境监测院 | 81 | 中国地质环境信息网 |
| 昨日灾情报告[18] | 民政部国家减灾中心 | 228 | 民政部国家减灾中心 |
| Web新闻搜索 | 新闻网站 | 172 | 网络收集整理 |
新窗口打开
需要指出的是,中国会出现一些山洪灾害与泥石流灾害并发的情况,例如2005年6月黑龙江宁安沙兰镇小学山洪泥石流灾害、2009年舟曲特大山洪泥石流灾害等,此类山洪泥石流并发灾害的灾情都十分巨大,形成机理与单发泥石流灾害又有较大差别,故本文的数据库不包括此类并发型灾害事件。
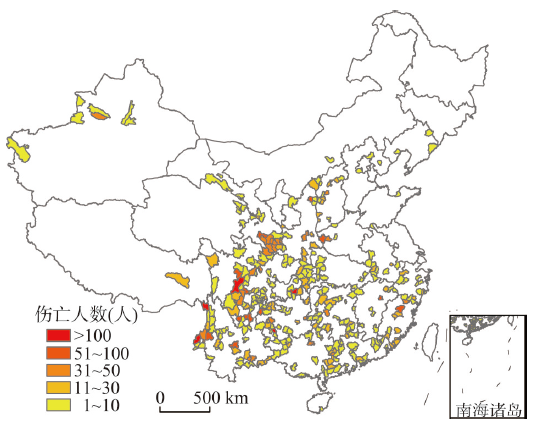
根据地质灾害伤亡事件所在的县域,编制中国地质灾害伤亡县分布图(2000-2012年)(图1),共有334个县域发生过地质灾害人员伤亡事件,这些县简称地质灾害伤亡县。
 显示原图|下载原图ZIP|生成PPT
图1中国地质灾害伤亡县空间分布(2000-2012年)
-->Fig. 1Distribution of geological disaster casualty counties in China (2000-2012)
-->
分析图1,中国地质灾害伤亡县的分布总体呈南多北少的格局,主要分布于四大区域:一是中国西南部的四川盆地和云贵高原地区,约占39%;二是东南丘陵地区,约占34%;三是位于北方的黄土丘陵;约占12%;四是西北祁连山脉和天山山脉等地区,约10%。与中国崩塌滑坡灾害图[3]、中国泥石流灾害图[4]相比,中国华北、东北等平原地区以及青藏高原等人烟稀少地区只有很少的伤亡事件分布。
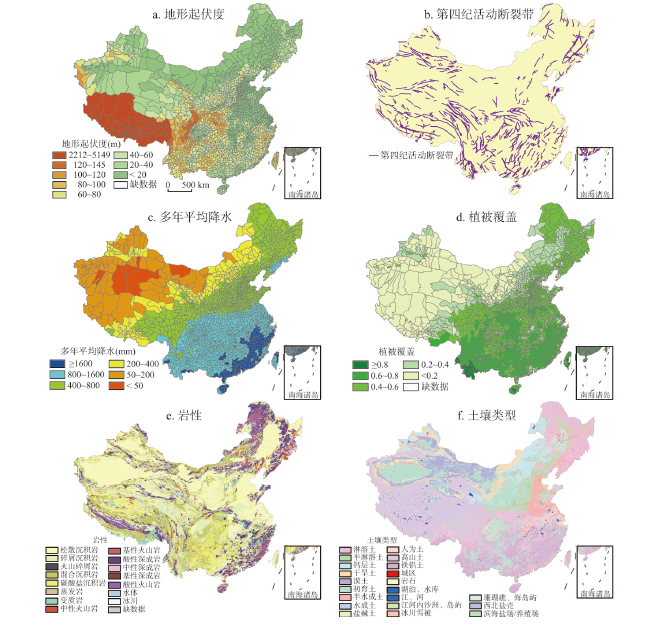
综合中国自然环境特征,通过多个因子进行分析,本文选择地形、断裂带、降水、植被、岩性、土壤类型作为影响地质灾害伤亡事件的6类主要自然环境类因素。通过GIS空间分析提取各县域内平均地形起伏度(图2a)、县域的断裂带情况(图2b)、年平均降水(图2c)、植被覆盖度(图2d)、县域内的主要岩性类型(图2e)、县域内的主要土壤类型(图2f)这6个指标来表征上述因子(数据来源为地理空间数据云[19]和地球系统科学数据共享平台[20])。对比图1和图2可以发现,这些自然因素和地质灾害伤亡事件有较大的空间相关性:地形起伏偏大、断裂带密集、降水偏多、植被覆盖偏高的地区,地质灾害伤亡事件偏多。
 显示原图|下载原图ZIP|生成PPT
图2中国自然环境类因子分布图
-->Fig. 2Distribution maps of natural environment factors of China
-->
 显示原图|下载原图ZIP|生成PPT
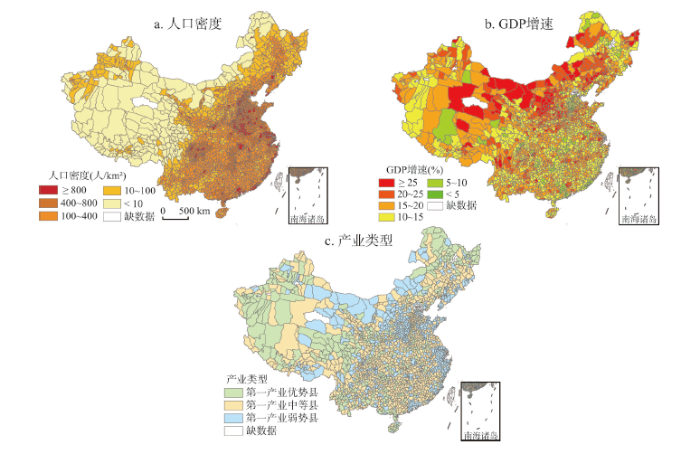
图3中国人类经济活动类因子分布图
-->Fig. 3Distribution maps of human-economic activity factors of China
-->
但是,并不是所有具有上述特征的县域都会发生地质灾害伤亡事件,例如云南、福建等省的一些县域,虽然自然环境因素和周围县域很相似,但并未发生伤亡事件,这个原因正如前所述,与人类活动有关。因此,地质伤亡县域的分布格局还应考虑人口密度(图3a)、人类活动强度等因素。
经济是反映人类活动强度最综合的指标。2000-2012年中国经济始终保持快速增长,平均每年GDP增速达10.14%(按可比价格计算),但是一些地区经济的快速增长往往是以疯狂挖掘资源、环境破坏为代价的。世界银行的经验数据表明社会黄金发展期,也是各类灾难事故风险高发期[21]。因此,本文采用GDP增速(图3b)、产业类型(图3c)2个指标来反映人类活动强度。GDP增速是指2000-2012年各县的年均GDP增长速度;产业类型是指2010年各县的第一产业占GDP的比例,可以采用文献[22-23]的自然断点法(Nature Break)将各县分为3类:第一产业优势县、中等县和弱势县。
从宏观格局看,图3中各分图与图1地质灾害伤亡分布的相关性不高,人口密度呈东西分布、GDP增速较快的县零散分布于各个省区、产业类型县在中国东中地区混杂分布,因此,还需要采用回归模型对这些数据进行进一步的分析。
2.2 研究方法
Logistic回归模型是一种概率型非线性回归模型,是研究影响因素与因变量之间关 系的常用方法[24-26]。近年来,该模型被广泛应用于地质灾害的危险性、敏感性评估与制 图[5-7, 9, 13, 27-29]。二元Logistic回归方程表达式如下:式中:P为因变量,是自变量因子相对于某一事件的发生概率,取值范围为[0, 1];xi是自变量因子(i = 1, 2, ..., k),是影响事件发生的因素;k为自变量个数;βi是偏回归系数,反映自变量因子xi对P的影响程度大小。
Logistic回归模型中,自变量有连续变量和分类变量两种。连续变量可以直接放入式(1),回归分析后,得到偏回归系数β,其意义是自变量连续变化对P大小的影响程度。分类变量,首先要根据数值情况,进行分类,分类后赋上相应的数值,代入式(1),所得到的β的意义是:与参考类因子相比,该类因子对事件的发生是否存在显著差异,如果存在,则说明该因子对因变量有影响。
根据《中国主要地质灾害伤亡数据库》中有无伤亡记录,对全国2215个县域进行分类,由于北京、天津和上海三市的市辖区以及台湾等县域缺少数据,西藏自治区整体地形较为特殊,故上述地区的7个伤亡县未进入模型计算,伤亡县数变为327个。将有伤亡记录的县域,P设置为1;无伤亡记录的县,P设置为0。再将这些县域对应的人口经济数据、自然数据代入式(1),即可根据偏回归系数β的情况,来判断各个因素与地质灾害伤亡事件的关系。
本文“1”的县数为327;“0”的县数为1888。0的样本过大。在Logistic回归模型的应用中,King等[30]认为“1”样本过少,会使得该类预测概率被严重低估,建议将两者的比率控制在0.2~1之间。因此,为了准确预测伤亡县“1”的概率,同时全面考虑非伤亡县“0”的样本信息,将非伤亡县“0”的全部样本与4倍伤亡县“1”的样本一起引入模型分析,即伤亡县“1”的样本为327×4=1308个;非伤亡县“0”为1888,1:0的比率为0.69,从而避免模型过于偏向非伤亡县。上述方法称为过抽样方法,目前在机器学习中被广泛使用,以实现训练样本数据均衡[31]。
地形起伏度、年平均降水、植被覆盖度、GDP增速和人口密度5个影响因素均为连续变量。由于各影响因素的数值差别较大,因此首先进行自然对数标准化处理,再进入Logistic回归模型。
断裂带、岩性、土壤类型和产业类型是分类变量。断裂带变量,依据县域内是否有第四纪活动断裂带来赋值。如果有,赋值为1,否则为0。岩性参照Hartmann等[32]的世界岩性图分类,将岩性分为松散沉积岩、碳酸盐沉积岩、混合沉积岩、碎屑沉积岩、蒸发岩、火山碎屑岩、变质岩、酸性深成岩、中性深成岩、基性深成岩、酸性火山岩、中性火山岩、基性火山岩、冰川和水体15类,以松散沉积岩为参考类别,将岩性变量转化为14个二分类虚拟变量;如某县岩性为碳酸盐沉积岩的面积最多,则该县在碳酸盐变量里是1,在其他岩性变量里都是0。土壤类型数据从中国科学院资源环境数据中心获得,采用“土壤发生分类”系统方法划分土壤类型,分为12个土纲,包括淋溶土、半淋溶土、钙层土、干旱土、漠土、初育土、半水成土、水成土、盐碱土、人为土、高山土和铁铝土;同岩性变量类似,以淋溶土为参考类别,其余转化为11个虚拟变量进入模型。产业类型变量,用自然断点法将各县分为3类,第一产业占GDP的比例≥ 31.21%,为第一产业优势县;第一产业占GDP的比例为14.70%~31.21%,就是第一产业中等县;其他为第一产业弱势县;以第一产业优势县为参考类别,其余2类转化为2个虚拟变量代入模型计算。
3 结果分析
表2为Logistic回归模型中的变量,由表2可知,地形起伏度、GDP增速、年平均降水量、断裂带、岩性、土壤、产业类型、人口密度和植被覆盖度9个变量的Sig.<0.05,说明这些变量对地质灾害伤亡事件确实存在影响。影响程度的大小,由Exp(β)的大小决定,Exp(β)是优势比(简称OR),表示自变量每变化一个单位,引起事件发生概率相应变化的比例。Exp(β)值大于1,说明是正向影响;Exp(β)值小于1,说明是负向影响。Exp(β)距离1越大,说明该因子的影响程度越大。因此,地形起伏度变大、GDP增速变大、年平均降水量变大、断裂带经过、人口密度变大,都会增加该县域地质灾害伤亡发生的可能性,但植被覆盖度的变大会降低可能性,这说明虽然从全国尺度看,伤亡县主要分布在植被覆盖相对偏高的南方地区,但在各种自然因素一致的情况下,增加植被覆盖度可以降低地质灾害伤亡事件的发生。与淋溶土相比,干旱土、漠土、初育土和人为土会增加地质灾害伤亡事件发生的可能;与松散沉积岩相比,碳酸盐沉积岩和酸性火山岩会减少地质灾害伤亡事件发生的可能;与第一产业优势县相比,中等和弱势县会增大地质灾害伤亡事件发生的可能。
将表2中的参数代入式(1),结果为式(2)、(3):
Tab. 2
表2
表2Logistic回归模型中的变量
Tab. 2Variables applied in the logistic regression model
| 变量 | β | S.E. | Sig. | Exp(β) |
|---|---|---|---|---|
| ln地形起伏度 | 1.922 | 0.117 | 0.000 | 6.834 |
| lnGDP增速 | 0.996 | 0.209 | 0.000 | 2.706 |
| ln年平均降水量 | 0.535 | 0.178 | 0.003 | 1.707 |
| ln植被覆盖度 | -0.333 | 0.159 | 0.037 | 0.717 |
| 断裂带 | 0.374 | 0.093 | 0.000 | 1.453 |
| ln人口密度 | 0.317 | 0.063 | 0.000 | 1.373 |
| 岩性a | 0.000 | |||
| 碎屑沉积岩 | -0.649 | 0.171 | 0.000 | 0.523 |
| 火山碎屑岩 | -0.448 | 0.330 | 0.174 | 0.639 |
| 混合沉积岩 | -0.173 | 0.168 | 0.302 | 0.841 |
| 碳酸盐沉积岩 | -0.572 | 0.178 | 0.001 | 0.564 |
| 酸性火山岩 | -1.574 | 0.408 | 0.000 | 0.207 |
| 中性火山岩 | -0.866 | 0.475 | 0.069 | 0.421 |
| 基性火山岩 | -19.936 | 9093 | 0.998 | 0.000 |
| 酸性深成岩 | -0.204 | 0.184 | 0.268 | 0.815 |
| 中性深成岩 | -20.172 | 12480 | 0.999 | 0.000 |
| 基性深成岩 | -19.612 | 40190 | 1 | 0.000 |
| 变质岩 | 0.238 | 0.309 | 0.442 | 1.268 |
| 水体 | -17.337 | 27290 | 0.999 | 0.000 |
| 土壤类型a | 0.000 | |||
| 半淋溶土 | -0.396 | 0.241 | 0.1 | 0.673 |
| 钙层土 | 0.567 | 0.31 | 0.068 | 1.762 |
| 干旱土 | 1.183 | 0.477 | 0.013 | 3.263 |
| 漠土 | 2.083 | 0.532 | 0.000 | 8.026 |
| 初育土 | 0.447 | 0.169 | 0.008 | 1.564 |
| 半水成土 | 0.857 | 0.468 | 0.067 | 2.357 |
| 盐碱土 | -17.918 | 12030 | 0.999 | 0 |
| 人为土 | 0.893 | 0.284 | 0.002 | 2.443 |
| 高山土 | 0.467 | 0.3 | 0.119 | 1.595 |
| 铁铝土 | 0.524 | 0.157 | 0.001 | 1.69 |
| 产业类型a | 0.000 | |||
| 第一产业中等县 | 0.536 | 0.126 | 0.000 | 1.71 |
| 第一产业弱势县 | 0.352 | 0.145 | 0.015 | 1.422 |
| Constant | -11.913 | 1.344 | 0.000 | 0.000 |
新窗口打开
式中:P为地质灾害伤亡发生事件概率;X1为ln地形起伏度;X2为lnGDP增速;X3为ln年平均降水量;X4为ln植被覆盖度;X5为断裂带;X6为ln人口密度;X71为碎屑沉积岩;X72为火山碎屑岩;X73为混合沉积岩;X74为碳酸盐沉积岩;X75为酸性火山岩;X76为中性火山岩;X77为基性火山岩;X78为酸性深成岩;X79为中性深成岩;X710为基性深成岩;X711为变质岩;X712为水体;;X81为半淋溶土;X82为钙层土;X83为干旱土;X84为漠土;X85为初育土;X86为半水成土;X87为盐碱土;X88为人为土;X89为高山土;X810为铁铝土;X91第一产业中等县;X92第一产业弱势县。该式即为中国地质灾害伤亡事件发生概率模型(the Probability Model of Casualty Events Caused by Landslide in China, CELC模型)。
通过混淆矩阵和ROC曲线对CELC模型的精度进行评估。表3为CELC模型的预测混淆矩阵,即对是否为地质伤亡县两类情况的预测正确率,分割值为0.5,P ≥ 0.5判断为地质灾害伤亡县,P<0.5则判断为未发生地质灾害伤亡县。模型总的正确率为75.0%,其中非地质灾害伤亡县的正确率为75.0%,地质灾害伤亡县的预测正确率为74.9%。
Tab. 3
表3
表3CELC模型的预测混淆矩阵
Tab. 3Confusion matrix for the CELC model
| 实际是否伤亡 | 模型预测 | ||
|---|---|---|---|
| 是否伤亡 | 正确率(%) | ||
| 0 | 1 | ||
| 0 | 1416 | 472 | 75.0 |
| 1 | 328 | 980 | 74.9 |
| 总体百分比 | 75.0 | ||
新窗口打开
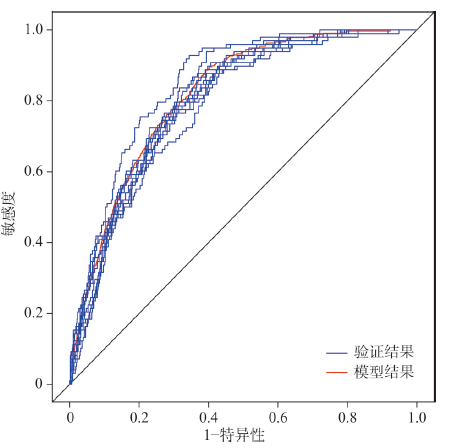
图4中红色线为CELC模型的ROC曲线(Receiver Operating Characteristic),对ROC曲线下的面积(AUC)进行统计,AUC = 0.826,标准误差0.007。根据Swets[33]的研究,ROC曲线下面积在0.5~0.7之间表示预测价值较低,在0.7~0.9之间表示预测价值中等,0.9以上表示预测价值高。因此,本模型具有相对较高的预测价值。
 显示原图|下载原图ZIP|生成PPT
图4中国地质灾害伤亡事件发生概率模型和70%样本建立的模型验证结果的ROC曲线
-->Fig. 4ROC curve for probability model of casualty events caused by landslides in China and validation of models produced from 10 samples of 70% training data
-->
为了进一步验证本文模型的结果,参照Chung等[34]和Poiraud [35]的研究方法,对中国县域进行10次简单随机抽样,每次分别以70%的样本建立模型,30%的样本验证模型结果。因类别变量分类较多,在随机抽样验证过程中某些用于预测模型的类别在建立模型的过程中不存在,导致模型无法计算,因此,随机抽样交叉验证过程中不考虑岩性、土壤类型和产业类型变量。运用ROC曲线计算10次随机抽样建立模型的AUC值为0.811~0.831,相应的30%样本验证结果的AUC值为0.781~0.821(图4),并且10次试验结果的各个参数波动都较小。这说明,CELC模型中的各个因子具有较高的稳定性。
综上,在中国,地形起伏度、GDP增速、年平均降水、植被覆盖度、断裂带、人口密度、岩性、土壤类型和产业类型,对于地质灾害伤亡事件的发生都有影响。
表2中,GDP增速的优势比OR值为2.706,这说明lnGDP增长率每增加1,即年均GDP增长率每增加2.72%,地质灾害伤亡事件发生的概率变为原来的2.706倍,由此可见,高速增长的GDP对于引发地质灾害伤亡事件有重要的影响。这从一个角度证实了,中国一些县域的GDP高速增长,是以破坏环境为代价的,继而引发了很多地质灾害伤亡事件。
除各县的GDP增速外,本文还分析了各县的GDP总值、人均GDP、地均GDP这些因子是否对地质灾害伤亡事件发生有影响,将这些因子引入模型进行计算,但结果表明它们对地质灾害伤亡事件发生都没有显著的影响。分析原因,GDP的大小与该地区当年的积累等诸多因素有关,并不能有效反映当地的人为活动强度。例如,一些前期经济较为发达县的GDP总值、人均GDP、地均GDP都会较高,但这些地区各种发展已经趋于稳定,对环境的破坏也相对较小,故模型结果为影响因子不显著。
4 讨论
将中国2215个县域的自变量数值,放入CELC模型中计算,可以得到各县地质灾害伤亡事件发生概率的大小。由于目前国内外对于地质灾害易发性、危险性概率的分级(包括分多少级、分级的阈值等)尚没有统一的标准,因此借鉴相关的地理制图数据分级方法[22-23],根据上述2215个县数据的分布规律进行分级,分为5级,对应发生概率极高、高、中、低、极低,再对阈值进行适当的取整处理,最终结果如图5所示。从图上可以看到,中国地质灾害伤亡事件发生概率高的地区与图1的分布规律基本相同,主要集中于前述的4大区域。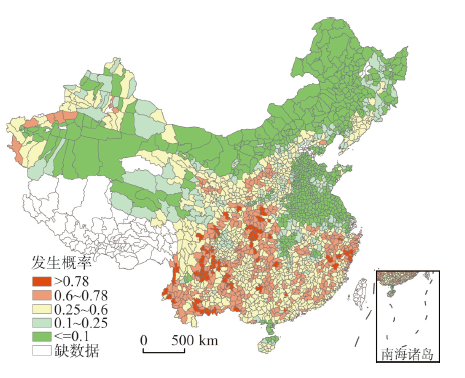 显示原图|下载原图ZIP|生成PPT
图5中国各县域地质灾害伤亡事件发生概率
-->Fig. 5Geological disaster casualty occurrence probability distribution in China
-->
但是,图5中发生概率>0.78的县域共有80个,与图1相比,其中42个县已经发生过地质灾害伤亡事件,38个县尚未发生过地质灾害。38个县中的27个县GDP增速超过本省GDP平均增速,我们认为,这27个县是中国未来可以通过加强监管减低地质灾害风险的区域,这些县的自然环境条件,如地形起伏度、降水、植被覆盖等,都极易引发地质灾害,而且近10年来,这些县的经济始终高速发展。依据其经济发展的不同特点,分为贫困县、矿产工业县域、房产过度开发县3类(表4)。
Tab. 4
表4
表4地质灾害风险重点防范县
Tab. 4Counties, stressing geological disaster risk prevention
| 类别 | 县 域 |
|---|---|
| 贫困县 | 金阳县、永善县、黔江区、泸定县、茂县、冕宁县、镇康县、石柱县、西昌市、会理县、鲁甸县、墨江县、屏边县、河口县、元阳县 |
| 矿产工业县 | 凤县、靖西县、米易县、峨眉山市、洪雅县、会东县、水富县、商洛市辖区 |
| 房地产过度开发县 | 丽水市辖区、舟山市辖区、青田县、武夷山市 |
新窗口打开
其中,贫困县大部分是国家扶贫工作重点县,受益于国家扶贫工作计划的支持,近年来的经济发展较快,但其本身经济水平相当落后,使得灾害防御工程也相对匮乏。因此,这些县在经济脱贫的同时要增大对地质灾害风险的防范力度。
矿产工业县依托丰富的矿产资源,发展采矿冶金等工业,对GDP高速增长具有极大贡献。例如,陕西省凤县是全国四大铅锌矿基地之一,其铅锌矿贮量350万t,约占全省的80%。近10年来,凤县平均GDP增速高达本省平均增速的两倍,这是当地大力发展矿业取得的成果。但与此同时该县的植被、生态环境也都遭到了严重破坏,增大了其未来发生地质灾害伤亡事件的可能性。因此,应适量开发矿产资源,同时注重对生态环境的保护,做好地质灾害风险防范措施。
房地产过度开发县主要位于中国东部地区,主要为市辖区,经济水平相对较高,工业发展对原材料的依赖程度有所下降,向深加工发展,第三产业比重不断增加,具有充足的防灾减灾经济实力。但房地产业、旅游业等的大力发展需不断向山区扩张土地,如浙江省地形素有“七山一水两分田”之说,山地丘陵面积占70.4%,平原面积仅有23.4%,而位于其西南山区的丽水市山地面积更是占全市88.42%。近年来房地产业发展迅速,2012年房地产投资额达到84.99亿元,房地产施工面积逐年增长,由2003年的540.55万m2,增至2012年的1913.46万m2,不断向山区扩张的土地利用使得更多的人分布在具有灾害风险山区。因此,对于中国东部经济发达县,由于城市建设扩张所带来的地质灾害风险必须重点防范。
5 结论
本文基于《中国地质灾害伤亡数据库》的县级人员伤亡数据,采用Logistic回归模型,对中国地质灾害人员伤亡事件的空间格局进行研究,并定量评估自然因素、人类活动因素对地质灾害伤亡事件的贡献程度。中国地质灾害伤亡县的分布总体呈南多北少的格局,主要分布于西南部的四川盆地和云贵高原地区,东南丘陵地区,北方的黄土丘陵,西北祁连山脉和天山山脉等地区。
通过构建CELC模型,本文发现中国地质灾害伤亡事件受自然与人类活动因素的共同影响,地形起伏度、GDP增速、多年平均降水、植被覆盖度、断裂带、岩性、土壤类型、产业类型和人口密度对中国地质灾害伤亡事件的发生都有影响。连续变量中按影响程度从大到小分别为地形起伏度、GDP增速、多年平均降水、植被覆盖度和人口密度。GDP增长率每增加2.72%,地质灾害伤亡事件发生的概率变为原来的2.706倍,定量证明中国快速增长的经济破坏了自然环境,触发了较多的地质灾害。表3中,常数项对应的显著性水平<0.05,即常数项为0的假设检验不通过。这说明,除本文考虑的因素外,还存在着一些其他的因素对地质灾害伤亡事件的发生有影响。因此,将来的工作是,获取更多、更精细的数据,来考虑自然因素、人类经济活动强度因素,进一步提高地质灾害伤亡事件发生概率的预测精度。此外,本文在构建模型时,采用了过抽样方法,即将伤亡县“1”样本进行4倍复制后引入模型分析,提高了CELC模型的精度,但这种人为增加样本的方法,是否适用于其他logistic模型,有待进一步研究。
CELC模型计算结果还表明,中国地质灾害伤亡事件发生概率高,但尚未发生的38个县域中,大约有71%县的经济都处于高速发展,其GDP增长率远高于本省的GDP增长率,而且这些县可以分为3类:贫困县、矿产工业县域、房产过度开发县。它们是中国需要加强监管,减少人为破坏环境,降低地质灾害风险的区域。
由于中国主要地质灾害伤亡数据库中的承灾体信息尚不完备,故本文采用了二元logistic回归方法进行研究,其结果只能用于计算某县域发生地质灾害伤亡事件,未来随着数据库的完善,还可以采用地理探测器等方法,对比分析地质灾害伤亡率的空间影响因素。
The authors have declared that no competing interests exist.
参考文献 原文顺序
文献年度倒序
文中引用次数倒序
被引期刊影响因子
| [1] | |
| [2] | |
| [4] | |
| [5] | In many regions, the absence of a landslide inventory hampers the production of susceptibility or hazard maps. Therefore, a method combining a procedure for sampling of landslide-affected and landslide-free grid cells from a limited landslide inventory and logistic regression modelling was tested for susceptibility mapping of slide- and flow-type landslides on a European scale. Landslide inventories were available for Norway, Campania (Italy), and the Barcelonnette Basin (France), and from each inventory, a random subsample was extracted. In addition, a landslide dataset was produced from the analysis of Google Earth images in combination with the extraction of landslide locations reported in scientific publications. Attention was paid to have a representative distribution of landslides over Europe. In total, the landslide-affected sample contained 1,340 landslides. Then a procedure to select landslide-free grid cells was designed taking account of the incompleteness of the landslide inventory and the high proportion of flat areas in Europe. Using stepwise logistic regression, a model including slope gradient, standard deviation of slope gradient, lithology, soil, and land cover type was calibrated. The classified susceptibility map produced from the model was then validated by visual comparison with national landslide inventory or susceptibility maps available from literature. A quantitative validation was only possible for Norway, Spain, and two regions in Italy. The first results are promising and suggest that, with regard to preparedness for and response to landslide disasters, the method can be used for urgently required landslide susceptibility mapping in regions where currently only sparse landslide inventory data are available. |
| [6] | Landslide susceptibility mapping is the first step in regional hazard management as it helps to understand the spatial distribution of the probability of slope failure in an area. An attempt is made to map the landslide susceptibility in Tevankarai Ar sub-watershed, Kodaikkanal, India using binary logistic regression analysis. Geographic Information System is used to prepare the database of the predictor variables and landslide inventory map, which is used to build the spatial model of landslide susceptibility. The model describes the relationship between the dependent variable (presence and absence of landslide) and the independent variables selected for study (predictor variables) by the best fitting function. A forward stepwise logistic regression model using maximum likelihood estimation is used in the regression analysis. An inventory of 84 landslides and cells within a buffer distance of 10m around the landslide is used as the dependent variable. Relief, slope, aspect, plan curvature, profile curvature, land use, soil, topographic wetness index, proximity to roads and proximity to lineaments are taken as independent variables. The constant and the coefficient of the predictor variable retained by the regression model are used to calculate the probability of slope failure and analyze the effect of each predictor variable on landslide occurrence in the study area. The model shows that the most significant parameter contributing to landslides is slope. The other significant parameters are profile curvature, soil, road, wetness index and relief. The predictive logistic regression model is validated using temporal validation data-set of known landslide locations and shows an accuracy of 85.29 %. |
| [7] | This work has evaluated the probability of earthquake-triggered landslide occurrence in the whole of El Salvador, with a Geographic Information System (GIS) and a logistic regression model. Slope gradient, elevation, aspect, mean annual precipitation, lithology, land use, and terrain roughness are the predictor variables used to determine the dependent variable of occurrence or non-occurrence of landslides within an individual grid cell. The results illustrate the importance of terrain roughness and soil type as key factors within the model using only these two variables the analysis returned a significance level of 89.4%. The results obtained from the model within the GIS were then used to produce a map of relative landslide susceptibility. |
| [8] | We review rainfall thresholds for the initiation of landslides world wide and propose new empirical rainfall thresholds for the Central European Adriatic Danubian South-Eastern Space (CADSES) area, located in central and southern Europe. One-hundred-twenty-four empirical thresholds linking measurements of the event and the antecedent rainfall conditions to the occurrence of landslides are considered. We then describe a database of 853 rainfall events that resulted or did not result in landslides in the CADSES area. Rainfall and landslide information in the database was obtained from the literature; climate information was obtained from the global climate dataset compiled by the Climate Research Unit of the East Anglia University. We plot the intensity-duration values in logarithmic coordinates, and we establish that with increased rainfall duration the minimum intensity likely to trigger slope failures decreases linearly, in the range of durations from 20 minutes to 12 days. Based on this observation, we determine minimum intensity-duration (ID) and normalized-ID thresholds for the initiation of landslides in the CADSES area. Normalization is performed using two climatic indexes, the mean annual precipitation (MAP) and the rainy-day-normal (RDN). Threshold curves are inferred from the available data using a Bayesian statistical technique. Analysing the obtained thresholds we establish that lower average rainfall intensity is required to initiate landslides in an area with a mountain climate, than in an area characterized by a Mediterranean climate. We further suggest that for rainfall periods exceeding 12 days landslides are triggered by factors not considered by the ID model. The obtained thresholds can be used in operation landslide warning systems, where more accurate local or regional thresholds are not available. |
| [9] | Landslides in the hilly terrain along the Kansas and Missouri rivers in northeastern Kansas have caused millions of dollars in property damage during the last decade. To address this problem, a statistical method called multiple logistic regression has been used to create a landslide-hazard map for Atchison, Kansas, and surrounding areas. Data included digitized geology, slopes, and landslides, manipulated using ArcView GIS. Logistic regression relates predictor variables to the occurrence or nonoccurrence of landslides within geographic cells and uses the relationship to produce a map showing the probability of future landslides, given local slopes and geologic units. Results indicated that slope is the most important variable for estimating landslide hazard in the study area. Geologic units consisting mostly of shale, siltstone, and sandstone were most susceptible to landslides. Soil type and aspect ratio were considered but excluded from the final analysis because these variables did not significantly add to the predictive power of the logistic regression. Soil types were highly correlated with the geologic units, and no significant relationships existed between landslides and slope aspect. |
| [10] | Generalised linear modelling was used to model the relation between landsliding and several independent variables (geology, dip, strike, strata-slope interaction, aspect, density of lineaments and slope angle) for a small area of the central Apennines, Italy. Raster maps of landsliding and the independent variables were produced from air photographs, topographic and geological maps, and field checking. A logistic regression was then obtained between all slope movements and the independent variables (chosen to reflect conditions prior to landsliding). Not surprisingly, geology and slope angle were found to be the most significant factors in the model. The landslides in the region were then classified into dormant and active types and further linear models were obtained for each. While geology and slope angle were again the most significant factors in each model, slope aspect and strike were less significant for active landslides. Finally, further independent variables applicable to active landslides only (vegetation cover, soil thickness, horizontal curvature, vertical curvature, concavity of slope, local relief and roughness) were added to the model for active landslides. Interestingly, with these new variables added, vegetation cover and concavity of slope were found to be more significant than geology and slope angle. |
| [11] | A spatial database of 791 landslides is analyzed using GIS to map landslide susceptibility in Tsugawa area of Agano River. Data from six landslide-controlling parameters namely lithology, slope gradient, aspect, elevation, and plan and profile curvatures are coded and inserted into the GIS. Later, an index-based approach is adopted both to put the various classes of the six parameters in order of their significance to the process of landsliding and weigh the impact of one parameter against another. Applying primary and secondary-level weights, a continuous scale of numerical indices is obtained with which the study area is divided into five classes of landslide susceptibility. Slope gradient and elevation are found to be important to delineate flatlands that will in no way be subjected to slope failure. The area which is at high scale of susceptibility lies on mid-slope mountains where relatively weak rocks such as sandstone, mudstone and tuff are outcropping as one unit. |
| [12] | 中国是一个滑坡灾害极为频繁的国家,其中大型和巨型滑坡占有突出重要的地位,尤其是在中国的西部地区,大型滑坡更是以其规模大、机制复杂、危害大等特点著称于世,在全世界范围内具有典型性和代表性。收集20世纪以来发生在中国大陆的典型大型滑坡灾害实例,并重点对其中的11例进行深入的分析和讨论;这些大型滑坡涉及到不同的地质环境条件和坡体地质结构,具有不同诱发机制和触发因素。分析结果表明,中国大陆大型滑坡发育最根本的原因是具有有利的地形地貌条件,约80%的大型滑坡发生在环青藏高原东侧的大陆地形第一个坡降带范围内。同时,该地区也是世界上板内构造活动最为活跃的地区,其地壳内、外动力条件强烈的交织与转化,促使高陡边坡发生强烈的动力过程,从而也促进大型滑坡灾害的发育。强震、极端气候条件和全球气候变化构成大型滑坡发生的主要触发和诱发因素:中国南方暴雨强度达到200~300mm/d时就易于触发大滑坡的发生;中国西北地区春季冻结层的融化,也是大规模黄土滑坡发生的诱因。近年来全球气候变化导致气温上升、雪线上移、冰川后退、冰湖溃决,也都成为特定地区大型滑坡灾害发生的诱发和触发因素。另外,70%以上大型滑坡发生与人类活动有密切的关系。滑坡机制分析结果表明,中国的大型滑坡通常具有复杂的生成机制:总的来看,大型滑坡发生的岩土介质主要有以下3类,即岩质滑坡、土层滑坡和松散堆积层滑坡。除松散堆积层滑坡,前两者都涉及复杂的演化机制及过程,其典型的地质–力学模式包括:滑移–拉裂–剪断“三段式”模式、“挡墙溃决”模式、近水平岩层的“平推式”模式、反倾岩层大规模倾倒变形模式、顺倾岩层的蠕滑(弯曲)–剪断模式等。每一类模式都具有其对应的岩体结构条件和特定的变形破坏演变过程。通常大型岩质滑坡的发生一般都伴随有滑动面上“锁固段”的突发脆性破坏,“锁固段”在岩质边坡的变形控制和稳定性机制中具有重要地位,也是边坡地质灾害评价与控制的关键。实践结果表明,查明边坡(滑坡)变形破坏的地质力学模式是滑坡地质灾害防治的基础所在。 . 中国是一个滑坡灾害极为频繁的国家,其中大型和巨型滑坡占有突出重要的地位,尤其是在中国的西部地区,大型滑坡更是以其规模大、机制复杂、危害大等特点著称于世,在全世界范围内具有典型性和代表性。收集20世纪以来发生在中国大陆的典型大型滑坡灾害实例,并重点对其中的11例进行深入的分析和讨论;这些大型滑坡涉及到不同的地质环境条件和坡体地质结构,具有不同诱发机制和触发因素。分析结果表明,中国大陆大型滑坡发育最根本的原因是具有有利的地形地貌条件,约80%的大型滑坡发生在环青藏高原东侧的大陆地形第一个坡降带范围内。同时,该地区也是世界上板内构造活动最为活跃的地区,其地壳内、外动力条件强烈的交织与转化,促使高陡边坡发生强烈的动力过程,从而也促进大型滑坡灾害的发育。强震、极端气候条件和全球气候变化构成大型滑坡发生的主要触发和诱发因素:中国南方暴雨强度达到200~300mm/d时就易于触发大滑坡的发生;中国西北地区春季冻结层的融化,也是大规模黄土滑坡发生的诱因。近年来全球气候变化导致气温上升、雪线上移、冰川后退、冰湖溃决,也都成为特定地区大型滑坡灾害发生的诱发和触发因素。另外,70%以上大型滑坡发生与人类活动有密切的关系。滑坡机制分析结果表明,中国的大型滑坡通常具有复杂的生成机制:总的来看,大型滑坡发生的岩土介质主要有以下3类,即岩质滑坡、土层滑坡和松散堆积层滑坡。除松散堆积层滑坡,前两者都涉及复杂的演化机制及过程,其典型的地质–力学模式包括:滑移–拉裂–剪断“三段式”模式、“挡墙溃决”模式、近水平岩层的“平推式”模式、反倾岩层大规模倾倒变形模式、顺倾岩层的蠕滑(弯曲)–剪断模式等。每一类模式都具有其对应的岩体结构条件和特定的变形破坏演变过程。通常大型岩质滑坡的发生一般都伴随有滑动面上“锁固段”的突发脆性破坏,“锁固段”在岩质边坡的变形控制和稳定性机制中具有重要地位,也是边坡地质灾害评价与控制的关键。实践结果表明,查明边坡(滑坡)变形破坏的地质力学模式是滑坡地质灾害防治的基础所在。 |
| [13] | As a first step forward in regional hazard management, multivariate statistical analysis in the form of logistic regression was used to produce a landslide susceptibility map in the Kakuda-Yahiko Mountains of Central Japan. There are different methods to prepare landslide susceptibility maps. The use of logistic regression in this study stemmed not only from the fact that this approach relaxes the strict assumptions required by other multivariate statistical methods, but also to demonstrate that it can be combined with bivariate statistical analyses (BSA) to simplify the interpretation of the model obtained at the end. In susceptibility mapping, the use of logistic regression is to find the best fitting function to describe the relationship between the presence or absence of landslides (dependent variable) and a set of independent parameters such as slope angle and lithology. Here, an inventory map of 87 landslides was used to produce a dependent variable, which takes a value of 0 for the absence and 1 for the presence of slope failures. Lithology, bed rock-slope relationship, lineaments, slope gradient, aspect, elevation and road network were taken as independent parameters. The effect of each parameter on landslide occurrence was assessed from the corresponding coefficient that appears in the logistic regression function. The interpretations of the coefficients showed that road network plays a major role in determining landslide occurrence and distribution. Among the geomorphological parameters, aspect and slope gradient have a more significant contribution than elevation, although field observations showed that the latter is a good estimator of the approximate location of slope cuts. Using a predicted map of probability, the study area was classified into five categories of landslide susceptibility: extremely low, very low, low, medium and high. The medium and high susceptibility zones make up 8.87% of the total study area and involve mid-altitude slopes in the eastern part of Kakuda Mountain and the central and southern parts of Yahiko Mountain. |
| [14] | In northern parts of Iran such as the Alborz Mountain belt, frequent landslides occur due to a combination of climate and geologic conditions with high tectonic activities. This results in millions of dollars of financial damages annually excluding casualties and unrecoverable resources. This paper evaluates the landslide susceptible areas in Central Alborz using the probabilistic frequency ratio (PFR) model and Geo-information Technology (GiT). The landslide location map in this study has been generated based on image elements interpreted from IRS satellite data and field observations. The display, manipulation and analysis have been carried out to evaluate layers such as geology, geomorphology, soil, slope, aspect, land use, distance from faults, lineaments, roads and drainages. The validation group of actual landslides and relative operation curve method has been used to increase the accuracy of the final landslide susceptibility map. The area under the curve evaluates how well the method predicts landslides. The results showed a satisfactory agreement of 91% between prepared susceptibility map and existing data on landslide locations. |
| [15] | 我国是世界上地质灾害最严重的国家之一.为了全面查清我国地质灾害的发育分布规律,国土资源部从1999年开始,在地质灾害严重的县(市),陆续部署开展了县市地质灾害调查与区划工作.论文在290个县、市地质灾害调查成果的基础上,分析统计了我国主要地质灾害的规模、诱发因素、发育分布等特征,并以县、市为基本单元,利用地质灾害点密度、体积密度和面密度3个指标,对已调查县、市进行了地质灾害发育程度的评价.评价结果分为4个等级,其中地质灾害高发育县市30个,集中分布在重庆、贵州、湖北、甘肃、四川和云南等省;地质灾害较高发育县市107个,集中分布在湖南、江西、陕西、四川、贵州、湖北、云南和重庆等省市;地质灾害中等发育县市90个,集中分布在河北、四川、浙江和福建等省;地质灾害轻微发育县市62个,集中分布在河北、广西、新疆和山西等省. . 我国是世界上地质灾害最严重的国家之一.为了全面查清我国地质灾害的发育分布规律,国土资源部从1999年开始,在地质灾害严重的县(市),陆续部署开展了县市地质灾害调查与区划工作.论文在290个县、市地质灾害调查成果的基础上,分析统计了我国主要地质灾害的规模、诱发因素、发育分布等特征,并以县、市为基本单元,利用地质灾害点密度、体积密度和面密度3个指标,对已调查县、市进行了地质灾害发育程度的评价.评价结果分为4个等级,其中地质灾害高发育县市30个,集中分布在重庆、贵州、湖北、甘肃、四川和云南等省;地质灾害较高发育县市107个,集中分布在湖南、江西、陕西、四川、贵州、湖北、云南和重庆等省市;地质灾害中等发育县市90个,集中分布在河北、四川、浙江和福建等省;地质灾害轻微发育县市62个,集中分布在河北、广西、新疆和山西等省. |
| [16] | |
| [17] | . . |
| [18] | ( ( |
| [19] | |
| [20] | |
| [21] | . . |
| [22] | On 12 May, 2008, a devastating earthquake registering 8.0 on the Richter scale occurred in Sichuan Province, China, taking tens of thousands of lives and destroying the homes of millions of people. Many of the deceased were children, particular children less than five years old who were more vulnerable to such a huge disaster than the adult. In order to obtain information specifically relevant to further researches and future preventive measures, potential risk factors associated with earthquake-related child mortality need to be identified. We used four geographical detectors (risk detector, factor detector, ecological detector, and interaction detector) based on spatial variation analysis of some potential factors to assess their effects on the under-five mortality. It was found that three factors are responsible for child mortality: earthquake intensity, collapsed house, and slope. The study, despite some limitations, has important implications for both researchers and policy makers. |
| [23] | Previous studies of land dissection density (D) often find contradictory results regarding factors controlling its spatial variation. We hypothesize that the dominant controlling factors (and the interactions between them) vary from region to region due to differences in each region's local characteristics and geologic history. We test this hypothesis by applying a geographical detector method to eight physiographic divisions of the conterminous United States and identify the dominant factor(s) in each. The geographical detector method computes the power of determinant (q) that quantitatively measures the affinity between the factor considered and D. Results show that the factor (or factor combination) with the largest q value is different for physiographic regions with different characteristics and geologic histories. For example, lithology dominates in mountainous regions, curvature dominates in plains, and glaciation dominates in previously glaciated areas. The geographical detector method offers an objective framework for revealing factors controlling Earth surface processes. |
| [24] | 水库湿地作为北京市面积最大的人工湿地,是北京市重要的生态基础设施。从自然环境和社会经济因素两个方面,构建北京市水库湿地演变的驱动因子指标体系,其中自然驱动因子包括年均降水量、气温、入境水量和地下水埋深;社会经济驱动因子包括常住人口数、城市化率和人均GDP。应用长时间序列(1984-2010年)的TM遥感影像,提取北京市近30年来水库湿地的空间分布信息,根据湿地面积增长和消退的演变规律,利用Logistic回归模型定量分析不同时间段下水库湿地演变的驱动机制。结果表明:不同时期内水库湿地变化的驱动因子及其影响力存在一定的差异。在1984-1998年间,北京市水库湿地增长变化的主导驱动因子是年均降水量和入境水量,Logistic回归的贡献率分别为5.778和3.504,主要受自然环境因素的影响;在1998-2004年期间,水库湿地急剧减少的驱动因子主要为常住人口、地下水埋深和城市化率,影响贡献率分别为9.41、9.18和7.77,人为活动的影响开始加剧;在2004-2010年间,影响水库湿地发生变化的主导因子是城市化率和年均降水量,贡献率分别为6.62和4.22,受自然和社会经济因素的交叉影响。 . 水库湿地作为北京市面积最大的人工湿地,是北京市重要的生态基础设施。从自然环境和社会经济因素两个方面,构建北京市水库湿地演变的驱动因子指标体系,其中自然驱动因子包括年均降水量、气温、入境水量和地下水埋深;社会经济驱动因子包括常住人口数、城市化率和人均GDP。应用长时间序列(1984-2010年)的TM遥感影像,提取北京市近30年来水库湿地的空间分布信息,根据湿地面积增长和消退的演变规律,利用Logistic回归模型定量分析不同时间段下水库湿地演变的驱动机制。结果表明:不同时期内水库湿地变化的驱动因子及其影响力存在一定的差异。在1984-1998年间,北京市水库湿地增长变化的主导驱动因子是年均降水量和入境水量,Logistic回归的贡献率分别为5.778和3.504,主要受自然环境因素的影响;在1998-2004年期间,水库湿地急剧减少的驱动因子主要为常住人口、地下水埋深和城市化率,影响贡献率分别为9.41、9.18和7.77,人为活动的影响开始加剧;在2004-2010年间,影响水库湿地发生变化的主导因子是城市化率和年均降水量,贡献率分别为6.62和4.22,受自然和社会经济因素的交叉影响。 |
| [25] | 为探讨不同尺度下社会经济统计数据热点的变化规律及其影响因子, 本文基于2000年全国县级农业统计数据和2008年北京市第二次经济普查数据,按照一定的聚合规则得到不同尺度的数据,计算不同尺度下的局部空间自相关 指标G统计值并对其进行显著性检验得到热点分布,分析不同聚合尺度下热点的变化规律.然后运用Logistic回归分析探测了影响聚合前后热点变化的因 素,并根据探测结果建立了预测聚合前后热点变化的Logistic模型.分析结果表明,基于G统计探测的热点分布具有明显的空间尺度效应,聚合水平越高、 空间尺度越大,热点数目越少.Logistic回归分析的显著性分析表明,热点包含的面状单元数目和热点的平均G统计值是影响热点探测尺度效应的主要因 素.热点包含的面状单元越多,热点的平均G统计值越大,热点探测结果受尺度效应的影响越小.研究建立的热点变化预测模型,可以在细尺度热点分布状况已知 时,根据热点包含的面状单元数目和热点的平均G统计值来预测聚合后热点的变化.对模型精度的交叉验证结果表明,模型对全国县级农业统计数据热点变化预测精 度可达到93.8%,对北京市第二次经济普查数据热点变化预测精度达到94.2%.两套数据试验得到的结论一致,说明热点探测的尺度效应变化规律和所选变 量以及研究区域的大小无关. . 为探讨不同尺度下社会经济统计数据热点的变化规律及其影响因子, 本文基于2000年全国县级农业统计数据和2008年北京市第二次经济普查数据,按照一定的聚合规则得到不同尺度的数据,计算不同尺度下的局部空间自相关 指标G统计值并对其进行显著性检验得到热点分布,分析不同聚合尺度下热点的变化规律.然后运用Logistic回归分析探测了影响聚合前后热点变化的因 素,并根据探测结果建立了预测聚合前后热点变化的Logistic模型.分析结果表明,基于G统计探测的热点分布具有明显的空间尺度效应,聚合水平越高、 空间尺度越大,热点数目越少.Logistic回归分析的显著性分析表明,热点包含的面状单元数目和热点的平均G统计值是影响热点探测尺度效应的主要因 素.热点包含的面状单元越多,热点的平均G统计值越大,热点探测结果受尺度效应的影响越小.研究建立的热点变化预测模型,可以在细尺度热点分布状况已知 时,根据热点包含的面状单元数目和热点的平均G统计值来预测聚合后热点的变化.对模型精度的交叉验证结果表明,模型对全国县级农业统计数据热点变化预测精 度可达到93.8%,对北京市第二次经济普查数据热点变化预测精度达到94.2%.两套数据试验得到的结论一致,说明热点探测的尺度效应变化规律和所选变 量以及研究区域的大小无关. |
| [26] | 转型时期我国城镇居民主要通过市场竞争机制和科层分配体制来获取个人住房,获取稀缺的住房资源的途径和机会的差异在一定程度上反映了住房不平等和社会分化.处于体制转型时期的中国城镇,制度、市场和家庭因素等多重因素相互交织,共同影响中国城镇居民住房选择.以覆盖全国88个城镇的(2005年城镇部分)调查资料为基础,本文分析了转型背景下中国城镇居民住房类型分化及其影响因素,研究发现:改革开放30多年以来,中国城镇的住房自有率大幅度提高,其主要原因从1998年前的公房房改政策向1998年后住房市场化政策转变.家庭生命周期、家庭收入、户籍、单位性质、职业等变量显著影响住房选择,体现市场与制度对住房资源分配的双重影响.经济发达地区由于住房资源紧缺、住房价格高,居民住房承受能力差异较大,工作单位性质、户籍和家庭生命周期变量对住房选择的影响更显著.随着住房市场化进一步发展和住房制度改革的逐步深入,地方政府应逐步放宽社会住房的享受标准,尤其是户籍限制条件;开发商应更关注社会经济快速转型背景下的家庭结构变化及其对居住偏好的影响. . 转型时期我国城镇居民主要通过市场竞争机制和科层分配体制来获取个人住房,获取稀缺的住房资源的途径和机会的差异在一定程度上反映了住房不平等和社会分化.处于体制转型时期的中国城镇,制度、市场和家庭因素等多重因素相互交织,共同影响中国城镇居民住房选择.以覆盖全国88个城镇的(2005年城镇部分)调查资料为基础,本文分析了转型背景下中国城镇居民住房类型分化及其影响因素,研究发现:改革开放30多年以来,中国城镇的住房自有率大幅度提高,其主要原因从1998年前的公房房改政策向1998年后住房市场化政策转变.家庭生命周期、家庭收入、户籍、单位性质、职业等变量显著影响住房选择,体现市场与制度对住房资源分配的双重影响.经济发达地区由于住房资源紧缺、住房价格高,居民住房承受能力差异较大,工作单位性质、户籍和家庭生命周期变量对住房选择的影响更显著.随着住房市场化进一步发展和住房制度改革的逐步深入,地方政府应逐步放宽社会住房的享受标准,尤其是户籍限制条件;开发商应更关注社会经济快速转型背景下的家庭结构变化及其对居住偏好的影响. |
| [27] | On the basis of 1,834 landslide data for Hong Kong Island (HKI), landslide susceptibility maps were generated using logistic regression and GIS. Regional bias of the landslide inventory is examined by dividing the whole HKI into a southern and a northern region, separated by an east-west trending water divide. It was found that the susceptibility map of southern HKI generated by using the southern data differs significantly from that generated by using northern data, and similar conclusion can be drawn for the northern HKI. Therefore, a susceptibility map of HKI was established based on regional data analysis, and it was found to reflect closely the spatial distributions of historical landslides. Elevation appears to be the most dominant factor in controlling landslide occurrence, and this probably reflects that human developments are concentrated at certain elevations on the island. Classification plot, goodness of fit, and occurrence ratio were used to examine the reliability of the proposed susceptibility map. The size of landslide susceptible zones varies depending on the data sets used, thus this demonstrates that the historical landslide data may be biased and affected by human activities and geological settings on a regional basis. Therefore, indiscriminate use of regional-biased data should be avoided. |
| [28] | The aim of this study is to evaluate the landslide hazards at Selangor area, Malaysia, using Geographic Information System (GIS) and Remote Sensing. Landslide locations of the study area were identified from aerial photograph interpretation and field survey. Topographical maps, geological data, and satellite images were collected, processed, and constructed into a spatial database in a GIS platform. The factors chosen that influence landslide occurrence were: slope, aspect, curvature, distance from drainage, lithology, distance from lineaments, land cover, vegetation index, and precipitation distribution. Landslide hazardous areas were analyzed and mapped using the landslide-occurrence factors by frequency ratio and logistic regression models. The results of the analysis were verified using the landslide location data and compared with probability model. The comparison results showed that the frequency ratio model (accuracy is 93.04%) is better in prediction than logistic regression (accuracy is 90.34%) model. |
| [29] | The Newmark displacement model has been used to predict earthquake-triggered landslides. Logistic regression (LR) is also a common landslide hazard assessment method. We combined the Newmark displacement model and LR and applied them to Wenchuan County and Beichuan County in China, which were affected by the M s. 8.0 Wenchuan earthquake on May 12th, 2008, to develop a mechanism-based landslide occurrence probability model and improve the predictive accuracy. A total of 1904 landslide sites in Wenchuan County and 3800 random non-landslide sites were selected as the training dataset. We applied the Newmark model and obtained the distribution of permanent displacement ( D n ) for a 3002×023002m grid. Four factors ( D n , topographic relief, and distances to drainages and roads) were used as independent variables for LR. Then, a combined model was obtained, with an AUC (area under the curve) value of 0.797 for Wenchuan County. A total of 617 landslide sites and non-landslide sites in Beichuan County were used as a validation dataset with AUC 02=020.753. The proposed method may also be applied to earthquake-induced landslides in other regions. |
| [30] | We study rare events data, binary dependent variables with dozens to thousands of times fewer ones (events, such as wars, vetoes, cases of political activism, or epidemiological infections) than zeros (u201cnoneventsu201d). In many literatures, these variables have proven difficult to explain and predict, a problem that seems to have at least two sources. First, popular statistical procedures, such as logistic regression, can sharply underestimate the probability of rare events. We recommend corrections that outperform existing methods and change the estimates of absolute and relative risks by as much as some estimated effects reported in the literature. Second, commonly used data collection strategies are grossly inefficient for rare events data. The fear of collecting data with too few events has led to data collections with huge numbers of observations but relatively few, and poorly measured, explanatory variables, such as in international conflict data with more than a quarter-million dyads, only a few of which are at war. As it turns out, more efficient sampling designs exist for making valid inferences, such as sampling all available events (e.g., wars) and a tiny fraction of nonevents (peace). This enables scholars to save as much as 99% of their (nonfixed) data collection costs or to collect much more meaningful explanatory variables. We provide methods that link these two results, enabling both types of corrections to work simultaneously, and software that implements the methods developed. |
| [31] | . |
| [32] | [1] Lithology describes the geochemical, mineralogical, and physical properties of rocks. It plays a key role in many processes at the Earth surface, especially the fluxes of matter to soils, ecosystems, rivers, and oceans. Understanding these processes at the global scale requires a high resolution description of lithology. A new high resolution global lithological map (GLiM) was assembled from existing regional geological maps translated into lithological information with the help of regional literature. The GLiM represents the rock types of the Earth surface with 1,235,400 polygons. The lithological classification consists of three levels. The first level contains 16 lithological classes comparable to previously applied definitions in global lithological maps. The additional two levels contain 12 and 14 subclasses, respectively, which describe more specific rock attributes. According to the GLiM, the Earth is covered by 64% sediments (a third of which are carbonates), 13% metamorphics, 7% plutonics, and 6% volcanics, and 10% are covered by water or ice. The high resolution of the GLiM allows observation of regional lithological distributions which often vary from the global average. The GLiM enables regional analysis of Earth surface processes at global scales. A gridded version of the GLiM is available at the PANGEA Database (http://dx.doi.org/10.1594/PANGAEA.788537). |
| [33] | Diagnostic systems of several kinds are used to distinguish between two classes of events, essentially ``signals'' and ``noise.'' For then, analysis in terms of the ``relative operating characteristic'' of signal detection theory provides a precise and valid measure of diagnostic accuracy. It is the only measure available that is uninfluenced by decision biases and prior probabilities, and it places the performances of diverse systems on a common, easily interpreted scale. Representative values of this measure are reported here for systems in medical imaging, materials testing, weather forecasting, information retrieval, polygraph lie detection, and aptitude testing. Though the measure itself is sound, the values obtained from tests of diagnostic systems often require qualification because the test data on which they are based are of unsure quality. A common set of problems in testing is faced in all fields. How well these problems are handled, or can be handled in a given field, determines the degree of confidence that can be placed in a measured value of accuracy. Some fields fare much better than others. |
| [34] | This contribution discusses the problemof providing measures of significance ofprediction results when the predictionswere generated from spatial databases forlandslide hazard mapping. The spatialdatabases usually contain map informationon lithologic units, land-cover units,topographic elevation and derived attributes(slope, aspect, etc.) and the distributionin space and in time of clearly identifiedmass movements. In prediction modelling wetransform the multi-layered databaseinto an aggregation of functional values toobtain an index of propensity of the landto failure. Assuming then that the informationin the database is sufficiently representativeof the typical conditions in which the massmovements originated in space and in time,the problem then, is to confirm the validity ofthe results of some models over otherones, or of particular experiments that seem touse more significant data. A core pointof measuring the significance of a prediction isthat it allows interpreting the results.Without a validation no interpretation is possible,no support of the method or of theinput information can be provided. In particularwith validation, the added value canbe assessed of a prediction either in a fixedtime interval, or in an open-ended time orwithin the confined space of a study area.Validation must be of guidance in datacollection and field practice for landslidehazard mapping. |
| [35] | The present study discusses the use of integrated variables along with a combination of multi-method forecasts for landslide susceptibility mapping. The study area is located in the south-eastern French Massif central, a volcanic region containing Tertiary sedimentary materials that are prone to landslides. The flowage-type landslides within the study area are very slow-moving phenomena which affect the infrastructures and human settlements. The modelling process is based on a training set of landslides (70% of total landslides) and a set of controlling factor (slope, lithology, surficial formation, the topographic wetness index, the topographic position index, distance to thalweg, and aspect). We create a composite variable (or integrated variable), corresponding to the union of geology and surficial formation, in order to avoid the conditional dependence between these two variables and to build a geotechnical variable. We use five classical modelling methods (index, weight-of-evidence, logistic regression, decision tree, and unique condition unit) with the same training set but with different architectures of input data made up of controlling factors. All the models are tested with a validation group (30% of total landslides), using the Area Under the Receiver Operating Characteristic curve ( AUC ) to quantify their predictive performance. We finally select a single est model for each method. However, these five models are all equivalent in quality, despite their differences in detail, so no single model stands out against another. Finally, we combine the five models into a unique susceptibility map with a calculation of median susceptibility class. The final AUC value of this combined map is better than that for a single model (except for Unique Condition Unit), and we can evaluate the certainty of the susceptibility class pixel by pixel. In agreement with the sparse literature on this topic, we conclude that i) integrated variables increase the performance of classical modelling processes and ii) the combination of multi-method forecasts is a pragmatic solution to the inherent problem of choosing the most suitable method for the available data and geomorphological context. |
