 , 钟章奇
, 钟章奇Measurement and spatial transfer of China's provincialPM2.5 emissions embodied in trade
WULeying, ZHONGZhangqi通讯作者:
收稿日期:2016-04-27
修回日期:2016-10-20
网络出版日期:2017-02-15
版权声明:2017《地理学报》编辑部本文是开放获取期刊文献,在以下情况下可以自由使用:学术研究、学术交流、科研教学等,但不允许用于商业目的.
基金资助:
作者简介:
-->
展开
摘要
关键词:
Abstract
Keywords:
-->0
PDF (968KB)元数据多维度评价相关文章收藏文章
本文引用格式导出EndNoteRisBibtex收藏本文-->
1 引言
自2013年来,中国许多城市的空气质量呈现出恶化趋势,雾霾现象频发,且有不断加剧的趋势。以北京为例,其在2013年经历的雾霾情况远比1952年的伦敦雾霾事件、美国20世纪40-50年代洛杉矶光化学烟雾事件复杂和严重。在2015年第四季度,全国有18个城市经历了20天及以上的重污染天气,大气污染防治的迫切性已引起各级政府重视,如国务院出台的《大气污染防治行动计划》提出到2017年实现全国地级及以上城市可吸入颗粒物浓度比2012年下降10%以上的目标。由于大气污染的特殊性,导致区域间的污染相互影响,区域联合治污是美国、欧盟采取治理大气污染较为有效的方法。尽管目前中国曾在发达地区间实现区域联防治理大气污染(如为确保奥运会空气质量的6省联防联控),但缺乏在全国范围内进行推广,即各行政主体对区域大气污染负有“共同而又有区别的责任”[1]。由于不同省区间经济发展水平的差异,对大气污染的治理不能采取一刀切的政策,而需要区分各个省区治理责任,从而因地制宜的实现治理目标。常见的计算地区污染责任的方法为基于生产活动[2-3]。然而,随着区域间贸易的不断加强,产品的生产地与消费地逐渐剥离,由贸易活动而导致的污染排放生产地与消费地的剥离现象日益引起****们的重视[4-5]。越来越多的研究开始关注基于消费的排放和贸易隐含排放。最早的研究关注中国出口贸易隐含排放[6-9],中国与美国[10-11]、中国与日本[12-13]间的贸易隐含排放,研究结果表明中国作为贸易隐含排放净出口国家为贸易伙伴承担了相应的排放责任。然而以国家为尺度的研究并不能反映区域间差异[14-17],随后的研究开始从省级尺度对中国出口贸易隐含排放进行研究[18],发现中国出口贸易隐含排放集中在东部省区,西部省区的出口贸易隐含排放比例相对较低[19]。但由于省区间的经济联系,东部省区的出口贸易隐含排放会导致其他省区的排放发生变化[16, 20]。因此,相关政策的制定需考虑到不同省区间贸易经济的影响[21],具体分析中国省区间贸易隐含排放成为一个新的关注点。已有研究表明,2007年中国约60.02%生产性碳排放为省际贸易隐含排放[22],23.00%生产性PM2.5排放为省际贸易隐含排放[23];且在中国省区间,存在从能源富集区域向经济发达区域的贸易隐含碳排放转移[19, 24-25],从津京地区向北部沿海的贸易隐含大气污染转移[23, 26-27]。
然而以上关于贸易隐含排放的研究有两个问题未得到解决。一方面,贸易不仅通过最终消费部分导致隐含排放,同时也通过参与其他地区中间生产过程而导致隐含排放。而以往研究却未能解决贸易隐含排放的主要来源问题;另一方面,以上研究均为单一年份的贸易排放或转移情况,未考虑到年际变化。而经济危机后,中国GDP增长率从14.2%(2007年)下降到10.63%(2010年),省区间发展水平差异较大,2010年中国省区GDP最高省份广东的GDP(46.01千亿元)约为青海GDP(1.35千亿元)的34倍。在此情况下,省区间贸易隐含排放会否发生变化?贸易排放转移会否发生变化?
PM2.5是导致目前中国日益恶化雾霾天气的主要构成物[28],容易在区域间扩散,治理雾霾不仅需要区域之间在技术上协同,更需要在经济上协同。经济上协同治理需明确排放责任。多区域投入产出模型不仅能反映产业部门间的联系,同时可以反映区域间交错的经济联系。本文采用2007年、2010年中国30省区区域间投入产出数据[29-30]计算省区间贸易隐含PM2.5排放,分析其分布情况,试图为中国大气环境治理政策提供相应的建议。
2 研究方法和数据
2.1 研究方法
2.1.1 区域间投入产出模型 随着气候变化和环境问题日益受到重视,投入产出分析由于能捕捉到由上游生产导致的间接环境影响,日益成为一种重要的环境政策分析工具[4, 5, 31-35]。依据中国区域间投入产出表,存在以下平衡关系:式中:X为30省区总产出列矩阵
若各部门直接排放系数矩阵为W,则区域的完全排放系数矩阵为
2.1.2 省区间贸易隐含污染排放 任一省区r的产品可作为最终消费产品或中间投入品两种途径进入其他省区,因此其省际贸易隐含PM2.5(EEPT)由最终消费品导致EEPT和中间投入产品导致EEPT组成[36-38]。
省区r调出到省区s最终消费中的EEPT为:
式中:Vr为省区r在当前技术水平下,每生产一单位最终产品而导致的PM2.5排放;Yrs为省区s对省区r最终消费量。
省区r与省区s之间由于中间投入导致的EEPT为:
式中:Vrs为省区s
由于贸易的双边性,对于两个省区而言,一省区的调出即为另一省区的调入。因此,省区r的省际调出贸易隐含PM2.5排放(EEPE)和省际调入隐含PM2.5排放(EEPI)表达式为:
省区r的省际净贸易隐含PM2.5
2.2 研究数据
研究数据基础为2007年及2010年区域间投入产出表[29-30]。以2007年价格为基准,校准2010年数据以消除通货膨胀因素。由于缺乏西藏、香港、台湾、澳门的数据,研究对象为除此之外的30省区。各省区PM2.5排放数据来自清华大学编制的中国多尺度排放清单模型(MEIC)[3],依据中国经济普查年鉴中分产业能源使用情况,可得分产业的能源消费比例,计算得到分省区分产业的PM2.5排放量。分省区分产业的总产出数据则来自于区域间IO表。需要注意的是区域间IO表中产业分类和能源使用中产业分类不一致。目前有两种方法可以将两种分类一一对应,一种为将能源平衡表依据投入产出表进行拆分,另一种为将IO表依据能源平衡表进行合并。前一种方法优点在于保证IO表的完备性,后一种方法则能避免加入额外的能源消费导致潜在误差[8]。本文结合中国17部门IO表中产业分类和现有数据,将产业分为15部门,对区域间IO表做相应的合并。PM2.5直接排放系数为排放量与部门总产出之比。3 结果分析与讨论
3.1 贸易隐含PM2.5变化情况
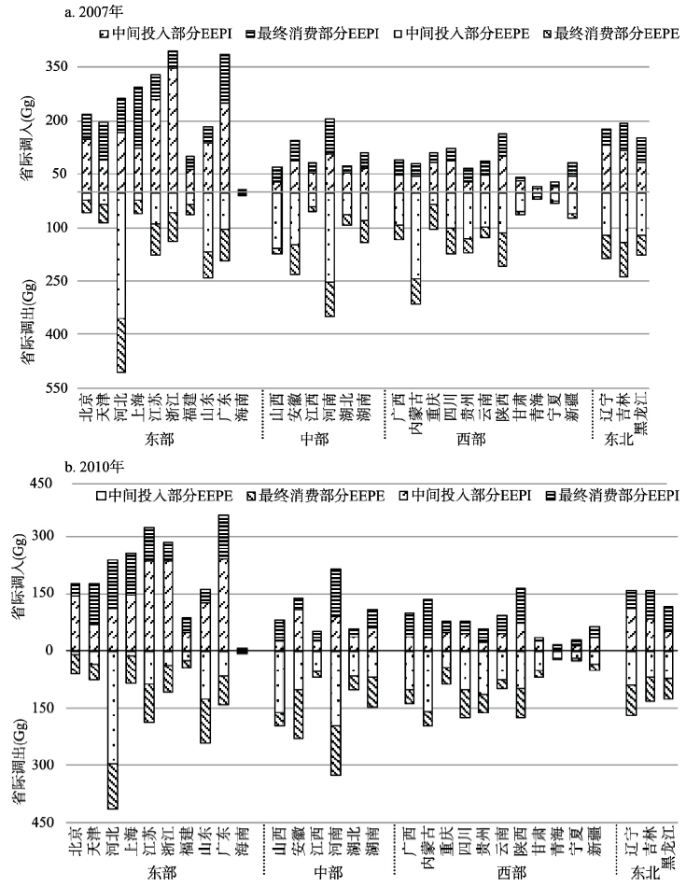
2007年和2010年中国总的省际贸易隐含PM2.5(EEPT)排放量分别为4529.15 Gg和4017.58 Gg,与中国GDP增速表现出同样的特征,表明经济危机对EEPT排放量有略微的负面影响。而其在基于生产PM2.5排放量中的比例从2007年的34.95%上升到2010年的36.45%①(①本文计算中国基于生产PM2.5排放量2007年为12.96 Tg,与Zhao等[23]计算结果接近(13.25 Tg)。省际贸易隐含PM2.5排放量(4.53 Tg)高于Zhao等[23](3.06 Tg),因为本文不仅考虑了包含在最终消费中的贸易隐含PM2.5,也包含为满足最终消费生产在中间投入部分的间接贸易隐含PM2.5,即本文的省际贸易隐含PM2.5的定义与Zhao等[23]略有不同。),表明随着中国省区间贸易活动加剧,产品生产地和消费地日益剥离,EEPT在以生产计算的PM2.5排放中所发挥的作用越来越大。因此,进一步研究EEPT排放对于中国的大气污染治理政策有重要意义。图1为中国30省区2007年和2010年EEPT排放情况,坐标轴上方为省际调入贸易隐含PM2.5,下方为省际调出贸易隐含PM2.5。由于东部地区交通便利且最早实行改革开放,经济发展高于中西部省区。而贸易量与经济发展水平有着密切联系,已有研究表明贸易隐含碳排放与贸易量和经济发展水平保持一致的变化规律[18]。对于EEPT,经济发展良好的东部省区EEPT量最大,中部、东北次之,西部最小。
 显示原图|下载原图ZIP|生成PPT
图12007年和2010年中国30省区贸易隐含PM2.5排放量
-->Fig. 1PM2.5 emissions embodied in provincial trade of 30 provinces in China in 2007 and 2010
-->
省际贸易隐含PM2.5(EEPT)由包含在最终消费中的EEPT和包含在中间投入中的EEPT组成。对于省际调出贸易隐含PM2.5(EEPE),2007年,东部省区最终消费部分包含EEPT的比例较高,其中上海(0.68)、北京(0.65)、浙江(0.60)、天津(0.59)、江苏(0.51)的最终消费部分包含EEPE均为其总EEPE的一半以上,这表明其他省区对东部省区最终产品依赖导致其EEPE增加。其中河北为例外,其包含在中间投入部分的EEPE比例较高(0.70),表明其他省区中间生产过程对其产品的需求导致EEPE增加。中部、西部、东北省区的EEPE主要隐含在中间投入部分(除重庆外),比例最高为0.90(山西省),而这些省区多为中国重要的能源产地(山西)和老工业基地(东北省区),其高比例中间投入EEPE表明中国在2007年的经济发展仍依赖高耗能产业。2010年,东部省区北京(0.86)、上海(0.84)、浙江(0.66)、江苏(0.54)最终消费部分EEPE比例较2007年有所增加,表明东部省区对其他省区最终产品的调出继续加大,而对其他省区中间投入部分EEPE的比例则越来越少。中部、西部、东北省区的EEPE仍主要隐含在中间投入部分,而山西、吉林、黑龙江、河南、新疆等资源较丰富的省区,其中间投入部分EEPE有所下降,这表明当前中国正在进行的产业结构调整是有效果的,对高耗能产品的生产依赖有所下降。
对于省际调入贸易隐含PM2.5(EEPI),2007年,除天津(0.48)、山西(0.44)、宁夏(0.46)外,其他省区EEPI主要由中间投入部分导致,表明越来越多的产品并非在一个地方单独完成生产,而是在不同省区生产链中进行,省区间生产联系紧密。2010年,有较多省区中间投入部分EEPI比例下降,如天津(0.41)、河北(0.47)、山西(0.31)、内蒙古(0.27),可能的原因为受经济危机影响,省际间生产活动下降,贸易也有所下降。
由投入产出表可知,最终消费包括居民政府消费和固定资本形成,因此本文将省际贸易隐含PM2.5(EEPT)按最终消费种类进行区分(图2)。30省区的EEPT均由固定资本形成所主导,即城市的道路建设和住宅建造,各省区固定资本导致的EEPT占其总EEPT一半以上。这是由于中国正在快速进行的城镇化带来的大规模城市经济增长和设施需求,以及政府政策导致的需求增加[34]。对东部、中部、西部、东北省区固定资本导致的EEPT比例取均值(各省区权重一样),2007年4个区域平均由固定资本导致的EEPT比重逐渐增加,分别为东部(0.57)、中部(0.58)、西部(0.59)、东北(0.60);2010年4个区域该比例值均有增加,东北省区有较大的增加(0.09),中西部省区的增加次之(0.06),东部省区增加较小(0.05);其中东北地区固定资本形成导致的EEPT比例上升至0.69。表明随着西部大开发、中部崛起、振兴东北老工业基地政策的实施,国家对这些区域投资增加,从而导致其EEPT增加。2007年,固定资本形成导致EEPT比例较高的省份为浙江(0.68)、江苏(0.66)、河南(0.66);2010年为河南(0.73)、湖南(0.72)、辽宁(0.72)。值得注意的是2010年,北京由固定资本形成导致的EEPT比例为0.47,为所有省区中唯一以消费导致EEPT为主的省区。作为首都,其城市建设相对已较完善,而基于消费的需求则较大。因此对于控制北京EEPT更重要的需要从消费角度入手。
 显示原图|下载原图ZIP|生成PPT
图22007年和2010年中国30省区的贸易隐含PM2.5排放量分类情况
-->Fig. 2Classification of 30 provinces' EEPT in China in 2007 and 2010
-->
分行业贸易隐含PM2.5排放量(EEPT)为30省区各个行业EEPT之和。大多数产业的EEPT从2007年到2010年有所下降,与上文EEPT变化情况一致。第二产业EEPT量最多,其次为第三产业,最少的为第一产业。这反映出对于控制EEPT,不仅需要控制第二产业的PM2.5排放,第三产业的作用也需得到重视。在第二产业中,建筑业、机械设备制造业EEPT较高,2007年分别占总贸易隐含PM2.5的30.72%、23.76%,2010年分别占26.47%、27.01%。2007年和2010年第三产业中的其他服务业则分别拥有14.43%、14.85%的EEPT。
2007-2010年,多数省区省际调出贸易隐含PM2.5(EEPE)有所下降,下降较多的为内蒙古、吉林、河北和黑龙江,这4个省份的EEPE下降量约占EEPE总下降量的71.16%;对于省际调入贸易隐含PM2.5(EEPI),仅有6个省区的EEPI有所增加,其他省份均有下降,下降量较大的为浙江、四川、北京和上海,其EEPI下降比例约占EEPI总变化量的47.05%。可见,省际贸易隐含PM2.5(EEPT)的变化多集中在某几个省区,从地理分布上来看,对EEPE变化贡献前十的省区中,有4个西部省区(38.39%②(②对EEPT变化的贡献比例,因有些省区的贸易隐含PM2.5为增加,因此总贡献比例相加大于1。)),3个东部省区(33.71%)、2个东北省区(30.81%)和1个中部省区(4.40%);对EEPI贡献前十的省区中,有5个东部省区(49.30%)、2个西部省区(15.06%)、2个东北省区(14.41%)和1个中部省区(6.01%)。西部、东北省区对EEPE变化的贡献表明其在经济生产过程中依然发挥较重要的作用,而这些省区多为资源型省区和重工业基地,表明当前中国清洁生产技术仍存在上升空间。
3.2 省际贸易隐含PM2.5的省区间转移
3.2.1 净省际贸易隐含PM2.5的时空变化 图3为2007年和2010年净省际贸易隐含PM2.5(EEPT)的空间分布。整体来看,2007-2010年,EEPT净流入主要为经济发达的东部省区(广东、浙江、上海、江苏、北京、天津、福建、海南)及个别经济欠发达的西部省区(新疆);东部省区EEPT净流入量偏大。表明东部沿海地区的发展需要能源和重化工省区为其提供相应的经济支撑。而欠发达西部省区的产业结构不完整,需要从其他省区调入产品用以生产。其中东部省区河北、山东EEPT净流出量较大,因河北资源丰富,而山东制造业基础较好。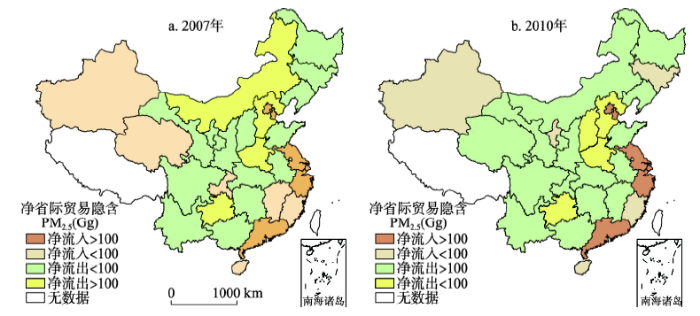 显示原图|下载原图ZIP|生成PPT
图32007年和2010年中国净省际贸易隐含PM2.5的分布情况
-->Fig. 3Distribution of the net PM2.5 emissions embodied in China's provincial trade in 2007 and 2010
-->
中部省区多为EEPT净调出省份(2007年除江西外),西部省区多为EEPT净调出省份(2007年除重庆、青海、新疆外,2010年除青海、新疆外),东北省区为EEPT净调出省份(2010年除吉林外)。中部省区河南、山西净流出量较大,西部资源型省区、东北省区净流出量较小,表明目前中国的生产活动还是在很大程度上依赖于资源的消耗,导致以上省区省际调出初级产品较多。整体来看,EEPT净流向为从中、西和东北省区流出到东部省区,表明东部省区通过转移高耗能产业将PM2.5的生产压力转移到了其他省区。
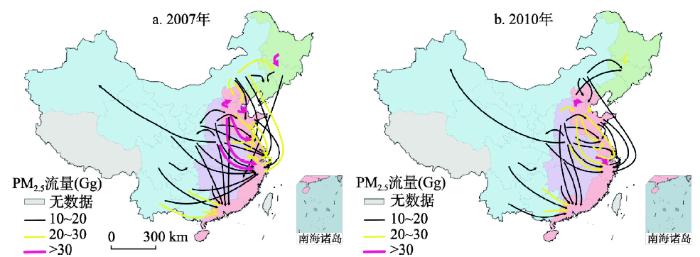
3.2.2 省际贸易隐含PM2.5的省区间转移 图4为30省区间贸易隐含PM2.5的净转移情况。整体来看,从2007年到2010年,大于30 Gg省际净贸易隐含PM2.5(EEPT)主要发生在资源丰富省区对东部省区的调出(河北对北京、天津、浙江、江苏)。较大规模的净EEPT(20~30 Gg)主要发生在东部省区内部(河北、浙江对上海,山东对上海、江苏),中部省区对东部省区的调出(山西对河北的调出,安徽对上海、江苏、浙江,河南对江苏),西部资源型省区对东部省区调出(广西、贵州、云南对广东,内蒙古对北京、天津),东北省区间(黑龙江对吉林)。中等规模净EEPT(10~20 Gg)主要发生在中部省区对东部沿海省区调出(山西对江苏、浙江、山东),东北省区间(吉林对辽宁),东北省区对中部省区调出(吉林对江西),中部省区对东部省区调出(河南对上海、江苏、广东,湖北、湖南与广东),西部省区对东部省区调出(内蒙古对辽宁、上海、江苏、山东,陕西对上海,四川、陕西对广东,贵州、云南、陕西、甘肃对浙江)。较小净EEPT(<10 Gg)主要发生于西部省区间(除四川对重庆的调出),西部省区对中部省区的调出(除陕西从河南的调入外),中部省区间。
 显示原图|下载原图ZIP|生成PPT
图42007年和2010年中国省区间净贸易隐含PM2.5的流向
注:为了使图片显示更加清晰,只选择了大于10 Gg的流量进行标识。
-->Fig. 4Direction of the net interprovincial transfer of embodied PM2.5 emissions in China's mainland in 2007 and 2010
-->
2010年省际贸易隐含PM2.5(EEPT)的省际净转移量普遍要小于2007年,与EEPT的变化趋势一致。西部、中部省区对东部沿海省区的调出明显减少,因东部沿海省区的生产活动受经济危机影响而减弱,从而导致其国内需求下降。但总体的转移趋势依然为中部、西部、东北省区流向东部地区,从东北省区流向中部省区,及少量的从西部省区流向中部和东北省区。
4 结论
基于中国区域间投入产出模型,本文对2007、2010年中国30省区省际贸易隐含PM2.5(EEPT)进行核算,结果表明EEPT约为以生产计算PM2.5排放量的1/3。由此可见在治理大气污染时,以生产计算的排污责任划分不能实现公平原则,而需同时考虑贸易隐含排放所带来的治污责任的转移。在地理分布上,东部省区多为净调入贸易隐含PM2.5,而中部、西部、东北省区则多为净调出。且东部发达省区(北京、山东、浙江、上海)省际贸易调入隐含PM2.5的变化速度高于其省际调出贸易隐含PM2.5的变化速度,导致东部发达省区与其他省区间EEPT之差持续加大,无疑为中西部省区、东北老工业省区的环境治理增加了难度。东部省区的省际调出贸易隐含PM2.5(EEPE)主要由最终消费部分导致,而中、东北、西部省区则主要为中间投入部分导致。对于东部省区发达省区而言,控制其最终产品的调出是降低其EEPE的有效手段;而对于东部资源型省区及中西部、东北省区而言,则需控制对其他省区中间投入部分高污染产品的调出,减少其污染的生产成本。省际调入贸易隐含PM2.5(EEPI)主要由中间投入过程中产生EEPI构成,即越来越多的产品并非在一个地方单独完成生产,而是在不同省区间的生产链中进行。这也表明区域联合防污的必要性,仅靠一个地区的努力去实现大气污染的治理是不太可能的,需整个生产链的生产结构同时实现优化调整,才有利于污染治理的快速实现。
从最终消费的分类来看,固定资本形成导致的省际贸易隐含PM2.5(EEPT)占主导地位(仅北京在2010年例外),且该比例在2010年比2007年有所增加。中部、西部、东北省区由固定资本形成导致的EEPT比例高于东部省区,因此投资政策不仅要关注其带来的经济效应,同时还应考虑是否会导致发达省区的污染产业转移至欠发达省区,使得欠发达地区的环境更加恶化。
为了实现环境治理总目标,政府需将注意力放在改进重点产业的技术上,分产业贸易隐含PM2.5的数据表明,需对第二产业中建筑业和机械设备制造业重点控制,其次为第三产业中的其他服务业。
对省际净贸易隐含PM2.5的转移情况分析表明,经济危机虽然导致净贸易隐含PM2.5转移量下降,但并未改变省际净贸易隐含PM2.5从西部资源丰富省区、中部、东北省区流向东部省区的转移趋势。在短期内这种转移趋势不会发生变化,由于这些省区在某种程度上承担了东部发达省区需求的生产活动,因此,在制定区域联控政策时,东部地区应考虑对这些区域进行补偿或技术转移,提高其清洁生产的能力。
致谢:感谢华东师范大学地理科学学院唐曦老师和徐鹏飞同学在地图设计与制作方面给予的帮助!
The authors have declared that no competing interests exist.
参考文献 原文顺序
文献年度倒序
文中引用次数倒序
被引期刊影响因子
| [1] | . 本文从区域大气污染联防联控的概念与内涵出发,在总结分析欧盟、美国与中国区域大气污染联防联控管理模式基础上,研究认为区域联防联控的管理模式分为两大类:第一,纵向机构的管理模式,即设定自上而下的机构层级通过行政手段实现区域合作;第二,横向机构的协作模式,即自发行动签订减排协议通过利益协商实现区域合作.长期来说,纵向机构的管理模式,有利于区域空气质量管理机制和环保工作的长效化、制度化.设立跨行政区的管理机构虽然是一个比较有效的方法,但是在短期内难以建立.短期内以最小制度成本取得最优治理效果的方式是行政区之间的合作、协同努力解决跨界污染.区域环境协商是现阶段适用于我国区域空气质量管理的最佳模式. . 本文从区域大气污染联防联控的概念与内涵出发,在总结分析欧盟、美国与中国区域大气污染联防联控管理模式基础上,研究认为区域联防联控的管理模式分为两大类:第一,纵向机构的管理模式,即设定自上而下的机构层级通过行政手段实现区域合作;第二,横向机构的协作模式,即自发行动签订减排协议通过利益协商实现区域合作.长期来说,纵向机构的管理模式,有利于区域空气质量管理机制和环保工作的长效化、制度化.设立跨行政区的管理机构虽然是一个比较有效的方法,但是在短期内难以建立.短期内以最小制度成本取得最优治理效果的方式是行政区之间的合作、协同努力解决跨界污染.区域环境协商是现阶段适用于我国区域空气质量管理的最佳模式. |
| [2] | . This paper presents the first comprehensive estimates of particulate emissions in China by size distribution and major components. Using a technology-based emission inventory approach, we are able to classify particulate emissions into three size ranges, TSP, PMand PM, and identify the contributions of black carbon (BC), organic carbon (OC), Ca and Mg. Total particulate emissions are estimated to be 27.4 Tg for the year 2001, of which 17.8 Tg are PMand 12.7 Tg are PM. Industrial processes are the major sources of particles over all three size ranges, but residential biofuel use and transportation sources become increasingly important for PMand PM. The industrialized coastal provinces, such as Shandong, Jiangsu and Hebei, are the major sources of particulate emissions. The industrialized and developing regions show different characteristic emission ratios of PM/TSP, (BC+OC)/PMand (Ca+Mg)/TSP. In the future, we can expect significant reductions in primary particulate emissions and major changes in the patterns of size and species. |
| [3] | . |
| [4] | . The interest in consumption-based emission and resource accounting has grown significantly. Many studies juxtapose consumer emissions (carbon footprint) and producer (territorial) emissions of greenhouse gases in order to demonstrate the effects of trade on the national emission budget. To this end, a respectable number of studies have been undertaken worldwide in order to estimate emissions embedded in international trade of numerous countries and world regions. Input-output approaches, and increasingly multi-region input-output (MRIO) models, are commonly chosen as they provide an appropriate methodological framework for complete carbon footprint estimates at the national and supra-national level. With increasing processing capabilities of computers and a wider availability of economic accounts, environmental accounts and trade data such models are now being implemented on a wide scale. After a brief overview of salient single-region input-output studies I provide an in-depth review of the most recent multi-region input-output models used for the purpose of consumption-based environmental accounting. The main methodological features and important results are described for around twenty studies covering the years 2007 to 2009. This is followed by a detailed review of studies dealing with uncertainty in MRIO analysis, an area which has not received a lot of attention so far. I conclude that further research is mainly needed in two areas, a) improvements in data availability and quality and b) improvements in the accuracy of MRIO modelling. |
| [5] | . Abstract Under the United National Framework Convention of Climate Change (UNFCCC) countries are required to submit National Emission Inventories (NEI) to benchmark reductions in greenhouse gas (GHG) emissions. Depending on the definition and system boundary of the NEI, the mitigation options and priorities may vary. The territorial system boundary used by the UNFCCC has been critiqued for not including international transportation and potentially causing carbon leakage. To address these issues, past literature has argued in favour of using consumption-based NEI in climate policy. This article discusses several issues in moving from the standard production-based NEI to consumption-based NEI. First, two distinct accounting approaches for constructing consumption-based NEI are presented. The approaches differ in the allocation of intermediate consumption of imported products. Second, a consistent method of weighting production-based and consumption-based NEI is discussed. This is an extension of the previous literature on shared responsibility to NEI. Third, due to increased uncertainty and a wide system boundary it may be difficult to implement consumption-based NEI directly into climate policy. Several alternative options for incorporating consumption-based inventories into climate policy are discussed. |
| [6] | . No abstract is available for this item. |
| [7] | . Abstract For the embodiment of natural resources and environmental emissions in Chinese economy 2005, a biophysical balance modeling is carried out based on an extension of the economic input utput table into an ecological one integrating the economy with its various environmental driving forces. Included resource flows into the primary resource sectors and environmental emission flows from the primary emission sectors belong to seven categories as energy resources in terms of fossil fuels, hydropower and nuclear energy, biomass, and other sources; freshwater resources; greenhouse gas emissions in terms of CO2, CH4, and N2O; industrial wastes in terms of waste water, waste gas, and waste solid; exergy in terms of fossil fuel resources, biological resources, mineral resources, and environmental resources; solar emergy and cosmic emergy in terms of climate resources, soil, fossil fuels, and minerals. The resulted database for embodiment intensity and sectoral embodiment of natural resources and environmental emissions is of essential implications in context of systems ecology and ecological economics in general and of global climate change in particular. |
| [8] | . Energy-related CO 2 emissions embodied in international trade have been widely studied by researchers using the environmental input–output analysis framework. It is well known that both sector aggregation and spatial aggregation affect the results obtained in such studies. With regard to the latter, past studies are often conducted at the national level irrespective of country or economy size. For a large economy with the needed data, studies may be conducted at different levels of spatial aggregation. We examine this problem analytically by extending the work of Su et al. ([Su, B., Huang, H.C., Ang, B.W., Zhou, P., 2010. Input-output analysis of CO 2 emissions embodied in trade: The effects of sector aggregation. Energy Economics 32 (1), 166–175.]) on sector aggregation. We present a numerical example using the data of China and by dividing the country into eight regions. It is found that the results are highly dependent on spatial aggregation. Our study shows that for a large country like China it is meaningful to look into the effect of spatial aggregation. |
| [9] | . For greenhouse gas (GHG) emissions by the Chinese economy in 2007 with the most recent statistics availability, a concrete inventory covering CO 2 , CH 4 , and N 2 O is composed and associated with an input utput analysis to reveal the emission embodiment in final consumption and international trade. The estimated total direct GHG emission amounts to 7456.12 Mt CO 2 -eq by the commonly referred IPCC global warming potentials, with 63.39% from energy-related CO 2 , 22.31% from non-energy-related CO 2 , 11.15% from CH 4 and 3.15% from N 2 O. Responsible for 81.32% of the total GHG emissions are the five sectors of the Electric Power/Steam and Hot Water Production and Supply , Smelting and Pressing of Ferrous and Nonferrous Metals , Nonmetal Mineral Products , Agriculture , and Coal Mining and Dressing , with distinctive emission structures. The sector of Construction holds the top GHG emissions embodied in both domestic production and consumption, and the emission embodied in gross capital formation is prominently more than those in other components of the final consumption characterized by extensive investment in contrast to limited household consumption. China is a net exporter of embodied GHG emissions, with emissions embodied in exports of 3060.18 Mt CO 2 -eq, in magnitude up to 41.04% of the total direct emission. |
| [10] | . This study examines the influence of US-China trade on national and global emissions of carbon dioxide (CO2). The three basic questions are as follows: (1) What amount of CO2 emissions is avoided in the US by importing Chinese goods? (2) How much are CO2 emissions in China increased as a result of the production of goods for export to the US? and (3) What are the impacts of US-China trade on global CO2 emissions? Our initial findings reveal that during 1997-2003: (1) US CO2 emissions would have increased from 3% to 6% if the goods imported from China had been produced in the US, (2) About 7%-14% of China's current CO2 emissions were a result of producing exports for US consumers, and (3) US-China trade has increased global CO2 emissions by an estimated 720 million metric tons. We suggest that the export of US technologies and expertise related to clean production and energy efficiency to China could be a "win-win" strategy for both countries for reducing their trade imbalance and mitigating global CO2 emissions. Improved international accounting methodologies for assigning responsibility for CO2 emissions must be designed to account for the dynamic nature of international trade. |
| [11] | . To gain insight into changes in CO 2 emissions embodied in China–US trade, an input–output analysis based on the emergy/dollar ratio (EDR) is used to estimate embodied CO 2 emissions; a structural decomposition analysis (SDA) is employed to analyze the driving factors for changes in CO 2 emissions embodied in China's exports to the US during 2002–2007. The results of the input–output analysis show that net export of CO 2 emissions increased quickly from 2002 to 2005 but decreased from 2005 to 2007. These trends are due to a reduction in total CO 2 emission intensity, a decrease in the exchange rate, and small imports of embodied CO 2 emissions. The results of the SDA demonstrate that total export volume was the largest driving factor for the increase in embodied CO 2 emissions during 2002–2007, followed by intermediate input structure. Direct CO 2 emissions intensity had a negative effect on changes in embodied CO 2 emissions. The results suggest that China should establish a framework for allocating emission responsibilities, enhance energy efficiency, and improve intermediate input structure. |
| [12] | . This paper examines CO2 emissions embodied in Japan-China trade. Besides directly quantifying the flow of CO2 emissions between the two countries by using a traditional input-output (IO) model, this study also estimates the effect of bilateral trade to CO2 emissions by scenario analysis. The time series of quantifications indicate that CO2 emissions embodied in exported goods from Japan to China increased overall from 1990 to 2000. The exported CO2 emissions from China to Japan greatly increased in the first half of the 1990s. However, by 2000, the amount of emissions had reduced from 1995 levels. Regardless, there was a net export of CO2 emissions from China to Japan during 1990-2000. The scenario comparison shows that the bilateral trade has helped the reduction of CO2 emissions. On average, the Chinese economy was confirmed to be much more carbon-intensive than Japan. The regression analysis shows a significant but not perfect correlation between the carbon intensities at the sector level of the two countries. In terms of CO2 emission reduction opportunities, most sectors of Chinese industry could benefit from learning Japanese technologies that produce lower carbon intensities. |
| [13] | . Energy-related CO 2 emissions embodied in international trade have been widely studied by researchers all over the world. By using the bilateral trade input--output (BTIO) approach, this study investigates the CO 2 emissions embodied in China--Japan trade during 1995--2009 and attempts to identify the driving forces for the change in CO 2 emissions embodied in China’s exports to Japan during that period by using structural decomposition analysis (SDA). Result shows that CO 2 emissions embodied in China’s exports increased by about 100% from 1995 to 2009, whereas those embodied in China’s imports increased by about 500% during the same period. Result of this research also reveals that the scale effect had a large influence on the increase in CO 2 emissions embodied in China--Japan trade. The technical effect greatly decreased CO 2 emissions embodied in China’s exports to Japan, but obviously increased those embodied in imports. The influence of the structural effect was relatively small and insignificant in the change of CO 2 emissions embodied in China’s exports to Japan, but was notable in the change of emissions embodied in imports. |
| [14] | . Efforts such as the Kyoto Protocol to reduce emissions that may be linked to climate change focus on six greenhouse gases (GHG). Carbon dioxide is by far the largest of these by volume, representing about 80% of the total emissions of these six gases. Almost all carbon dioxide is emitted during the combustion of fossil fuels and OECD countries account for over half of the total carbon dioxide emission in the world while an additional four countries (Brazil, China, India and Russia) together account for a further quarter of the global total. Many policies designed to reduce these emissions set emission reduction goals based on some previous level (e.g. 1990 in the case of Kyoto for many countries) which is used as a benchmark for success and compliance to the protocol. But changes in emissions at the national level can occur for many reasons: including the relocation of production abroad, and/or by import substitution. This may have a negligible impact on global emissions but, if ... Les émissions de dioxyde de carbone incorporées dans les échanges internationaux de marchandises Des initiatives telles que le Protocole de Kyoto qui visent à réduire les émissions susceptibles de contribuer au changement climatique portent essentiellement sur six gaz à effet de serre (GES). Le dioxyde de carbone est de loin le plus important d'entre eux en volume, puisqu'il représente environ 80 % des émissions totales de ces six gaz. La quasi-totalité des émissions de ce gaz sont imputables à l'utilisation de combustibles fossiles et les pays de l'OCDE sont responsables de plus de la moitié des émissions totales de dioxyde de carbone dans le monde, tandis que quatre autres pays (Brésil, Chine, Inde et Russie) représentent ensemble un quart du total. Nombre de politiques visant à réduire ces émissions fixent des objectifs de réduction fondées sur un niveau antérieur (dans le cas de Kyoto, par exemple, celui de 1990 pour de nombreux pays) qui sert de repère pour juger du respect du protocole et de sa réussite. Or l'évolution des émissions au niveau national peut s'expliquer ... |
| [15] | Summary China is now believed to be the world's largest emitter of carbon dioxide (CO2), the most important contributor to global climate change. The evidence that China has overtaken the United States to take the number one spot has led to renewed calls for |
| [16] | . In this paper, we use the multi-regional input utput model (MRIO) and logarithm mean Divisia index approach to analyze the changes in China's carbon embodied in exports (CEE) at the national and provincial levels. The results indicate that the total CEE and the CEE of 17 provinces, including all eastern provinces, decreased between 2007 and 2010. The largest decrease in total CEE is caused by an input structural effect, which decreases the CEE of most of the provinces. The technique effect arising from changes in provincial carbon intensities causes the second largest decrease in total CEE and it effectively reduces the CEE of most of the provinces, especially the eastern provinces. Changes in the export composition of most of the provinces also decrease the provincial CEE. A change in the provincial distribution of exports decreases the CEE in 11 provinces on the one hand and increases the CEE in 19 provinces on the other hand. A change in export volume increases the CEE of each province and the whole country, but its total effect is evidently lower than the input structural effect and the technique effect. |
| [17] | . China is the world’s largest emitter of anthropogenic air pollutants, and measurable amounts of Chinese pollution are transported via the atmosphere to other countries, including the United States. However, a large fraction of Chinese emissions is due to manufacture of goods for foreign consumption. Here, we analyze the impacts of trade-related Chinese air pollutant emissions on the global atmospheric environment, linking an economic-emission analysis and atmospheric chemical transport modeling. We find that in 2006, 36% of anthropogenic sulfur dioxide, 27% of nitrogen oxides, 22% of carbon monoxide, and 17% of black carbon emitted in China were associated with production of goods for export. For each of these pollutants, about 21% of export-related Chinese emissions were attributed to China-to-US export. Atmospheric modeling shows that transport of the export-related Chinese pollution contributed 3–10% of annual mean surface sulfate concentrations and 0.5–1.5% of ozone over the western United States in 2006. This Chinese pollution also resulted in one extra day or more of noncompliance with the US ozone standard in 2006 over the Los Angeles area and many regions in the eastern United States. On a daily basis, the export-related Chinese pollution contributed, at a maximum, 12–24% of sulfate concentrations over the western United States. As the United States outsourced manufacturing to China, sulfate pollution in 2006 increased in the western United States but decreased in the eastern United States, reflecting the competing effect between enhanced transport of Chinese pollution and reduced US emissions. Our findings are relevant to international efforts to reduce transboundary air pollution. |
| [18] | . ABSTRACT Trades create a mechanism of embodied CO2 emissions transfer among regions, causing distortion on the total emissions. As the world0964s second largest economy, China has a large scale of trade, which results in the serious problem of embodied CO2 emissions transfer. This paper analyzes the characteristics of China0964s CO2 emissions embodied in international and interprovincial trade from the provincial perspective. The multi-regional Input09“Output Model is used to clarify provincial CO2 emissions from geographical and sectoral dimensions, including 30 provinces and 28 sectors. Two calculating principles (production accounting principle and consumption accounting principle, Munksgaard and Pedersen, 2001) are applied. The results show that for international trade, the eastern area accounts for a large proportion in China0964s embodied CO2 emissions. The sectors as net exporters and importers of embodied CO2 emissions belong to labor-intensive and energy-intensive industries, respectively. For interprovincial trade, the net transfer of embodied CO2 emissions is from the eastern area to the central area, and energy-intensive industries are the main contributors. With the largest amount of direct CO2 emissions, the eastern area plays an important role in CO2 emissions reduction. The central and western areas need supportive policies to avoid the transfer of industries with high emissions. |
| [19] | . Abstract Recent studies have shown that the high standard of living enjoyed by people in the richest countries often comes at the expense of CO2 emissions produced with technologies of low efficiency in less affluent, developing countries. Less apparent is that this relationship between developed and developing can exist within a single country's borders, with rich regions consuming and exporting high-value goods and services that depend upon production of low-cost and emission-intensive goods and services from poorer regions in the same country. As the world's largest emitter of CO2, China is a prominent and important example, struggling to balance rapid economic growth and environmental sustainability across provinces that are in very different stages of development. In this study, we track CO2 emissions embodied in products traded among Chinese provinces and internationally. We find that 57% of China's emissions are related to goods that are consumed outside of the province where they are produced. For instance, up to 80% of the emissions related to goods consumed in the highly developed coastal provinces are imported from less developed provinces in central and western China where many low-value-added but high-carbon-intensive goods are produced. Without policy attention to this sort of interprovincial carbon leakage, the less developed provinces will struggle to meet their emissions intensity targets, whereas the more developed provinces might achieve their own targets by further outsourcing. Consumption-based accounting of emissions can thus inform effective and equitable climate policy within China. |
| [20] | . 碳排放增多带来的气候变化已成为各国政府共同面对的问题,碳减排责任的划分是各国争论的焦点,而国际贸易造成的"碳泄露"问题更是不可忽视。中国的碳减排责任最终要落实到省市区域尺度上,区域间贸易引起的"碳泄露"同样值得考虑。使用多区域投入产出分析法,分别从生产者和消费者的角度对北京各部门碳排放进行分析,并估算各部门进出口贸易中隐含的碳排放量。结果表明北京是一个碳排放净流入区域。基于生产者和消费者的角度,北京的碳排放总量分别是142.79 Mt和116.80 Mt。输出贸易中隐含的碳排放量为28.15 Mt,包括区域间调出和国际出口。输出贸易中隐含碳排放最大的部门是石油加工、炼焦及核燃料加工业。输入贸易中隐含的碳排放量为54.15 Mt,包括区域间调入和国际进口。输入贸易中隐含的碳排放最大的部门是建筑业。 . 碳排放增多带来的气候变化已成为各国政府共同面对的问题,碳减排责任的划分是各国争论的焦点,而国际贸易造成的"碳泄露"问题更是不可忽视。中国的碳减排责任最终要落实到省市区域尺度上,区域间贸易引起的"碳泄露"同样值得考虑。使用多区域投入产出分析法,分别从生产者和消费者的角度对北京各部门碳排放进行分析,并估算各部门进出口贸易中隐含的碳排放量。结果表明北京是一个碳排放净流入区域。基于生产者和消费者的角度,北京的碳排放总量分别是142.79 Mt和116.80 Mt。输出贸易中隐含的碳排放量为28.15 Mt,包括区域间调出和国际出口。输出贸易中隐含碳排放最大的部门是石油加工、炼焦及核燃料加工业。输入贸易中隐含的碳排放量为54.15 Mt,包括区域间调入和国际进口。输入贸易中隐含的碳排放最大的部门是建筑业。 |
| [21] | . Previous studies on embodied emission in China's exports focus on the national aggregate analysis while pay little attention to the interregional emission transfer driven by exports. We used multiregional input–output model of 30 provinces to reexamine the embodied emissions and to capture the interregional linkage in it. Results in 2002–2007 show that SO2 embodied in exports contributes 15.17–22.08% of the total domestic SO2 emissions, and 74.40–78.14% of the embodiment is in exports from the eastern provinces, where over 90% of China's exports occur. However, only about 70% of the embodied emission in eastern China's exports is discharged in the east; an increasing portion (24% to 34%) is released in the central and western provinces as a result of interregional production linkage. Moreover, the interregional connection becomes closer during the 2002–2007 period, which increases the scale and intensity of embodied emission in China's export given large gaps in emission intensity among regions. Further analysis on Guangdong, China's largest export province, shows that the SO2 emissions per unit of output induced by Guangdong's exports are larger than that induced by the province's own exports for most provinces, especially the central and western provinces which are restricted in exports and indirectly export by supporting Guangdong's exports via interregional economic linkage. The results yield important implications for China's export and pollution emission control policy. |
| [22] | . ABSTRACT CO2 emissions embodied in trade have an important and far-reaching impact on CO2 emissions reduction obligations. Based on a multi-regional input-output analysis, this paper calculates China’s provincial CO2 emissions embodied in trade and analyzes CO2 emissions embodied in trade per unit of value of trade in 30 Chinese provinces. Several climate policy options that potentially reduce the impact of trade on individual provinces are discussed. One finding from this study is that provincial CO2 emissions embodied in trade accounted for approximately 60.02% of China’s CO2 emissions in 2007. The CO2 emissions embodied in imports and exports for 30 Chinese provinces differ widely, and remarkable differences in the CO2 emissions embodied in trade per unit of value of trade exist. Another important finding is that if provinces take binding commitments as a part of a coalition, instead of as individual provinces, then the impacts of trade can be reduced. Notably, however, the extent of reduction in a coalition varies in different provinces. |
| [23] | . |
| [24] | . 减排责任的区域分解需要科学评价各地区的排放责任。碳足迹可以全面客观地评价为满足消费而进行的生产的生命周期碳排放水平,除了生产过程的直接碳排放,也包括生产过程中所消耗的中间产品的隐含碳排放。应用2007年各省区投入产出模型和2002年中国省区间投入产出模型,定量测算了各省区的碳足迹和省区间的碳排放转移。结果显示,各省区之间碳足迹和人均碳足迹存在显著的差异。碳足迹较大的省份为经济大省,主要分布在北方地区;人均碳足迹较高的省份主要是北京、上海等中心城市和能源富集区域及重化工基地;中国存在着从能源富集区域和重化工基地分布区域向经济发达区域和产业结构不完整的欠发达区域的碳排放空间转移。上述结果表明,人均碳足迹高的经济发达省份应承担较大的减排责任,能源富集区域和重化工基地分布区域有相当一部分的碳排放是为沿海发达省份和产业结构不完整的欠发达省份提供电力、原材料等高碳产品所致,减排责任的区域分解需要考虑碳排放空间转移的因素,适当减轻能源富集区域和重化工基地分布区域的减排责任,或使沿海发达省份向能源富集区域和重化工区域提供资金和技术上的扶持,帮助这些区域提高能源利用效率,减少碳排放。 . 减排责任的区域分解需要科学评价各地区的排放责任。碳足迹可以全面客观地评价为满足消费而进行的生产的生命周期碳排放水平,除了生产过程的直接碳排放,也包括生产过程中所消耗的中间产品的隐含碳排放。应用2007年各省区投入产出模型和2002年中国省区间投入产出模型,定量测算了各省区的碳足迹和省区间的碳排放转移。结果显示,各省区之间碳足迹和人均碳足迹存在显著的差异。碳足迹较大的省份为经济大省,主要分布在北方地区;人均碳足迹较高的省份主要是北京、上海等中心城市和能源富集区域及重化工基地;中国存在着从能源富集区域和重化工基地分布区域向经济发达区域和产业结构不完整的欠发达区域的碳排放空间转移。上述结果表明,人均碳足迹高的经济发达省份应承担较大的减排责任,能源富集区域和重化工基地分布区域有相当一部分的碳排放是为沿海发达省份和产业结构不完整的欠发达省份提供电力、原材料等高碳产品所致,减排责任的区域分解需要考虑碳排放空间转移的因素,适当减轻能源富集区域和重化工基地分布区域的减排责任,或使沿海发达省份向能源富集区域和重化工区域提供资金和技术上的扶持,帮助这些区域提高能源利用效率,减少碳排放。 |
| [25] | . 基于多区域投入产出模型,以上海市为例全面了探讨城市地区的贸易隐含碳排放,并在此基础上深入分析贸易对城市产业与最终消费部门碳排放及其减排责任的影响。研究发现:2007年上海市各部门的国内贸易隐含碳总量为68.97 Mt CO2,约占当年上海碳排放总量的42.31%;而其国际贸易隐含碳量的上限值和下限值分别为44.39和25.93 Mt CO2,分别约占当年上海碳排放总量的27.23%和15.91%。与此同时,2007年上海市最终消费的国内贸易隐含碳总量为13.63 Mt CO2,约占当年上海碳排放总量的8.36%;而其国际贸易隐含碳量的上限值和下限值分别为4.58和0.59 Mt CO2,分别约占当年上海碳排放总量的2.81%和0.36%。此外,上海市的国际与国内贸易隐含碳流入量和流出量等均存在显著的部门差异。而在国内贸易中上海市贸易隐含碳的流入与流出上,流入上海的贸易隐含碳排名前五的地区分别是河北、浙江、湖北、江苏和河南,接受流出上海的贸易隐含碳量排名前五的地区分别是浙江、广东、江苏、河北和安徽。 . 基于多区域投入产出模型,以上海市为例全面了探讨城市地区的贸易隐含碳排放,并在此基础上深入分析贸易对城市产业与最终消费部门碳排放及其减排责任的影响。研究发现:2007年上海市各部门的国内贸易隐含碳总量为68.97 Mt CO2,约占当年上海碳排放总量的42.31%;而其国际贸易隐含碳量的上限值和下限值分别为44.39和25.93 Mt CO2,分别约占当年上海碳排放总量的27.23%和15.91%。与此同时,2007年上海市最终消费的国内贸易隐含碳总量为13.63 Mt CO2,约占当年上海碳排放总量的8.36%;而其国际贸易隐含碳量的上限值和下限值分别为4.58和0.59 Mt CO2,分别约占当年上海碳排放总量的2.81%和0.36%。此外,上海市的国际与国内贸易隐含碳流入量和流出量等均存在显著的部门差异。而在国内贸易中上海市贸易隐含碳的流入与流出上,流入上海的贸易隐含碳排名前五的地区分别是河北、浙江、湖北、江苏和河南,接受流出上海的贸易隐含碳量排名前五的地区分别是浙江、广东、江苏、河北和安徽。 |
| [26] | . Top-down analysis of virtual atmospheric mercury emission networks can direct efficient demand-side policy making on mercury reductions. Taking China-the world's top atmospheric mercury emitter-as a case, we identify key contributors to China's atmospheric mercury emissions from both the producer and the consumer perspectives. China totally discharged 794.9 tonnes of atmospheric mercury emissions in 2007. China's production-side control policies should mainly focus on key direct mercury emitters such as Liaoning, Hebei, Shandong, Shanxi, Henan, Hunan, Guizhou, Yunnan, and Inner Mongolia provinces and sectors producing metals, nonmetallic mineral products, and electricity and heat power, while demand-side policies should mainly focus on key underlying drivers of mercury emissions such as Shandong, Jiangsu, Zhejiang, and Guangdong provinces and sectors of construction activities and equipment manufacturing. China's interregional embodied atmospheric mercury flows are generally moving from the inland to the east coast. Beijing-Tianjin (with 4.8 tonnes of net mercury inflows) and South Coast (with 3.3 tonnes of net mercury inflows) are two largest net-inflow regions, while North (with 5.3 tonnes of net mercury outflows) is the largest net-outflow region. We also identify primary supply chains contributing to China's virtual atmospheric mercury emission network, which can be used to trace the transfers of production-side and demand-side policy effects. |
| [27] | . 随着世界经济一体化程度不断加深,国际贸易中的隐含资源和隐含污染受到广泛关注,但目前对中国区域间隐含污染转移的研究较为欠缺.本文首先从理论层面对隐含污染转移现象进行剖析,从地理学角度探讨了污染转移的模式;然后,基于区域间投入产出表,构建区域间隐含污染转移的评估模型;选取SO2、COD、固体废弃物及重金属四种典型工业污染物,评估2007年中国各区域本地最终使用中的隐含污染,及区域间隐含污染转移量,揭示我国隐含污染转移的空间特征.研究发现中国整体上是隐含污染的输出地区,国内隐含污染转移主要是从经济欠发达的中西部地区流向城市化率较高、经济发达的东部沿海地区,实际上是东部地区通过区域间贸易将自身的污染排放负担转移到中西部地区.最后基于隐含污染转移格局,对区域污染物减排政策的制定提出了一系列建议. . 随着世界经济一体化程度不断加深,国际贸易中的隐含资源和隐含污染受到广泛关注,但目前对中国区域间隐含污染转移的研究较为欠缺.本文首先从理论层面对隐含污染转移现象进行剖析,从地理学角度探讨了污染转移的模式;然后,基于区域间投入产出表,构建区域间隐含污染转移的评估模型;选取SO2、COD、固体废弃物及重金属四种典型工业污染物,评估2007年中国各区域本地最终使用中的隐含污染,及区域间隐含污染转移量,揭示我国隐含污染转移的空间特征.研究发现中国整体上是隐含污染的输出地区,国内隐含污染转移主要是从经济欠发达的中西部地区流向城市化率较高、经济发达的东部沿海地区,实际上是东部地区通过区域间贸易将自身的污染排放负担转移到中西部地区.最后基于隐含污染转移格局,对区域污染物减排政策的制定提出了一系列建议. |
| [28] | . Primary PMemissions contributed significantly to poor air quality in China. We present an interdisciplinary study to measure the magnitudes of socioeconomic factors in driving primary PM emission changes in China between 1997-2010, by using a regional emission inventory as input into an environmentally extended input-output framework and applying structural decomposition analysis. Our results show that China's significant efficiency gains fully offset emissions growth triggered by economic growth and other drivers. Capital formation is the largest final demand category in contributing annual PM emissions, but the associated emission level is steadily declining. Exports is the only final demand category that drives emission growth between 1997-2010. The production of exports led to emissions of 638 thousand tonnes of PM, half of the EU27 annual total, and six times that of Germany. Embodied emissions in Chinese exports are largely driven by consumption in OECD countries. |
| [29] | 本书中所编制的区域间投入产出表把全国分为30个省、市、自治区,是目前国内相当详细的区域间投入产出表。在编制过程中,对区域间贸易流量估算方法进行了重要的改进。内容涉及:投入产出技术的简要回顾、区域间投入产出表编制的理论与方法等。 本书中所编制的区域间投入产出表把全国分为30个省、市、自治区,是目前国内相当详细的区域间投入产出表。在编制过程中,对区域间贸易流量估算方法进行了重要的改进。内容涉及:投入产出技术的简要回顾、区域间投入产出表编制的理论与方法等。 |
| [30] | |
| [31] | . This paper gives an assessment of the relative strengths and weaknesses of a variety of economic approaches commonly used for cost estimates for limiting CO2 emissions, including the ad nod approach, the dynamic optimization approach, the input-output approach, the macroeconomic approach, the computable general equilibrium approach and the hybrid approach. It illustrates how these different economic approaches are able to shed light on different aspects of the control of CO2 emissions. Some conclusions with respect to the applicability of each approach are drawn. |
| [32] | . |
| [33] | . For urban economies, an ecological endowment embodiment analysis has to be supported by endowment intensities at both the international and domestic scales to reflect the international and domestic imports of increasing importance. A three-scale input-output modeling for an urban economy to give nine categories of embodiment fluxes is presented in this paper by a case study on the carbon dioxide emissions by the Beijing economy in 2007, based on the carbon intensities for the average world and national economies. The total direct emissions are estimated at 1.03E+08 t, in which 91.61% is energy-related emissions. By the modeling, emissions embodied in fixed capital formation amount to 7.20E+07 t, emissions embodied in household consumption are 1.58 times those in government consumption, and emissions in gross capital formation are 14.93% more than those in gross consumption. As a net exporter of carbon emissions, Beijing exports 5.21E+08 t carbon embodied in foreign imported commodities and 1.06E+08 t in domestic imported commodities, while emissions embodied in foreign and domestic imported commodities are 3.34E+07 and 1.75E+08 t respectively. The algorithm presented in this study is applicable to the embodiment analysis of other environmental resources for regional economies characteristic of multi-scales. |
| [34] | . Abstract China has experienced rapid urbanization in the last three decades, with more than half of the population living in cities since 2012. The extent of urban production and urban lifestyles has become one of the main drivers for China’s CO2 emissions. To analyze drivers of CO2 emissions we use a consumption-based accounting approach that allocates all emissions along the production chain to the product and place of final consumption, whereas a production-based approach would allocate all emissions to the place of origin. In this study, we focus on the spatial distribution of production activities leading to CO2 emissions across China as a consequence of final consumption in four Chinese mega cities: Beijing, Shanghai, Tianjin, and Chongqing. Urban consumption not only causes a large amount of emissions within its territory, but also imposes even much more emissions to its surrounding provinces via interregional supply chains. Results show that more than 48% of CO2 emissions related to goods consumed in Chongqing and more than 70% for Beijing, Shanghai and Tianjin occurred outside of the respective city boundary. In addition to the usual focus on efficiency, our analysis adds insights into the causes of CO2 emissions by looking at the drivers and types of consumption. Addressing consumption patterns in China’s cities is critical for China’s low carbon development. |
| [35] | . Knowing the carbon emission baseline of a region is a precondition for any mitigation effort, but the baselines are highly dependent on the system boundaries for which they are calculated. On the basis of sectoral energy statistics and a nested provincial and global multi-regional input utput model, we calculate and compare four different system boundaries for China's 30 provinces and major cities. The results demonstrate significant differences in the level of emissions for the different system boundaries. Moreover, the associated emissions with each system boundary varies with the regional development level, i.e. richer areas outsource more emissions to other areas, or in other words boundary 4 emissions are higher than boundary 1 emissions for rich areas and vice versa for poor areas. Given these significant differences it is important to be aware of the implications the choice of an accounting system might have on outcomes. |
| [36] | . The flow of pollution through international trade flows has the ability to undermine environmental policies, particularly for global pollutants. In this article we determine the CO2 emissions embodied in international trade among 87 countries for the year 2001. We find that globally there are over 5.3 Gt of CO2 embodied in trade and that Annex B countries are net importers of CO2 emissions. Depending on country characteristics--such as size variables and geographic location--there are considerable variations in the embodied emissions. We argue that emissions embodied in trade may have a significant impact on participation in and effectiveness of global climate policies such as the Kyoto Protocol. We discuss several policy options to reduce the impact of trade in global climate policy. If countries take binding commitments as a part of a coalition, instead of as individual countries, then the impacts of trade can be substantially reduced. Adjusting emission inventories for trade gives a more consistent description of a country's environmental pressures and circumvents many trade related issues. It also gives opportunities to exploit trade as a means of mitigating emissions. Not least, a better understanding of the role that trade plays in a country's economic and environmental development will help design more effective and participatory climate policy post-Kyoto. |
| [37] | . This paper compares two concepts to evaluate the international responsibility of a country with respect to its emissions. Using a multi-regional input-output model, we show that the trade emission balance and the responsibility emission balance yield the same result. In practical work, however, a lack of data availability implies that the same technology assumption has been commonly adopted. In that case, also a third alternative exists, which simply evaluates the emissions embodied in the trade balance of the country. This third alternative yields the same results as the other two approaches at the aggregate level. At the level of individual products, however, the results are clearly different and it turns out that the third alternative answers a different question. That is, it is appropriate for measuring the emission content of the products that cross the border. In our empirical application, we consider Spain in 1995 and 2000, distinguishing nine different gases: CO(2), CH(4), N(2)O, SF(6), HFCs, PFCs, SO(2), NOx. and NH(3). (C) 2010 Elsevier B.V. All rights reserved. |
| [38] | . The aim of this study is to quantify the driving forces behind the growth of carbon dioxide emissions embodied in trade (EET). The World Input-output Database is used to estimate EET in 40 countries during 1995-2007 after which a structural decomposition analysis is applied. To avoid biases in the results, we have used the input-output tables in previous year's prices and chained the outcomes. In many developed countries, the growth of emissions embodied in imports is much higher than the growth of emissions embodied in exports. A key reason for this finding is the change in the structure of trade, both in intermediate and in final products. Emerging economies like the BRIC countries have increased their share in production and trade at the expense of developed countries. Producers and consumers in developed countries have shifted towards importing a larger share of products from emerging countries. This is the distinguishing feature that led to an increase of emissions embodied in imports for developed countries and an increase of emissions embodied in exports for emerging countries. These results suggest policy makers to monitor EET more carefully and take the effects of trade on emissions into consideration. (C) 2014 Elsevier B.V. All rights reserved. |
