 , 董瑶
, 董瑶Evolution of export product space in China: Path-dependent or path-breaking?
HECanfei, DONGYao收稿日期:2015-07-10
修回日期:2015-11-18
网络出版日期:2016-06-30
版权声明:2016《地理学报》编辑部本文是开放获取期刊文献,在以下情况下可以自由使用:学术研究、学术交流、科研教学等,但不允许用于商业目的.
基金资助:
作者简介:
-->
展开
摘要
关键词:
Abstract
Keywords:
-->0
PDF (923KB)元数据多维度评价相关文章收藏文章
本文引用格式导出EndNoteRisBibtex收藏本文-->
1 引言
地区经济发展与其生产结构紧密相联,多样而复杂的生产结构是地区经济增长的源泉。Jacobs等认为地区多样化会产生新的创意,从而促进知识溢出,为创新提供资源[1-2]。而Nooteboom[3]指出Jacobs只强调了地理邻近性对知识溢出的重要性,忽略了认知距离的影响,认为在产业间只有认知距离合适的时候才能产生知识溢出。认知距离太远则产业间交互没有共同的知识基础,而认知距离太近则容易造成知识与技术的“锁定”,同样不利于技术与资源的有效整合。在此基础上,演化经济地理****提出“认知邻近性”(cognitive proximity)的概念[4],并引入“技术关联”(technological relatedness)来衡量认知临近性[5],认为只有关联性较高的产业才能实现知识的跨产业溢出[6]。随后Frenken等[6]、Boschma等[7]分别通过对荷兰、意大利的研究,验证了产业间技术关联对地区经济发展的促进作用。随着研究深入,演化经济地理****发现技术关联也对新产业进入[8]、区域生产结构演化[9]等长期过程具有显著影响。Hidalgo等[9]通过国际贸易数据构建“产品空间”来刻画产品间技术关联网络,发现产品空间具有极高异质性,有紧密联系产品组成的“核心区”,也有联系不紧密的产品组成“边缘区”,呈现明显的“核心—边缘”结构。在此基础上Hausmann等[10]、Hidalgo等[11]结合产品空间与比较优势演化理论,认为产品是一国或地区知识和能力的载体,其本身包含了经济体的各种要素禀赋信息,故产品空间的高度异质性是解释不同地区经济发展差异的关键原因。一国或地区经济发展和结构转换的本质是该地企业集中生产本地优势产品并学习和积累生产异质性产品能力的过程,因此,产品演化在比较优势的演化过程中发挥着重要的作用,它决定了国家或地区产业升级的方向和比较优势演化的路径[12]。
由于邻近产品对劳动力、土地、资本密集度、技术精细化水平、投入和产出的产品价值链、制度条件等的要求较为相似,故企业更容易跳跃到距离较近(产品间技术关联大)的新产品进行生产。然而,在同一产品空间中,位于产品空间不同位置的不同区域,产业升级的机会是不同的,这导致产品结构演化过程的分岔和分化[12]。位于产品空间“核心区”的国家或地区更容易跳跃到邻近产品,从而实现多样化发展;而位于产品空间“边缘区”的国家或地区则由于缺乏与“核心区”产品的技术联系,很难实现产品结构转变,陷入“低端产品”陷阱("low-product" trap)[13]。随后****们分别利用不同国家或地区的数据构建产品空间,验证了技术关联对地区生产结构演化的影响,体现技术关联的路径依赖作用[14]。然而近年来也有****指出,并非所有生产结构演化都遵循路径依赖。如Jankowska等[15]通过韩国、巴西和墨西哥的案例研究,发现产业发展政策能够促使地区生产结构转变。Abdon等[16]认为撒哈拉以南非洲地区的生产结构位于产品空间“边缘区”,要想打破路径依赖,实现地区经济增长与结构转型必须引入有关政策。这些研究提到的政策对地区生产结构演化的影响体现了路径突破的过程。可见在地区生产结构演化过程中,不同国家或地区发展可能遵循不同的演化路径。
近年来,随着演化经济地理学不断发展,部分****开始以中国为研究对象,探讨技术关联对中国生产结构演化的影响。如Poncet等[17]利用2000-2006年中国企业层面海关出口数据,发现与当前生产结构具有紧密联系的产品,其出口增长更快,从而验证了技术关联对中国出口产品多样化发展具有推动作用,体现了路径依赖的演化过程。然而,近年来中国产业空间格局经历了较大的结构调整,且区域发展严重不平衡,因此不同区域的演化路径可能存在明显差异。众多研究表明,改革开放以来,随着市场化程度的不断加深,中国产业格局总体呈现向沿海集聚的态势。贺灿飞等[18-19]研究发现,产业集聚主要受资源投入、市场需求与市场潜力、内外部规模经济、产业联系、政策制度等因素影响。然而在总体集聚的态势下,中国产业空间格局的调整也一直存在,尤其是进入21世纪后,沿海地区面临资源供应不足、劳动力成本上升、环境污染等问题,进行产业结构升级,寻求可持续的发展成为区域发展的主题。而此时部分企业逐渐向中西部省市转移[20]。可见,中国不同区域发展存在显著差异,因此从演化的视角,探讨中国产业结构演化的路径及区域差异十分有必要。
同时,作为一个强调政府宏观调控与市场力量并重的国家,研究中国生产结构演化不能忽视政策的影响。众多研究证明,经济政策是国家宏观调控的重要手段,政治制度和产权制度先于经济发展并决定经济增长与经济结构的变迁[21]。国家政策性导向与具体产业政策对经济增长与生产结构演化都具有重要影响,且具有鲜明的地方指向性,是引致中国区域发展差距的重要原因之一[22-23]。早期政策更多偏向东部沿海地区[24],如改革开放政策推动东南沿海迅速崛起等。而到了21世纪,国家政策开始偏向内陆地区,先后制定了“西部大开发”、“振兴东北老工业基地”、“中部崛起计划”、“中西部承接东部产业转移”等政策,逐步缩小区域发展差异,推动了产业结构向高级化、合理化方向发展。可见,在不同的阶段,不同的产业政策会对不同地区生产结构的演化产生一定影响,甚至可能突破路径依赖,创造新的演化路径。
一个国家或地区的生产结构可以在一定程度上通过其出口产品结构来反映。随着2001年中国加入WTO,进出口贸易飞速增长,显著影响了中国生产结构的演化。Pasinetti[25]认为贸易对技术进步和区域增长有重要作用,尤其是进口产品能够刺激区域内产品生产的“学习效应”[26],对高质量进口产品的引进可以促使新市场的出现,从而导致企业增加投入转向生产新产品[27-28]。对中国生产结构的演化而言,进口能够显著弥补中国产业技术的缺乏,帮助其从国外获得物化的技术知识,得到模仿前沿技术的机会,这属于市场性溢出[29];而通过出口,中国也能够参与到全球生产网络与全球价值链中,获取技术和信息溢出从而推动产业升级[30]。因此,全球化背景下进出口贸易对中国生产结构演化的具有显著的溢出效应。目前中国出口产品结构总体趋向高级化[31],但同时也具有显著的区域差异[32]。《2012年中国对外贸易发展报告》指出,2000-2010年中国对外贸易主要集中在东部沿海地区,但随着中国经济发展步入“转型期”,东部地区出口增长逐渐放缓,其劳动密集型出口生产能力逐渐向中西部地区转移,推动中西部地区开始快速发展;而东部地区自身则向技术密集型与资本密集型转变[33]。此变化也与上述中国产业空间格局的调整相对应,体现了出口产品结构对生产结构的反映。
因此,选取2001-2013年中国31个省市产品出口贸易数据构建产品空间,通过分析技术关联和产业政策对出口产品结构演化的影响,研究中国不同区域产品结构的演化路径。本文主要回答以下3个问题:① 中国出口产品空间特征是什么,是否存在区域差异?② 技术关联是否影响中国出口产品空间演化?其影响是否存在时间差异与区域差异?③ 在出口产品的演化过程中,是否存在路径突破?本研究有助于加深对中国生产产品结构演化及其区域差异的认识,也将为演化经济地理学的演化路径研究提供新的证据。
2 中国产品空间演化及其区域差异
2.1 研究方法与数据
本文沿用Hidalgo等[9-11]的方法测算产品间技术关联,计算步骤如下:(1)计算产品显性比较优势指数(RCA):
式中:
式中:
(2)计算产品间邻近性
产品邻近性的计算主要基于条件概率,即分别计算产品i和产品j在某一地区同时具有比较优势的条件概率,并取最小值。
(3)计算出口产品的技术关联程度(或邻近程度):
出口产品技术关联度[9]衡量了各地区各出口产品与当前生产结构的邻近度。如果某地区某产品相邻的产品中具有比较优势产品数量较多,则此产品与该地区当前生产结构的邻近度较高,即出口产品的技术关联度较高。根据产品空间与比较优势演化理论,此产品未来发展为比较优势产品的可能性也较高;相反,如果与此产品相邻的产品具有比较优势的产品数量较少,则此产品的出口技术关联较低,未来发展成为具有比较优势产品的可能性也较低。
在衡量技术关联时,本文也考虑进口对出口产品结构的影响。为衡量进口的影响,这里类比式(4),计算进口产品技术关联度
2.2 中国贸易产品空间演化格局
首先,识别各省市优势产品并计算产品邻近性。邻近性通过2001-2013年数据计算所得,旨在以更大数据量拟合统一的中国贸易产品空间,并为下文区域差异的分析作基础。再分别叠加2001年和2013年的全国各产品出口总额,通过Cytoscape 3.2.1软件构建2001年与2013年的贸易产品空间。Cytoscape源于系统生物学,其通过节点(生物分子)与节点间的连线(生物分子间的相互作用)构建生物分子交互网络。类似地,这里以产品作为节点,以产品间技术关联为连线构建产品空间。为使空间图更明晰,采用“边缘加权嵌入式”算法(edge-weighted spring embedded layout),并筛除产品间邻近性(?)小于0.55的边(edge)与出口总额小于1亿美元的点(node)(图1)。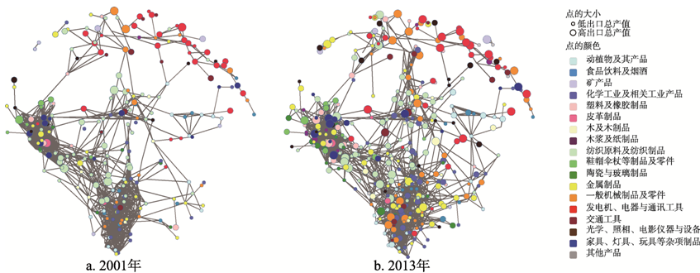 显示原图|下载原图ZIP|生成PPT
图12001年和2013年中国产品空间
-->Fig. 1China's product space in 2001 and 2013
-->
中国产品空间呈现多个集团,关联程度最高的产品位于左边的集团(图1),其主要包含了鞋帽伞杖、家具等杂项制品、皮革制品、纺织制品、塑料制品、陶瓷与玻璃制品和金属制品等,均属于劳动密集型产品。下部集团的产品关联程度也较高,其主要包含了动植物及其产品、食品饮料与烟酒、化工产品、木制品、纺织原料与制品和一般机械器具及零件(低技术),多数属于资源密集型产品,少部分为劳动密集型。而电器与通讯设备、一般机械器具及零件(高技术)、交通工具和光学仪器等产品则主要分布在产品空间的上层,属于资本与技术密集型产品。表1产品的平均复杂度与产品空间分属区域(这里统计2位数产品平均复杂度,通过对4位数产品复杂度加权出口总额,计算加权平均值。),可以发现从产品空间的下集团到上集团,主要产品的复杂度也逐渐提升,3个集团的平均复杂性依次为0.144、0.149和0.201。
Tab. 1
表1
表1中国不同产品分类的平均复杂度与产品空间分属
Tab. 1The average complexity and position in product space of different categories in China
| 名称 | 平均复杂度 | 主要分属 | 名称 | 平均复杂度 | 主要分属 |
|---|---|---|---|---|---|
| 动植物产品 | 0.115 | 下部 | 鞋帽伞杖等制品及零件 | 0.145 | 左部 |
| 食品饮料及烟酒 | 0.138 | 下部 | 陶瓷与玻璃产品 | 0.118 | 左部 |
| 矿产品 | 0.185 | 上部 | 金属制品 | 0.150 | 左部、下部 |
| 化工及相关产品 | 0.120 | 下部 | 一般机械器具及零件 | 0.194 | 下部、上部 |
| 塑料及橡胶制品 | 0.124 | 左部 | 发电机、电器与通讯工具 | 0.222 | 上部 |
| 皮具 | 0.139 | 左部 | 交通工具 | 0.181 | 上部 |
| 木与木制品 | 0.156 | 下部 | 光学、照相、电影仪器与设备 | 0.224 | 上部 |
| 木浆与纸制品 | 0.189 | 左部 | 家具、灯具、玩具等杂项制品 | 0.156 | 左部 |
| 纺织原料及纺织制品 | 0.137 | 左部、下部 |
新窗口打开
2.3 中国贸易产品空间演化的区域差异
首先,计算不同年份各省市具有比较优势的出口产品数量与平均复杂度。这里将中国31个省市划分为东部、中部、西部、东北4个区域,发现出口产品结构具有明显区域差异(图2)。2008年以前,东部地区优势产品数量具有明显的优势,2008年以后,其他3地区优势产品数量迅速增长,东部则略有下降。2008年东北成为比较优势的产品数量最多的地区。然而,东部地区的产品复杂度始终是4个地区最高的。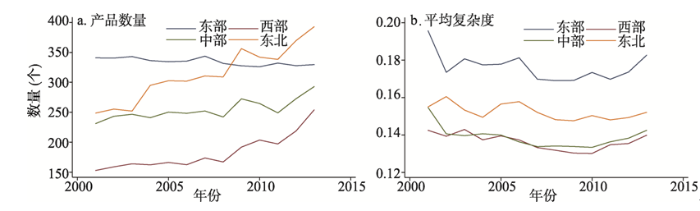 显示原图|下载原图ZIP|生成PPT
图22001-2013年中国四大区域优势出口产品
-->Fig. 2Export products with comparative advantages in four regions during 2001-2013
-->
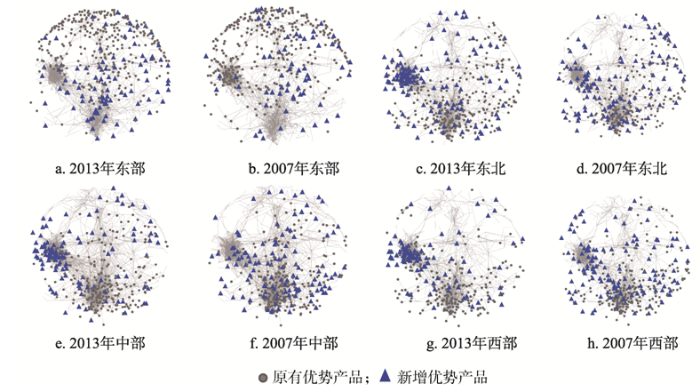
出口产品空间演化的区域差异如图3所示。东部地区优势产品主要集中在左集团与上集团;2007年,新增优势产品主要出现在上集团与下集团;到2013年,新增优势产品更加集中在上集团及延伸区,体现了贸易产品结构由劳动密集型向资本与技术密集型演化的过程。中部地区与东北地区的产品空间与演化过程较为相似,优势产品主要分布在下集团,后逐渐向左集团蔓延,到2013年形成以左集团与下集团为主的产品空间格局,体现了其由资源密集型向劳动密集型产品演化的过程;同时新增优势产品大多为技术关联较强的产品,也体现了产品空间演化的路径依赖性。西部地区的优势产品主要分布在下集团,随后新增优势产品主要出现在左集团与下集团,到2013年形成了左集团为主的产品空间格局,体现了其由资源密集型向劳动密集型转变的演化趋势。
 显示原图|下载原图ZIP|生成PPT
图32007年和2013年中国四大区域出口产品空间分布
-->Fig. 3Export product space in China's four regions in 2007 and 2013
-->
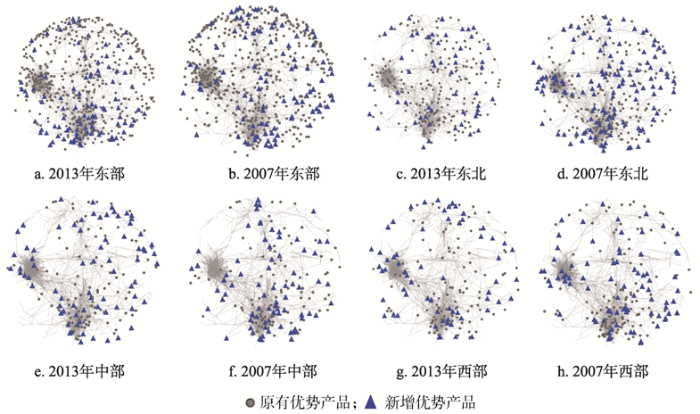
利用相同方法,绘制不同区域的进口产品空间(图4)。可以发现其与图3较为相似,但也具有一定差异:东部地区具有比较优势的进口产品在三大集团具有分布,新增具有比较优势的产品分布也较为均匀;中部地区与东北地区虽然也由下集团逐渐向左集团与上集团转变,但其向上集团转变的时间更早、数量更多;西部地区虽然也由下集团向左集团转变,但到2013年,上集团的部分进口产品已开始具有比较优势,这初步反映了进口产品对出口产品的影响。
 显示原图|下载原图ZIP|生成PPT
图42007年和2013年中国四大区域进口产品空间分布
-->Fig. 4Import product space in China's four regions in 2007 and 2013
-->
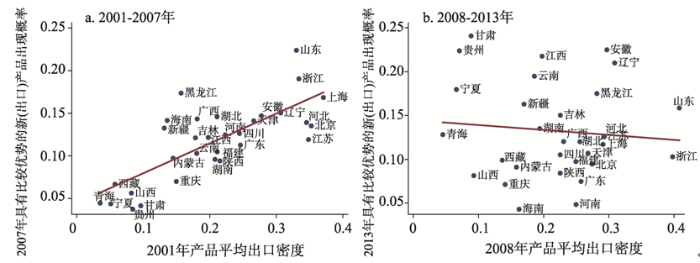
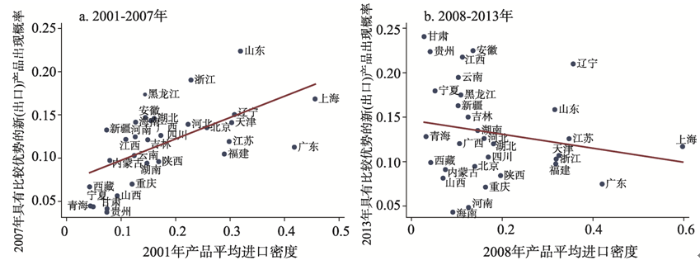
图3与图4初步反映了中国四大区域进出口产品结构的演化过程。为进一步探讨技术关联对中国不同区域出口产品结构的影响,本文利用式(6)与(7)分别计算进出口产品的技术关联度,并刻画其与未来出口产品结构的关系。图5和图6分别描绘了2001-2007与2008-2013各省进出口产品技术关联程度与出现新的具有比较优势(出口)产品概率的关系。可以发现,两阶段进出口产品技术关联的作用十分相似。2001年产品平均技术关联度与进口技术关联度越高,2007年出现具有比较优势的新(出口)产品概率也越高。“高关联—高概率”的省市主要来自东部地区,而“低关联—低概率”的省市主要位于西部地区。然而这种情况在2008-2013阶段则发生逆转,原有的正向关系消失。此结果初步反映,2001-2007年,中国出口产品结构演化更多受到技术关联的影响,遵循路径依赖的演化路径;而2008-2013年此影响开始减弱。本文认为其可能更多受到政策的影响,突破了现有的发展路径。
 显示原图|下载原图ZIP|生成PPT
图52001-2007年和2008-2013年中国出口产品平均技术关联度与出现具有比较优势新(出口)产品概率
-->Fig. 5Export products' average technological relatedness and probability of new products with comparative advantages in China during 2001-2007 and 2008-2013
-->
 显示原图|下载原图ZIP|生成PPT
图62001-2007年和2008-2013年中国进口产品平均技术关联度与出现具有比较优势新(出口)产品概率
-->Fig. 6Import products' average technological relatedness and probability of new products with comparative advantages in China during 2001-2007 and 2008-2013
-->
为了进一步探讨政策在2008-2013年对中国出口产品结构演化的影响,本文统计“十一五”规划中各地级市三位数产业政策,并按中国海关总署企业层面进出口数据库(CLFTTD)中2位数产品编码归总到省市尺度(针对98个2位数产品编码,若某省50%以上的地级市对某产品有政策支持,则政策数记为1。)(共1512条)。统计规划政策在四大区域出现的次数,选取政策数排名前八的产品(表2)。对比表2与图5中2013年中国四大区域产品空间图可以发现,二者重合度较高——东部地区政策扶持产品主要分布在产品空间的上集团与下集团;中部与东北地区政策扶持产品主要位于左集团与上集团;而西部地区政策扶持产品则主要位于产品空间的左集团与下集团。这初步反映2008-2013年段,政策对中国出口产品结构演化可能具有一定影响。
Tab. 2
表2
表2中国四大区域“十一五”产品(大类)政策
Tab. 2“Eleventh Five Year Plan” policy of China's four regions
| 东部 | 中部 | 西部 | 东北 |
|---|---|---|---|
| 化工及相关产品(53) | 化工及相关产品(42) | 金属制品(56) | 矿产品(33) |
| 金属制品(48) | 矿产品(38) | 化工及相关产品(54) | 金属制品(31) |
| 矿产品(46) | 纺织原料与制品(34) | 纺织原料与制品(53) | 化工及相关产品(29) |
| 电器与通讯工具(40) | 金属制品(30) | 动植物相关产品(40) | 交通工具(25) |
| 动植物相关产品(39) | 电器与通讯工具(28) | 食品饮料及烟酒(37) | 纺织原料与制品(23) |
| 交通工具(38) | 一般机械器具(26) | 一般机械器具(33) | 动植物相关产品(19) |
| 一般机械器具(35) | 动植物相关产品(23) | 矿产品(32) | 一般机械器具(16) |
| 纺织原料与制品(28) | 木浆与纸制品(19) | 家具等杂项制品(28) | 电器与通讯工具(13) |
新窗口打开
3 技术关联、区域产业政策与中国产品空间演化
3.1 模型与变量
为分析技术关联对不同阶段、不同区域出口产品空间演化的影响,识别其演化路径的差异,本文沿用Boschma等[34]的方法,构建如下方程:式中:
同时,由于本文发现政策在2008-2013年段对产品空间演化起到重要作用,故构建如下方程,探讨2008-2013年政策对中国产品空间演化的影响。
式中:
3.2 实证结果
通过构建2001-2007和2008-2013的混合截面数据模型,实证分析了2001-2007和2008-2013年两阶段技术关联对中国出口产品结构演化的影响。由于被解释变量为0/1变量,事件发生的概率依赖于解释变量,本研究采用Probit模型。首先令t = 2001-2004、t+k = 2004-2007(k = 3),通过各省市各产品的混合截面数据检验方程(5)。观察解释变量的皮尔森相关系数矩阵,发现出口技术关联度与进口技术关联度的相关系数较高(>0.5),而其他变量之间相关系数绝对值均在0.5以内,故将上述两变量分开进入模型。各模型Prob > chi2多数小于0.01,通过检验。pseudo R2均维持在0.33左右,具体结果如表3和4所示。Tab. 3
表3
表32001-2007中国出口产品技术关联对中国出口产品结构演化的影响
Tab. 3Impacts of technological relatedness on the evolution of export products in China during 2001-2007
| 总体 | 东部 | 中部 | 西部 | 东北 | |
|---|---|---|---|---|---|
| 原始优势 | 1.50*** | 1.51*** | 1.54*** | 1.52*** | 1.55*** |
| 出口产品技术关联ETR | 5.22*** | 4.83*** | 3.62*** | 4.27*** | 3.75*** |
| 东部×ETR | 0.02 | ||||
| 中部×ETR | 0.21*** | ||||
| 西部×ETR | 0.13*** | ||||
| 东北×ETR | 0.06** | ||||
| 产品类别 | yes | yes | yes | yes | yes |
| 区域 | yes | yes | yes | yes | yes |
| 年份 | yes | yes | yes | yes | yes |
| N | 155620 | 155620 | 155620 | 155620 | 155620 |
| 虚拟判定系数 | 0.357 | 0.355 | 0.349 | 0.352 | 0.349 |
| 对数似然函数值 | -50031 | -50143 | -50622 | -50397 | -50641 |
新窗口打开
2001-2007年,在控制2001年产品比较优势前提下,ETR的系数显著为正(表3),说明2007年新增比较优势产品大多出现在与2001年出口优势产品相近的产品中。此结果与Poncet[17]的研究一致,验证了技术关联对中国出口产品结构演化的影响。东部模型中,ETR的系数显著为正,然而ETR与区域交叉变量的系数较小,且不显著,这说明相比其他地区,东部地区出口产品结构演化受到技术关联的影响较弱。Boschma等[34]从“能力”的角度解释产品空间演化,认为一个国家或地区具有普遍作用于当地所有产品的一般性能力,如促进或阻碍企业发展与衍生、市场作用的制度条件等。具有较高一般性能力的国家或地区,企业间能够更好地进行交流与联系促进知识溢出,故其发展受产品特定能力的影响相对较小,更容易跳到距离较远的新产品,从而减弱产品技术关联的影响;而制度条件较差的国家或地区则只能依靠技术关联实现演化。此解释正好呼应了图3所展示的结论,即新增优势产品主要出现在上集团与下集团,而非原有具有较强技术关联的左集团。此外,中部、西部与东北模型中,ETR的系数都显著为正,且中部与西部交叉变量也显著为正,说明这三大区域与总体趋势相符,技术关联影响显著,遵循路径依赖的演化路径。
2001-2007年,在控制2001年产品比较优势的前提下,ITR的系数显著为正(表4),说明2007年出口新增比较优势产品大多出现在与2001年进口优势产品相近的产品中。这体现了出口产品从进口产品中学习与转化的效应,类似的结果在欧洲出口产品研究中得到验证[34]。在分区域模型中,四大区域ITR的系数都显著为正,然而东部与东北模型中的ITR与区域交叉变量显著为负,中部与西部的交叉变量显著为正,说明中部、西部比东部、东北地区更能从进口产品中学习与转化。
Tab. 4
表4
表42001-2007中国进口产品技术关联对中国出口产品结构演化的影响
Tab. 4Impacts of technological relatedness on the evolution of export products in China during 2001-2007
| 总体 | 东部 | 中部 | 西部 | 东北 | |
|---|---|---|---|---|---|
| 原始优势 | 1.77*** | 1.77*** | 1.77*** | 1.76*** | 1.77*** |
| 进口产品技术关联ITR | 1.51*** | 2.62*** | 1.43*** | 0.94*** | 1.41*** |
| 东部×ITR | -0.19*** | ||||
| 中部×ITR | 0.22*** | ||||
| 西部×ITR | 0.30*** | ||||
| 东北×ITR | -0.05 *** | ||||
| 产品类别 | yes | yes | yes | yes | yes |
| 区域 | yes | yes | yes | yes | yes |
| 年份 | yes | yes | yes | yes | yes |
| N | 155620 | 155620 | 155620 | 155620 | 155620 |
| 虚拟判定系数 | 0.314 | 0.315 | 0.314 | 0.315 | 0.314 |
| 对数似然函数值 | -53330 | -53290 | -53377 | -53250 | -53392 |
新窗口打开
依据同样方法,再令t = 2008-2010、t+k = 2011-2013(k = 3)构建各省市各产品的混合截面模型。表5显示了2008-2013年段出口产品技术关联对中国出口产品结构演化的影响。总体来看,在控制2008年产品比较优势的前提下,ETR变量的系数显著为正,说明2013年新增比较优势产品出现在与2008年优势产品相近的产品中。而分区域来看,这一阶段则出现了与上一阶段相反的结果:东部模型的ETR与区域交叉变量显著变为正,说明其演化受到强烈的技术关联影响;而西部模型的ETR与区域交叉变量显著为负,说明此阶段技术关联对其演化的影响较弱。其实,西部模型的结果从描述性分析中已初见端倪:图3中2008-2013年段西部地区产品空间图显示,具有比较优势的出口产品完全从原有下集团消失,转而更多的分布在左集团;图5显示西部省市多位于“低关联—高概率”区域也验证了技术关联影响逐渐弱化的趋势。表6为2008-2013年,进口产品技术关联对中国出口产品结构演化的影响。总体来看,在控制2008年产品比较优势的前提下,ITR变量的系数显著为正,说明2013年出口新增比较优势产品出现在与2008年进口优势产品相近的产品中。然而,此阶段ITR变量的系数较上阶段明显变小,说明2008-2013年段出口产品从进口产品中学习与转化的效应减弱。从分模型来看,与表5类似,西部模型的ITR与区域交叉变量也显著为负,说明此阶段西部地区的出口产品结构已很难学习与转化进口产品的知识等。
Tab. 5
表5
表52008-2013中国出口产品技术关联对中国出口产品演化的影响
Tab. 5Impacts of technological relatedness on the evolution of export products in China during 2008-2013
| 总体 | 东部 | 中部 | 西部 | 东北 | |
|---|---|---|---|---|---|
| 原始优势 | 1.60*** | 1.61*** | 1.63*** | 1.60*** | 1.63*** |
| 出口产品技术关联ETR | 3.33*** | 1.94*** | 2.43*** | 5.05*** | 2.46*** |
| 东部×ETR | 0.41*** | ||||
| 中部×ED | 0.19*** | ||||
| 西部×ETR | -0.43*** | ||||
| 东北×ETR | 0.28*** | ||||
| 产品类别 | yes | yes | yes | yes | yes |
| 区域 | yes | yes | yes | yes | yes |
| 年份 | yes | yes | yes | yes | yes |
| N | 116715 | 116715 | 116715 | 116715 | 116715 |
| 虚拟判定系数 | 0.337 | 0.343 | 0.335 | 0.347 | 0.335 |
| 对数似然函数值 | -41144 | -40747 | -41303 | -40540 | -41292 |
新窗口打开
Tab. 6
表6
表62008-2013中国进口产品技术关联对中国出口产品演化的影响
Tab. 6Impacts of technological relatedness on the evolution of export products in China during 2008-2013
| 总体 | 东部 | 中部 | 西部 | 东北 | |
|---|---|---|---|---|---|
| 原始优势 | 1.84*** | 1.84*** | 1.84*** | 1.85*** | 1.84*** |
| 产品进口技术关联ITR | 0.55*** | 0.62*** | 0.47** | 0.58*** | 0.47*** |
| 东部×ITR | 0.01 | ||||
| 中部×ITR | 0.16*** | ||||
| 西部×ITR | -0.21*** | ||||
| 东北×ITR | 0.04* | ||||
| 产品类别 | yes | yes | yes | yes | yes |
| 区域 | yes | yes | yes | yes | yes |
| 年份 | yes | yes | yes | yes | yes |
| N | 116715 | 116715 | 116715 | 116715 | 116715 |
| 虚拟判定系数 | 0.317 | 0.316 | 0.316 | 0.317 | 0.317 |
| 对数似然函数值 | -42421 | -42460 | -42461 | -42418 | -42420 |
新窗口打开
据此,本文认为西部地区的出口结构演化可能更多地受到政策因素的影响。本文进而令t = 2008、t+k = 2013,构建各省市各产品的截面数据模型验证方程(6)。表7模型结果显示,在控制2008年产品比较优势的前提下,政策变量显著为正,可见2008-2013年间中国出口产品结构的演化也受到政策的影响,这与Fleisher[24]、魏也华[35]等关于政策导致区域不平衡的研究结论相似。结合技术关联来看,这主要是因为中国政策的制定在很大程度上会基于现有的生产结构。而从分区域来看,只有西部模型的政策与区域交叉变量显著为正,说明西部地区出口产品结构的演化比其他三个地区更多受到了政策推动的影响。这也较好地解释了2008-2013年段西部地区技术关联的影响较弱的结论,揭示了其路径突破的演化过程。
Tab. 7
表7
表72008-2013年中国区域产业政策对中国出口产品演化的影响
Tab. 7Impacts of regional industry policy on the evolution of export products in China during 2008-2013
| 总体 | 东部 | 中部 | 西部 | 东北 | |
|---|---|---|---|---|---|
| 原始优势 | 1.11*** | 1.07*** | 0.96*** | 0.85*** | 0.91*** |
| 政策 | 2.43*** | 2.66*** | 2.53*** | 2.82*** | 2.68*** |
| 东部×政策 | -0.48*** | ||||
| 中部×政策 | 0.03 | ||||
| 西部×政策 | 0.33*** | ||||
| 东北×政策 | -0.37*** | ||||
| 产品类别 | yes | yes | yes | yes | yes |
| 区域 | yes | yes | yes | yes | yes |
| N | 38905 | 38905 | 38905 | 38905 | 38905 |
| 虚拟判定系数 | 0.315 | 0.325 | 0.310 | 0.315 | 0.315 |
| 对数似然函数值. | -14631 | -14422 | -14745 | -14625 | -14631 |
新窗口打开
4 结论与讨论
地区经济发展与生产结构并非一成不变,不同地区的生产结构演化过程也各具差异。自从Hidalgo等[9]提出“产品空间”概念描绘产品结构的演化以来,演化经济地理****利用各国产业与出口数据,检验技术关联对其演化的影响。多数结果显示,地区经济发展与生产结构的演化受到技术关联的影响,沿着与现有生产结构相近的道路发展,体现了路径依赖的过程;然而也有少量研究发现,并非所有生产结构演化都遵循路径依赖,政策等因素也可能导致路径突破的演化过程。为同时检验技术关联与政策因素对生产结构演化的影响,本文探讨2001-2013年中国出口产品结构演化的路径及其区域差异。结果显示:① 2001-2013年,中国出口产品经历了较为明显的结构转型。东部地区由劳动密集型向资本与技术密集型转变,西部地区由资源密集型向劳动密集型转变,中部与东北地区则由资源密集型向劳动密集型,继而向资本与技术密集型转变。② 2001-2007年,中国四大区域的出口产品结构演化主要受到技术关联的影响,体现路径依赖的过程;东部地区受技术关联的影响较弱,主要是因为其制度条件较好,产品发展受其特定能力的影响相对较小,从而削弱了技术关联的作用。③ 2008-2013年,中国东部、中部与东北地区的出口产品结构演化仍主要受到技术关联的影响,而西部地区则更多地受到政策因素的推动,体现了路径突破的演化过程。
近年来中国经济的飞速发展与区域间严重不平衡使其在不同阶段、不同区域可能遵循着截然不同的生产结构演化路径,而本研究结果也表明,技术关联与产业政策分别作用于中国发展阶段下的不同的区域,揭示了路径依赖与路径突破的差异化演化过程。此结果既丰富了演化经济地理学对中国的相关研究,也为其路径研究提供了新的证据。同时,本文也对“稳发展、调结构、促转型”背景下,中国生产结构应如何转型具有指导意义。由于一个国家或地区只能基于现有产品进行多样化发展[36],因此技术关联对生产结构的演化具有推动作用,位于“核心区”的国家或地区有更充足的能力运用与现有产品间的联系,发展新的产品,推动生产结构的转变。然而技术关联的影响也导致了“弱者恒弱”的现象,即位于产品空间“边缘区”的落后地区很难实现结构转变。如中国西部地区常年发展落后,为帮助其实现结构转型,中国2000年实施“西部大开发”战略,给予大力政策支持,使其经济发展与产业结构在十余年间发生巨大改变,这也与本文中实现路径突破的分析相呼应。如今在“新常态”的发展背景下,如何更好地促进地区结构转型成为关注焦点,这需要更为具体而有针对性的政策支持。国家与地方政府应基于当地产业基础,制定相应优惠政策,引导产品空间中技术关联强的产业联动发展,发挥路径依赖对生产结构演化的作用;对于落后地区,则可通过制定强有力的产业政策,迅速帮助其跳到产品空间“核心区”,即实现路径突破。
The authors have declared that no competing interests exist.
参考文献 原文顺序
文献年度倒序
文中引用次数倒序
被引期刊影响因子
| [1] | |
| [2] | . |
| [3] | |
| [4] | . |
| [5] | . Following last decade脮s programmatic papers on Evolutionary Economic Geography, we report on recent empirical advances and how this empirical work can be positioned vis-藛-vis other strands of research in economic geography. First, we review studies on the path dependent nature of clustering, and how the evolutionary perspective relates to that of New Economic Geography. Second, we discuss research on agglomeration externalities in Regional Science, and how Evolutionary Economic Geography contributed to this literature with the concepts of cognitive proximity and related variety. Third, we go into the role of institutions in Evolutionary Economic Geography, and we relate this to the way Institutional Economic Geography tends to view institutions. From this discussion, a number of new research challenges are derived. |
| [6] | . Frenken K., Van Oort F. and Verburg T. (2007) Related variety, unrelated variety and regional economic growth, Regional Studies 41, 685-697. In economic theory, one can distinguish between variety as a source of regional knowledge spillovers, called Jacobs externalities, and variety as a portfolio protecting a region from external shocks. It is argued that Jacobs externalities are best measured by related variety (within sectors), while the portfolio argument is better captured by unrelated variety (between sectors). A methodology based on entropy measures is introduced to compute related variety and unrelated variety. Using data at the NUTS 3 level in the Netherlands for 1996-2002, it was found that Jacobs externalities enhance employment growth, while unrelated variety dampens unemployment growth. Productivity growth can be explained by traditional determinants including investments and research and development expenditures. Implications for regional policy follow. Frenken K., Van Oort F. et Verburg T. (2007) La variete connexe, la variete sans rapport et la croissance economique regionale., Regional Studies 41, 685-697. Dans la theorie economique, on peut distinguer entre la variete comme la source des retombees de connaissance regionales, dites les effets externes de Jacob, et la variete comme un portefeuille qui protege la region des chocs externes. On affirme que l'on peut mieux mesurer les effets externes de Jacob a partir de la notion de variete connexe (au sein des secteurs), tandis que l'argument qui prone plutot la notion de portefeuille est mieux saisi par la notion de variete sans rapport (entre les secteurs). On presente une methodologie fondee sur des mesures d'entropie afin d'estimer la variete connexe et la variete sans rapport. A partir des donnees au niveau NUTS 3 aupres des Pays-Bas pour la periode de 1996 a 2002, on trouve que les effets externes de Jacob augmentent la croissance de l'emploi, alors que la variete sans rapport attenue la croissance du chomage. La croissance de la productivite s'explique par des determinants traditionnels, y compris l'investissement et les depenses de recherche-developpement. Il s'ensuit les implications pour la politique regionale. Variete Croissance; Effets externes de Jacob; Economies d'agglomeration; Retombees Entropie Frenken K., Van Oort F. und Verburg T. (2007) Zusammenhangende Vielfalt, nicht zusammenhangende Vielfalt und regionales Wirtschaftswachstum, Regional Studies 41, 685-697. In der Wirtschaftstheorie unterscheidet man zwischen der Vielfalt als Quelle regionaler Wissensubertragung (den so genannten Jacobs-Externalitaten) und der Vielfalt als Portfolio zum Schutz einer Region vor externen Erschutterungen. Wir stellen die These auf, dass sich die Jacobs-Externalitaten am besten anhand der zusammenhangenden Vielfalt (innerhalb von Sektoren) messen lassen, wahrend sich das Portfolio-Argument besser durch nicht zusammenhangende Vielfalt (zwischen verschiedenen Sektoren) darstellen lasst. Mit Hilfe einer Methodologie auf der Grundlage entropischer Messungen ermitteln wir zusammenhangende Vielfalt und nicht zusammenhangende Vielfalt. Anhand von Daten auf dem NUTS 3-Niveau in den Niederlanden fur den Zeitraum von 1996 bis 2002 stellen wir fest, dass die Jacobs-Externalitaten zu einem Anstieg des Beschaftigungsniveaus fuhren, wahrend nicht zusammenhangende Vielfalt den Anstieg der Arbeitslosigkeit dampft. Der Anstieg der Produktivitat lasst sich durch traditionelle Determinanten wie Investitionen und Ausgaben fur F&E erklaren. Im Anschluss werden die Konsequenzen fur die Regionalpolitik beschrieben. Vielfalt; Wachstum; Jacobs-Externalitaten; Agglomerationswirtschaften; U锟絙ertragung; Entropie; Frenken K., Van Oort F. y Verburg T. (2007) Variedad relacionada, variedad no relacionada y el crecimiento economico regional, Regional Studies 41, 685-697. En la teoria economica, podemos distinguir entre la variedad como una fuente de desbordamientos de conocimiento regionales, llamados externalidades Jacobs, y la variedad como una cartera que protege una region de choques externos. Sostenemos que las externalidades Jacobs se miden mejor segun la variedad relacionada (dentro de los sectores), mientras que el argumento de la cartera se capta mejor con una variedad no relacionada (entre sectores). Para calcular la variedad relacionada y la variedad no relacionada, introducimos una metodologia basada en las medidas de entropia. Usando datos en el nivel NUTS 3 en los Paises Bajos para el periodo 1996-2002, observamos que las externalidades Jacobs aumentan el crecimiento de empleo mientras que la variedad no relacionada desestimula el crecimiento de desempleo. El crecimiento de productividad puede explicarse mediante determinantes tradicionales incluyendo las inversiones y los gastos en I + D. Tambien explicamos las implicaciones para la politica regional. Variedad; Crecimiento; Externalidades Jacobs; Economias de aglomeracion; Desbordamiento; Entropia |
| [7] | . This article presents estimates of the impact of regional variety and trade linkages on regional economic growth by means of export and import data by Italian province (NUTS 3) and sector (three-digit) for the period 1995-2003. Our results show strong evidence that related variety contributes to regional economic growth. Thus, Italian regions that are well endowed with sectors that are complementary in terms of competences (i.e., that show related variety) perform better. The article also assesses the effects of the breadth and relatedness of international trade linkages on regional growth, since they may bring new and related variety to a region. Our analysis demonstrates that regional growth is not affected by simply being well connected to the outside world or having a high variety of knowledge flowing into the region. Rather, we found evidence of related extraregional knowledge sparking intersectoral learning across regions. When the cognitive proximity between the extraregional knowledge and the knowledge base of a region is neither too small nor too large, real learning opportunities are present, and the external knowledge contributes to growth in regional employment. Copyright (c) 2009 Clark University. |
| [8] | . The question of how new regional growth paths emerge has been raised by many leading economic geographers. From an evolutionary perspective, there are strong reasons to believe that regions are most likely to branch into industries that are technologically related to the preexisting industries in the regions. Using a new indicator of technological relatedness between manufacturing industries, we analyzed the economic evolution of 70 Swedish regions from 1969 to 2002 with detailed plant-level data. Our analyses show that the long-term evolution of the economic landscape in Sweden is subject to strong path dependencies. Industries that were technologically related to the preexisting industries in a region had a higher probability of entering that region than did industries that were technologically unrelated to the region's preexisting industries. These industries had a higher probability of exiting that region. Moreover, the industrial profiles of Swedish regions showed a high degree of technological cohesion. Despite substantial structural change, this cohesion was persistent over time. Our methodology also proved useful when we focused on the economic evolution of one particular region. Our analysis indicates that the Linkoping region increased its industrial cohesion over 30 years because of the entry of industries that were closely related to its regional portfolio and the exit of industries that were technologically peripheral. In summary, we found systematic evidence that the rise and fall of industries is strongly conditioned by industrial relatedness at the regional level. |
| [9] | . Economies grow by upgrading the products they produce and export. The technology, capital, institutions, and skills needed to make newer products are more easily adapted from some products than from others. Here, we study this network of relatedness between products, or "product space," finding that more-sophisticated products are located in a densely connected core whereas less-sophisticated products occupy a less-connected periphery. Empirically, countries move through the product space by developing goods close to those they currently produce. Most countries can reach the core only by traversing empirically infrequent distances, which may help explain why poor countries have trouble developing more competitive exports and fail to converge to the income levels of rich countries. |
| [10] | |
| [11] | . For Adam Smith, wealth was related to the division of labor. As people and firms specialize in different activities, economic efficiency increases, suggesting that development is associated with an increase in the number of individual activities and with the complexity that emerges from the interactions between them. Here we develop a view of economic growth and development that gives a central role to the complexity of a country's economy by interpreting trade data as a bipartite network in which countries are connected to the products they export, and show that it is possible to quantify the complexity of a country's economy by characterizing the structure of this network. Furthermore, we show that the measures of complexity we derive are correlated with a country's level of income, and that deviations from this relationship are predictive of future growth. This suggests that countries tend to converge to the level of income dictated by the complexity of their productive structures, indicating that development efforts should focus on generating the conditions that would allow complexity to emerge to generate sustained growth and prosperity. |
| [12] | |
| [13] | . 'Inclusive Growth, Full Employment, and Structural Change: Implications and Policies for Developing Asia' discusses policies to achieve inclusive growth in developing Asia, including those relating to agriculture, investment,... |
| [14] | . The accumulation of knowledge is a key driver of technological change and economic growth. Significant attention has been directed to the processes of knowledge production in a spatial context, but little attention has been given to the type of knowledge produced within specific places. The objectives of the present study are to map the US technology/knowledge space, to examine the evolution of that space over the time period 1975-2005, and to investigate the character of knowledge cores within US cities. The knowledge space is based on the proximity of technology classes, utilizing measures derived from co-classification information contained in patent documents. Results show that over time, patents increasingly cluster within technology classes that are located close to one another in technology space. They also reveal considerable heterogeneity in measures of technological specialization across US metropolitan areas. In general, smaller cities tend to display higher levels of knowledge relatedness, often because invention is controlled by a small number of firms with a limited range of technological know-how. Larger cities generate knowledge that is more broadly dispersed across the US knowledge space. Some cities maintain their technological coherence over time, the technological trajectories of others fracture and dissipate, while yet in other cities new technology cores emerge and develop. Higher levels of technological relatedness (specialization) in cities are linked to faster rates of knowledge production and to distinctive trajectories of knowledge evolution. |
| [15] | . Rapid and sustained economic growth in the emerging world has brought new members, notably China, into the group of middle-income countries. Reaching this level of income, however, has historically presented countries with a new set of challenges to development, resulting in slowing growth and an entrapment in what is known as the middle-income trap. Limited income convergence in Latin America has at least partly been due to its reduced capacity to engage in a structural transformation conducive to higher productivity. In contrast, emerging Asia offers a few examples of these 65virtuous. productive transformations. With these two references in mind, we build a comparative analysis based on the following points: First, we illustrate differences in the process of structural transformation, both with regard to sector productivity and employment absorption. Second, we adopt the Product Space methodology to compare the structural transformation that took place in both regions. Finally, we consider the role played by Productive Development Policies (PDP) in shaping the process of structural transformation, through a comparative review of these policies in Korea, Brazil and Mexico. In short, the analysis allows us to gauge the role that the economic specialisation of a country plays in facilitating transitions to more advanced stages of economic development. La croissance rapide et soutenue dans les économies émergentes a fait rentrer des nouveaux membres, dont la Chine, dans le groupe des pays à revenu intermédiaire. Cependant, atteindre ce niveau de revenu, a historiquement supposé pour ces pays de faire face à de nouveaux défis pour le développement, entra06nant un ralentissement de la croissance et une situation de stagnation connue sous le nom de piège des revenus intermédiaires. La convergence toutefois limitée de l’Amérique latine est en partie expliquée par sa capacité réduite à s’engager dans des transformations structurelles vers une productivité plus élevée. En revanche, l’Asie émergente nous présente des exemples de ces vertueuses transformations productives. Tenant compte de ces deux différences, nous élaborons une analyse comparative basée sur les dimensions suivantes : D’abord, nous illustrons des différences dans le processus de transformation structurelle, à la fois par rapport à la productivité sectorielle et la relocalisation d’emplois. Par la suite, nous adoptons la méthodologie de Product Space pour comparer la transformation structurelle qui a eu lieu dans les deux régions. Finalement, nous considérons le r00le des politiques de développement productives (PDP) pour déterminer le processus de transformation structurel, à travers une révision comparative de ces politiques en Corée, au Brésil et au Mexique. En somme, l’analyse permet d’évaluer le r00le que la spécialisation économique d’un pays peut jouer pour faciliter la transition vers des phases de développement économique plus avancées. |
| [16] | |
| [17] | |
| [18] | . , Classification Numbers: L10, L20, L60, O18. 5 figures, 5 tables, 50 references. |
| [19] | . |
| [20] | . Based on the micro level data, this paper examined the spatial changes of Chinese manufacturing industries during 2002鈥2007. Liberalized and globalized industries are largely concentrated in the coastal region while low technology, resource-based and protected industries are widely dispersed in the inland regions. Some labor-intensive industries in the coastal region encountered congestion effects and are relocated to the central region. Statistical results indicate that industrial enterprises have significantly benefited from the geographical proximity of related enterprises. The agglomeration effects however differ across regions and sectors. The coastal region enjoys both localization and urbanization economies. The western region has no significant localization economies while the central region has no evidence of urbanization economies. The Capital Region enjoys urbanization economies to a certain degree. Both the Yangtze River Delta and the Pearl River Delta have the benefits of agglomeration. The further agglomeration in the PRD however would generate congestion effects. Although labor-intensive industries gain from agglomeration effects they are more likely to suffer from the congestion effects of related enterprises. The empirical findings indicate that agglomeration effects are not pervasive in transitional economies like China. Industrial agglomeration would contribute to productivity improvement only in a globalized and liberalized environment. |
| [21] | |
| [22] | . . |
| [23] | . . |
| [24] | . We show how regional growth patterns in China depend on regional differences in physical, human, and infrastructure capital as well as on differences in foreign direct investment (FDI) flows. We also evaluate the impact of market reforms, especially the reforms that followed Deng Xiaoping's 鈥淪outh Trip鈥 in 1992 those that resulted from serious hardening of budget constraints of state enterprises around 1997. We find that FDI had a much larger effect on TFP growth before 1994 than after, and we attribute this to the encouragement of and increasing success of private and quasi-private enterprises. We find that human capital positively affects output and productivity growth in our cross-provincial study. Moreover, we find both direct and indirect effects of human capital on TFP growth. These impacts of education are more consistent than those found in cross-national studies. The direct effect is hypothesized to come from domestic innovation activities, while the indirect impact is a spillover effect of human capital on TFP growth. We conduct cost-benefit analysis of hypothetical investments in human capital and infrastructure. We find that, while investment in infrastructure generates higher returns in the developed, eastern regions than in the interior, investing in human capital generates slightly higher or comparable returns in the interior regions. We conclude that human capital investment in less-developed areas is justified on efficiency grounds and because it contributes to a reduction in regional inequality. |
| [25] | . |
| [26] | . This paper reviews the recent theoretical literature on heterogeneous firms and trade, which emphasizes firm selection into international markets and reallocations of resources across firms. We discuss the empirical challenges that motivated this research and its relationship to traditional trade theories. We examine the implications of firm heterogeneity for comparative advantage, market size, aggregate trade, the welfare gains from trade, and the relationship between trade and income distribution. While a number of studies examine the endogenous response of firm productivity to trade liberalization, modeling internal firm organization and the origins of firm heterogeneity remain interesting areas of ongoing research. |
| [27] | |
| [28] | . . |
| [29] | . |
| [30] | . 全球领先企业的权力集中化和生 产的片断化导致价值分配的非均衡,并进一步加剧了全球生产网络中权力结构的不对称。本文提出全球价值链上的权力是一种建立在战略资源基础上的不对称的话语 权,并归纳了八种基本的市场权力形式。通过对全球十大工业制成品及服务业的市场份额分析,发现技术能力和品牌能力是全球领先企业市场权力集中的主要根源, 也是决定全球价值链上价值分配的决定性因素。嵌入全球价值链有利于发展中国家的本土企业迅速提高生产能力、接近全球市场和技术通道,但是从生产能力到创新 能力的升级过程并非自动发生;全球价值链生产片断化带来创新过程的垂直分离和重新整合,发展中国家产业升级的关键在于本土企业的吸收能力和学习速度。 . 全球领先企业的权力集中化和生 产的片断化导致价值分配的非均衡,并进一步加剧了全球生产网络中权力结构的不对称。本文提出全球价值链上的权力是一种建立在战略资源基础上的不对称的话语 权,并归纳了八种基本的市场权力形式。通过对全球十大工业制成品及服务业的市场份额分析,发现技术能力和品牌能力是全球领先企业市场权力集中的主要根源, 也是决定全球价值链上价值分配的决定性因素。嵌入全球价值链有利于发展中国家的本土企业迅速提高生产能力、接近全球市场和技术通道,但是从生产能力到创新 能力的升级过程并非自动发生;全球价值链生产片断化带来创新过程的垂直分离和重新整合,发展中国家产业升级的关键在于本土企业的吸收能力和学习速度。 |
| [31] | |
| [32] | . . |
| [33] | |
| [34] | |
| [35] | . |
| [36] | . Much of the analysis of economic growth has focused on the study of aggregate output. Here, we deviate from this tradition and look instead at the structure of output embodied in the network connecting countries to the products that they export. We characterize this network using four structural features: the negative relationship between the diversification of a country and the average ubiquity of its exports, and the non-normal distributions for product ubiquity, country diversification and product co-export. We model the structure of the network by assuming that products require a large number of non-tradable inputs, or capabilities, and that countries differ in the completeness of the set of capabilities they have. We solve the model assuming that the probability that a country has a capability and that a product requires a capability are constant and calibrate it to the data to find that it accounts well for all of the network features except for the heterogeneity in the distribution of country diversification. In the light of the model, this is evidence of a large heterogeneity in the distribution of capabilities across countries. Finally, we show that the model implies that the increase in diversification that is expected from the accumulation of a small number of capabilities is small for countries that have a few of them and large for those with many. This implies that the forces that help drive divergence in product diversity increase with the complexity of the global economy when capabilities travel poorly. |
