 , 傅伯杰
, 傅伯杰The using of composite indicators to assess the conservational effectiveness of ecosystem services in China
ZHANGLiwei, FUBojie收稿日期:2015-10-14
修回日期:2015-12-30
网络出版日期:2016-05-25
版权声明:2016《地理学报》编辑部本文是开放获取期刊文献,在以下情况下可以自由使用:学术研究、学术交流、科研教学等,但不允许用于商业目的.
基金资助:
作者简介:
-->
展开
摘要
关键词:
Abstract
Keywords:
-->0
PDF (3770KB)元数据多维度评价相关文章收藏文章
本文引用格式导出EndNoteRisBibtex收藏本文-->
生态系统服务是人类从生态系统获得的惠益,包括可以直接影响人类生活的供给、调节和文化服务,以及维持这3种服务所必需的支持服务4种类型[1-2]。它是将生态系统与人类福祉联系起来的重要纽带,是近年来生态学研究新的热点领域和学术前沿,受到了全球众多国家与研究组织的关注[2-6]。特别是在生态系统评估、生态保护与恢复、土地利用管理以及相关决策制定的过程中,生态系统服务概念越来越受到众多****的重视[2, 7-12]。由于人类活动强度的逐渐增加,由此产生的自然环境变化使得许多物种濒临灭绝[13]。同时,这些生物多样性的逐渐丧失,威胁着人类从生态系统中持续获得各种惠益——生态系统服务[14]。尽管在传统上生态学家们一直期望通过保护栖息地和濒临灭绝的物种来保护生物多样性的努力收到了一定的效果[14-16],但是持续高速率的物种栖息地的退化与丧失说明了这种观点的局限性[2, 13, 17-18]。近年来,将生态系统服务的保护纳入生态保护研究中的观点逐渐成为保护生态学研究的重要议题[2, 19-24]。Goldman等[21]认为,在传统以保护区为基础的自然保护基础上需要进一步整合人类的需求和其他景观类型,而要实现这一转变就需要关注生态系统服务的保护。Turner等[25]的分析表明,全球尺度上的各种生物多样性保护优先区在生态系统服务价值的表征上具有非均衡性,区域差异显著,因而有必要根据生物多样性优先级和生态系统服务价值的相关性采取更有针对性的区域化保护策略。从欧洲的情况看,对10项生态系统服务提供和3项生物多样性指标的定量评估表明,生物多样性指标与生态系统服务提供能力呈正相关关系,但这种关系受生态系统服务空间权衡的影响,而粮食生产与调节服务之间的权衡最为突出;保护状况良好的生境生物多样性丰富并且在调节和文化服务方面有更高的供给潜力[26]。Chan等[27]而在加拿大不列颠哥伦比亚中部的研究表明,将生态系统服务纳入到生态保护规划中更能达到生态保护的低成本与高效益目标。Polasky等[23]的研究表明,通过增加生态系统服务提供能力的努力能同时增强对生物多样性的保护,反之亦然。尽管,考虑生态系统服务的系统性保护策略将会使传统的基于生物多样性的保护从理论上更加完备、实践上更为高效[24],但将生态系统服务纳入生态保护的目标和约束体系的研究尽管刚刚起步,对其深入研究有助于将生态系统和人类福祉协同发展的综合视角引入到自然保护领域,促进生态保护理论、方法和应用的发展与完善。
生态系统服务空间制图是将生态系统服务概念纳入到实际的生态保护决策与实施过程中的关键环节,其着眼于特定时空尺度的生态系统服务的结构特征、分布格局及其相互关系的刻画,能为参与决策制定者提供空间信息明确的生态系统服务时空变化特征[7, 28-30]。生态系统服务提供能力的空间变化制图是将利益相关者、决策者以及科研人员之间相互交流的重要工具和手段,使得这些决策参与者能有效地认知与权衡研究区域高价值生态系统服务提供区域的分布,从而辅助识别生态系统服务保护的优先区域[11, 19, 31]。尽管生态系统服务的制图过程与结果对决策过程有着重要作用,它同时也面临着重大的挑战,例如,制图方法的可靠性与准确性、制图数据的可得性与精确性影响着制图结果在实际应用过程中辅助作用的发挥[31-34]。生态系统服务制图结果在决策制定过程中的有效性依赖于制图模型的选择与数据源的可得性和精确性[32, 35-36]。在本地尺度上,用于生态系统服务制图的数据多源自对研究区域的实地调查采样;这种方式只能对有限的时间空间内少量的几种生态系统服务类型的时空变化特征进行精确的刻画;在区域或者更大空间尺度上,许多并非来自实地采样与大量验证的二手数据被广泛用来制图模拟更多的生态系统服务类型,例如遥感数据、地形数据、社会统计与经济数据等[31-33]。目前,源于遥感的各种数据在大尺度生态系统服务评估中扮演着越来越重要的角色。这些被用来进行生态系统服务制图的遥感数据可以分为两种类型:第一种是解译遥感图像得到土地利用分类数据,通过对不同的土地利用类型进行生态系统服务价值赋值,从而粗略地评价大尺度的生态系统服务价值[37-40];第二种是直接用与生态系统服务相关的植被指数直接地或者间接地建立制图模型进行生态系统服务评估,例如,叶面积指数、归一化植被指数以及模型计算得到的植被净初级生产力数据等[40-44]通过遥感数据进行生态系统服务空间制图评估有着高效、低成本以及适于长期对大尺度区域进行监测的优点。
通过对国内外生态系统及其服务保护评估研究的进展与比较不难看出,考虑生态系统服务的系统保护规划已经成为国际上生态保护领域新的热点研究方向,国内在上述方向上已经有了一些工作基础,但是定量化水平还有待提高。因此,基于中国自然和社会经济环境的自身特点与需求,在生态系统及其服务保护方面着力发展新的、具有广泛适用性的制图评估方法,无论是为了满足国家生态保护建设需求,还是在推动中国保护生态学的发展方面都有着重要的意义。本文应用适合在大尺度上长期快速评估与监测应用的生态系统服务评估的方法,评估了中国从2000-2010年间的生态系统服务时空变化特征以及其驱动因素,并在分析目前中国生态系统服务保护现状与代表性的基础上提出了适用于中国国家尺度上的生态系统服务保护空间优先性范围。
1 研究区概况
中国位于亚洲东部,国土面积约为960×104 km2,总人口在2014年达到13.6亿人。由于国土范围广袤,整个国家跨越了多个气候带,海拔变化以及植被类型的差异十分巨大[45-48]。目前,中国已经有明确政策或法律依据的国家尺度上的保护地和生态功能区主要包括:① 自然保护区(《全国主体功能区规划》(2011年6月)也称为禁止开发区),占到国土面积的8.95%;②《全国生态功能区划》(2008年7月)所确定的50个重要生态功能区,占到国土面积的24.94%;③《全国主体功能区规划》所确定的25个重点生态功能区,占到国土面积的28.38%;④《中华人民共和国国民经济和社会发展第十二个五年规划纲要》所确定的“两屏三带”生态安全战略格局,其包括的相关县区范围总和占国土面积的37.43%;⑤ 2000年10月国家正式启动的天然林资源保护工程,占国土面积的34.43%;⑥ 1978年11月25日,国务院以国发(1978)244号文件批准国家林业总局《关于在西北、华北、东北风沙危害和水土流失重点地区建设大型防护林的规划》,至此,三北防护林工程正式启动实施,占国土面积的41.58%;⑦ 从1999年开始了在具有代表性的地方进行了退耕还林试点;到2001年底,全国先后有20个省(区、市)和新疆生产建设兵团进行了试点;2002年,在试点成功的基础上,退耕还林工程全面启动,其所涉及的行政区域累计占到了国土面积的78.34%。七类区域合并以后占国土面积的90.31%,七类区域两两之间也都有不同程度的空间重叠,例如,重要和重点生态功能区的重叠部分占到七类生态区域并集的15.42%、占到全国面积的14.20%。这些生态保护区域虽然明确了大面积的生态功能重要区域,然而,各种生态功能重要区域、自然保护地叠加起来面积广大,并且常常与其它行业的用地需求存在显著的交叉重叠现象[49]。这种状况的存在,一方面不利于将国家和区域有限的生态保护资金、资源集成高效利用,以保证自然生态保护的持续性和有效性;另一方面,与自然生态保护与经济社会发展的用地需求所存在的不协调,会导致实践层面各类自然保护第承受干扰和蚕食的风险[24](图1)。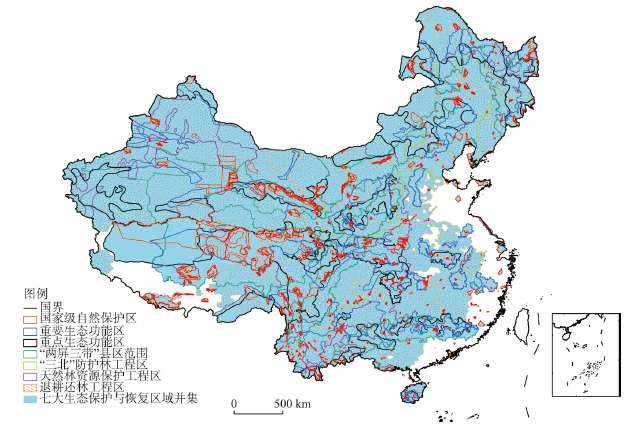 显示原图|下载原图ZIP|生成PPT
图1中国七类生态保护与恢复区域的空间范围
-->Fig. 1The spatial location of seven conservation and restoration regions in China
-->
2 方法与数据
2.1 生态系统服务制图方法
传统上,****们多采用复杂的生态模型来模拟生态系统服务的提供能力,例如,采用CASA模型来空间制图评估NPP[50]、用USLE/RUSLE模型来模拟土壤保持服务[51],以及用Budyko假设来建立产水量模型来模拟生态系统的水源提供服务[52-54]。这些模型所涉及的相关参数多是建立在长期小尺度的实验观测基础之上的,其在大尺度上很难获取。将这些复杂生态模型应用在大尺度上,必须对相关参数进行简化来达到在大尺度上进行分析的目的,其结果要么对大尺度上生态系统服务的空间位置信息特征的揭示较为粗略,要么难以反映真实的区域生态系统服务提供时空变化特征,往往为生态系统服务的评估带来了一定的不确定性,其结果往往难以在大尺度上进行验证[31, 55]。在较大的空间尺度上对生态系统服务进行空间量化制图评估常常面临着数据稀缺的挑战[32, 35-36]。在这种情况下,遥感数据产品通过提供高时空分辨率的空间数据对大尺度上生态状况的评估有着十分重要的作用。源自采用遥感植被指数与环境变量因子构建的植被净初级生产力(NPP)数据是评估大尺度生态状况的关键指标[56]。植被净初级生产力是绿色植被通过光合作用所积累的碳总量,是陆地和海洋生态系统持续健康发展的能量基础,它直接或间接地支持着多种生命体的生存与多样性、维持着各种生态过程的有效运转和生态系统服务的生产[2, 11, 57]。尽管植被净初级生产力并不能代表所有的生态系统服务类型,但是它与多种生态系统服务的产生有着重要的相互关系,它决定和影响着许多供给与调节和一些文化生态系统服务的生产与流动过程,而它本身也是一种重要的生态系统支持服务[1-2, 57-61]。因此,NPP作为生态系统所获取的太阳能的度量,驱动着生态系统功能的发挥,支持着许多生态系统服务的生产过程。Petrosillo等[62]建立了以NPP为主要度量指标来量化评估不同的生态系统服务类型,例如,食物提供与木材生产服务。Carre?o等[55]提出了一系列将生物量与环境变量组合的生态系统服务评估方法,并采用该方法对阿根廷近50年土地利用变化与生态系统服务的关系特征进行了阐述。后来,Barral等[63]通过对该模型进行修定补充,建立了用NPP与相关环境变量因子对阿根廷东南部的潘帕斯草原生态系统服务与土地利用的相互影响特征进行了分析。本文通过对中国自然环境变化特征的分析,修正了相关参数的量化计算方法,建立了适合在中国国家尺度上,利用NPP与环境变量因子建立的因果关系法评估模型,作为综合替代指标来评估对中国生态保护与恢复十分重要的4种生态系统服务类型变化特征,并对总生态系统服务的时空变化及其影响驱动因素进行了分析与讨论。在综合以上分析的基础上提出了中国生态系统服务保护优先性等级。研究所涉及4种生态系统服务类型的评估方法(表1),具体参数计算方法见环发[2015]56号《生态保护红线划定技术指南》。主要数据源自中国气象数据共享网、全球和谐土壤属性数据库(Harmonized World Soil Database v 1.2)、寒区旱区科学数据中心(http://westdc.westgis.ac.cn/account/login)基础科学数据共享网(http://www.nsdc.cn/index.html)、地理空间数据云数据共享平台(http://www.gscloud.cn/)。
Tab. 1
表1
表1生态系统服务的空间制图方法[
Tab. 1Mapping methods of the ecosystem services (adapted from references [55] and [63])
| 类型 | 制图方法 | 参数 |
|---|---|---|
| 植被碳固定 | NPP×(1-VCnpp) | NPP:植被净初级生产力因子; VCnpp:NPP的年内稳定性因子; K:土壤侵蚀因子;Fslo:坡度因子; Fsic:土壤入渗能力因子; Fpre:年降水量因子; Ftem:年均气温因子; D:地表粗糙度因子; |
| 土壤保持 | NPP×(1-VCnpp)×(1-K)×(1-Fslo) | |
| 水源涵养与提供 | NPP×(1-VCnpp)×Fsic×Fpre×(1-Fslo) | |
| 栖息地提供 | NPP×(1-VCnpp)×Fpre×Ftem×D | |
| 总生态系统服务 | 以上4种服务之和 |
新窗口打开
2.2 生态保护效率评价
生态系统服务保护优先区域的保护成效的评估方法如下[54, 64]:式中:SE是生态系统服务空间保护成效指标;EP是优先保护区域的生态系统服务保护总量;E是优先保护区域的总面积;SP是整个研究区的生态系统服务总量;S为研究区总面积。如果优先区的SE指数值大于1则表明该优先区域的生态系统服务保护成效较高,若小于1则说明该优先区的生态系统服务空间保护成效较差。SE空间保护成效指数的值为无单位正数。
2.3 其他分析方法
线性回归方法已经被广泛的用来分析植被覆盖变化和气候变化[56]。计算线性趋势的最小二乘法方程见公式:式中:y为因变量(例如每年的植被覆盖度、降水量等);a为线性趋势系数;t为时间序列;b为截距;ε为随机误差。该一次线性回归方程的显著性用F检验或皮尔森相关系数显著性检验得到[65]。
总生态系统服务的分级方法是在地理信息系统软件中将主要生态系统服务做叠加处理,得到总生态系统服务,在进一步采用Quantile(分位数)分类对其进行5级分类。最后按生态系统服务总值将其重要性由低到高依次划分为5个重要性级别,即一般重要、较重要、中等重要、高度重要、极重要。
3 结果分析
3.1 中国总生态系统服务时空变化及其驱动因素
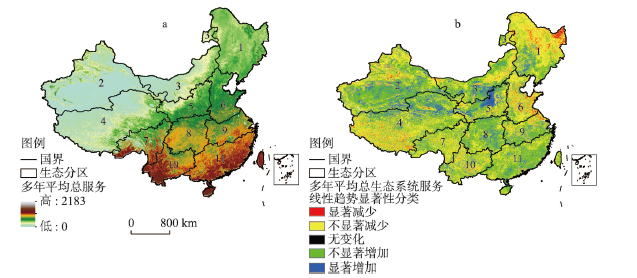
生态区划是根据区域生态环境因子的异质性和相似性特征所划分的能为生态系统的研究、评价、修复和管理提供的一个合理的空间分析单元[66]。本文用来分析全国陆地生态系统的不同生态区域的生态系统服务变化特征的生态区划是根据谢高地等[67]基于全国气候、地形地貌、生态系统特点的定量与定性指标所划分的保持县域边界完整性的中国生态区划方案中所划定的11个生态二级生态地区来进行分析的,包括:1东北生态地区、2西北干旱生态地区、3内蒙古高原生态地区、4青藏高原高寒生态地区、5黄土高原生态地区、6华北生态地区、7横断山区生态地区、8川渝生态地区、9长江中下游生态地区、10云贵高原生态地区、11华南生态地区。结果表明:全国2000-2010年的多年平均总生态系统服务总体上自西北向东南方向逐渐增加。总生态系统服务的相对值为2183,最小为0。在各个生态地区中,华南生态地区的平均值最大,其次为云贵高原生态地区、川渝生态地区、长江中下游生态地区、横断山区生态地区、华北生态地区、黄土高原生态地区、东北生态地区、内蒙古高原生态地区、青藏高原高寒生态地区以及西北干旱生态地区;而保护的总生态系统服务总量最大的地区为华南生态地区,其次为云贵高原生态地区、东北生态地区、川渝生态地区、青藏高原生态地区、横断山区生态地区、长江中下游生态地区、华北生态地区、黄土高原生态地区、西北干旱生态地区、内蒙古高原生态地区。通过对总生态系统服务从2000-2010年的线性变化趋势进行分析发现,全国最高增加趋势为132.21/a,最低为-138.66/a;华南生态地区增加趋势最大,其次为川渝生态地区、黄土高原生态地区、长江中下游生态地区、内蒙古高原生态地区、横断山区生态地区、云贵高原生态地区、西北干旱生态地区和青藏高原高寒生态地区,只有东北与华北生态地区呈现降低趋势且华北生态地区的降低程度最大;这种变化趋势的显著增加区域主要分布在黄土高原生态地区,显著减少区域主要分布在东北生态地区东北部以及华北生态地区东南部等(表2,图2)。Tab. 2
表2
表2不同生态地区的总生态系统服务变化统计特征
Tab. 2Statistical characteristics of the total ecosystem services in the eleven eco-regions
| 生态区 | 多年平均总生态系统服务 | 2000-2010年的线性趋势 | |
|---|---|---|---|
| 均值 | 总量 | 均值 | |
| 西北干旱生态地区 | 131.155 | 3713780000 | 0.321 |
| 青藏高原高寒生态地区 | 228.792 | 6468300000 | 0.255 |
| 内蒙古高原生态地区 | 244.272 | 3162330000 | 0.619 |
| 东北生态地区 | 444.568 | 8117970000 | -2.335 |
| 黄土高原生态地区 | 474.641 | 3802090000 | 3.310 |
| 华北生态地区 | 596.247 | 4820720000 | -3.287 |
| 长江中下游生态地区 | 795.032 | 5591970000 | 2.083 |
| 横断山区生态地区 | 690.687 | 6043490000 | 0.435 |
| 川渝生态地区 | 795.778 | 7432540000 | 4.049 |
| 华南生态地区 | 1064.16 | 15082600000 | 4.326 |
| 云贵高原生态地区 | 1052.16 | 8662450000 | 0.385 |
新窗口打开
 显示原图|下载原图ZIP|生成PPT
图22000-2010年中国总生态系统服务时空变化特征
-->Fig. 2Spatial-temporal variations of the total ecosystem services in China from 2000 to 2010
-->
分析这3个区域的在2000年和2010年的250 m分辨率的土地利用变化特征,结果显示,华北地区的总生态系统服务状况变差主要是耕地的减少以及人工用地的增加引起的。东北地区的总生态系统服务是由于林地退化,林地向耕地草地、耕地向湿地与人工用地的转换引起的。然而,黄土高原地区的总生态系统服务提高则主要是由于农田向草地和林地、草地向林地类型的转换引起了生态系统服务提供能力的增加。
3.2 中国七大生态保护与恢复区域的总生态系统服务保护成效评估
对中国七大生态保护与恢复区区域内的总生态系统服务的显著性变化区域的面积比例分析发现,这七大区域的总生态系统服务总体上的增加区域都大于减少区域,总生态系统服务提供能力在2000-2010年间有所改善。保护的总生态系统服务量比例最高的为退耕还林工程区域,最低的为国家级自然保护区。总生态系统服务的空间保护效率大于全国平均水平的只有重要生态功能区和天然林资源保护工程区,分别为1.10和1.08,其余区域均小于全国平均水平且最低的区域为三北防护林工程区。可见,七大生态保护与恢复区域的空间保护效率十分低下(表3),有必要提出新的面向生态系统服务保护的优先性保护区域。Tab. 3
表3
表3中国各生态区域保护的总生态系统服务的显著性变化比例、占全国的保护总量比例以及保护效率特征
Tab. 3Characteristics of the proportions of significant variation areas, conservational amounts and conservational effectiveness of ecosystem services in the seven conservation and restoration regions
| 趋势变化显著性等级 | 国家级自然保护区 | 重要生态功能区 | 重点生态功能区 | 两屏三带区 | 天然林资源保护区 | 退耕还林工程区 | 三北防护林工程区 | 七大区域并集 |
|---|---|---|---|---|---|---|---|---|
| 显著减少(%) | 3.11 | 4.16 | 3.63 | 4.05 | 3.06 | 3.55 | 3.04 | 3.69 |
| 不显著减少(%) | 33.87 | 40.42 | 40.63 | 40.13 | 41.07 | 37.85 | 33.53 | 38.70 |
| 无变化(%) | 0.01 | 0.00 | 0.00 | 0.00 | 0.00 | 0.00 | 0.00 | 0.00 |
| 不显著增加(%) | 53.29 | 46.80 | 48.12 | 46.98 | 47.39 | 50.36 | 51.70 | 49.64 |
| 显著增加(%) | 9.72 | 8.61 | 7.62 | 8.83 | 8.48 | 8.24 | 11.72 | 7.97 |
| 占全国总量比例(%) | 5.50 | 27.35 | 25.82 | 32.00 | 37.17 | 77.20 | 20.21 | 86.05 |
| 保护效率指数 | 0.61 | 1.10 | 0.91 | 0.85 | 1.08 | 0.99 | 0.49 | 0.95 |
新窗口打开
3.3 中国总生态系统服务保护优先区域分级
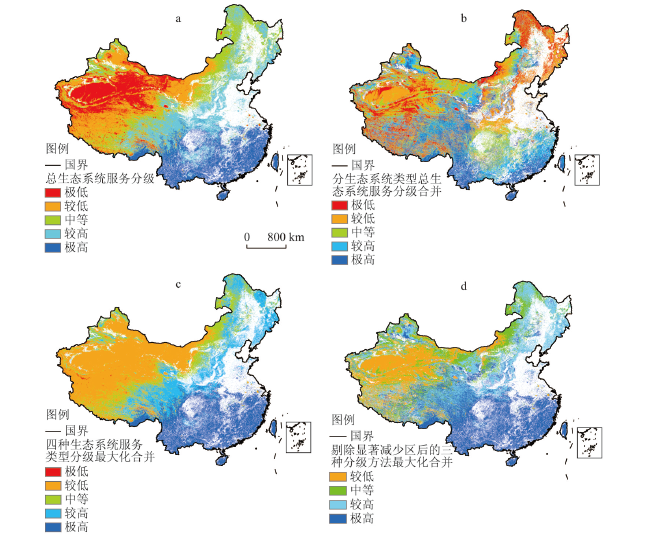
在剔除掉农业用地与人工用地范围后,首先对总生态系统服务进行了5级分类,得到总生态系统服务的重要性分级,这种分级方式能达到直接对中国总生态系统服务提供能力较强区域的保护。其次,对4种生态系统服务类型进行了5级分类,然后对其进行最大化合并,这种分级方式能达到对每种生态系统服务较高级别的筛选保护。再次,对总生态系统服务按不同生态系统类型(森林、草地、荒漠、湿地)进行5级分类,然后进行合并,这种分级方式能充分考虑到生态系统多样性保护在生态保护中的重要性,能兼顾对每种生态系统类型的共同保护。最后,为了综合以上3种分级方式的优点,在ArcGIS 10.2软件中对以上3种分级方式得到的3个分级图层进行最大化合并,然后再剔除掉总生态系统服务在2000-2010年间的显著变化区域后,得到了最终的综合优先性分级。结果分析显示,其极低等级范围保护了全国总量的0.00%、较低类别保护了全国总量的7.68%、中等级别保护了11.41%、较高级别保护了25.35%、极高类别保护了全国总量的55.56%。全国分生态系统服务类型的多年平均生态系统服务的最大化合并重要性分类中的极低等级占国土面积的0.25%、较低等级占29.27%、中等等级占了12.76%、较高等级占了17.72%、极高等级占了国土面积的18.62%。为了更好地兼顾各种生态系统服务分级方法的优点,将以上3种重要性分级方式的到的结果进行最大化合并,通过对合并的重要性分级结果进行分析得出,其极低等级范围保护了全国总量的0.00%、较低类别保护了全国总量的3.16%、中等级别保护了10.53%、较高级别保护了22.12%、极高类别保护了全国总量的64.19%。将该3种重要性分级方式的最大化合并结果再剔除掉
自2000-2010年间的总生态系统服务显著减少区域后得到的重要性分级结果中较低等级保护了全国总量的3.12%、中等类别保护了10.33%、较高类别保护了21.92%、极高类别保护了全国总生态系统服务量的64.63%。上述3种生态系统服务分级方式的最大化合并结果的极低等级占国土面积的0.25%、较低等级占15.29%、中等等级占了16.19%、较高等级占了20.06%、极高等级占了国土面积的26.82%。在剔除掉总生态系统服务的显著减少区域后,其较低重要性分级类别占国土面积比例的14.86%、中等类别占了15.59%、较高类别占了19.38%、极高等级占了国土面积的26.18%(表4,图3)。
Tab. 4
表4
表45种总生态系统服务分级方法的生态系统服务保护成效
Tab. 4The conservational effectiveness of the five classification methods for conserving ecosystem services
| 保护成效 | 极低 | 较低 | 中等 | 较高 | 极高 |
|---|---|---|---|---|---|
| 总生态系统服务分级 | 0.13 | 0.40 | 1.02 | 1.63 | 3.17 |
| 分生态系统类型总生态系统服务分级合并 | 0.00 | 0.26 | 0.89 | 1.43 | 2.98 |
| 四种生态系统服务类型分级最大化合并 | 0.58 | 0.81 | 1.19 | 1.57 | 2.17 |
| 三种分级方法最大化合并 | 0.00 | 0.21 | 0.65 | 1.10 | 2.39 |
| 剔除显著减少区后的三种分级方法最大化合并 | 0.00 | 0.21 | 0.66 | 1.13 | 2.47 |
新窗口打开
 显示原图|下载原图ZIP|生成PPT
图3中国总生态系统服务保护优先性分级
-->Fig. 3Conservational priority levels of the total ecosystem services in China
-->
4 讨论
本文所采用的生态系统服务空间制图方法能详细地揭示研究区域的土地利用变化所导致的生态系统服务变化,对大尺度上土地利用与生态系统服务之间的权衡分析以及长期的生态状况、生态恢复与保护优先区的监测评估有着重要的辅助作用。但是,由于该方法的主要指标是基于植被的NPP,所以对湿地生态系统服务特征的描述存在着一定的局限性。再者,文章对生态系统服务变化及其驱动因素的分析主要借助空间叠加分析的方法,未来亟需要强化其量化评估分析。在以后的研究中,应继续探索将新的参数组合纳入综合指标评价法之中,使得评估更精确。本文只选择了4种在大尺度上对于生态保护较为重要的生态系统服务类型来进行评估,未来有必要将其他相关生态系统服务类型纳入到其保护优先区域之中。虽然基于NPP的综合指标法评估无法给出具体的生态系统服务物理量值,但是该方法可以评估得到服务的高低排序。在针对生态系统服务保护优先性评估时比较注重所评估服务类型的高低次序判别而不是追求对其物理量值的量算的这种特点,该方法可以有效的实现对数据缺乏和大空间尺度区域上进行生态系统服务保护优先区、保护有效性及其长期监测评估方面的研究需要,有着重要的应用价值。5 结论
(1)中国从2000-2010年的总生态系统服务提供能力总体上呈现出自西北向东南方向逐渐增加的趋势,总生态系统服务线性变化的显著增加区域主要分布在黄土高原生态地区,显著减少区域主要分布在东北生态地区东北部以及华北生态地区东南部。华北地区的总生态系统服务状况变差主要是耕地的减少以及人工用地的增加引起的。东北地区的总生态系统服务是由于林地退化,林地向耕地草地、耕地向湿地与人工用地的转换引起的。然而,黄土高原地区的总生态系统服务提高则主要是由于农田向草地和林地、草地向林地类型的转换引起了生态系统服务提供能力的增加。(2)从2000-2010年,中国的七大生态保护和恢复区域内的4种生态系统服务类型及其总生态系统服务的线性趋势变化显著增加面积均大于显著减少面积,总体上各个区域的生态系统服务状况在均有所提高。总生态系统服务的显著增加比例最大的为三北防护林工程区、最小的为重点生态功能区;显著减少面积比例最大为重要生态功能区、最小的为三北防护林工程区。总生态系统服务的保护成效在重要生态功能区最高,为全国平均水平的1.1倍、其次为天然林保护工程区为1.08倍,其余区域均小于全国平均水平且最低的区域为三北防护林工程区。
(3)在充分考虑生态系统类型、生态系统服务的能力及其种类的共同保护基础上,通过剔除掉总生态系统服务在2000-2010年间的显著减少变化区域后,形成的最终优先性分级方案中较高与极高级别占到了国土面积的45.56%,保护的总生态系统服务量占到全国总量的86.55%,保护成效为全国平均水平的1.80倍。
The authors have declared that no competing interests exist.
参考文献 原文顺序
文献年度倒序
文中引用次数倒序
被引期刊影响因子
| [1] | Although the usual diet of Chelonia mydas comes from algae and sea grasses ( plant material), animal material has been found in samples taken over the past 35 yr. The small black-brown protein sponge Chondrosia chucalla resembles the alga Codium arabicum in size, color, and texture, and both grow next to each other on the reefs. We hypothesize that turtles are actively seeking and eating these sponges and not mistaking them for C. arabicum. Both protein and silica sponges occur in the diet of Chelonia, but only 6.8% of the time are eaten in addition to their usual plant diet. Thirty different kinds of other animals were found in the samples, including Cnidaria, Mollusca, Crustacea, Insecta, Echinodermata, squid, fish, tumor flesh, and other animals but in low frequency (5%). Most of the miscellaneous nonfood debris items were terrestrial leaves, plastic, paper, string, fibers, hair, and paint chips but also in low frequency (<7%). Among animal food items known to have nutritional value, the protein sponge C. chucalla could be contributing an important nutritive factor, but this needs further research. |
| [2] | |
| [3] | Evidence-based policy requires researchers to provide the answers to ecological questions that are of interest to policy makers. To find out what those questions are in the UK, representatives from 28 organizations involved in policy, together with scientists from 10 academic institutions, were asked to generate a list of questions from their organizations. During a 2-day workshop, the initial ... |
| [4] | Within the next 50 to 100 years, support and maintenance of an extended human family of 8 to 11 billion people will become difficult at best. Our consumption rates already exceed the supply of many resources crucial to human health, and few places on Earth do not bear the stamp of human impacts (1, 2). Fossil fuel combustion and fertilizer production have doubled the global rate of nitrogen fixation, which has exacerbated ongoing eutrophication while fertilizing remote portions of the planet (3). Increases in global commerce have led to the spread of pests and diseases that do great harm because they are divorced from their natural predators and pathogens (4). Studying the few and rapidly shrinking undisturbed ecosystems is important, but now is the time to focus on an ecology for the future. Because our planet will be overpopulated for the foreseeable future and natural resource consumption shows no signs of slowing, human modifications of the environment will only increase. Thus, a research perspective that incorporates human activities as integral components of Earth's ecosystems is needed, as is a focus on a future in |
| [5] | EcoServ-GIS is a Geographical Information Systems (GIS) toolkit that generates fine scale (10or 50 m resolution) maps Applied Geography, 31(1), pp. Mapping ecosystem services: Practicalchallenges and opportunities in linking GIS and value transfer (vol 60, pg 435, 2006). |
| [6] | |
| [7] | Research on ecosystem services has grown markedly in recent years. However, few studies are embedded in a social process designed to ensure effective management of ecosystem services. Most research has focused only on biophysical and valuation assessments of putative services. As a mission-oriented discipline, ecosystem service research should be user-inspired and user-useful, which will require that researchers respond to stakeholder needs from the outset and collaborate with them in strategy development and implementation. Here we provide a pragmatic operational model for achieving the safeguarding of ecosystem services. The model comprises three phases: assessment, planning, and management. Outcomes of social, biophysical, and valuation assessments are used to identify opportunities and constraints for implementation. The latter then are transformed into user-friendly products to identify, with stakeholders, strategic objectives for implementation (the planning phase). The management phase undertakes and coordinates actions that achieve the protection of ecosystem services and ensure the flow of these services to beneficiaries. This outcome is achieved via mainstreaming, or incorporating the safeguarding of ecosystem services into the policies and practices of sectors that deal with land- and water-use planning. Management needs to be adaptive and should be institutionalized in a suite of learning organizations that are representative of the sectors that are concerned with decision-making and planning. By following the phases of our operational model, projects for safeguarding ecosystem services are likely to empower stakeholders to implement effective on-the-ground management that will achieve resilience of the corresponding social-ecological systems. |
| [8] | Over the past decade, efforts to value and protect ecosystem services have been promoted by many as the last, best hope for making conservation mainstream - att |
| [9] | The integration of ecosystem services in ecological restoration projects presents an opportunity for enhancing benefits to livelihood and funding sources as well as generating public support for such initiatives. This study reviewed the global trends in integrating ecosystem services in basin-scale restoration projects through bibliographic analysis. Few studies appear to incorporate ecosystem services, possibly due to the inconsistency and absence of the use of universally accepted classifications. Our review notes an increasing trend from 2006 onward toward the inclusion and citation of this concept, although its use is still limited. In this review, the supporting service was found to be the most cited (8), followed by regulatory (3), cultural (1) and provisioning (1) services. Identifying the number of services related to a restoration action was problematic when the services were not explicitly cited. We identify opportunities for increased integration of ecosystem services in basin-scale restoration projects, suggesting a conceptual framework following from new hierarchical maps. This is based on congruence between degrading processes or threat maps (e.g., thresholds of impacts) and ecosystem service maps. The resultant map will facilitate the targeting of threatened service supply at different scales from the basin scale to the scale of the restoration site. We urge the scientific community to standardize definitions and create methodologies and software tools that facilitate the incorporation of ecosystem services in large-scale restoration plans. |
| [10] | Landscapes generate a wide range of valuable ecosystem services, yet land-use decisions often ignore the value of these services. Using the example of the United Kingdom, we show the significance of land-use change not only for agricultural production but also for emissions and sequestration of greenhouse gases, open-access recreational visits, urban green space, and wild-species diversity. We use spatially explicit models in conjunction with valuation methods to estimate comparable economic values for these services, taking account of climate change impacts. We show that, although decisions that focus solely on agriculture reduce overall ecosystem service values, highly significant value increases can be obtained from targeted planning by incorporating all potential services and their values and that this approach also conserves wild-species diversity |
| [11] | |
| [12] | Introduction This paper presents a case study of the application of an ecosystem services framework to support land-use planning. The district of Koboko, in northwestern Uganda, formed |
| [13] | Recent studies clarify where the most vulnerable species live, where and how humanity changes the planet, and how this drives extinctions. We assess key statistics about species, their distribution, and their status. Most are undescribed. Those we know best have large geographical ranges and are often common within them. Most known species have small ranges. The numbers of small-ranged species are increasing quickly, even in well-known taxa. They are geographically concentrated and are disproportionately likely to be threatened or already extinct. Current rates of extinction are about 1000 times the likely background rate of extinction. Future rates depend on many factors and are poised to increase. Although there has been rapid progress in developing protected areas, such efforts are not ecologically representative, nor do they optimally protect biodiversity. |
| [14] | |
| [15] | |
| [16] | Abstract Knowing the factors that affect the abundance and activity patterns of pumas (Puma concolor) in South American forests may help in their conservation. Using camera traps, we conducted 4 surveys in 3 areas with different levels of protection against poaching and logging within the biggest continuous fragment of the Upper Parana Atlantic Forest. We used capture–mark–recapture population models to estimate the density of pumas for each area. The core area of Iguazú National Park, with low poaching pressure and no logging for >60 years, had the highest density of pumas (between 1.55 and 2.89 individuals/100 km2). Yabotí Biosphere Reserve, an area with the highest poaching and logging pressure, showed the lowest density (between 0.3 and 0.74 individuals/100 km2). Areas with intermediate levels of poaching and logging pressure had densities between 0.66 and 2.19 individuals/100 km2. Puma activity peaked during the 1st hours of morning in the most protected area, but became more crepuscular and nocturna... |
| [17] | |
| [18] | In 2002, world leaders committed, through the Convention on Biological Diversity, to achieve a significant reduction in the rate of biodiversity loss by 2010. We compiled 31 indicators to report on progress toward this target. Most indicators of the state of biodiversity (covering species' population trends, extinction risk, habitat extent and condition, and community composition) showed declines, with no significant recent reductions in rate, whereas indicators of pressures on biodiversity (including resource consumption, invasive alien species, nitrogen pollution, overexploitation, and climate change impacts) showed increases. Despite some local successes and increasing responses (including extent and biodiversity coverage of protected areas, sustainable forest management, policy responses to invasive alien species, and biodiversity-related aid), the rate of biodiversity loss does not appear to be slowing. |
| [19] | The article offers information on a study conducted by the U.S. Department of Agriculture (USDA) in collaboration with the colony collapse disorder (CCD) Working Groups to determine the cause of CCD in honey bees. |
| [20] | |
| [21] | Human modifications of the environment are growing in number and geographic extent, expanding to all of the Earth's surfaces and affecting the vast majority of the Earth's natural resources. Increases in demand for resources, growing levels of poverty, and more extensive urbanization, among other changes, lead to a need to move beyond parks and classic conservation approaches to incorporate humans and working landscapes more directly in conservation efforts. One approach to do this is to focus on ecosystem services, the benefits ecosystems provide to humans. Here conservation projects that focus only on biodiversity are analytically compared with those that include ecosystem-service goals to dispel myths and explore promises. Projects conducted by The Nature Conservancy, the world's largest conservation organization, are used, and it is demonstrated that not only do ecosystem-service approaches engage new landscapes, stakeholders, and funding sources, but that they do so without neglecting traditional biodiversity goals and the traditional approaches of protection and preservation. Seven case studies that uniquely create a broker-type structure to determine how to distribute money for the provision of particular services to the satisfaction of a wide range of stakeholder interests are focused on. It is found that all use local, independent leadership to initiate partnership formation, which then leads to the creation of a separate institutional entity that has legal rights to determine fund provision. The activities encouraged by these entities, and which therefore appear to satisfy a wide array of interests, are supporting education, rewarding best management practice, creating jobs, and monitoring outcomes. |
| [22] | Ecosystem services can bridge biodiversity conservation and development needs, but there is little information available on how conservation organizations implement such projects. We documented 103 ecosystem service projects - from 37 countries - implemented by The Nature Conservancy (TNC) and the World Wildlife Fund (WWF). These projects commonly involved traditional conservation tactics, such... |
| [23] | The conservation community is divided over the proper objective for conservation, with one faction focused on ecosystem services that contribute to human well-being and another faction focused on the intrinsic value of biodiversity. Despite the underlying difference in philosophy, it is not clear that this divide matters in a practical sense of guiding what a conservation organization should do in terms of investing in conservation. In this paper we address the degree of alignment between ecosystem services and biodiversity conservation strategies, using data from the state of Minnesota, USA. Minnesota voters recently passed an initiative that provides approximately $171m annually in dedicated funding for conservation. We find a high degree of alignment between investing conservation funds to target the value of ecosystem services and investing them to target biodiversity conservation. Targeting one of these two objectives generates 47鈥70 per cent of the maximum score of the other objective. We also find that benefits of conservation far exceed the costs, with a return on investment of between 2 to 1 and 3 to 1 in our base-case analysis. In general, investing in conservation to increase the value of ecosystem services is also beneficial for biodiversity conservation, and vice-versa. Copyright 2012, Oxford University Press. |
| [24] | <p>生态系统及其服务的保护日益成为保护生态学研究的前沿和热点领域.本文对国际上生态系统保护和生态系统服务评估的最新概念和方法进展进行综述,主要包括生态系统保护状况及濒危或保护优先等级确定的指标、标准,以及生态系统服务评估和保护的主要方法(包括参数法、模型法和定量指标法),并结合中国生态保护研究的进展和需求,明确了急需解决的问题:1)提出适合中国国情的生态系统保护评估的指标、标准和方法;2)发展生态系统服务评估的定量化方法;3)确定生态系统和生态功能保护需求及其空间优化布局; 4)生态系统及其服务保护的政策和激励机制.这些问题的解决将会为生态文明建设提供重要保障.</p> . <p>生态系统及其服务的保护日益成为保护生态学研究的前沿和热点领域.本文对国际上生态系统保护和生态系统服务评估的最新概念和方法进展进行综述,主要包括生态系统保护状况及濒危或保护优先等级确定的指标、标准,以及生态系统服务评估和保护的主要方法(包括参数法、模型法和定量指标法),并结合中国生态保护研究的进展和需求,明确了急需解决的问题:1)提出适合中国国情的生态系统保护评估的指标、标准和方法;2)发展生态系统服务评估的定量化方法;3)确定生态系统和生态功能保护需求及其空间优化布局; 4)生态系统及其服务保护的政策和激励机制.这些问题的解决将会为生态文明建设提供重要保障.</p> |
| [25] | Habitat destruction has driven much of the current biodiversity extinction crisis, and it compromises the essential benefits, or ecosystem services, that humans derive from functioning ecosystems. Securing both species and ecosystem services might be accomplished with common solutions. Yet it is unknown whether these two major conservation objectives coincide broadly enough worldwide to enable global strategies for both goals to gain synergy. In this article, we assess the concordance between these two objectives, explore how the concordance varies across different regions, and examine the global potential for safeguarding biodiversity and ecosystem services simultaneously. We find that published global priority maps for biodiversity conservation harbor a disproportionate share of estimated terrestrial ecosystem service value (ESV). Overlap of biodiversity priorities and ESV varies among regions, and in areas that have high biodiversity priority but low ESV, specialized conservation approaches are necessary. Overall, however, our findings suggest opportunities for safeguarding both biodiversity and ecosystem services. Sensitivity analyses indicate that results are robust to known limitations of available ESV data. Capitalizing on these opportunities will require the identification of synergies at fine scales, and the development of economic and policy tools to exploit them. |
| [26] | In the European Union (EU) efforts to conserve biodiversity have been consistently directed towards the protection of habitats and species through the designation of protected areas under the Habitats Directive (92/43/ECC). These biodiversity conservation efforts also have the potential to maintain or improve the supply of ecosystem services; however, this potential has been poorly explored across Europe. This paper reports on a spatial assessment of the relationships between biodiversity, ecosystem services, and conservation status of protected habitats at European scale. We mapped at 10 km resolution ten spatial proxies for ecosystem service supply (four provisioning services, five regulating services and one cultural service) and three proxies for biodiversity (Mean Species Abundance, tree species diversity and the relative area of Natura 2000 sites). Indicators for biodiversity and aggregated ecosystem service supply were positively related but this relationship was influenced by the spatial trade-offs among ecosystem services, in particular between crop production and regulating ecosystem services. Using multinomial logistic regression models we demonstrated that habitats in a favourable conservation status provided more biodiversity and had a higher potential to supply, in particular, regulating and cultural ecosystem services than habitats in an unfavourable conservation status. This information is of utmost importance in identifying regions in which measures are likely to result in cost-effective progress towards both new biodiversity conservation and ecosystem services targets adopted by the Convention on Biological Diversity (CBD) and the EU Biodiversity Strategy to 2020. |
| [27] | There is growing support for characterizing ecosystem services in order to link conservation and human well-being. However, few studies have explicitly included ecosystem services within systematic conservation planning, and those that have follow two fundamentally different approaches: ecosystem services as intrinsically-important targeted benefits vs. substitutable co-benefits. We present a first comparison of these two approaches in a case study in the Central Interior of British Columbia. We calculated and mapped economic values for carbon storage, timber production, and recreational angling using a geographical information system (GIS). These 'marginal' values represent the difference in service-provision between conservation and managed forestry as land uses. We compared two approaches to including ecosystem services in the site-selection software Marxan: as Targeted Benefits, and as Co-Benefits/Costs (in Marxan's cost function); we also compared these approaches with a Hybrid approach (carbon and angling as targeted benefits, timber as an opportunity cost). For this analysis, the Co-Benefit/Cost approach yielded a less costly reserve network than the Hybrid approach (1.6% cheaper). Including timber harvest as an opportunity cost in the cost function resulted in a reserve network that achieved targets equivalently, but at 15% lower total cost. We found counter-intuitive results for conservation: conservation-compatible services (carbon, angling) were positively correlated with each other and biodiversity, whereas the conservation-incompatible service (timber) was negatively correlated with all other networks. Our findings suggest that including ecosystem services within a conservation plan may be most cost-effective when they are represented as substitutable co-benefits/costs, rather than as targeted benefits. By explicitly valuing the costs and benefits associated with services, we may be able to achieve meaningful biodiversity conservation at lower cost and with greater co-benefits. |
| [28] | Around the world, leaders are increasingly recognizing ecosystems as natural capital assets that supply life-support services of tremendous value. The challenge is to turn this recognition into incentives and institutions that will guide wise investments in natural capital, on a large scale. Advances are required on three key fronts, each featured here: the science of ecosystem production functions and service mapping; the design of appropriate finance, policy, and governance systems; and the art of implementing these in diverse biophysical and social contexts. Scientific understanding of ecosystem production functions is improving rapidly but remains a limiting factor in incorporating natural capital into decisions, via systems of national accounting and other mechanisms. Novel institutional structures are being established for a broad array of services and places, creating a need and opportunity for systematic assessment of their scope and limitations. Finally, it is clear that formal sharing of experience, and defining of priorities for future work, could greatly accelerate the rate of innovation and uptake of new approaches. |
| [29] | 生态系统服务是生态学研究的前沿方向之一,生态系统服务制图是将 生态系统服务的评估结果纳入到生态环境保护规划与管理决策制定与实施过程中的重要组成部分.生态系统服务制图是根据决策需求,选择合适的制图评价方法,对 特定时空尺度上生态系统服务的空间分布以及在各种自然-社会因素共同影响下生态系统服务的情景变化进行量化描述的过程.它最终为决策参与者提供研究区域生 态系统服务时空变化特征具体的、可视的量化描述,辅助决策者权衡利弊,最终制定出符合区域生态环境与人类社会共同可持续发展的最优决策.综述了生态系统服 务制图的内涵及其在辅助决策过程中的重要作用;介绍了生态系统服务的重点研究内容(生态系统服务的提供、需求及权衡协同关系制图)及研究方法;并对目前研 究中所存在的问题进行了深入的探讨,归纳了生态系统服务的制图评价流程及未来重点的研究方向. . 生态系统服务是生态学研究的前沿方向之一,生态系统服务制图是将 生态系统服务的评估结果纳入到生态环境保护规划与管理决策制定与实施过程中的重要组成部分.生态系统服务制图是根据决策需求,选择合适的制图评价方法,对 特定时空尺度上生态系统服务的空间分布以及在各种自然-社会因素共同影响下生态系统服务的情景变化进行量化描述的过程.它最终为决策参与者提供研究区域生 态系统服务时空变化特征具体的、可视的量化描述,辅助决策者权衡利弊,最终制定出符合区域生态环境与人类社会共同可持续发展的最优决策.综述了生态系统服 务制图的内涵及其在辅助决策过程中的重要作用;介绍了生态系统服务的重点研究内容(生态系统服务的提供、需求及权衡协同关系制图)及研究方法;并对目前研 究中所存在的问题进行了深入的探讨,归纳了生态系统服务的制图评价流程及未来重点的研究方向. |
| [30] | ABSTRACT 61Ecosystem service modelling and mapping approaches aim at understanding stocks, demands and flows of ecosystem services on different spatial and temporal scales.61The development of ecosystem service modelling and mapping approaches and tools has made big steps forward toward practical application in science, policy and practice.61Next steps include the further development of ecosystem service mapping, modelling, documentation, visualisation tools and assessment standards. |
| [31] | |
| [32] | ABSTRACT Indicators for mapping ecosystem services: a review |
| [33] | |
| [34] | |
| [35] | |
| [36] | The inconsistency in methods to quantify and map ecosystem services challenges the development of robust values of ecosystem services in national accounts and broader policy and natural resource management decision-making. In this paper we develop and test a blueprint to give guidance on modelling and mapping ecosystem services. The primary purpose of this blueprint is to provide a template and checklist of information needed for those beginning an ecosystem service modelling and mapping study. A secondary purpose is to provide, over time, a database of completed blueprints that becomes a valuable information resource of methods and information used in previous modelling and mapping studies. We base our blueprint on a literature review, expert opinions (as part of a related workshop organised during the 5th ESP conference 2 ) and critical assessment of existing techniques used to model and map ecosystem services. While any study that models and maps ecosystem services will have its unique characteristics and will be largely driven by data and model availability, a tool such as the blueprint presented here will reduce the uncertainty associated with quantifying ecosystem services and thereby help to close the gap between theory and practice. |
| [37] | As valuation of ecosystem goods and services derived from ecological processes becomes increasingly important in environmental decision-making, the need to quantify how restoration activities influence ecosystem function has grown more urgent, particularly within income-generating or subsistence-providing landscapes where economic needs and biodiversity goals must be balanced. However, quantification of restoration effects is often hindered by logistical issues, which include (1) the difficulty of systematically monitoring responses over large areas and (2) lack or loss of comparison sites necessary for assessing treatment effect. We explored the use of remote sensing to quantify the effects of native grass seeding and prescribed burns on ecosystem forage provisioning services within a California (U.S.A.) rangeland landscape. We used Landsat time series to monitor forage (green biomass) dynamics within 296 ha of treatment areas-distributed throughout a 36-km2 watershed-for 6 years and to identify post hoc comparison areas when a priori comparisons were lacking. Remote sensing analysis documented gains and losses in forage provisioning services due to restoration efforts and provided critical information for adaptive management. Our results demonstrate the degree to which invaded grasslands can be resistant to change and suggest that increasing the functional complexity of restoration mixes might help increase forage availability and reduce opportunities for weed reinvasion. |
| [38] | Information related to land cover is immensely important to global change science. In the past decade, data sources and methodologies for creating global land cover maps from remote sensing have evolved rapidly. Here we describe the datasets and algorithms used to create the Collection 5 MODIS Global Land Cover Type product, which is substantially changed relative to Collection 4. In addition to using updated input data, the algorithm and ancillary datasets used to produce the product have been refined. Most importantly, the Collection 5 product is generated at 500-m spatial resolution, providing a four-fold increase in spatial resolution relative to the previous version. In addition, many components of the classification algorithm have been changed. The training site database has been revised, land surface temperature is now included as an input feature, and ancillary datasets used in post-processing of ensemble decision tree results have been updated. Further, methods used to correct classifier results for bias imposed by training data properties have been refined, techniques used to fuse ancillary data based on spatially varying prior probabilities have been revised, and a variety of methods have been developed to address limitations of the algorithm for the urban, wetland, and deciduous needleleaf classes. Finally, techniques used to stabilize classification results across years have been developed and implemented to reduce year-to-year variation in land cover labels not associated with land cover change. Results from a cross-validation analysis indicate that the overall accuracy of the product is about 75% correctly classified, but that the range in class-specific accuracies is large. Comparison of Collection 5 maps with Collection 4 results show substantial differences arising from increased spatial resolution and changes in the input data and classification algorithm. |
| [39] | Land use change has a major impact on goods and services that our environment supplies for society. While detailed ecological or biophysical field studies are needed to quantify the exact amount of ecosystem service supply at local scales, such a monitoring might be unfeasible at the regional scale. Since field scale monitoring schemes for ecosystem services or ecosystem functioning are missing, proxy based indicators can help to assess the historic development of ecosystem services or ecosystem functioning at the regional scale. We show at the example of the historic development (1964-2004) in the district of Leipzig/Germany how land use/land cover data can be used to derive regional scale indicators for ecosystem functions. We focus thereby on two hypotheses: (1) the ecosystem functioning has degraded over time and (2) changes in land use configuration play an important role in this degradation. The study focuses on indicators for ecosystem functions related to (i) water purification by riparian buffer strips, (ii) pollination, (iii) food production and (iv) outdoor recreation. Each indicator builds on the analysis of land use configuration and land use composition information and is tested on sensitivity/robustness with respect to parameters which had to be estimated based on expert knowledge. We show that land use composition is an important aspect in our ecosystem service assessment. Although our study region is faced with a maximum land use change of 11% in the major land use classes between 1964 and 2004. we see a decrease of ecosystem function indicators up to 23%. The regional assessment shows an overall trend for degradation of ecosystem functioning from 1964 to 1984. This trend is reversed between 1984 and 1994 but the process slowed down until 2004 without reaching the level of 1964. (C) 2010 Elsevier Ltd. All rights reserved. |
| [40] | There is a growing demand for spatially explicit assessment of multiple ecosystem services (ES) and remote sensing (RS) can provide valuable data to meet this challenge. In this study, located in the Central French Alps, we used high spatial and spectral resolution RS images to assess multiple ES based on underpinning ecosystem properties (EP) of subalpine grasslands. We estimated five EP (green biomass, litter mass, crude protein content, species diversity and soil carbon content) from RS data using empirical RS methods and maps of ES were calculated as simple linear combinations of EP. Additionally, the RS-based results were compared with results of a plant trait-based statistical modelling approach that predicted EP and ES from land use, abiotic and plant trait data (modelling approach). The comparison between the RS and the modelling approaches showed that RS-based results provided better insight into the fine-grained spatial distribution of EP and thereby ES, whereas the modelling approach reflected the land use signal that underpinned trait-based models of EP. The spatial agreement between the two approaches at a 20-m resolution varied between 16 and 22% for individual EP, but for the total ecosystem service supply it was only 7%. Furthermore, the modelling approach identified the alpine grazed meadows land use class as areas with high values of multiple ES (hot spots) and mown-grazed permanent meadows as areas with low values and only few ES (cold spots). Whereas the RS-based hot spots were a small subset of those predicted by the modelling approach, cold spots were rather scattered, small patches with limited overlap with the modelling results. Despite limitations associated with timing of assessment campaigns and field data requirements, RS offers valuable data for spatially continuous mapping of EP and can thus supply RS-based proxies of ES. Although the RS approach was applied to a limited area and for one type of ecosystem, we believe that the broader availability of high fidelity airborne and satellite RS data will promote RS-based assessment of ES to larger areas and other ecosystems. |
| [41] | <p>Ecosystem service is an emerging concept that grows to be a hot research area in ecology.Spatially explicit ecosystem service values are important for ecosystem service management.However,it is difficult to quantify ecosystem services.Remote sensing provides images covering Earth surface,which by nature are spatially explicit.Thus,remote sensing can be useful for quantitative assessment of ecosystem services.This paper reviews spatially explicit ecosystem service studies conducted in ecology and remote sensing in order to find out how remote sensing can be used for ecosystem service assessment.Several important areas considered include land cover,biodiversity,and carbon,water and soil related ecosystem services.We found that remote sensing can be used for ecosystem service assessment in three different ways:direct monitoring,indirect monitoring,and combined use with ecosystem models.Some plant and water related ecosystem services can be directly monitored by remote sensing.Most commonly,remote sensing can provide surrogate information on plant and soil characteristics in an ecosystem.For ecosystem process related ecosystem services,remote sensing can help measure spatially explicit parameters.We conclude that acquiring good in-situ measurements and selecting appropriate remote sensor data in terms of resolution are critical for accurate assessment of ecosystem services.</p> |
| [42] | Ecosystems provide services necessary for the livelihoods and well-being of people. Quantifying and mapping supplies and demands of ecosystem services is essential for continuous monitoring of such services to support decision-making. Area-wide and spatially explicit mapping of ecosystem services based on extensive ground surveys is restricted to local scales and limited due to high costs. In contrast, remote sensing provides reliable area-wide data for quantifying and mapping ecosystem services at comparatively low costs, and with the option of fast, frequent, and continuous observations for monitoring. In this paper, we review relevant remote sensing systems, sensor types, and methods applicable in quantifying selected provisioning and regulatory services. Furthermore, opportunities, challenges, and future prospects in using remote sensing for supporting ecosystem services鈥 quantification and mapping are discussed. |
| [43] | Ecological and conservation research has provided a strong scientific underpinning to the modeling of ecosystem services (ESs) over space and time, by identifying the ecological processes and components of biodiversity (ecosystem service providers, functional traits) that drive ES supply. Despite this knowledge, efforts to map the distribution of ESs often rely on simple spatial surrogates that provide incomplete and non-mechanistic representations of the biophysical variables they are intended to proxy. However, alternative data sets are available that allow for more direct, spatially nuanced inputs to ES mapping efforts. Many spatially explicit, quantitative estimates of biophysical parameters are currently supported by remote sensing, with great relevance to ES mapping. Additional parameters that are not amenable to direct detection by remote sensing may be indirectly modeled with spatial environmental data layers. We review the capabilities of modern remote sensing for describing biodiversity, plant traits, vegetation condition, ecological processes, soil properties, and hydrological variables and highlight how these products may contribute to ES assessments. Because these products often provide more direct estimates of the ecological properties controlling ESs than the spatial proxies currently in use, they can support greater mechanistic realism in models of ESs. By drawing on the increasing range of remote sensing instruments and measurements, data sets appropriate to the estimation of a given ES can be selected or developed. In so doing, we anticipate rapid progress to the spatial characterization of ecosystem services, in turn supporting ecological conservation, management, and integrated land use planning. |
| [44] | In recent years, the assessment of ecosystem services (ES) supply has been based on the use of Land Use/Land Cover (LULC) data as proxies for spatial representation of ecosystems. Nevertheless, some shortcomings of this method, such as uncertainties derived from generalization of the ecosystem types and assumptions of invariance across spatial scales, indicate the need for new approaches. Such approaches could be aimed at improving knowledge of the relationships between ecosystem services and landscape structure and the spatial characteristics of ES patterns. In this study, we propose an integrative approach that involves the generation and analysis of continuous maps representing the supply of five ES potentially related to the amount of biomass. Five remote sensing images of the Northwestern Iberian Peninsula, obtained with Landsat-5 TM, were used to generate a proxy for net primary production by combining the normalized difference vegetation index (NDVI) of each image to calculate a 危NDVI index that could act as a potential indicator of some ecosystem services. This information was combined with three variables 鈥 terrain slope, population density and occurrence of protected areas 鈥 to produce spatial models for the five ES and eventually a series of five supply maps. Food, materials and energy provision services showed a clustered pattern, with high supply values in flat zones and areas with high population densities. In contrast, mass flow and climate regulation services were more widely distributed throughout the study area. The five ecosystem service patterns were analyzed at different scales by two methods: lacunarity and four term local quadrat variance (4TLQV) analysis. These methods revealed differences in the spatial pattern: lacunarity analysis was useful for detection of scale thresholds at the local level, whereas 4TLQV was more sensitive to scale thresholds at larger spatial levels. Thus, the variance analysis yielded higher values for larger windows sizes, particularly for provisioning services. The results demonstrated the suitability of the proposed approach for the spatially explicit modeling of ecosystem services, avoiding the uncertainty of other assessments such as those based on LULC data, and for the exploratory analysis of ES supply from a spatial point of view. |
| [45] | 文章简要总结了中国土地资源利用分区工作,进而提出了中国土地资源利用区划的原则、依据和指标体系,确立了中国土地资源利用区划体系与分级。在此基础上,基于《全国土地利用详查》的分县汇总数据,以分县为单元,把自上而下的定性分析和自下而上的定量归并两种区划途径相结合,在县域土地利用结构类型聚类分析的基础上,承继前人的相关工作,提出了一个由12个土地利用区和67个土地利用亚区构成的中国土地资源利用区划新方案,编制完成中国土地资源利用分区图。该方案首次划分出了东南沿海区和藏东南—横断山区两个土地利用区,与以往的方案相比有所创新和发展;土地利用亚区的划分则强调国土开发的重点地区和土地严重退化或生态脆弱地区,从而更具实用性。 . 文章简要总结了中国土地资源利用分区工作,进而提出了中国土地资源利用区划的原则、依据和指标体系,确立了中国土地资源利用区划体系与分级。在此基础上,基于《全国土地利用详查》的分县汇总数据,以分县为单元,把自上而下的定性分析和自下而上的定量归并两种区划途径相结合,在县域土地利用结构类型聚类分析的基础上,承继前人的相关工作,提出了一个由12个土地利用区和67个土地利用亚区构成的中国土地资源利用区划新方案,编制完成中国土地资源利用分区图。该方案首次划分出了东南沿海区和藏东南—横断山区两个土地利用区,与以往的方案相比有所创新和发展;土地利用亚区的划分则强调国土开发的重点地区和土地严重退化或生态脆弱地区,从而更具实用性。 |
| [46] | <a name="Abs1"></a>Eco-geographic regionalization has been one of the most important topics in China’s regionalization researches since the end of the 20th century. It is a major ecosystem in geographic zonality. A hierarchical system, which is formed by division or combination of natural features based on geographic relativity and comparison of major ecosystem factors (including biological and non-biological) and geographic zonality, is called eco-geographic regional system. This paper introduces process of China’s regionalization development. The first level unit, temperature zone, is delineated with main criteria of temperature. The second level unit, humidity region, is based on criteria of water/moisture states. The third level unit, natural region, is divided according to medium geomorphologic units. Vegetation types and soils are applied as supplementary criteria to indicate temperature and water/moisture states. Mapping process from qualitative to quantitative and China’s eco-geographic regional system are also explained in this paper. |
| [47] | SUMMARY Ecological regionalization is a base for rational management and sustainable utilization of ecosystems and natural resources. It can provide a scientific basis for constructing healthy ecological environments and making policies of environmental management. In this paper, based on synthetic analysis of the characteristics of the ecology and environments of China, the principles of ecological regionalization are discussed, and indices and nomenclature of ecological regionalization are proposed. The ecoregions on a national scale are divided. The results show that there are 3 domains, 13 ecoregions and 57 ecodistricts. The present scheme can be used as a framework for ecosystem assessment and management. Based on the ecoregions, measurements of management for forest, grassland, agriculture and wetland ecosystems are recommended. The experience and information can be used within and beyond the national scale for land-use planning, biodiversity conservation and ecosystem restoration. |
| [48] | <p>根据全国609个气象站1971-2000年的日气象观测资料,遵循地带性与非地带性相结合、发生同一性与区域气候特征相对一致性相结合、综合性和主导因素相结合、自下而上和自上而下相结合、空间分布连续性与取大去小等5个基本原则,在充分吸纳已有气候区划基本理论与区划方法的基础上,参照中国科学院《中国自然地理》编辑委员会制定的气候区划三级指标体系,对我国气候进行重新区划;结果将我国划分为12个温度带、24个干湿区、56个气候区。与先前区划方案相比发现:20世纪70年代以来,中国气候带、区的总体格局并未发生明显变化,但一些重要的气候分界线却出现了一定程度的移动。其中亚热带北界与暖温带北界均出现了北移,北方地区的半湿润与半干旱分界线也出现了不同程度的东移与南扩,同时中温带、暖温带、北亚热带和中亚热带的三级气候区也出现了一定程度的变动;这种变化可能主要是因为20世纪80年代以后我国大多数地区出现不同程度的增暖及北方一些区域出现干旱化而引起的;且与本区划所采用的资料站点和部分区划原则有一定更新有关。</p> . <p>根据全国609个气象站1971-2000年的日气象观测资料,遵循地带性与非地带性相结合、发生同一性与区域气候特征相对一致性相结合、综合性和主导因素相结合、自下而上和自上而下相结合、空间分布连续性与取大去小等5个基本原则,在充分吸纳已有气候区划基本理论与区划方法的基础上,参照中国科学院《中国自然地理》编辑委员会制定的气候区划三级指标体系,对我国气候进行重新区划;结果将我国划分为12个温度带、24个干湿区、56个气候区。与先前区划方案相比发现:20世纪70年代以来,中国气候带、区的总体格局并未发生明显变化,但一些重要的气候分界线却出现了一定程度的移动。其中亚热带北界与暖温带北界均出现了北移,北方地区的半湿润与半干旱分界线也出现了不同程度的东移与南扩,同时中温带、暖温带、北亚热带和中亚热带的三级气候区也出现了一定程度的变动;这种变化可能主要是因为20世纪80年代以后我国大多数地区出现不同程度的增暖及北方一些区域出现干旱化而引起的;且与本区划所采用的资料站点和部分区划原则有一定更新有关。</p> |
| [49] | Conservation-development conflicts are problems that challenge global society and are important issues for conservation ecology research. A redline paradigm has evolved at the central government level in China as a new attempt for better resolution of conservation and development conflicts, including redlines for cropland conservation, forestland conservation and development, prohibited development zones, restricted development zones, and key ecological function zones. However, significant overlaps among these redlines and other land resource demands are key sources of hot debates about practicality. To advance the redline paradigm as a practical resource and environmental management tool, we propose recommendations including (1) strengthening the executive capacity of redline management by rule of law, (2) developing closer collaborations among different governmental sectors, (3) creating multi-source economic incentives through payment schemes for environmental services, and (4) promoting public participation. The advancement of the redline paradigm in China may serve as an example of conflict resolution for other nations. (C) 2013 Elsevier Ltd. All rights reserved. |
| [50] | Many basic questions about the global carbon cycle can be addressing using a modeling approach which links remote sensing, spatial data bases of climate and soils, and mechanistic understanding of atmosphere-plant-soil biogeochemistry. This paper describes the Carnegie-Ames-Stanford approach Biosphere model for study of the terrestrial carbon cycle. 112 refs., 10 figs., 11 tabs. |
| [51] | |
| [52] | |
| [53] | It is now well established that forested catchments have higher evapotranspiration than grassed catchments. Thus land use management and rehabilitation strategies will have an impact on catchment water balance and hence water yield and groundwater recharge. The key controls on evapotranspiration are rainfall interception, net radiation, advection, turbulent transport, leaf area, and plant-available water capacity. The relative importance of these factors depends on climate, soil, and vegetation conditions. Results from over 250 catchments worldwide show that for a given forest cover, there is a good relationship between long-term average evapotranspiration and rainfall. From these observations and on the basis of previous theoretical work a simple two-parameter model was developed that relates mean annual evapotranspiration to rainfall, potential evapotranspiration, and plant-available water capacity. The mean absolute error between modeled and measured evapotranspiration was 42 mm or 6.0%; the least squares line through the origin had as lope of 1.00 and a correlation coefficient of 0.96. The model showed potential for a variety of applications including water yield modeling and recharge estimation. The model is a practical tool that can be readily used for assessing the long-term average effect of vegetation changes on catchment evapotranspiration and is scientifically justifiable. |
| [54] | Conservation priority setting is the critical process of allocating the limited resources available for nature conservation and; safeguarding the sustainability of biodiversity and ecosystem services |
| [55] | Farmland expanded quickly at the expense of natural lands in Argentina since the mid-1950's without consideration of ecological costs. In order to analyze the implications of such changes we aimed to (i) develop a simple biophysical model to estimate the relative (0–100) provision of ecosystem services, (ii) calculate the economic value of food and fiber production derived from farming activities (economic services), and (iii) assess the tradeoffs between the provision of ecosystem and economic services. Land-use/land cover changes were studied through data from agricultural censuses in three historical periods (1956–1960, 1986–1990 and 2001–2005). The model uses biophysical data about biomass, water coverage, slope, soil infiltration capacity, temperature, precipitation and altitude. After testing the consistency of the model, its results were used to assess the relative ecological value of main regions across the country. On the other hand, the annual gross margin per hectare of farming activities was estimated in order to compare 1956–1960 and 2001–2005 periods that greatly differ in their regional farming model. Results showed that different regions respond differently to human intervention, both in economic and ecological terms, and any attempt to apply sole and centralized land-use strategies to different biomes may lead to undesirable outcomes. Economic and ecological criteria should be regionally balanced as a pre-requisite to the application of land-use policies. |
| [56] | |
| [57] | How an apparent static and ordered landscape condition in social ecological landscapes (SELs), can be made sustainable in terms of maintenance and improvement of the provision of ecosystem services (ESs) in face of unpredictable disturbance and change? Our contribution to the Mapping and Assessment of Ecosystem Services (MAES) working group is to advance some recommendations on how to approach the dynamic analysis of complex adaptive systems to improve ecosystem resilience, habitat connectivity and the delivery of ESs. We show exemplary cases where we utilize the NDVI provided by remote sensing to evaluate land cover transformations and processes and ES provisioning. We focus on NDVI because it allows the supply of information on net primary production, i.e., the energetic foundation of nearly all ecosystems and that provides the basis of most of ESs. The use of spectral entropy, and nonlinear analysis of spatial temporal dynamics to investigate trajectory predictability of SELs provide very useful insight into the dynamics of SELs and can assist in the characterization of the links between land cover patterns with ecological processes to support more reliable assessments and accountings of ESs. |
| [58] | |
| [59] | Protists have scarcely been considered in traditional perspectives and strategies in environmental management and biodiversity conservation. This is a remarkable omission given that these tiny organisms are highly diverse, and have performed as key ecological players in evolutionary theatres for over a billion years of Earth history. Protists hold key roles in nearly all ecosystems, notably as participants in fluxes of energy and matter through foodwebs that centre on their predation on microbes. In spite of this, they have been largely ignored in conservation issues due to a widespread, naive belief that protists are ubiquitous and cosmopolitanously distributed. Nevertheless, recent research shows that many protists have markedly restricted distributions. These range from palaeoendemics (Gondwanan-Laurasian distribution) to local endemics. Our ignorance about the ultimate and proximate causes of such acute disparities in scale-dependent distributions of protists can be flagged as a singular reason to preserve these more cryptic participants in ecological and evolutionary dynamics. This argument is disturbing when one considers anthropogenic modifications of landscapes and the very poorly understood roles of protists in ecological processes in soils, not least in agroecolandscapes and hydrological systems. Major concerns include host specific symbiotic, symphoric and parasitic species which become extinct, unseen and largely unknown, alongside their metazoan hosts; change or loss of habitats; massive change or loss of type localities; and losses of unique genetic resources and evolutionary potential. These concerns are illustrated by examples to argue that conservation of protists should be integral to any strategy that traditionally targets vascular plants and animals. The ongoing decline in research capacity to inventory and classify protist diversity exemplifies a most acute symptom of the failures, at local, national and international levels, to support scientific responses to the biodiversity crisis. Responsible responses to these severe problems need to centre on the revival of natural history as the core discipline in biology. |
| [60] | Biodiversity (BD) and Net Primary Productivity (NPP) are intricately linked in complex ecosystems such that a change in the state of one of these variables can be expected to have an impact on the other. Using multiple regression analysis at the site and ecoregion scales in North America, we estimated relationships between BD (using plant species richness as a proxy) and NPP (as a proxy for ecosystem services). At the site scale, we found that 57% of the variation in NPP was correlated with variation in BD after effects of temperature and precipitation were accounted for. At the ecoregion scale, 3 temperature ranges were found to be important. At low temperatures (鈭2.1掳C average) BD was negatively correlated with NPP. At mid-temperatures (5.3掳C average) there was no correlation. At high temperatures (13掳C average) BD was positively correlated with NPP, accounting for approximately 26% of the variation in NPP after effects of temperature and precipitation were accounted for. The general conclusion of positive links between BD and ecosystem functioning from earlier experimental results in micro and mesocosms was qualified by our results, and strengthened at high temperature ranges. Our results can also be linked to estimates of the total value of ecosystem services to derive an estimate of the value of the biodiversity contribution to these services. We tentatively conclude from this that a 1% change in BD in the high temperature range (which includes most of the world's BD) corresponds to approximately a 1/2% change in the value of ecosystem services. |
| [61] | We analyze the contribution of ecosystem services to GDP and use this contribution to calculate an empirical price for ecosystem services. Net primary production is used as a proxy for ecosystem services and, along with capital and labor, is used to estimate a Cobb Douglas production function from an international panel. A positive output elasticity for net primary production probably measures both marketed and nonmarketed contributions of ecosystems services. The production function is used to calculate the marginal product of net primary production, which is the shadow price for ecosystem services. The shadow price generally is greatest for developed nations, which have larger technical scalars and use less net primary production per unit output. The rate of technical substitution indicates that the quantity of capital needed to replace a unit of net primary production tends to increase with economic development, and this rate of replacement may ultimately constrain economic growth. |
| [62] | |
| [63] | A methodological protocol of strategic environmental assessment was developed to incorporate the valuation of ecosystem services in land use plans. The protocol was applied in rural land planning at Balcarce, a department representative of the Southeast Pampas Region (Argentina). The ecosystem services approach was used as valuation criteria of the 14 principal ecosystems classified in the studied area, where agricultural is the predominant economic activity. The provision of seven principal ecosystem services related to regulation functions or food production was estimated for each ecosystem using a set of indicators integrating climatic, vegetation and terrain variables. The assessment of land use changes showed a significant increase in agriculture in the past 20 years, which affected mainly natural grasslands. The environmental impact of this replacement varied according to the ecosystem and the area. Hills and riparian zones were identified as key areas for grassland conservation in order to provide regulation ecosystem services in agricultural landscapes. On the basis of this analysis, a preliminary zoning was proposed, aimed to retain critical support and regulation ecosystem services without significantly sacrificing food production for humans. Strategic environmental assessment based on ecosystem services appears as a powerful tool to prevent negative environmental costs of land use plans which can remain unnoticed under traditional environmental impact assessment techniques. |
| [64] | The rapid global urban growth poses a great risk to the ecosystem services which are vital to sustaining and fulfilling human life. As an essential part of Fuzhou eco-planning task in south-eastern China, we identified the priority conservation areas for ecosystem services to allow a sustainable urban expansion. We modeled and mapped five ecosystem services (carbon storage, timber production, water yield, water-quality improvement and sediment retention) using InVEST and proposed a definition of priority areas for the conservation of ecosystem services. Priority areas for individual ecosystem services showed that 24% of the region was needed to produce 26% of water yield. Between 6 and 17% of the region was required to conserve at least 20% of other four services, depending on the ecosystem service of interest. In addition, scenarios for multiple ecosystem services conservation were developed using the ordered weighted averaging (OWA) method, a multicriteria evaluation method, to take the tradeoffs among ecosystem services into account. The results showed that, along with the decrease of the OWA risk, the overall areas and the areas at both of the conservative levels dropped gradually. Furthermore, two efficiency indices were created to evaluate the performance of different OWA scenarios. Study results suggested that the efficiency of scenarios was associated with the conservation threshold and OWA risk, as well as the spatial correlation among ecosystem services. In sum, identifying priority areas for ecosystem services in a spatially explicit manner, and analyzing tradeoffs between them, can help make land use and natural resource decisions more effective and efficient. |
| [65] | |
| [66] | 生态区划是生态系统和自然资源合理管理及持续利用的基础 ,它可为生态环境建设和环境管理政策的制订提供科学依据。在综合分析我国生态环境特点的基础上 ,探讨了生态区划的原则和依据 ,建立了各级生态区单元划分的指标体系和命名系统 ,最后对我国生态环境进行了区域划分。将我国划分为 3个生态大区、1 3个生态地区和 57个生态区。 . 生态区划是生态系统和自然资源合理管理及持续利用的基础 ,它可为生态环境建设和环境管理政策的制订提供科学依据。在综合分析我国生态环境特点的基础上 ,探讨了生态区划的原则和依据 ,建立了各级生态区单元划分的指标体系和命名系统 ,最后对我国生态环境进行了区域划分。将我国划分为 3个生态大区、1 3个生态地区和 57个生态区。 |
| [67] | 论文采用生态大区—生态地区—生态区三级区划系统,根据气候、地形地貌、生态系统特点等特征的定量与定性指标,采用自上而下逐级划分,将全国划分为了4个生态大区(东北部湿润半湿润生态大区、北部干旱半干旱生态大区、南部湿润生态大区和青藏高原生态大区)、11个生态地区和63个生态区。此一保持县域边界完整性的生态区划方案可为我国生态环境保护和建设、生态环境监测与评价提供依据,命名方面更加注重惯用名称的应用,边界划分保持县域完整性,以便使生态环境的数据能与以县为行政单元统计的社会经济数据更好地融合,有利于生态管理的实施,可为明晰各区域的生态功能定位、保障区域生态安全、国家或区域战略决策、生态资源保育、生态环境保护与建设等提供科学依据。 . 论文采用生态大区—生态地区—生态区三级区划系统,根据气候、地形地貌、生态系统特点等特征的定量与定性指标,采用自上而下逐级划分,将全国划分为了4个生态大区(东北部湿润半湿润生态大区、北部干旱半干旱生态大区、南部湿润生态大区和青藏高原生态大区)、11个生态地区和63个生态区。此一保持县域边界完整性的生态区划方案可为我国生态环境保护和建设、生态环境监测与评价提供依据,命名方面更加注重惯用名称的应用,边界划分保持县域完整性,以便使生态环境的数据能与以县为行政单元统计的社会经济数据更好地融合,有利于生态管理的实施,可为明晰各区域的生态功能定位、保障区域生态安全、国家或区域战略决策、生态资源保育、生态环境保护与建设等提供科学依据。 |
