姚佐文2,,
1.安徽农业大学经济管理学院 合肥 230061
2.淮北师范大学经济与管理学院 淮北 235000
基金项目:国家社会科学基金重点项目(14AKS005)资助
详细信息
作者简介:王辰璇, 主要研究方向为农业资源环境与生态。E-mail: wangcx133@163.com
通讯作者:姚佐文, 主要研究方向为农业资源环境与生态。E-mail: yaozuowen@sina.com
中图分类号:F323.3计量
文章访问数:90
HTML全文浏览量:28
PDF下载量:30
被引次数:0
出版历程
收稿日期:2021-04-10
录用日期:2021-08-20
网络出版日期:2021-08-27
刊出日期:2021-11-10
An analysis of the spatial effect of agricultural science and technology investment on agricultural eco-efficiency
WANG Chenxuan1,,YAO Zuowen2,,
1. School of Economics and Management, Anhui Agricultural University, Hefei 230061, China
2. School of Economics and Management, Huaibei Normal University, Huaibei 235000, China
Funds:This study was supported by the Key Program of the National Social Science Foundation of China (14AKS005)
More Information
Corresponding author:E-mail: yaozuowen@sina.com
摘要
HTML全文
图
参考文献
相关文章
施引文献
资源附件
访问统计
摘要
摘要:农业污染日益严重背景下, 探究农业科技投入对农业生态效率的作用机制, 对缓解农村生态压力、农村健康发展具有重要现实意义。鉴于此, 本文在采用超效率SBM (super-efficiency slack-based measure)模型测度2000—2018年我国东中西部省际农业生态效率基础上, 根据莫兰指数对农业生态效率及农业科技投入进行空间自相关检验, 采用空间计量模型剖析农业科技投入对农业生态效率影响的空间溢出效应与门槛特征。结果表明, 2000—2018年东中西部的农业生态效率呈现东西部高、中部低的态势; 2000—2018年东中西部的农业生态效率波动明显, 2000—2003年有小幅波动, 2004—2008年农业生态效率略有下降, 2008—2010年稍有上升, 2010年农业生态效率为0.731; 之后2011—2014年稍有下降, 2015—2017年全国农业生态效率分别下降到0.5894、0.5839、0.5159; 2018年农业生态效率提升到0.5453。农村科技投入对农业生态效率影响呈现为“倒U”型, 农业科技投入规模对农业生态效率有着显著的溢出效应。东中西部分组面板门槛回归显示: 东中西部的农业科技投入门槛效应差别较大, 东部表现为正向促进作用, 中部农业科技投入对农业生态效率的积极作用没有东部稳定, 西部农业科技投入对农业生态效率表现为负向抑制作用, 中西部地区农业发展中的科技投入要兼顾经济与生态效率。为此, 我国要大力推广绿色高效技术模式, 积极采取有机肥替代化肥行动, 加快实施科学施肥用药技术, 抓好示范带动减量增效, 提高农业生态效率。
关键词:农业科技投入/
农业生态效率/
空间计量模型/
门槛效应
Abstract:With increasingly severe agricultural pollution, it is important to explore the effects of agricultural science and technology investments on agricultural ecological efficiency to alleviate rural ecological pressure and promote the healthy development of rural areas. This study used a super-efficiency slack-based measure (SBM) model to measure the agricultural ecological efficiency of provinces in eastern, middle, and western China from 2000 to 2018. According to the Moran index, the spatial autocorrelation of agricultural ecological efficiency and agricultural science and technology input were analyzed. The spatial spillover effect and threshold characteristics of the impact of agricultural science and technology input on agricultural ecological efficiency were explored by using the spatial econometric model. Results showed that from 2000 to 2018, the agro-ecological efficiency was high in the eastern and western regions and low in the middle region. The agro-ecological efficiency in the eastern, middle, and western regions fluctuated significantly from 2000 to 2018, with slight fluctuations in 2000–2003. Agricultural ecological efficiency declined slightly from 2004 to 2008 and then rose slightly from 2008 to 2010. In 2010, the agricultural ecological efficiency was 0.731, after which it declined slightly from 2011 to 2014. From 2015 to 2017, the national agricultural ecological efficiency dropped to 0.5894, 0.5839, and 0.5159, respectively. In 2018, the annual agricultural ecological efficiency increased to 0.5453. The impact of rural science and technology investments on agricultural ecological efficiency presented as an inverted U-shape, and the scale of agricultural science and technology investments had a significant spillover effect on agricultural ecological efficiency. The panel threshold regression showed that the threshold effect of agricultural science and technology investments in the eastern, middle, and western regions in China differed, and that in the eastern region had a positive promoting effect. The positive effect of agricultural science and technology input on agricultural ecological efficiency in the middle region was not as stable as that in the eastern region. The input of agricultural science and technology in the western region harmed agricultural ecological efficiency. The scientific and technological input in the agricultural development of the middle and western regions of China should consider economic and ecological efficiency. Therefore, China should vigorously promote the green and efficient technology mode, actively replace chemical fertilizers with organic fertilizers, accelerate the implementation of scientific fertilizer application techniques, pay close attention on demonstration, fertilizer reduction and fertilization efficiency, and improve agricultural ecological efficiency.
Key words:Agricultural science and technology investment/
Agricultural ecological efficiency/
Spatial econometric model/
Threshold effect
HTML全文
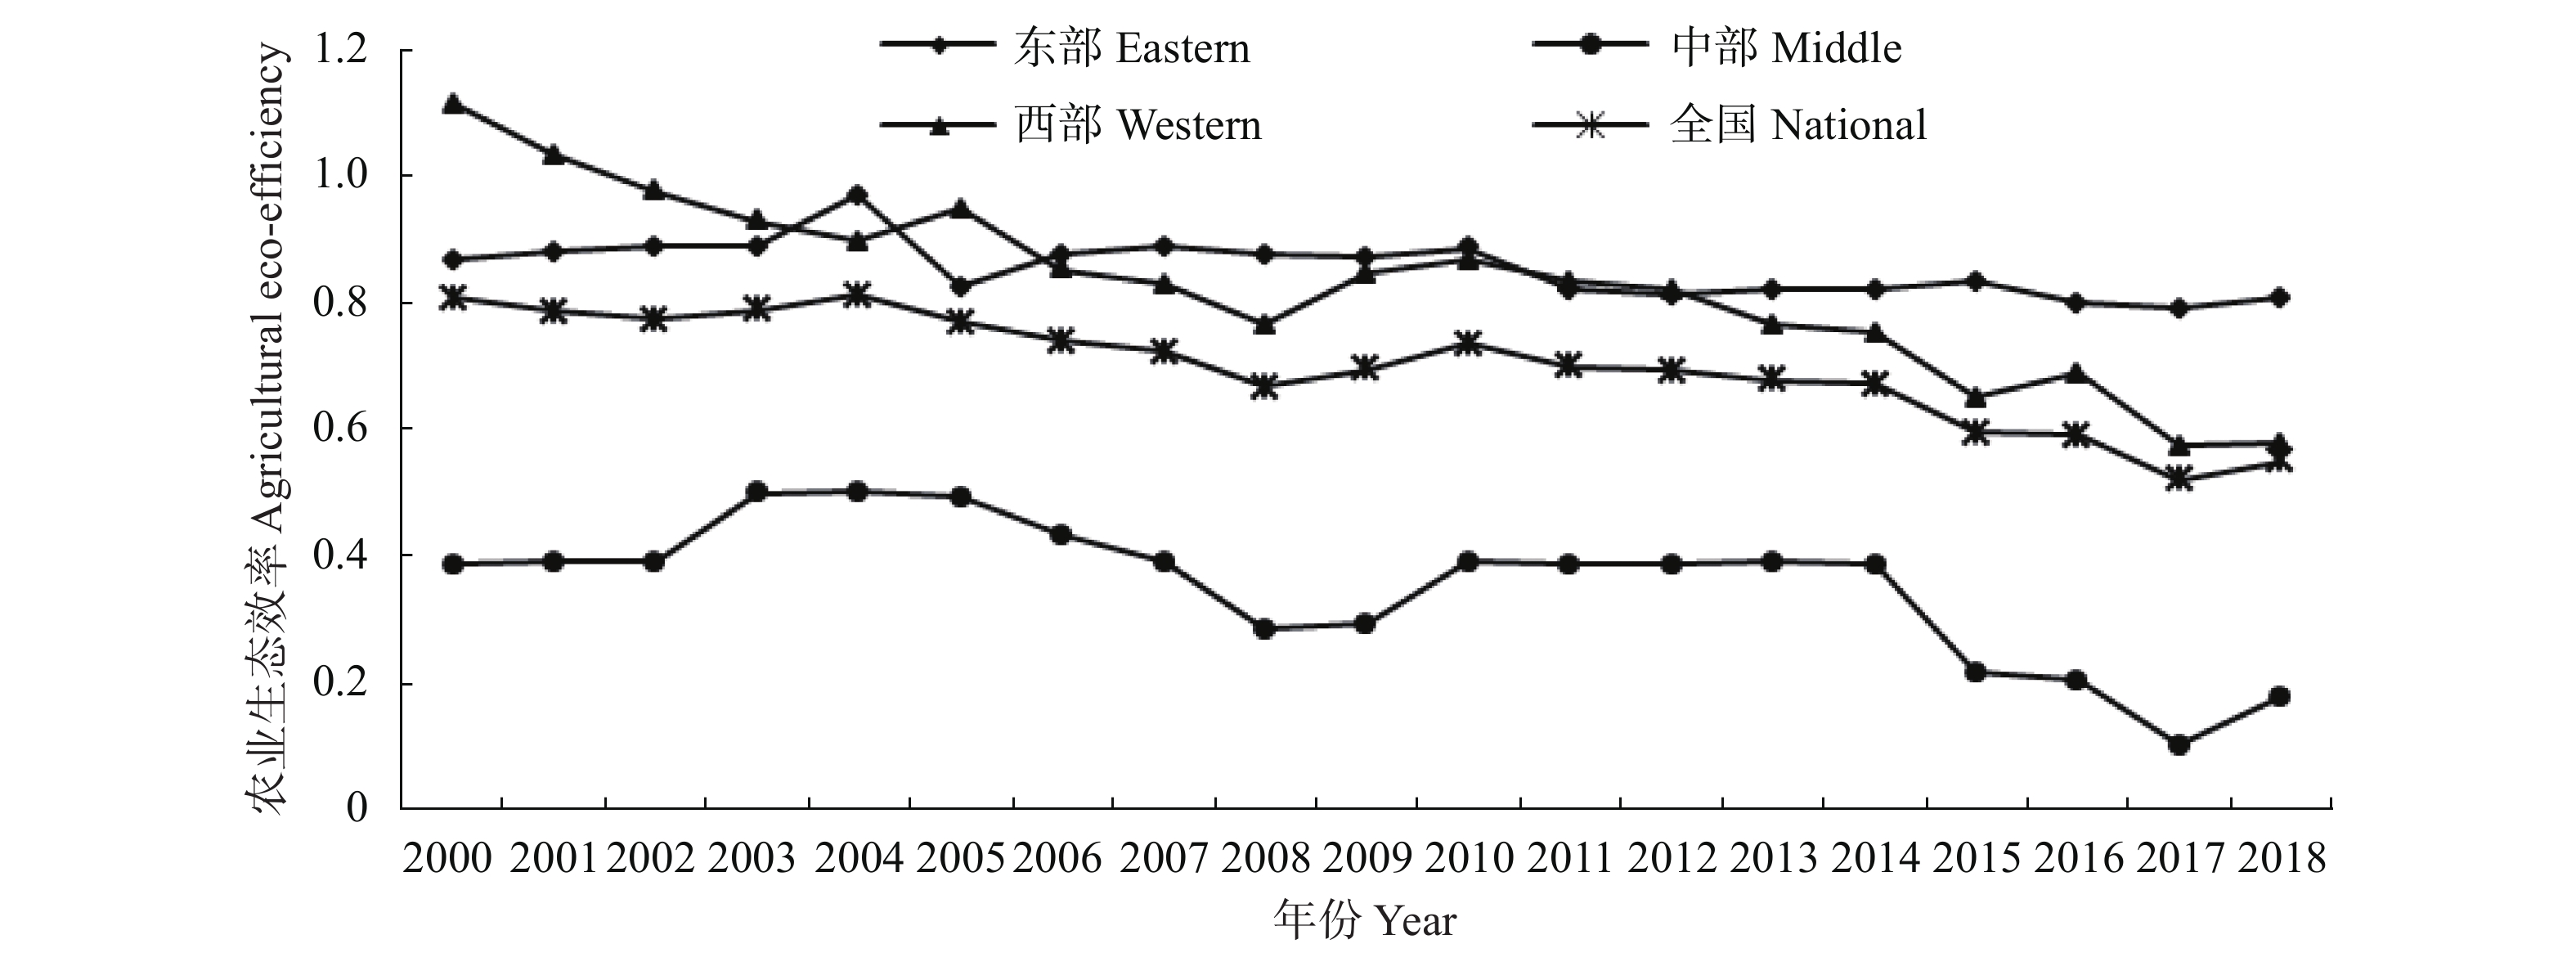
图12000—2018年中国东中西部地区农业生态效率变化
Figure1.Changes of agricultural eco-efficiency in the eastern, middle and western regions of China from 2000 to 2018
 下载: 全尺寸图片幻灯片
表1中国农业生态效率指标体系
Table1.Indexes system of agricultural eco-efficiency in China
| 指标 Index | 变量 Variable | 变量说明 Variable description | 单位 Unit | 备注 Notes |
| 要素投入 Factor input | 机械投入 Mechanical input | 农业机械总动力 Agricultural machinery | ×104 kW | 以农业机械作为农业现代化的代表 With the agricultural machinery as the representative of agricultural modernization |
| 土地投入 Land input | 农作物播种面积 Area sown to crops | km2 | 反映农业生产过程中的耕作面积 Reflecting the actual cultivated area in agricultural production | |
| 劳动力投入 Labor input | 农业从业人员数 Number of agricultural employees | ×104 persons | 农业从业人员数=第一产业从业人员×(农业总产值/农林牧渔业总产值) Number of agricultural employees = employees in the primary industry × (gross output value of agriculture / gross output value of agriculture, forestry, animal husbandry and fishery) | |
| 灌溉投入 Irrigation input | 有效灌溉面积 Effective irrigated area | km2 | 以灌溉用水表征农业主要用水投入 Using irrigation water to represent the main agricultural water input | |
| 化肥投入 Fertilizer input | 施用化肥折纯量 Effective fertilizer | ×104t | 化肥、农药、农膜、柴油等是农业生产中主要的污染源 Fertilizer, pesticide, agricultural film, diesel oil are the main pollution sources in agricultural production. | |
| 农药投入 Pesticide input | 农药使用量 Pesticide use | ×104t | ||
| 农膜投入 Film input | 农膜使用量 Use of agricultural film | ×104t | ||
| 能源投入 Energy input | 农用柴油使用量 Diesel consumption for agricultural use | ×104t | ||
| 期望产出 Expected output | 农业产出 Agricultural output | 农业总产值 Gross output value of agriculture | ×108 ¥ | 按指数(上年=100)折算为2000年不变价 Coverting to invariabl price in 2000 according index (last year =100) |
| 非期望产出 Undesired output | 农业碳排放 Carbon emissions from agriculture | 农业碳排放 Carbon emissions from agriculture | ×104t | 参考李波等[23]的定义 Refer to the definition of LI Bo, et al[23] |
下载: 导出CSV表2农村科技投入与农业生态效率影响的空间计量结果
Table2.Spatial measurement results of the impact of rural scientific and technological input on agricultural eco-efficiency
| 变量 Variable | OLS模型 OLS model | SLM模型 SLM model | SDM模型 SDM model | SEM模型 SEM model | |||||
| 随机效应 Random effect | 固定效应 Fixed effect | 随机效应 Random effect | 固定效应 Fixed effect | 随机效应 Random effect | 固定效应 Fixed effect | ||||
| lnKT | ?0.025 (?0.43) | ?1.094 (?2.17)** | ?2.320 (?2.93)*** | ?1.249 (?1.73)* | ?3.136 (?3.42)*** | ?1.121 (?2.18)** | ?2.366 (?2.97)*** | ||
| lnMII | ?0.414 (?3.39)*** | ?0.131 (?0.66) | ?0.196 (?0.90) | ?0.135 (?0.64) | ?0.223 (?1.04) | ?0.137 (?0.68) | ?0.209 (?0.94) | ||
| lnMCI | 0.355 (4.69)*** | 0.153 (2.71)*** | 0.128 (3.39)*** | 0.144 (2.33)** | 0.0917 (2.07)** | 0.153 (2.72)*** | 0.126 (3.43)*** | ||
| lnCPS | ?0.842 (?9.59)*** | ?0.127 (?0.51) | 0.015 (0.06) | ?0.094 (?0.39) | 0.066 (0.29) | ?0.116 (?0.44) | 0.043 (0.16) | ||
| lnTES | 0.737 (4.64)*** | 0.913 (2.41)** | 1.777 (2.84)** | 1.178 (2.75)*** | 2.152 (3.26)*** | 0.931 (2.41)** | 1.802 (2.88)*** | ||
| ln2TES | 0.035 (2.17)** | ?0.011 (?0.60) | ?0.043 (?2.16)** | 0.014 (0.41) | ?0.041 (?1.26) | ?0.011 (?0.61) | ?0.044 (?2.18)** | ||
| lnADR | 0.101 (1.41) | 0.023 (0.68) | 0.010 (0.27) | 0.016 (0.52) | 0.008 (0.22) | 0.021 (0.61) | 0.004 (0.11) | ||
| W×lnKT | 0.428 (0.42) | 2.579 (2.17)** | |||||||
| W×lnMII | 0.378 (0.63) | 0.756 (1.21) | |||||||
| W×lnMCI | 0.049 (0.62) | 0.078 (0.91) | |||||||
| W×lnCPS | ?1.186 (?1.26) | ?1.369 (?1.59) | |||||||
| W×lnTES | ?0.600 (?0.74) | ?1.702 (?1.58) | |||||||
| W×ln2TES | ?0.028 (?0.58) | 0.045 (0.96) | |||||||
| W×lnADR | 0.188 (1.59) | 0.171 (1.46) | |||||||
| *、**和***分别表示在P<0.1、P<0.05和P<0.01的水平下显著。KT、MII、MCI、CPS、TES和ADR分别代表农业科技投入规模、农业机械强度、复种指数、种植结构、农业科技投入水平和农业受灾率。W为空间权重矩阵。OLS模型(普通最小二乘法)中, 括号内为t统计值; SLM(空间滞后模型)、SDM(空间杜宾模型)、SEM(空间误差模型)中, 括号内为z统计值。*, ** and *** indicate significant at the level of P<0.1, P<0.05, and P<0.01, respectively. KT, MII, MCI, CPS, TES and ADR respectively represent the agricultural technology investment scale, agricultural machinery intensity, multiple cropping index, planting structure, agricultural technology investment level and agricultural disaster rate. W is the spatial weight matrix. In the OLS (ordinary least squares), the t statistic is in parentheses; in the SLM (spatial lag model), SDM (spatial Dobbin model), and SEM (spatial error model), the z statistic is in the parentheses. | |||||||||
下载: 导出CSV表3农村科技投入与农业生态效率影响的空间杜宾模型效应分解结果
Table3.Decomposition results of spatial Dobbin model of the impact of rural science and technology investment on agricultural eco-efficiency
| 变量 Variable | 直接效应 Direct effect | 间接效应 Indirect effect | 总效应 Total effect |
| lnKT | ?3.145(?3.40)*** | 2.493(2.22)** | ?0.652(?0.58) |
| lnMII | ?0.241(?1.24) | 0.757(1.18) | 0.516(0.84) |
| lnMCI | 0.094(1.94)* | 0.075(0.85) | 0.169(1.87)* |
| lnCPS | 0.099(0.40) | ?1.226(?1.48) | ?1.127(?1.36) |
| lnTES | 2.086(2.87)*** | ?1.543(?1.53) | 0.542(0.50) |
| ln2TES | ?0.047(?1.46) | 0.048(1.08) | 0.002(0.06) |
| lnADR | 0.008(0.22) | 0.189(1.75)* | 0.197(1.82)* |
| *、**和***分别表示在P<0.1、P<0.05和P<0.01的水平显著。KT、MII、MCI、CPS、TES和ADR分别代表农业科技投入规模、农业机械强度、复种指数、种植结构、农业科技投入水平和农业受灾率。括号内为z统计值。*, ** and *** indicate significant at the levels of P<0.1, P<0.05, and P<0.01, respectively. KT, MII, MCI, CPS, TES and ADR respectively represent the agricultural technology investment scale, agricultural machinery intensity, multiple cropping index, planting structure, agricultural technology investment level and agricultural disaster rate. The z statistic is in the parentheses. | |||
下载: 导出CSV表4农业科技投入影响农业生态效率的分组面板门槛回归
Table4.Panel threshold regression of the impact of agricultural scientific and technological input on agricultural eco-efficiency
| 变量 Variable | 模型(9) (不含TES平方项) Model (9) (excluding TES square item) | 模型(10) (含TES平方项) Model (10) (including TES square item) | |||||
| 东部 East | 中部 Middle | 西部 West | 东部 East | 中部 Middle | 西部 West | ||
| lnKT | ?1.259 (?4.02)*** | ?5.379 (?5.65)*** | 0.797 (5.09)*** | ?0.849 (?4.63)*** | 1.928 (5.76)*** | 0.980 (0.92) | |
| lnMII | ?0.795 (?2.55)** | 0.559 (1.64) | 0.513 (1.57) | ?0.466 (?2.85)*** | 0.335 (0.81) | ?0.694 (?1.77)* | |
| lnMCI | 0.145 (2.53)** | 0.023 (0.04) | 0.279 (3.69)*** | 0.362 (4.37)*** | 0.120 (0.19) | 0.283 (2.96)*** | |
| lnCPS | ?0.312 (?1.49) | 0.494 (1.83)* | ?1.493 (?3.32)*** | ?0.360 (?2.05)** | ?0.039 (?0.12) | ?2.168 (?3.78)*** | |
| lnTES (τit≤η1) | 1.275 (4.48)*** | 4.958 (5.19)*** | ?1.722 (?6.32)*** | 0.537 (2.89)*** | ?4.359 (?3.06)*** | ?3.503 (?2.32)** | |
| lnTES (η1<τit ≤η2) | 1.194 (4.30)*** | 4.839 (5.09)*** | ?1.878 (?5.60)*** | 0.609 (3.35)*** | ?4.298 (?3.09)*** | ?3.425 (?2.24)** | |
| lnTES (τit>η2) | ?2.025 (?5.52)*** | 0.509 (2.41)** | ?4.185 (?3.05)*** | ?3.644 (?2.33)** | |||
| ln2TES | ?0.065 (?3.20)*** | ?0.185 (?1.63) | ?0.172 (?1.75)* | ||||
| lnADR | 0.066 (1.39) | ?0.010 (?0.08) | ?0.009 (?0.06) | 0.246 (3.77)*** | 0.018 (0.12) | ?0.306 (?1.78)* | |
| *、**和***分别表示在P<0.1、P<0.05和P<0.01的水平显著。KT、MII、MCI、CPS、TES和ADR分别代表农业科技投入规模、农业机械强度、复种指数、种植结构、农业科技投入水平和农业受灾率。τ为门槛变量, η1和η2为估算的门槛值。括号内为t统计值。*, ** and *** indicate significant at the levels of P<0.1, P<0.05, and P<0.01, respectively. KT, MII, MCI, CPS, TES and ADR respectively represent the agricultural technology investment scale, agricultural machinery intensity, multiple cropping index, planting structure, agricultural technology investment level and agricultural disaster rate. τ is the threshold variable, η1 and η2 are the estimated threshold values. The t statistic is in the parentheses. | |||||||
下载: 导出CSV表52000—2018年西部地区农业科技水平门槛区间
Table5.Threshold interval of agricultural science and technology level in the western region of China from 2000 to 2018
| 门槛区间 Threshold interval | 2000—2005 | 2006—2010 | 2011—2015 | 2016—2018 |
| 低 Low (TES≤0.3458%) | ||||
| 中等 Medium (0.3458%<TES≤0.6288%) | 重庆 Chongqing 陕西 Shaanxi 青海 Qinghai | 四川 Sichuan 云南 Yunnan 贵州 Guizhou 甘肃 Gansu, 宁夏 Ningxia 新疆 Xinjiang | ||
| 高 High (TES≥0.6288%) | 重庆 Chongqing 陕西 Shaanxi 青海 Qinghai | 四川 Sichuan 云南 Yunnan 贵州 Guizhou 甘肃 Gansu 宁夏 Ningxia |
下载: 导出CSV参考文献
| [1] | 于法稳. 坚决打好农业面源污染防治攻坚战[N]. 中国环境报, 2020-08-19(3) YU F W. Firmly tackle the key battle of agricultural non-point source pollution prevention and control[N]. China Environment News, 2020-08-19(3) |
| [2] | 聂弯, 于法稳. 农业生态效率研究进展分析[J]. 中国生态农业学报, 2017, 25(9): 1371?1380 NIE W, YU F W. Review of methodology and application of agricultural eco-efficiency[J]. Chinese Journal of Eco-Agriculture, 2017, 25(9): 1371?1380 |
| [3] | SCHALTEGGER S, STURM A. Okologische rationalitat[J]. Die Unternehmung, 1990, (4): 273?290 |
| [4] | 贾琳, 夏英. 农户粮食生产规模效率及其影响因素分析?基于黑、豫、川三省玉米种植户的调查数据[J]. 资源科学, 2017, 39(5): 924?933 JIA L, XIA Y. Scale efficiency of grain production and influencing factors based on survey data from Heilongjiang, Henan and Sichuan[J]. Resources Science, 2017, 39(5): 924?933 |
| [5] | 高鸣, 宋洪远, Michael Carter. 粮食直接补贴对不同经营规模农户小麦生产率的影响?基于全国农村固定观察点农户数据[J]. 中国农村经济, 2016, (8): 56?69 GAO M, SONG H Y, CARTER M. Effect of direct grain subsidy on the productivity of farmers with different scale of operation on the data from household data of fixed observation point in rural China[J]. Chinese Rural Economy, 2016, (8): 56?69 |
| [6] | 钟方雷, 杨肖, 郭爱君. 基于LCA和DEA法相结合的干旱区绿洲农业生态经济效率研究?以张掖市制种玉米为例[J]. 生态经济, 2017, 33(11): 122?127 ZHONG F L, YANG X, GUO A J. Study on ecological economy efficiency of oasis agriculture in arid region based on LCA and DEA method: taking seed maize production in Zhangye City as an example[J]. Ecological Economy, 2017, 33(11): 122?127 |
| [7] | 曹慧, 赵凯. 粮食主产区粮食生产技术效率时空特征分析[J]. 华东经济管理, 2017, 31(12): 82?90 CAO H, ZHAO K. An analysis on the temporal and spatial characteristics of grain production technical efficiency of major grain producing areas[J]. East China Economic Management, 2017, 31(12): 82?90 |
| [8] | 刘蒙罢, 张安录, 文高辉. 长江中下游粮食主产区耕地利用生态效率时空格局与演变趋势[J]. 中国土地科学, 2021, 35(2): 50?60 LIU M B, ZHANG A L, WEN G H. Temporal and spatial pattern and evolution trend of cultivated land use eco-efficiency in the main grain producing areas in the lower Yangtze region[J]. China Land Science, 2021, 35(2): 50?60 |
| [9] | 尚杰, 吉雪强, 陈玺名. 中国城镇化对农业生态效率的影响?基于中国13个粮食主产区2009—2018年面板数据[J]. 中国生态农业学报(中英文), 2020, 28(8): 1265?1276 SHANG J, JI X Q, CHEN X M. Study on the impact of China’s urbanization on agricultural ecological efficiency: Based on panel data of 13 major grain-producing regions in China from 2009 to 2018[J]. Chinese Journal of Eco-Agriculture, 2020, 28(8): 1265?1276 |
| [10] | 吴梵, 高强, 刘韬. 农业科技创新、空间溢出与农业生态效率[J]. 统计与决策, 2020, 36(16): 82?85 WU F, GAO Q, LIU T. Agricultural science and technology innovation, spatial spillover and agricultural eco-efficiency[J]. Statistics & Decision, 2020, 36(16): 82?85 |
| [11] | 洪名勇, 郑丽楠. 中国农业生态效率的区域差异及时空特征研究[J]. 统计与决策, 2020, 36(8): 56?61 HONG M Y, ZHENG L N. Regional differences and spatiotemporal and characteristics of agricultural eco-efficiency in China[J]. Statistics & Decision, 2020, 36(8): 56?61 |
| [12] | 侯孟阳, 姚顺波. 中国农村劳动力转移对农业生态效率影响的空间溢出效应与门槛特征[J]. 资源科学, 2018, 40(12): 2475?2486 HOU M Y, YAO S B. Spatial spillover effects and threshold characteristics of rural labor transfer on agricultural eco-efficiency in China[J]. Resources Science, 2018, 40(12): 2475?2486 |
| [13] | 王宝义, 张卫国. 中国农业生态效率的省际差异和影响因素?基于1996—2015年31个省份的面板数据分析[J]. 中国农村经济, 2018, (1): 46?62 WANG B Y, ZHANG W G. Cross-provincial differences in determinants of agricultural eco-efficiency in China: an analysis based on panel data from 31 provinces in 1996?2015[J]. Chinese Rural Economy, 2018, (1): 46?62 |
| [14] | 王迪, 王明新, 钱中平, 等. 基于超效率SBM和BRT的农业生态文明建设效率分析[J]. 中国农业资源与区划, 2017, 38(11): 94?101 doi: 10.7621/cjarrp.1005-9121.20171113 WANG D, WANG M X, QIAN Z P, et al. Efficiency of agricultural eco-civilization construction based on SBM-undesirable Model and boosting regression tree method[J]. Chinese Journal of Agricultural Resources and Regional Planning, 2017, 38(11): 94?101 doi: 10.7621/cjarrp.1005-9121.20171113 |
| [15] | 于婷, 郝信波. 粮食主产区农业生态效率时空特征及改善路径研究[J]. 生态经济, 2018, 34(9): 104?110 YU T, HAO X B. Evaluation and analysis on the temporal and spatial characteristics of agricultural eco-efficiency of major grain production[J]. Ecological Economy, 2018, 34(9): 104?110 |
| [16] | 刘应元, 冯中朝, 李鹏, 等. 中国生态农业绩效评价与区域差异[J]. 经济地理, 2014, 34(3): 24?29 LIU Y Y, FENG Z C, LI P, et al. Performance and regional difference in Chinese ecological agriculture[J]. Economic Geography, 2014, 34(3): 24?29 |
| [17] | 田伟, 杨璐嘉, 姜静. 低碳视角下中国农业环境效率的测算与分析?基于非期望产出的SBM模型[J]. 中国农村观察, 2014, (5): 59?71, 95 TIAN W, YANG L J, JIANG J. Measurement and analysis of the Chinese agricultural eco-efficiency from the perspective of low carbon: Based on SBM model of the undesirable outputs[J]. China Rural Survey, 2014, (5): 59?71, 95 |
| [18] | 陈新华, 方凯, 刘洁. 科技进步对广东省生态效率的影响及作用机制[J]. 科技管理研究, 2017, 37(1): 82?87 doi: 10.3969/j.issn.1000-7695.2017.01.015 CHEN X H, FANG K, LIU J. Analysis on the impact and mechanism of technological progress on the ecological efficiency of Guangdong Province[J]. Science and Technology Management Research, 2017, 37(1): 82?87 doi: 10.3969/j.issn.1000-7695.2017.01.015 |
| [19] | 严翔, 成长春. 长江经济带科技创新效率与生态环境非均衡发展研究?基于双门槛面板模型[J]. 软科学, 2018, 32(2): 11?15 YAN X, CHENG C C. Research on non-equilibrium relationship between efficiency of regional science & technology innovation and ecological environment in Yangtze River economic zone—based on dual-panel threshold model[J]. Soft Science, 2018, 32(2): 11?15 |
| [20] | 郭莉, Lawrence Malesu, 胡筱敏. 环境技术创新对产业生态管理的影响[J]. 中国人口·资源与环境, 2009, 19(2): 78?82 doi: 10.3969/j.issn.1002-2104.2009.02.014 GUO L, MALESU L, HU X M. Empirical study on the influence of environmental techonology innovation to eco-industrial management[J]. China Population, Resources and Environment, 2009, 19(2): 78?82 doi: 10.3969/j.issn.1002-2104.2009.02.014 |
| [21] | 李冬冬, 许正良, 周慧广. 科技投入对区域生态环境优化的影响评价研究[J]. 现代管理科学, 2013, (5): 63?65, 71 doi: 10.3969/j.issn.1007-368X.2013.05.021 LI D D, XU Z L, ZHOU H G. Study on the impact of science and technology investment on regional ecological environment optimization[J]. Modern Management Science, 2013, (5): 63?65, 71 doi: 10.3969/j.issn.1007-368X.2013.05.021 |
| [22] | 孟凡生, 邹韵. 中国生态能源效率时空格局演化及影响因素分析[J]. 运筹与管理, 2019, 28(7): 100?107 MENG F S, ZOU Y. Analysis of spatial-temporal pattern evolution of ecological energy efficiency in China and its influencing factors[J]. Operations Research and Management Science, 2019, 28(7): 100?107 |
| [23] | 李波, 张俊飚, 李海鹏. 中国农业碳排放时空特征及影响因素分解[J]. 中国人口·资源与环境, 2011, 21(8): 80?86 doi: 10.3969/j.issn.1002-2104.2011.08.013 LI B, ZHANG J B, LI H P. Research on spatial-temporal characteristics and affecting factors decomposition of agricultural carbon emission in China[J]. China Population, Resources and Environment, 2011, 21(8): 80?86 doi: 10.3969/j.issn.1002-2104.2011.08.013 |
| [24] | 吕屹云, 蔡晓琳. 农业科技投入、区域经济增长与农民收入关系研究?以广东省4个区域为例[J]. 农业技术经济, 2020, (4): 127?133 LYU Y Y, CAI X L. Research on the relation between agricultural science and technology investment, regional economic growth and farmers’ income in Guangdong Province[J]. Journal of Agrotechnical Economics, 2020, (4): 127?133 |
| [25] | HANSEN B. Threshold effects in non-dynamic panels: estimation, testing and inference[J]. Journal of Econometrics, 1999, 22(2): 345?368 |
