HTML
--> --> -->In the summer of 2020, the Northwestern Pacific subtropical high (NWPSH) was enhanced, southwestwardly stretched, and was consistently centered around 20°N during July. Meanwhile, the mid-latitude region was dominated by a trough along the East Asian coast, allowing cold air activities to continuously intrude southward. This combination resulted in a persistent mei-yu front and the genesis of frequent rainstorms along the YRV (Liu and Ding, 2020; Ding et al., 2021). The YRV was dominated by warm mei-yu fronts from middle to late June and by cold fronts from early to middle July, which was caused by the phase of the North Atlantic Oscillation (NAO) changing from positive to negative (Liu et al., 2021). Regarding the enhanced and southwestwardly shifted NWPSH in 2020 mei-yu season, previous studies have well documented the role of a basin-wide Indian Ocean warming in the early summer of 2020 that was forced by a record strong Indian Ocean Dipole (IOD) event in 2019 (Takaya et al., 2020; Ding et al., 2021; Zhou et al., 2021). This IOD deepened the thermocline by a record 70 m in late 2019, helping to sustain an Indian Ocean warming through the 2020 summer, thus forcing an anomalous anticyclone in the lower troposphere over the Indo-Northwest Pacific region (Zhou et al., 2021).
Moisture transport is one of the important factors which modulate rainfall intensity. Previous studies highlighted the importance of moisture convergence and moisture transport pathways toward the mei-yu rainband that ultimately resulted from circulation anomalies (Zhou and Yu, 2005; Sampe and Xie, 2010). In the 2020 mei-yu season, the strengthened southwesterly low-level jet transported more moisture from the tropical Indian Ocean and Northwest Pacific Ocean into the YRV (Takaya et al., 2020; Wang et al., 2020; Liu et al., 2021). However, the water vapor flux only shows pathways of moisture transport, but cannot identify the sources and sinks of water vapor.
Moisture tracking using Lagrangian models provides a useful tool to identify the origins of water that falls during extreme precipitation events and to establish a moisture source-sink relationship (Peng et al., 2020; Gimeno et al., 2012). The moisture sources for the YRV rainfall exhibit remarkable seasonal variations because of the East Asian monsoon, which causes moisture originating from the Bay of Bengal and from the South China Sea to cross into intermediate areas of land during June and July (Wei et al., 2012; Guo et al., 2019). The summer rainfall in the lower reaches of the YRV is positively correlated with the strength of the moisture sources from the Indian subcontinent, the Bay of Bengal, and the South China Sea at interannual time scales, but are statistically insignificant at 95% confidence level (Hu et al., 2021). So far, the amount of moisture supply and the details among the transport processes for the 2020 YRV mei-yu rainfall is still unknown. The basic questions we address in this study are: Where did the moisture of the record-breaking 2020 YRV mei-yu rainfall come from? Which source origins were most important for the 2020 summer? What moisture transport processes contributed to the source origin anomalies in 2020?
The remainder of this paper is organized as follows: Section 2 introduces the moisture tracking methodology and dataset used in this study. Section 3 presents the main results including moisture origins of YRV rainfall during the 2020 mei-yu season, moisture transport processes, and the extreme moisture source supply in 2020. Finally, a summary and discussion are given in section 4.
2.1. FLEXPART moisture tracking
In this study, the Lagrangian model FLEXPART v9.02 (Stohl et al., 2005) was employed to determine the moisture origins and to analyze the moisture transport processes for precipitation in the 2020 mei-yu season. We performed the FLEXPART simulation with the global Climate Forecast System Reanalysis (CFSR) dataset forward in time by six-hour time steps for the period of 1979–2020. The six-hourly (CFSR) Version 1 for 1979–2010 and Version 2 for 2011–20 from the National Centers for Environmental Prediction (NCEP) at a horizontal resolution of 0.5° × 0.5° (Saha et al., 2014) were used to run the FLEXPART model. The variables used in the FLEXPART model were dewpoint temperature, land cover, planetary boundary layer height, and the water equivalent of accumulated snow depth at the single level, and the geopotential height, pressure, relative humidity, air temperature, horizontal and vertical wind fields at 37 levels from the surface to top of the atmosphere (1000 hPa–1 hPa).The “domain-fill” mode was activated and one million air-particles were released evenly in the global atmosphere. Several variables (latitude, longitude, altitude, specific humidity, and air mass among many others) of each particle moving with the circulation were recorded every six hours. The moisture source diagnostic from Sodemann et al. (2008) was employed to estimate the moisture contributions from each source region to the precipitation falling in the target area. For this method, moisture changes in an air-particle during a certain time interval (

where m and q denote the air mass and specific humidity of the air-particle.
The average period of residence of water vapor in the atmosphere is 10 days (Trenberth, 1998; Numaguti, 1999). Thus, all air-particles that precipitated over the target region are selected to be tracked backward for 10 days. For each back-trajectory, the moisture-uptake location is identified as moisture origin if


The Lagrangian method ensures the tracking of an individual fluid particle as it originates from the source region and moves through space and time. The backward trajectories from the study region can be used to infer the origins of air masses. By diagnosing the detailed moisture budget along the trajectories, we can obtain the following moisture transport processes: 1) how many air-particles from each source origin arrive at the target region, 2) how much water vapor precipitates out during transport, and 3) how much water vapor is carried by the air-particle. Generally, if more particles from a source region lose less or collect more water during the transport, the air-particles can carry more water when arriving at the target region, and heavier precipitation can be expected, which illustrates an above-normal moisture contribution from this source origin. Thus, in this study, we used three metrics to interpret the moisture transport processes, i.e., the moisture trajectory count or density, the water content carried by each air-particle, and the backward-integrated evaporation minus precipitation (e–p) of all the target air-particles before reaching YRV.
Trajectory density indicates the amount of moisture transport pathways by summing up the trajectory numbers, thus representing the movement of air-particles, and reflects upon the influence of the large-scale circulation (Alexander et al., 2015; Zhong et al., 2019). The mean water content or specific humidity of the tracked air-particles before reaching the study region provides information for the water-holding capacity of the air-particles. The target air-particles may have released or collected moisture over the regions dominated by either precipitation or evaporation process. “e–p”[expressed in terms of kg (6 h)?1] reflects the moisture changes in the air particle at a gridpoint, reflecting the release or collection of moisture. By analyzing e–p along the back-trajectories, if e–p > 0 (e–p < 0), it means a region is dominated by evaporation (precipitation) and can be regarded as a moisture-source (-sink) region. The stronger the moist convection in the source region, the more water loss and the smaller local e–p, and vice versa.
2
2.2. Datasets
The remaining datasets aside from the ones used for moisture tracking in this study include: (1) The Global Precipitation Climatology Project (GPCP) Version 2.3 monthly precipitation for 1979–2020 (Adler et al., 2003) —this consists of a merged analysis of precipitation estimates from satellite data and surface rain gauge observations, (2) the observed daily precipitation over China from 666 stations collected by the National Meteorological Information Center at the China Meteorological Administration, and (3) the 850 hPa wind and surface temperature data from the European Centre for Medium-range Weather Forecasts Reanalysis version 5 (ERA-5) at a horizontal resolution 0.25° × 0.25° (Hersbach et al., 2019).3.1. Moisture origins of the precipitation in the 2020 mei-yu season
For the climate mean of the mei-yu season (June?July), the precipitation is centered over the YRV ( > 8 mm d?1), with a general decrease in precipitation from southeast to northwest over China (Fig. 1a). We can clearly deduce three main moisture transport pathways to the YRV. The first one concerns the transport by southwesterly monsoon circulation, bringing moisture from the Indian Ocean across the Arabian Sea, the Bay of Bengal, and Southwest China into the YRV. The second one is transported by low-level southeasterly winds of the southwest edge of the NWPSH, carrying moisture from the Western Pacific Ocean, through the South China Sea, and over South China to the YRV. The last branch is transported by the mid-latitude westerlies, carrying moisture from the Eurasian continent to the YRV (Fig. 1a). In 2020, the YRV received above-normal precipitation—about twice the climate mean precipitation amount with the maximum occurring on the lower reaches of the Yangtze River. Anomalous moisture was consistently transported into the YRV from the Bay of Bengal, the Northwestern Pacific Ocean, the mid-latitudes, and even from the Northeast Pacific Ocean in the 2020 mei-yu season (Fig. 1b), with a broad anticyclonic circulation anomaly located to the south of the YRV.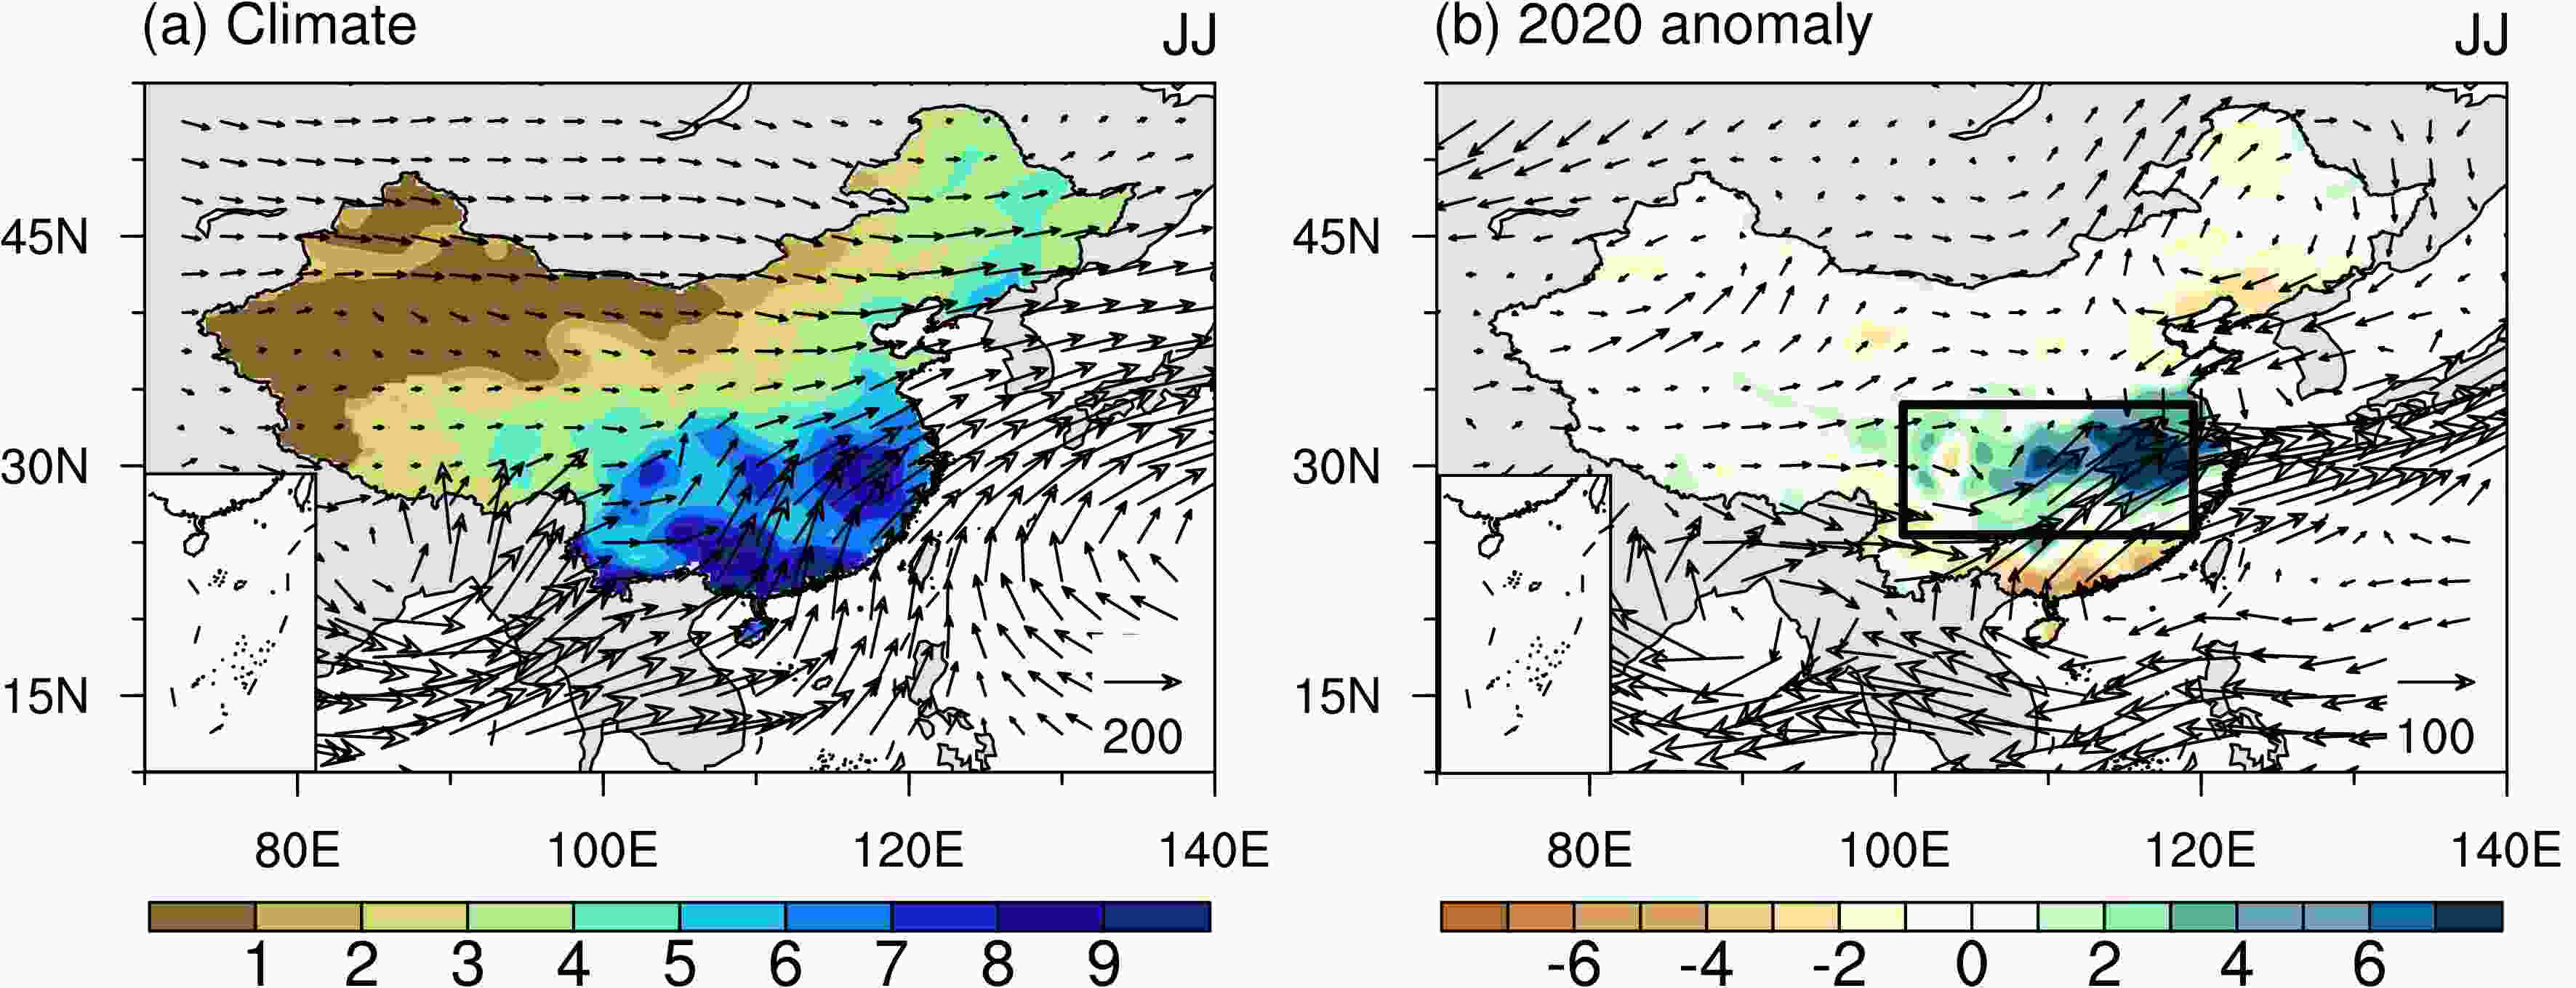 Figure1. (a) Spatial distribution for the climatological mei-yu season (June?July) precipitation (shading, mm d?1) derived from the station observations and vertically integrated moisture transport (vector, kg m?1 s?1) for the period 1979–2019. (b) Same as (a), but for the anomalies in 2020 relative to the climate mean of 1979–2019.
To better track the moisture origins and to characterize the long-distance moisture transport, we showed 50 clustered trajectories of all air-particles that reached YRV during the mei-yu season for 1979–2019 from their starting locations 10-day prior (Figs. 2a, b). The three pathways of moisture transport to the YRV can be clearly seen in Figs. 2a, b. The air-particles from the Eurasian continent are mainly transported in the mid-troposphere (6–9 km above sea level) by the mid-latitude westerlies, while those from the other pathways travel in the lower troposphere (< 2 km) (Fig. 2a). The specific humidity of air-particles from tropical monsoon regions (> 7.5 g kg?1) is higher than that from the mid-latitude Eurasian continent (< 2.5 g kg?1) (Fig. 2b). Furthermore, we can also identify two other moisture origins, i.e. the local evaporation and moisture from Northeast China. To quantitatively account for the moisture contributions from different origins, the moisture origins are separated into five sectors according to the trajectories of the air-particles reaching the YRV. They are the West Pacific Ocean (WPO), the Indian monsoon region (IND), the Eurasian Continent (EAC), Northeast Asia (NEA), and the local region under study (YR), respectively (Fig. 2c). The first three regions are relevant to the three main moisture transport branches.
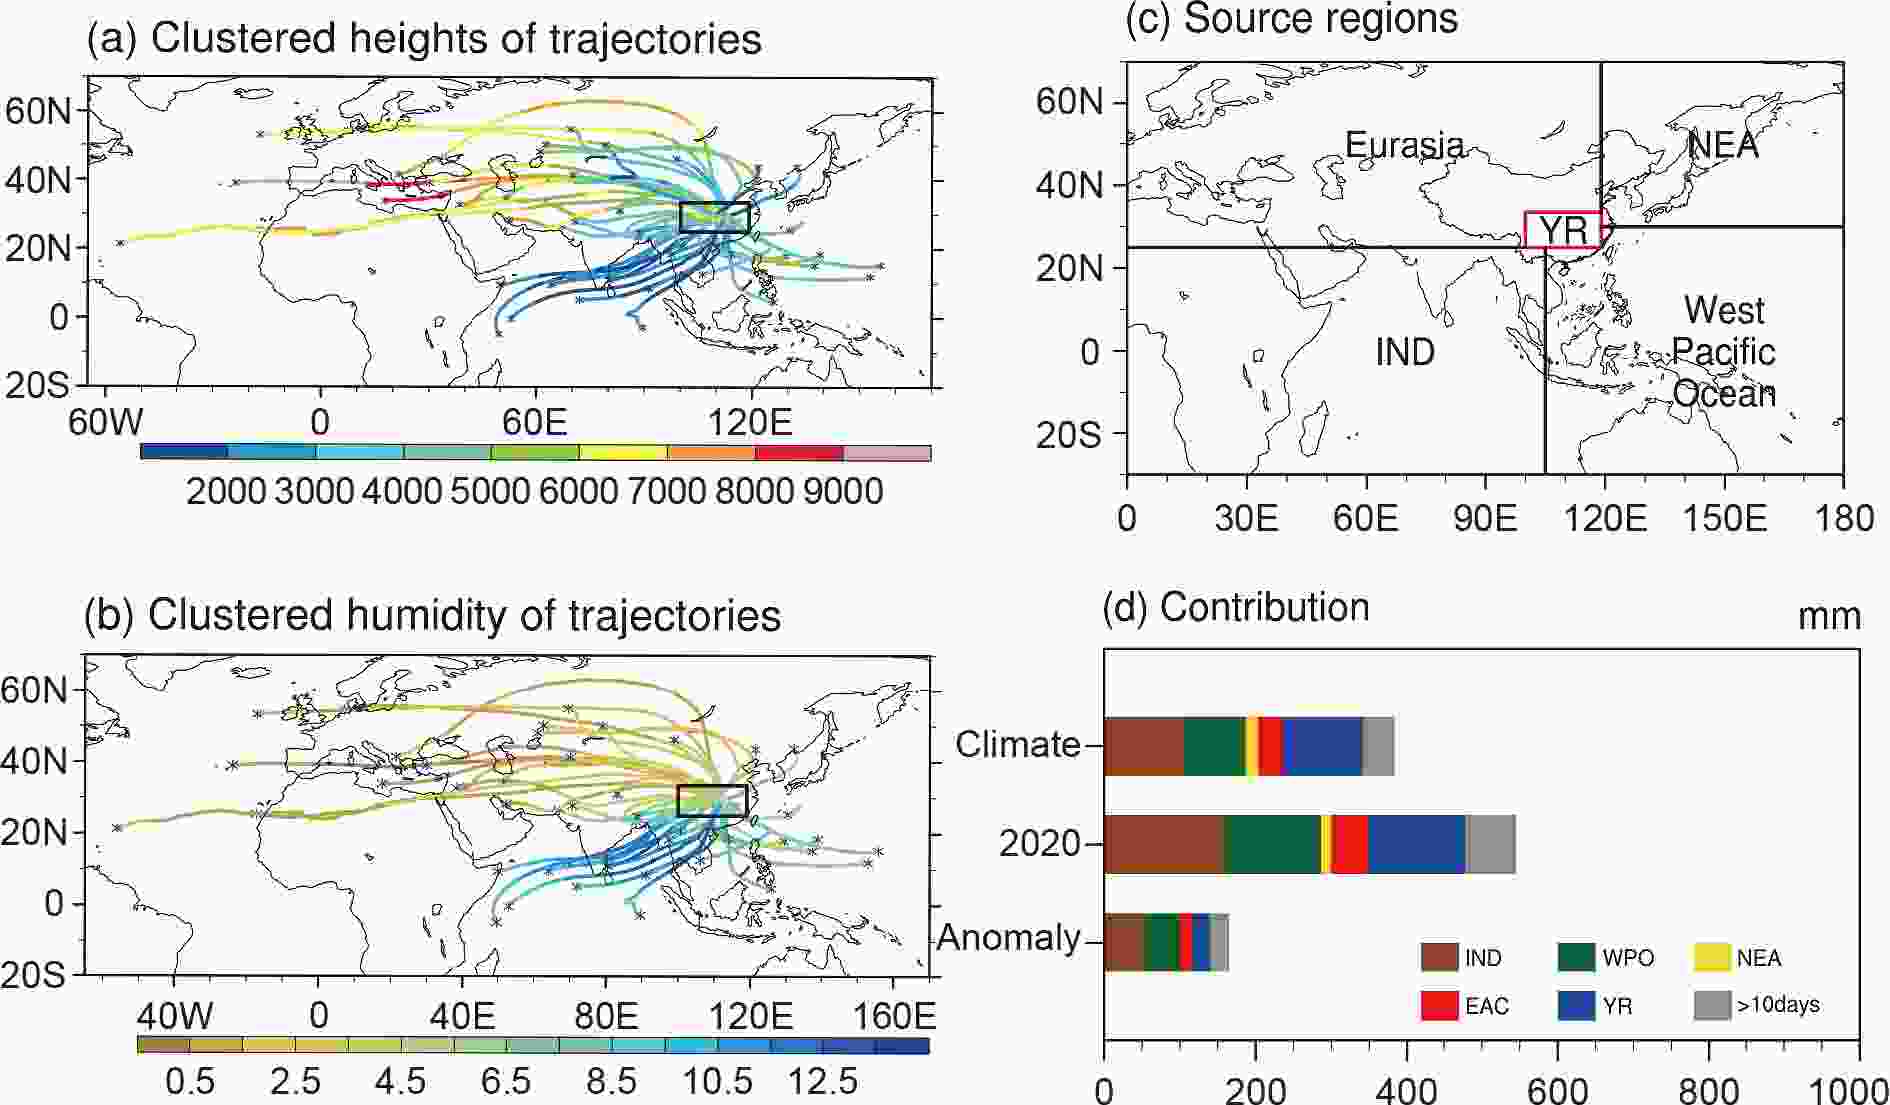 Figure2. (a)?(b) Show the 50 clustered trajectories of air-particles reaching the YRV. The asterisks indicate the initial locations 10 days prior to arriving in the YRV. (a) Temporal evolution in the height of the trajectories for every 6 h during the 10-day particle transit according to backward trajectories. Height is given in meters above sea level (units: m). (b) Same as (a), but for the specific humidity (units: g kg?1) along the trajectories. (c) Division of the moisture-source sectors. Black and red lines divide the moisture source into five sectors, the West Pacific Ocean (WPO), the Indian monsoon region (IND), the Eurasian Continent (EAC), Northeast Asia (NEA), and YRV (YR). (d) Tracked moisture contribution (units: mm), area-averaged over each sector for the precipitation over the YRV during the mei-yu season, for the climate mean, 2020, and the anomaly observed in 2020. The brown, green, yellow, red, and blue bars indicate the accumulated tracked moisture from the IND, WPO, NEA, EAC, and YR over the 10 back-tracking days, respectively. The grey bars indicate the total contributions from atmospheric moisture that existed 10 days prior.
We estimated moisture sources for the YRV precipitation using the diagnostic from Sodemann et al. (2008) [Eq. (3?7)]. The quantitative contributions from each source origin for climate mean and 2020 are shown in Fig. 2d. The climate mean of YRV mei-yu precipitation is 383 mm averaged over 1979–2019. The accumulated tracked-moisture from all source regions for the 10-days prior is 341 mm, accounting for 89% of the total precipitation amount. This implies that the tracked moisture source, accumulated from the back-tracked 10-day air-particle trajectory analysis, can explain 89% of the climate mean mei-yu precipitation, and further infers that the residual moisture (11%) must have originated from a moisture source more than 10 days prior. There are three major moisture sources, and two of them make almost equal contribution—one is from the IND, which is 105.2 mm, contributing to 27.5% of the total mei-yu precipitation over the YRV, and the other from the local evaporation recycling (105.1 mm, 27.4%). They are followed by WPO (81.6 mm, 21.3%). The moisture source from EAC and NEA are quite small, only 32.5 mm (8.5%) and the NEA (16.8 mm, 4.4%) (Fig. 2d), respectively. In the 2020 mei-yu season, the tracked moisture accounted for 88% of the total mean, comparable to that of the climate mean. Above-normal contributions were seen from all sectors in 2020, except the NEA (second and third row in Fig. 2d). Moisture sources from the IND (159.8 mm) and WPO region (129.4 mm) dominated the moisture anomalies in 2020, which were 52% and 58.6% greater than their climate mean, respectively.
The spatial distributions of moisture sources for the climate mean and 2020 YRV precipitation are further shown in Fig. 3. Moisture sources for the YRV mei-yu precipitation cover the northern Indian Ocean, the Indian continent, the Tibetan Plateau, the Northwestern Pacific, the mid-latitude Eurasian Continent, and also the target study region. It is generally true that the closer the source is to the YRV, the greater the contribution (Fig. 3a). The maximum contribution (for the climate mean) at a grid-scale is about 2.2 mm located in the YRV (Fig. 3a). Compared with climate mean, the moisture source from local evaporation and monsoon regions, in 2020, was much more than normal, with the maximum contribution located over South China and South China sea region (about 4.5 mm) (Fig. 3b). Thus, a general positive anomaly in moisture source was seen in 2020, centered in South China and the South China Sea (Fig. 3c). The anomalous moisture contributions from the IND and WPO in 2020 were greater than one standard deviation above the mean of the 1979–2019 climatology.
 Figure3. Spatial patterns for the tracked moisture contribution (units: mm) for the YRV in the mei-yu season: (a) climate mean for 1979?2019, (b) 2020, (c) anomalies in 2020 relative to the climate mean. The number in the middle of each plot denotes the accumulated tracked moisture source or tracked evaporation, and the numbers in the parentheses represent the contribution from the accumulated moisture source to the regional precipitation. “Local” in (a)?(b) denotes the precipitation origins from the evaporation over the YRV, i.e., recycled precipitation.
We also examined the daily evolution of the moisture source from each sector from 1 June to 31 July for climate mean and 2020 (Fig. 4). The climate mean daily precipitation over YRV ranges from 6 to 8 mm d?1 during the mei-yu season (Fig. 4a). Before 15 June, the local evaporation dominates the climatological moisture source, contributing about 2.0 mm d?1, followed by the moisture sources from the IND (1.0–2.0 mm d?1) and the WPO (1.0–1.5 mm d?1). However, from mid-June to mid-July, the moisture source from the IND is the largest, about 0.5 mm d?1 higher than that from either WPO or local evaporation. By mid-late July, the primary moisture source is from the WPO, followed by that from local evaporation and the IND. The climatological contribution from EAC (0.3–0.7 mm d?1) and NEA (0.2 mm d?1) is much smaller and remains stable during the whole mei-yu season. In 2020, the moisture source from the IND and WPO was the largest, demonstrating the dominant role of moisture originating from tropical oceans in the 2020 YRV record-breaking mei-yu precipitation event.
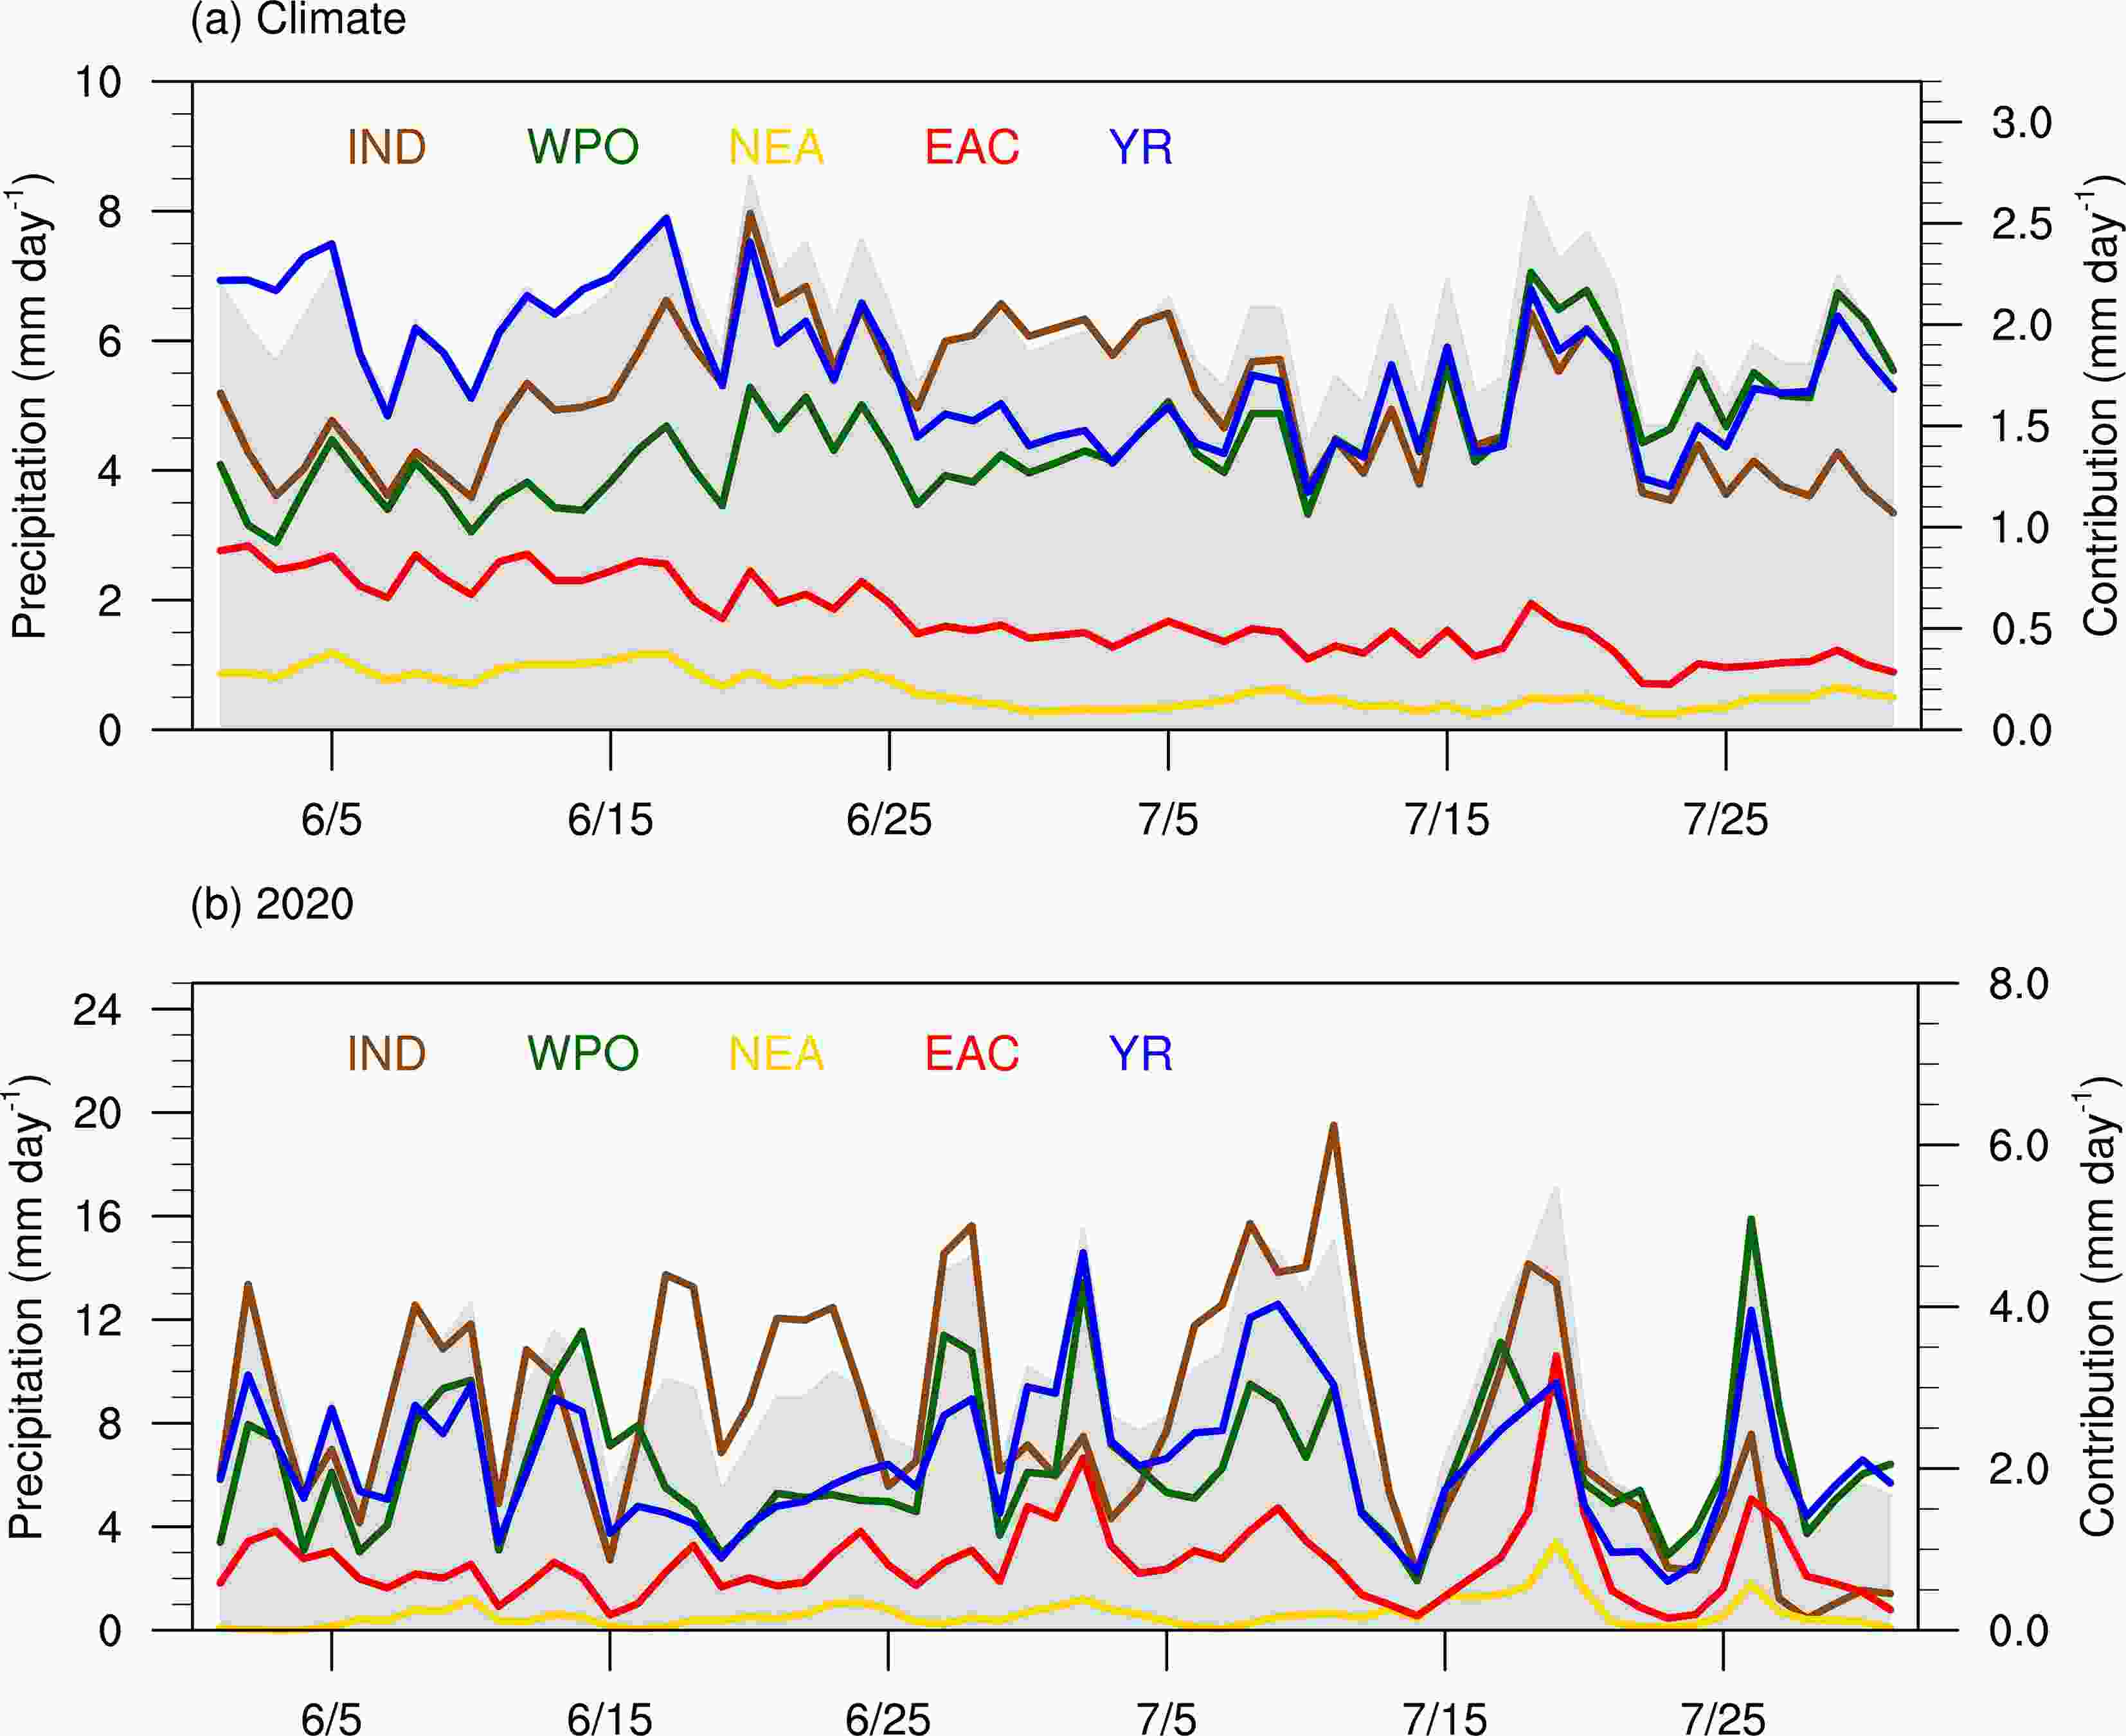 Figure4. Daily evolution of the moisture contributions (right y-axis, units: mm d?1) from different source sectors from 1 June to 31 July for (a) the climate mean, and (b) 2020. The grey shading is the daily precipitation (left y-axis, units: mm) area-averaged over the YRV using the station precipitation dataset. The brown, green, yellow, red, and blue bars indicate the accumulated tracked moisture from the IND, WPO, NEA, EAC, and YR over the 10 back-tracking days, respectively.
To quantitatively illustrate how extreme the moisture source was in 2020, we calculated the moisture contribution from each of the five sectors in each year from 1979 to 2019 and showed them in a probability distribution function (PDF) (Fig. 5). For the climate mean of 1979–2019, the moisture source from YR, WPO, and IND shows comparable magnitudes, ranging from 70 mm to 140 mm. As for 2020, the moisture contribution from the IND and WPO was 159.8 and 129.4 mm, respectively, both of which were the greatest values observed in the 41-year record. The moisture from YR and EAC were among the top 5% of events for 1979–2019 but didn’t exceed the historical record. To explore how moisture origins contributed to the record-breaking mei-yu rainfall in 2020, we will interpret the source-sink relationship of atmospheric water vapor during transport by using the trajectory information in the following section.
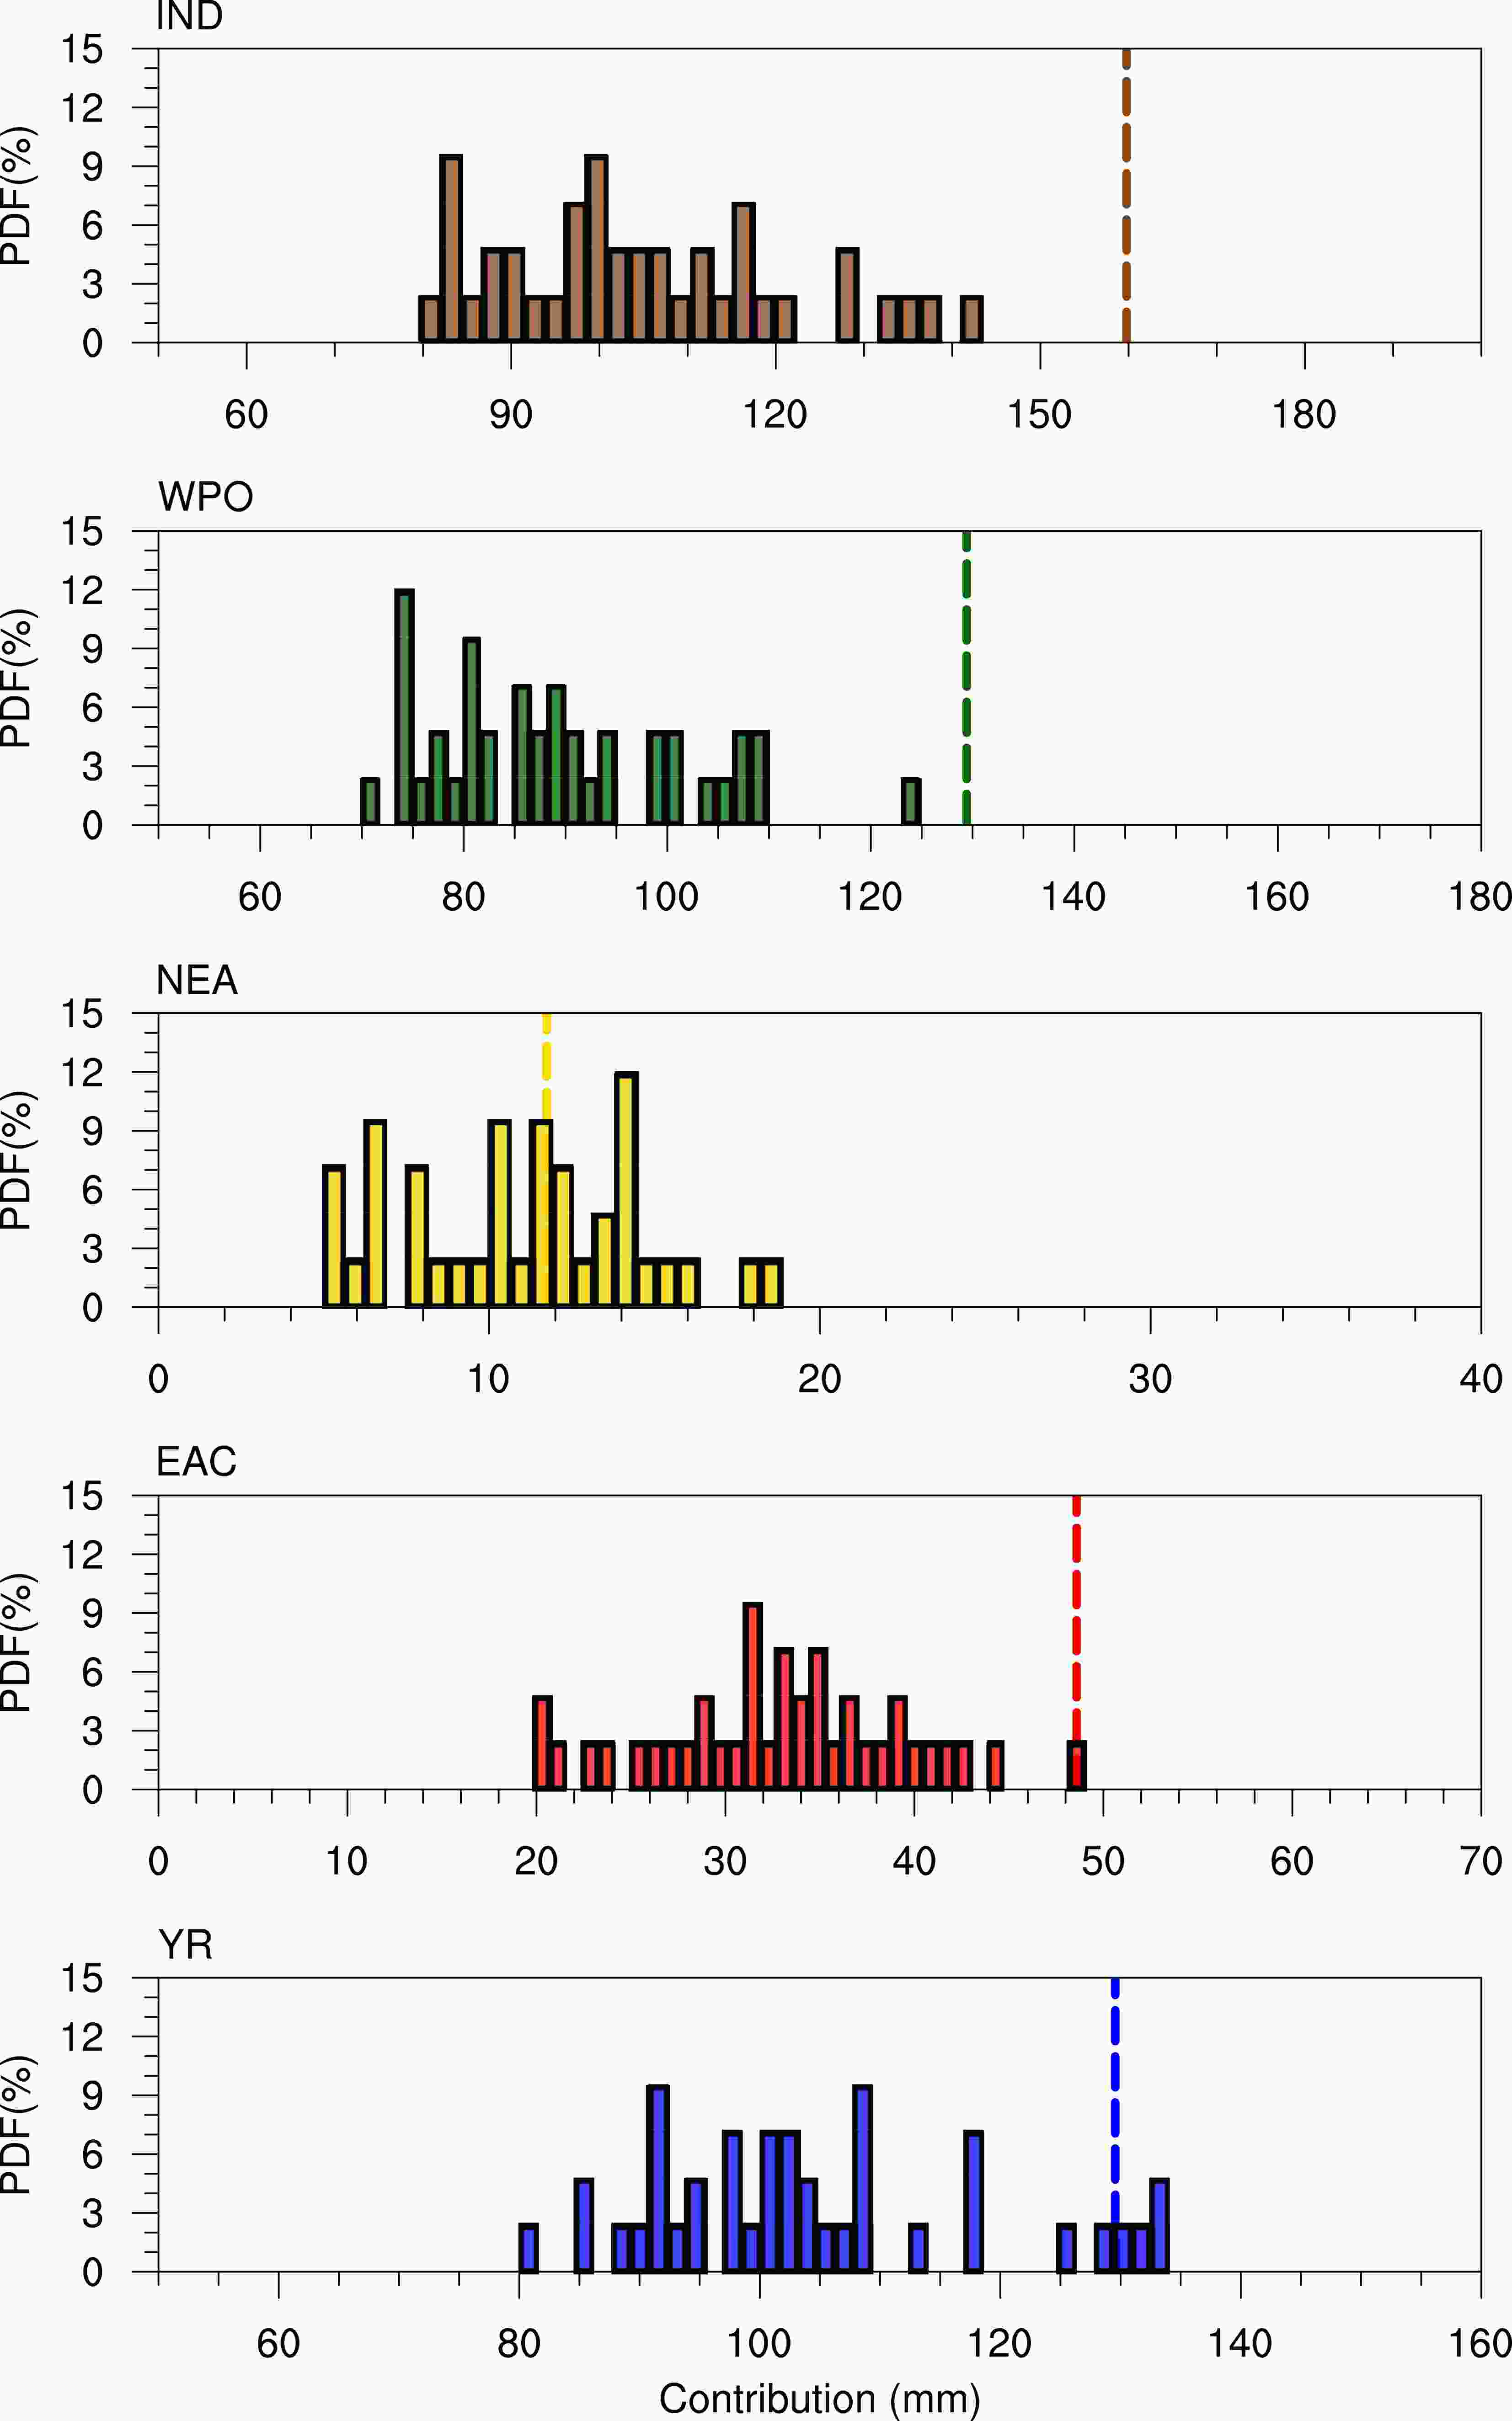 Figure5. PDF distribution of the moisture contributions (units: mm) area-averaged over each sector, for each year of 1979–2019. The vertical lines are the results for 2020 in each sector.
2
3.2. Moisture transport processes for the 2020 YRV mei-yu Rainfall
In this section, we will interpret the moisture transport processes by examining the moisture trajectory density, moisture content carried by the tracked particles, and the backward-integrated e–p of all the target air-particles at grid-scale before reaching the YRV. The climate mean moisture trajectory density during the mei-yu season averaged for 1979–2019 is shown first in Fig. 6. High moisture trajectory density is shown over the target study region, the Bay of Bengal, and the South China sea (Fig. 1a). In 2020, the trajectory density showed obvious increases compared to the climate mean of 1979–2019, with anomalies centered in the Bay of Bengal, Southeast Asia, the WPO, and the YRV (Figs. 6b, c). The positive anomalies south of the YRV were above one standard deviation greater than the mean of the data extracted from the 1979–2019 climatology. The higher trajectory density south of the YRV demonstrates that more air-particles were transported from the Indian monsoon pathway and the Northwestern Pacific pathway in 2020.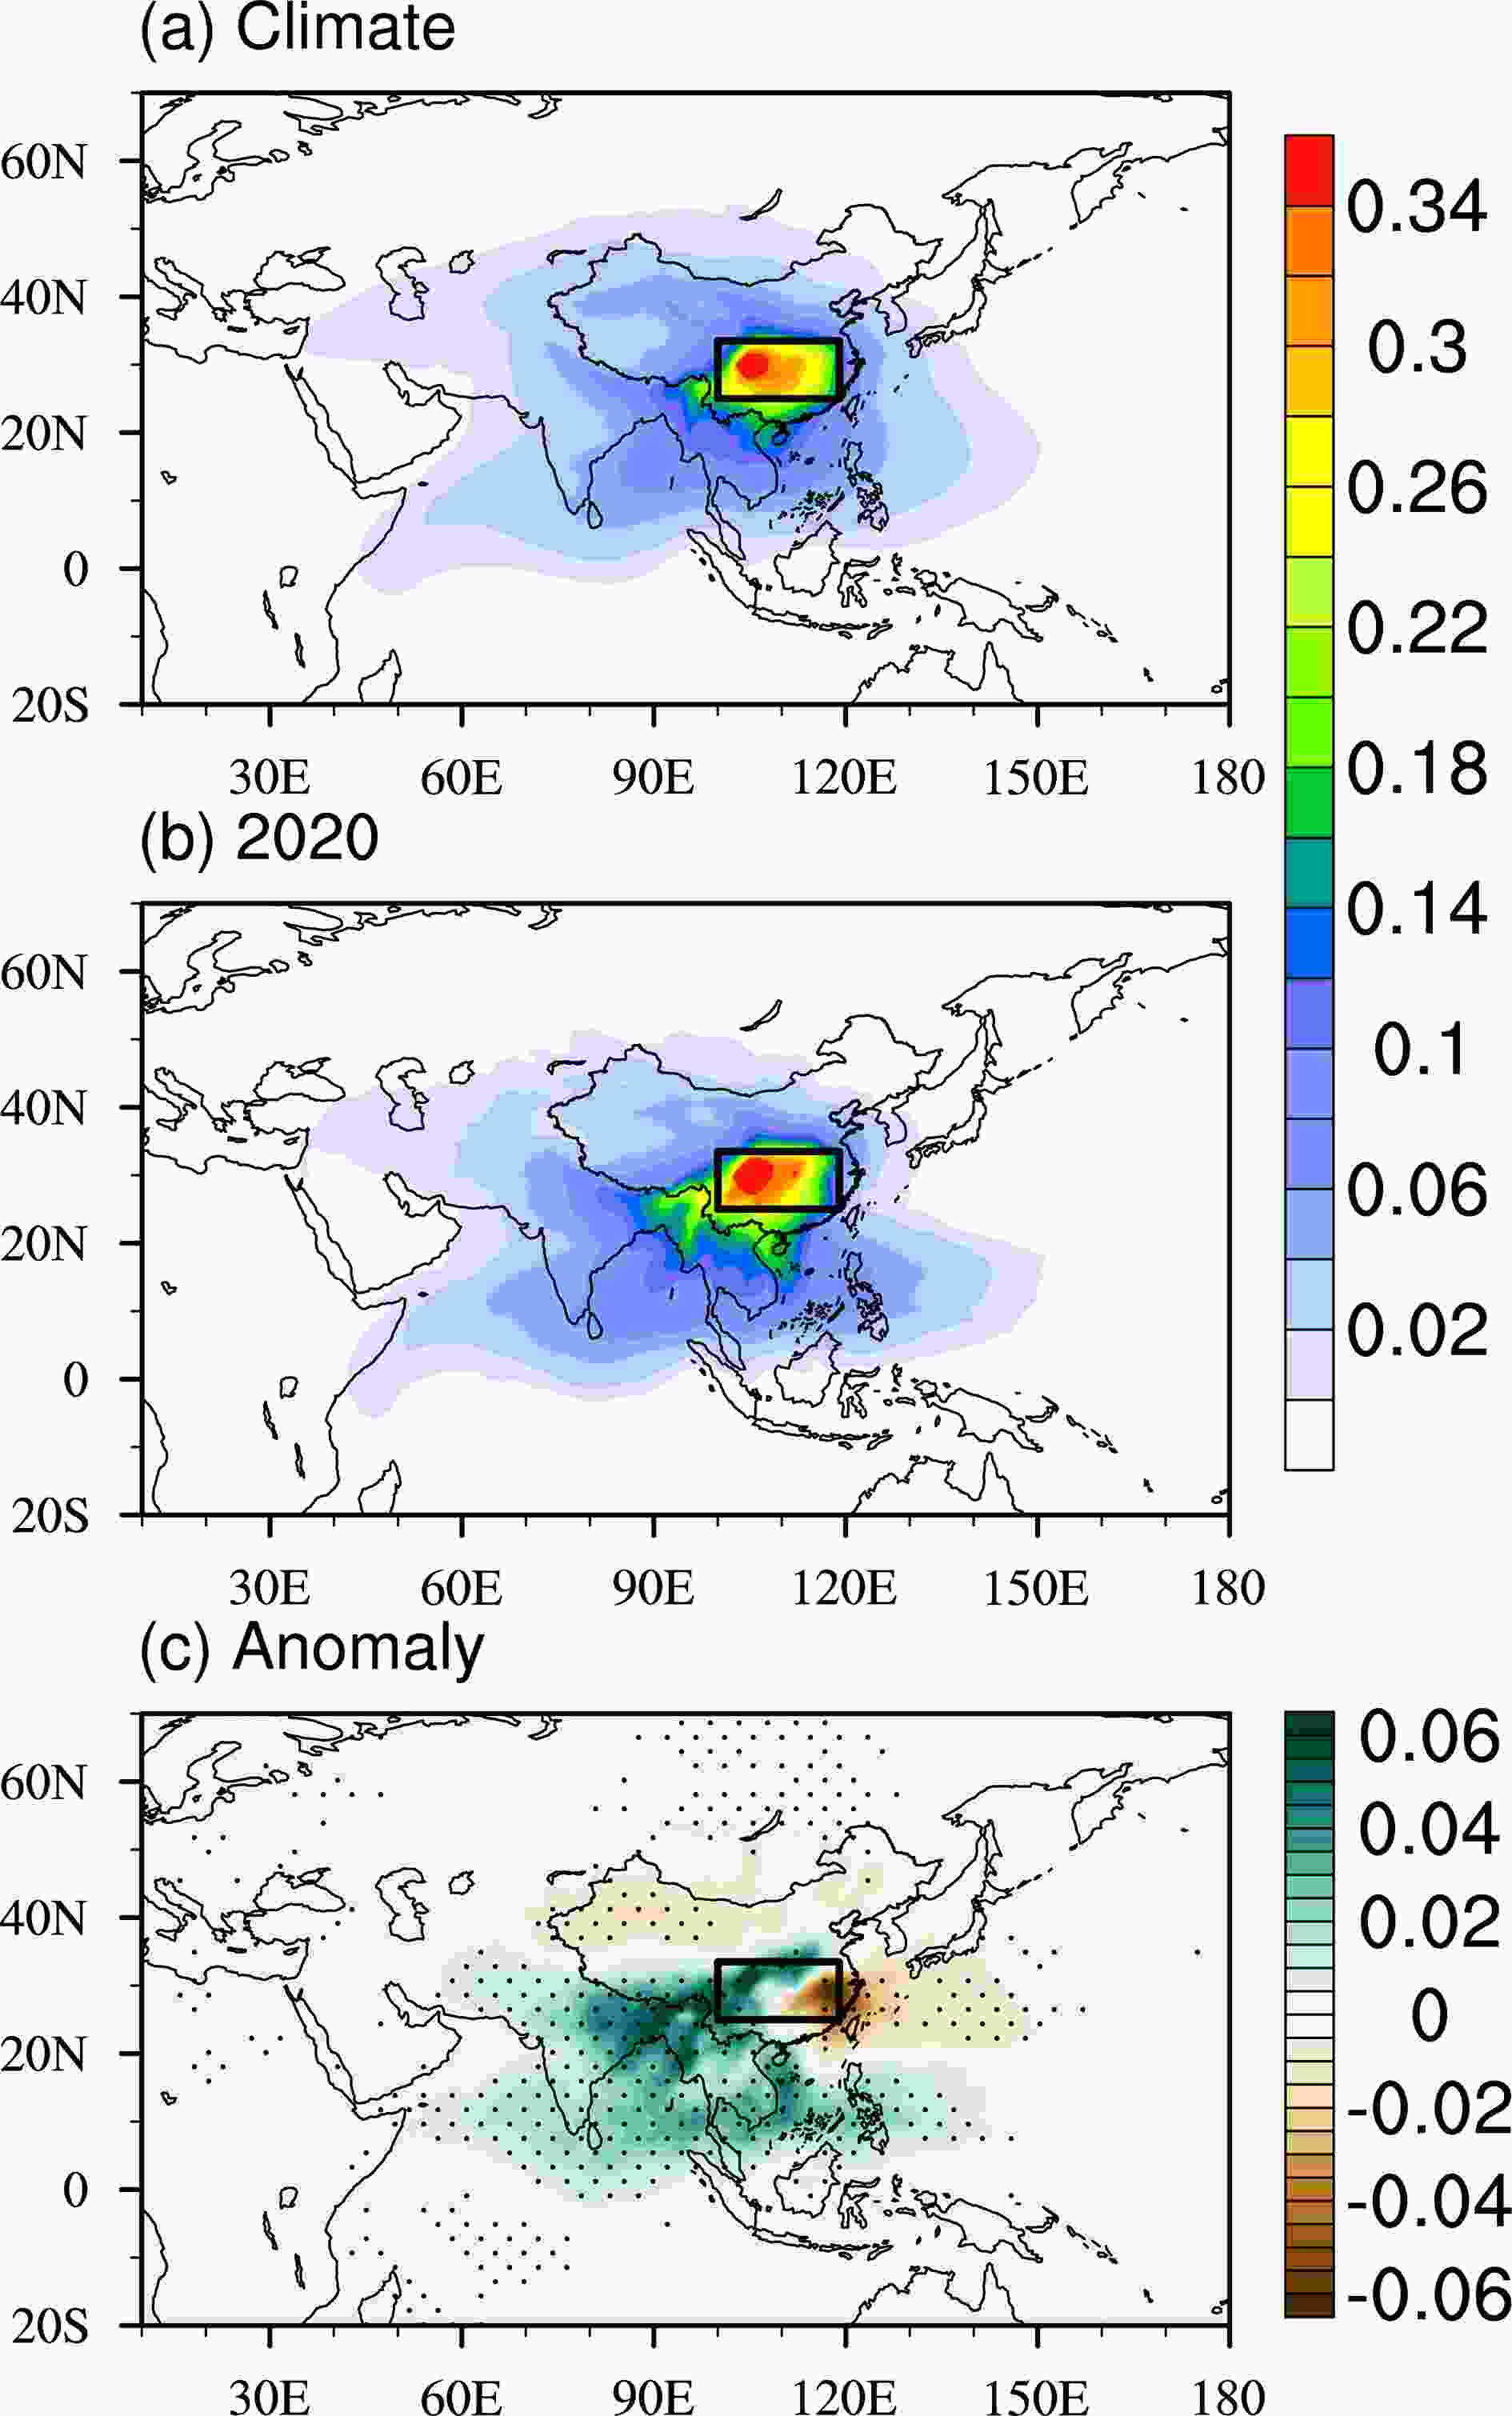 Figure6. Spatial distribution for the trajectory density (units: %) of air-particles for the 10 tracking days: (a) climate mean, and (b) 2020. (c) Same as (a) and (b), but for the anomalies in 2020. The trajectory density at each grid is normalized by the climate mean of the total numbers of air-particle trajectories for 1979–2019.
The climatic mean water content of the air-particles reaching the YRV is the highest over the YRV (0.7–1.6 kg m?2) followed by that over the Bay of Bengal (0.6–1.2 kg m?2) and the South China Sea (0.1–0.9 kg m?2) (Fig. 7a). The moisture content of air-particles was also higher than normal in 2020, particularly over the Bay of Bengal, the South China Sea, and the YRV in 2020 (Fig. 7b) —where the anomalous moisture content was centered (Fig. 7c). This result implies that air-particles carried more water vapor to the YRV in 2020 from the source regions.
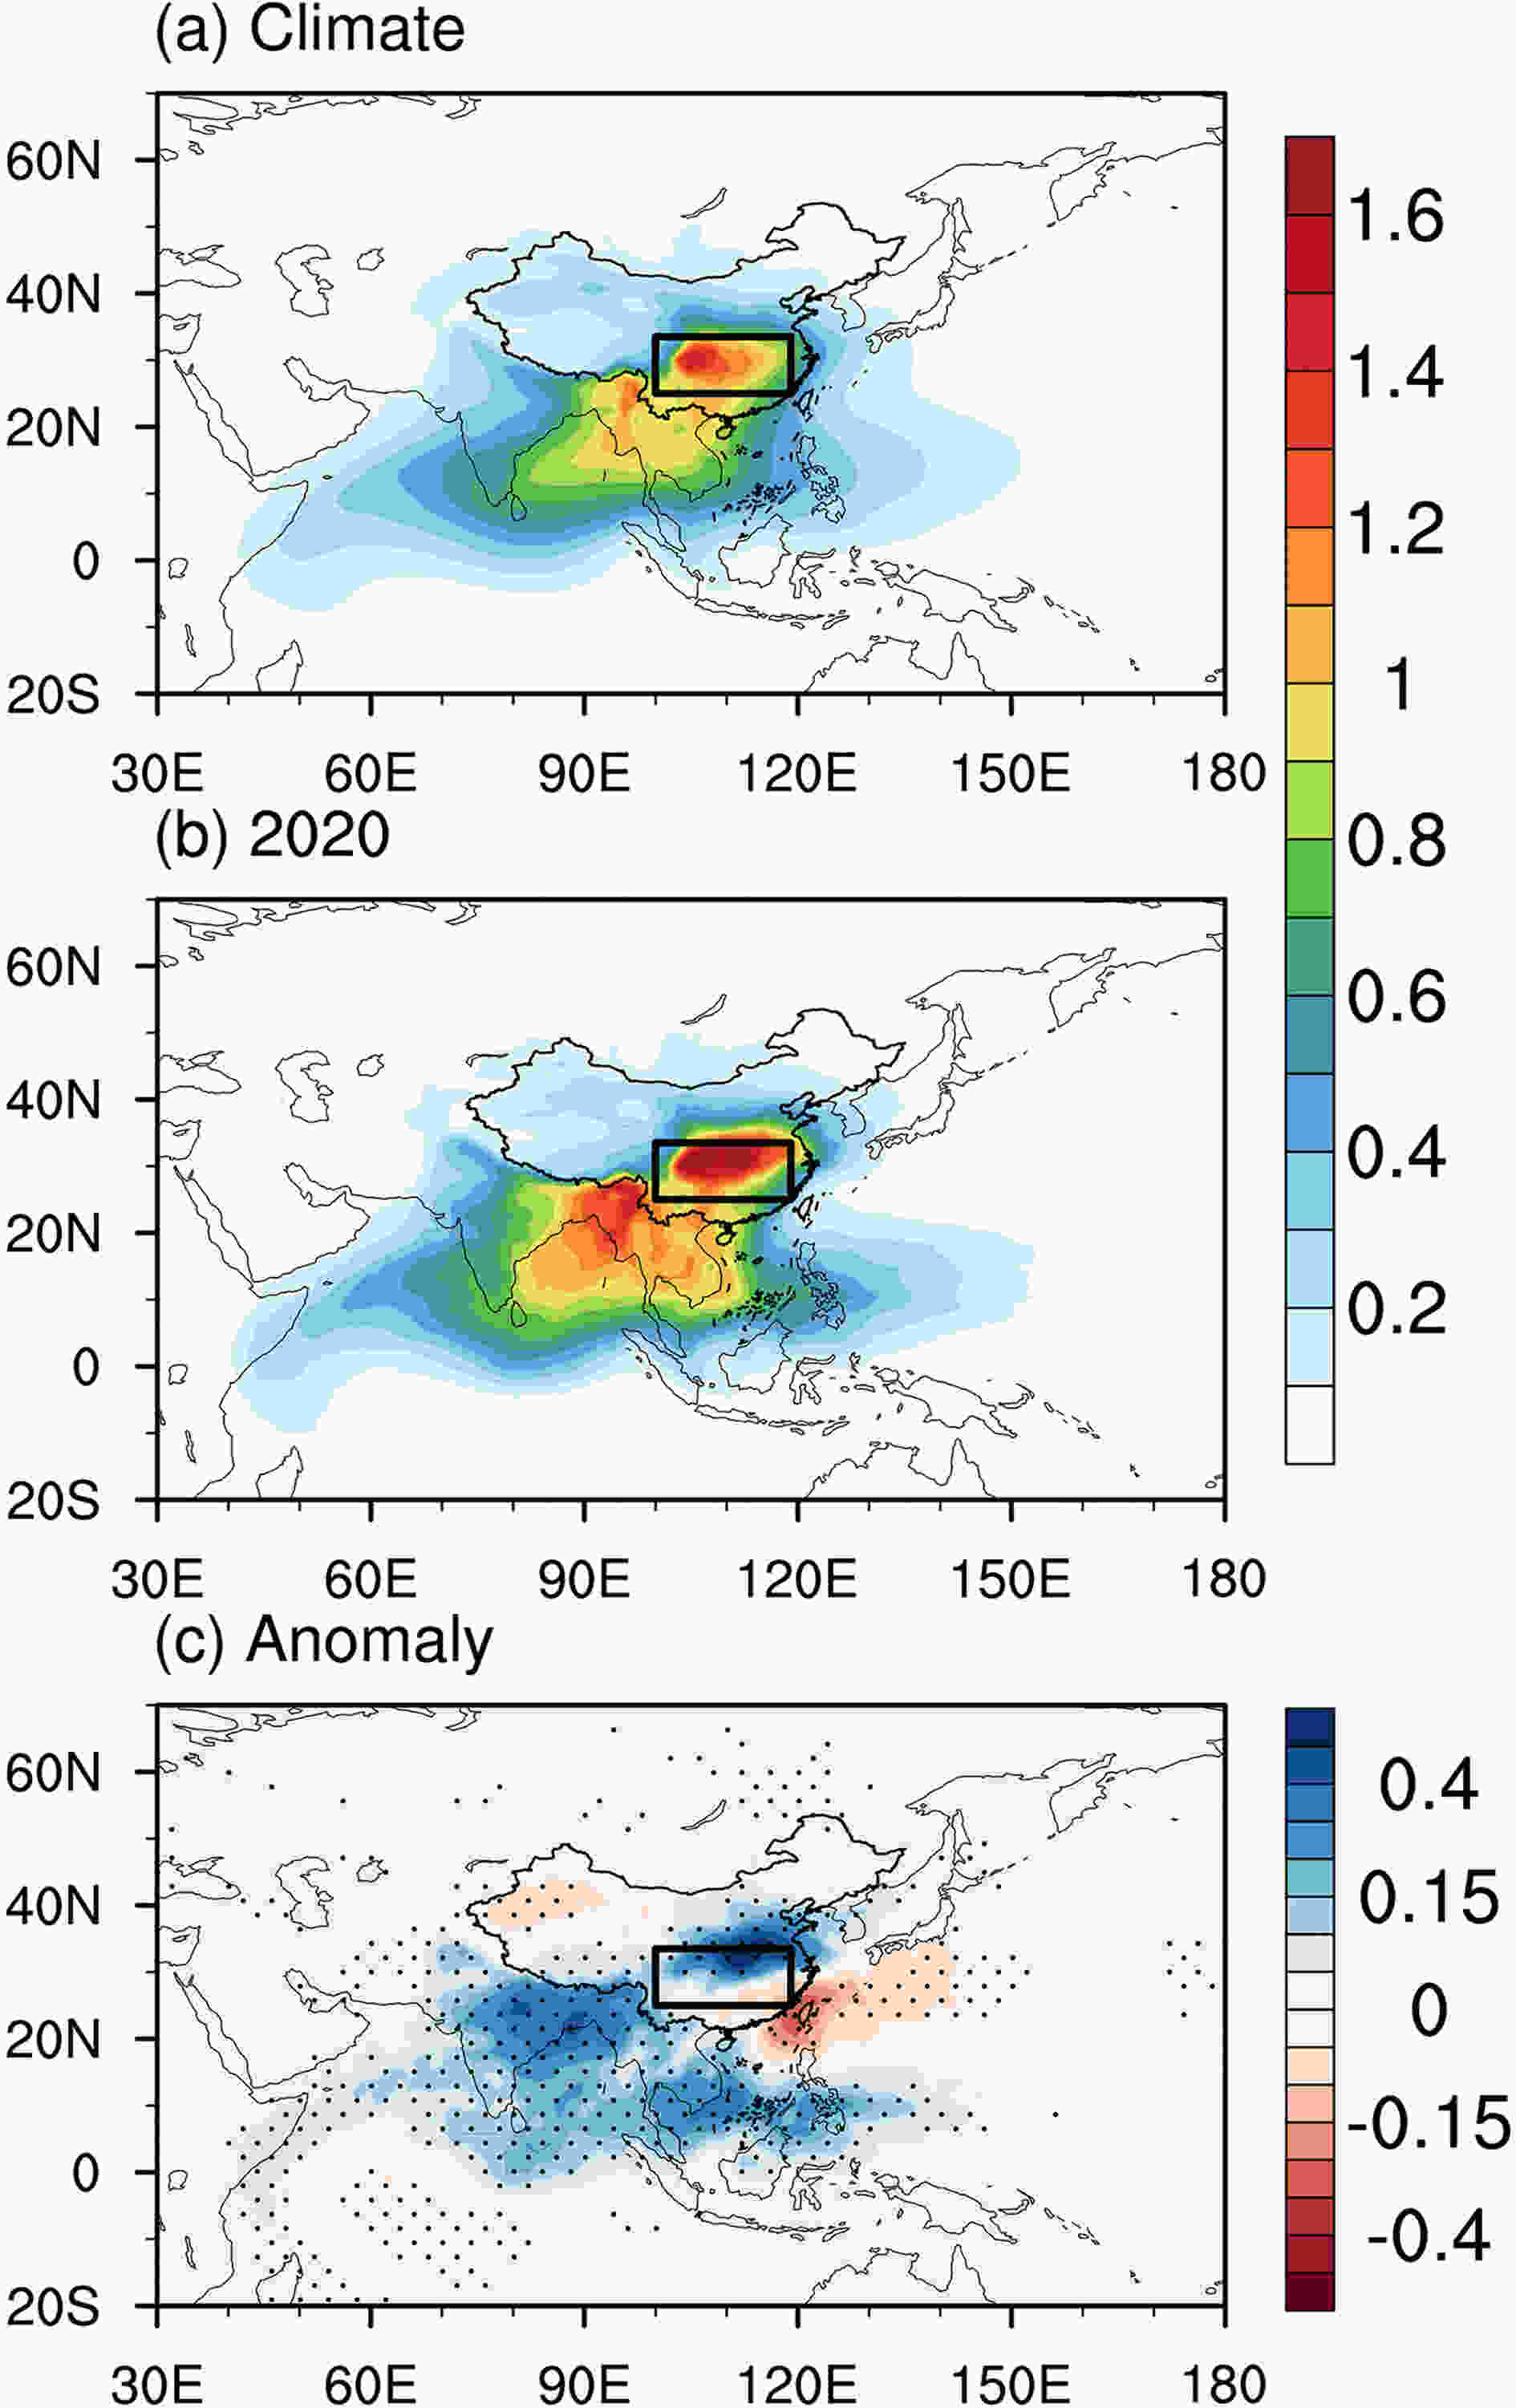 Figure7. Same as Fig. 6, but for the backward-integrated water content (kg m?2) for all the target air-particles before reaching the target region.
To examine the moisture changes in air-particles during transport, the integrals of e–p for all the target air-particles over 10 days, before reaching the YRV, are shown in Fig. 8. The climatological continental source regions southwest of the YRV, i.e, south of the Tibetan Plateau, Southwest China, and Southeast Asian countries, are dominated by negative e–p, indicating air-particles tend to release moisture over those regions because of local moist convection. In contrast, the moisture from tropical oceanic source regions, i.e., the Indian Ocean, the Bay of Bengal, and the WPO (especially the South China sea), shows positive e–p, indicating that air-particles are dominated by moisture-uptake over those oceanic source regions (Fig. 8a). Thus, the oceanic regions are the main moisture-source region, while the continental regions, southwest of the YRV, are its moisture-sink region. In 2020, the e–p pattern was similar to the climate mean (Fig. 8b). In comparison, air-particles released more moisture over the continental moisture-sink region, but collected more moisture over the tropical oceanic moisture-source region during the transport, with a positive anomaly centered over Southeast Asia, the South China Sea, and the Bay of Bengal (Fig. 8c). Over the YRV sector, because of enhanced convection over the YRV in 2020, more moisture was released and e–p was dominated by negative anomalies (Fig. 8c).
 Figure8. Same as Fig. 6, but for the backward-integrated evaporation minus precipitation (e–p) for all the target air-particles before reaching the target region.
As illustrated in Section 3.1, a record-breaking moisture source was tracked from the IND and the WPO sector in 2020. To quantitatively demonstrate the relationship of the three moisture transport processes to moisture contribution from the two origins, we show scatter plots of the moisture sources and the three processes are area-averaged over the two regions from 1979–2020 in Fig. 9. The moisture source from the IND and WPO sectors is significantly correlated with trajectory density, water content, and e–p. It verifies our statements that higher trajectory density, water content, and positive e–p enhance the contributions from moisture sources. The largest moisture source from the IND and WPO in 2020 in Fig. 5 can also be seen from Fig. 9. Over the IND sector, the record-breaking moisture source in 2020 (blue markers) can be attributed to the unprecedented trajectory density (Fig. 9a), water content (Fig. 9b), and the positive anomalies of e–p of air-particles (Fig. 9c). In comparison, the highest e–p, observed over the WPO region, played a primary role in the record-breaking moisture source from the WPO (Figs. 9a, b).
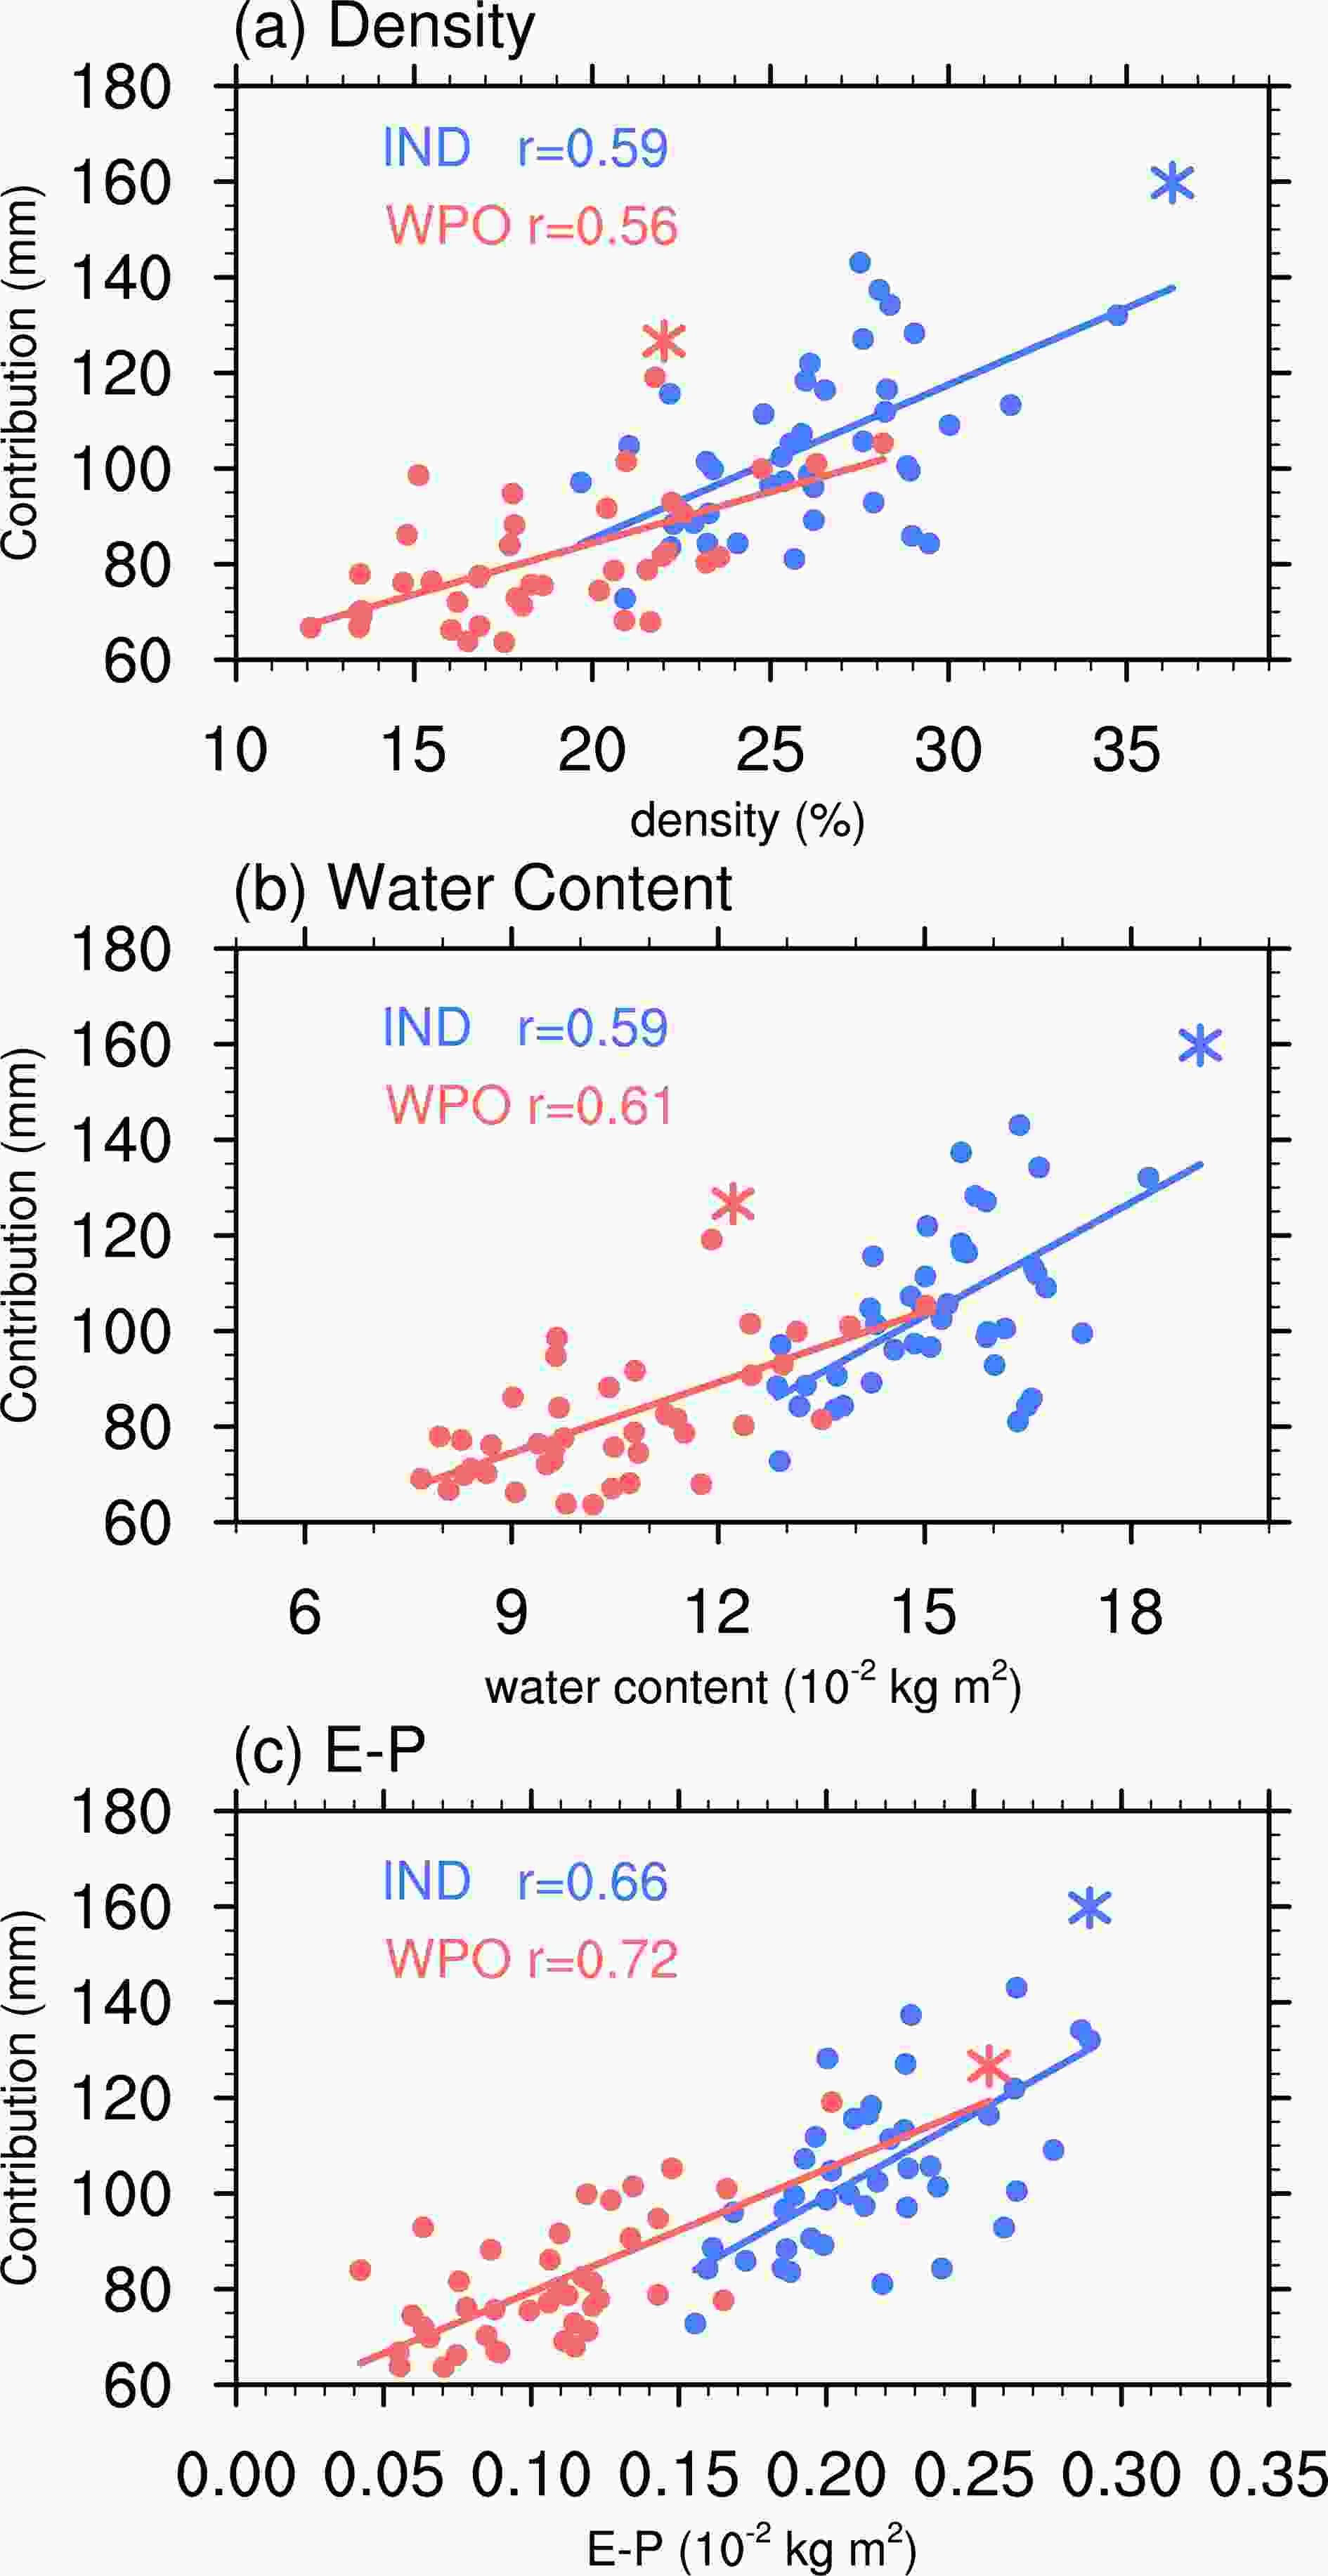 Figure9. The scatter plots of tracked moisture contribution (y-axis, units: mm) versus the accordant (a) area-summed trajectory density (x-axis, units: %), (b) area-averaged mean water content (x-axis, 10?2 kg m?2), and (c) area-averaged e–p (x-axis, 10?2 kg m?2) over the IND (blue) and WPO (red) sectors. The asterisks denote the value for 2020. Red and blue lines (numbers) are the linear regression lines (correlation coefficients) between the y-axis and x-axis for the IND and WPO sectors, respectively. The correlation coefficients are all statistically significant at the 5% level.
Because large-scale circulation dominates moisture transport processes, we also explored the relationship between the large-scale circulation and the moisture contribution anomalies. Here, we first define a moisture contribution index, the regression coefficient between the moisture contribution anomaly in individual mei-yu season and that of 2020. We then show the normalized time-series for 1979–2020 in the black line in Fig. 10a. Consistent with the unprecedented mei-yu rainfall over the YRV in 2020, we also found a record-breaking moisture contribution from source origins in 2020. To investigate the large-scale circulation associated with moisture contribution anomalies, we further regressed the sea surface temperature, the 850 hPa winds, and precipitation anomalies onto the moisture contribution index for 1979–2020 (Fig. 10b). Associated with additional moisture from the source origins, significantly enhanced precipitation is seen over the YRV (red box in Fig. 10b). Meanwhile, a broad-scale anomalous anticyclone to the south of the mei-yu rainband over the Indo-Northwest Pacific (Indo-NWP) region extends from the Bay of Bengal to the tropical Northwest Pacific Ocean. The strengthened NWPSH was the western part of this Indo-NWP anticyclonic circulation anomaly. On the interannual time scale, the anomalous Indo-NWP anticyclone circulation tends to occur in summer following the El Ni?o decay due to a basin-wide warm SST forcing from the Indian Ocean (Fig. 10b). On one hand, the Indian Ocean warming excites an anticyclonic shear and boundary layer divergence over the tropical Northwestern Pacific via a Kelvin response (Yang et al., 2007; Xie et al., 2009; Wu et al., 2009a, 2010). On the other hand, it enhances convection over the Maritime Continent and further induces the subsidence over the Indo-NWP region through an anomalous Hadley circulation (Wu and Zhou, 2008; Wu et al., 2009b). In 2020, a record strong IOD event in 2019 deepened the thermocline by a record 70 m in late 2019, helping to sustain an Indian Ocean warming through the 2020 summer and the anomalous anticyclone over the Indo-NWP region (Takaya et al., 2020; Zhou et al., 2021).
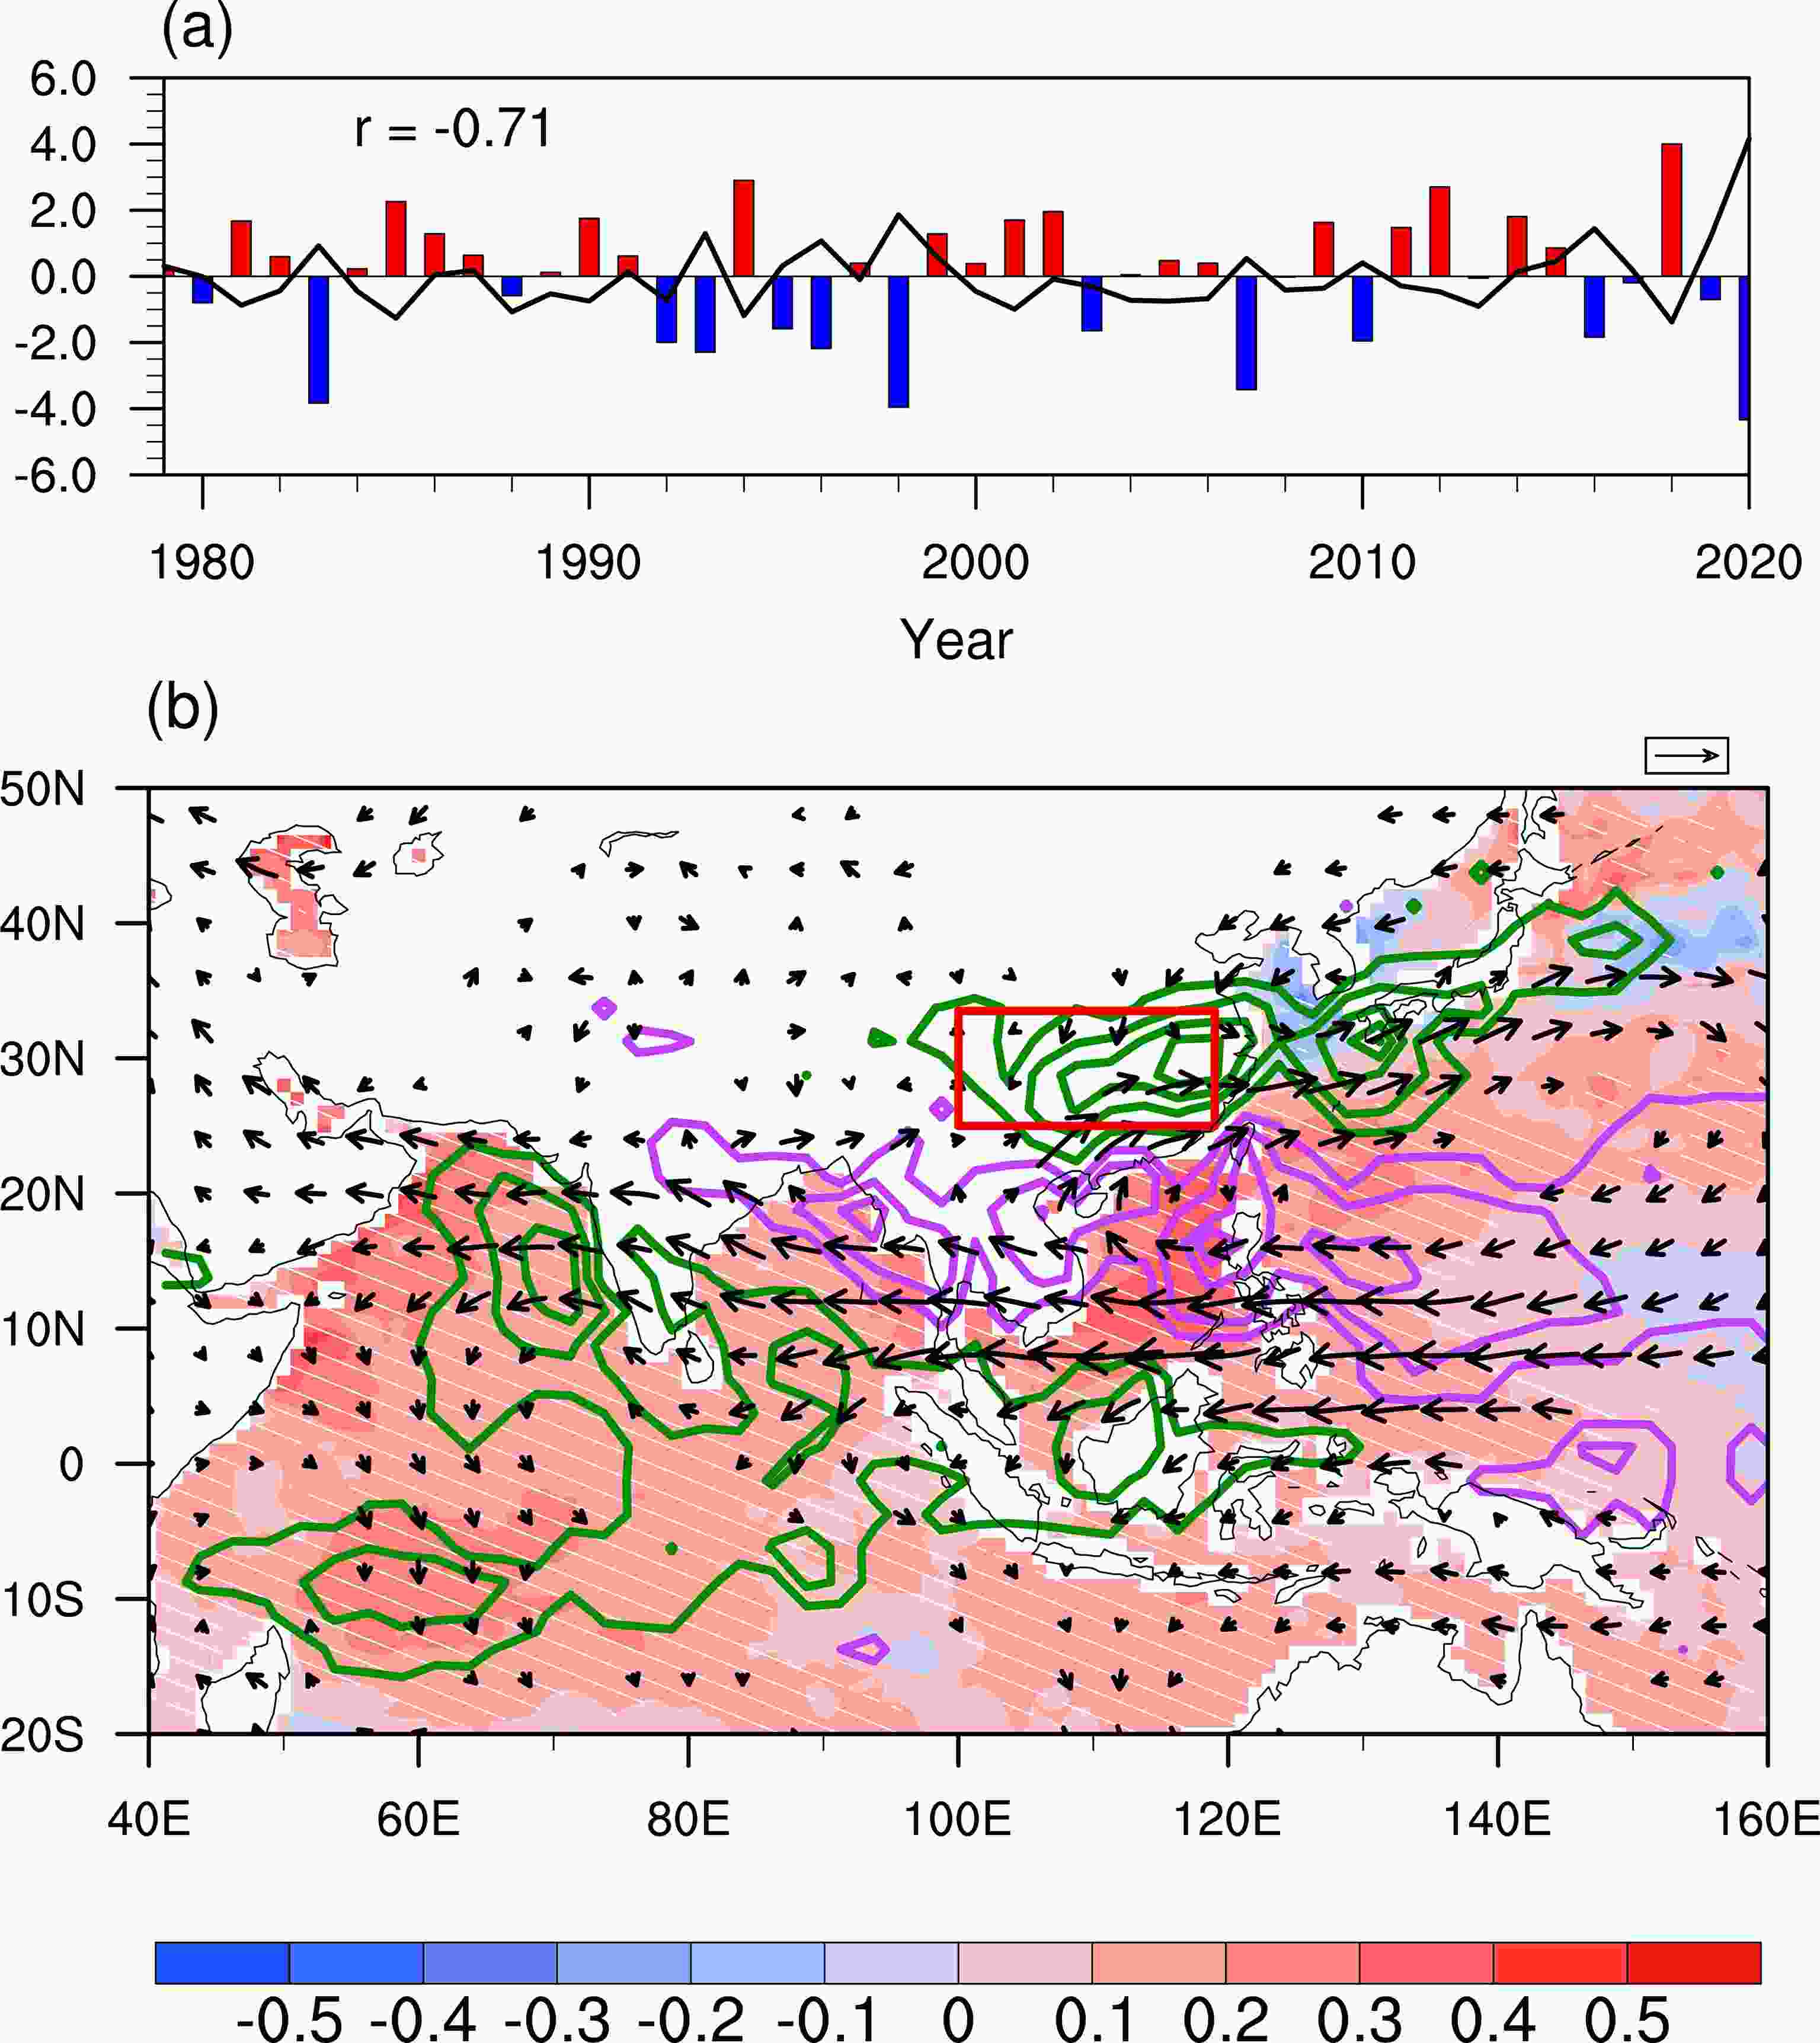 Figure10. (a) Normalized time series of the moisture contribution index (black line) and Indo-NWP anticyclonic circulation index (bars) for 1979–2020. The moisture contribution index is the regression coefficient between the anomalous moisture contribution in each year and that of 2020. The Indo-NWP anticyclonic circulation index is defined as the 850 hPa vorticity, area-averaged over the Indo-NWP region (15°–25°N, 80°–140°E). (b) The sea surface temperature (shaded; units: K), precipitation (contour; units: mm d?1), and 850-hPa wind (vectors; units: m s?1) anomalies regressed onto the normalized moisture contribution index for 1979–2020. The green (purple) lines represent the positive (negative) precipitation anomalies derived from GPCP. The contour interval is 0.5 mm d?1. Only the contour and vectors statistically significant at the 5% level are shown. The white lines indicate that the regressed SST anomaly is significant at the 5% level.
The Indo-NWP anticyclone anomaly favors moreair-particles transport from the IND and WPO sector northward to the target region, leading to a higher density of air-particles. Meanwhile, it suppresses atmospheric convection over the region extending from the Bay of Bengal through Southeast Asia to the tropical Northwestern Pacific (15°–25°N, 80°–140°E), therefore, less water is lost in the tracked air-particles. Consequently, the target air-particles can collect and retain more water over the moisture-source regions, contributing to higher e–p over the oceanic source regions (Figs. 8c and 9c). The anomalous anticyclonic circulation also weakens the background circulation and feeds back to the Indo-NWP ocean warming, which increases the water-holding capacity of air-particles and also contributes to higher moisture content (Figs. 7c and 9b).
To investigate how different the Indo-NWP anomalous anticyclonic circulation was in 2020 mei-yu season since 1979, we use the 850 hPa vorticity, area-averaged over the Indo-NWP (15°–25°N, 80°–140°E), to represent its intensity, and further show its normalized time series for 1979–2020 in Fig. 10a (bars). It is highly correlated with the intensity of moisture contribution (r = –0.71) and reached its peak in the 2020 mei-yu season. This indicates that the record-breaking Indo-WNP anticyclonic anomaly in 2020 contributed to the unprecedented moisture transport from the IND and WPO sectors.
According to the tracked air particle trajectories reaching the YRV in mei-yu season, we divided the moisture sources into five sectors, the Indian monsoon region (IND), Western Pacific Ocean region (WPO), the Eurasian continent region (EAC), the Northeast Asian region (NEA) and the local region under study (YR). In the 2020 mei-yu season, above-normal contributions from moisture sources were seen from all sectors, except the NEA, centered in the South China Sea, Southeast China, and the Bay of Bengal. In comparison with the climate means of the moisture sources from 1979–2019, record-breaking moisture was transported from the source regions of the IND and WPO, which was about 1.5 and 1.6 times greater than their climate means, respectively.
By investigating the moisture transport processes, we found that the moisture contribution from the IND and WPO sectors is both significantly correlated with the air-particle trajectory density, moisture content, and moisture collection averaged over the corresponding regions. In the IND sector, the combination of record-breaking air-particle trajectory density, moisture content, and moisture collection in the 2020 mei-yu season collectively contributed to the record-breaking moisture transport from the IND. Over the WPO sector, the moisture collection by air-particles was the highest in 2020, playing a dominant role in the record-breaking moisture transport from the WPO.
We also found that a broad anomalous anticyclone south of the mei-yu rainband over the Indo-Northwest Pacific (Indo-NWP) region, extending from the Bay of Bengal to the tropical Northwest Pacific Ocean, favors additional moisture contributions from the source origins. Its correlation with the intensity of moisture contribution is as high as –0.71 for 1979–2020. A record-breaking Indo-NWP anticyclonic anomaly in 2020 was observed, favoring an increase in air-particle transport from the IND and WPO sector northward to the target region, leading to a higher density of air-particles. The associated suppression of atmospheric convection over the Indo-NWP region in 2020 resulted in less water vapor loss for the air-particles, contributing to a higher e–p over the source regions and thus more water content in the air-particles over the IND and WPO sector.
Acknowledgements. This paper was supported by the National Natural Science Foundation of China (Grant No. 42075037) and the Ministry of Science and Technology of China (Grant No. 2018YFA0606501), and the Program of International S&T Cooperation (Grant No. 2018YFE0196000).
