HTML
--> --> -->Because parameterization of the planetary boundary layer (PBL) is rarely developed specifically for simulating tropical cyclones, many numerical studies have suggested that the simulated intensity and structure of tropical cyclones are largely influenced by not only the choice of PBL schemes (Braun and Tao, 2000; Nolan et al., 2009; Kepert, 2012), but also the empirical parameters in these schemes (Kanada et al., 2012; Ming and Zhang, 2016; Ma et al., 2018). KPP (K-Profile Boundary-Layer Parameterization)-type PBL schemes are the most popular schemes in the Advanced Research Weather Research and Forecasting (WRF-ARW) model for the simulation of tropical cyclones in both operational use and research (Kepert, 2012). The vertical eddy diffusivities for momentum, heat and moisture (Km, Kh and Kq, respectively) are the key parameters in these PBL parameterizations (Noh et al., 2003; Shin and Dudhia, 2016). They are used to parameterize the subgrid-scale turbulent flux using the vertical gradient of the prognostic mean variables (u, v, q). However, previous studies have shown that considerable uncertainty still exists in the determination of these vertical eddy diffusivities, even when using state-of-the-art PBL parameterizations, especially under tropical cyclone conditions (Zhang and Wang, 2003; Zhang et al., 2020). Tropical cyclones are very sensitive to these parameters and even small changes can result in large differences in the numerical simulations (Kepert, 2012; Zhang et al., 2015). This sensitivity is not only related to the magnitude of the eddy diffusivity coefficient, but also to its vertical and horizontal distribution (Foster, 2009; Li et al., 2020). The calculation of these parameters in PBL parameterizations is a considerable challenge and needs further examination.
A thorough examination of the influence of the mixing coefficient on the TCBL and its physical mechanisms will help to improve our understanding of this region and guide improvements in subgrid-scale processes in PBL parameterization for the simulation of tropical cyclones. For example, Gopalakrishnan et al. (2013) suggested that the Hurricane Weather and Research Forecast (HWRF) model Global Forecast System (GFS) PBL scheme, a KPP-type PBL scheme, overestimates the vertical momentum diffusion coefficient by about four times compared with observations at 500 m. They conducted sensitivity tests on the vertical diffusion coefficient of the PBL and showed that the PBL has a noticeable effect on the structure and intensity of tropical cyclones. The vertical gradient of wind in the PBL is increased by the reduction in diffusion, resulting in stronger friction and inflow. The enhanced inflow strengthens convergence and convection in the eyewall region, leading to a stronger tropical cyclone. Based on this study, a factor < 1 (e.g., a = 0.7 in the 2013 and 2014 versions) was adopted in the HWRF model to reduce excessive vertical diffusion and improve the operational forecasting skill for hurricanes. Zhang et al. (2015) found that this change in vertical diffusion in the HWRF PBL has an important role in the peak warm core anomaly, but has less impact on the height of the warm core. Composite results for two rapidly intensifying hurricanes showed that rapid intensification is very sensitive to vertical diffusion in the HWRF GFS PBL (Zhang et al., 2017). Bu et al. (2017) suggested that the local vertical diffusivity also has an essential role in regulating the size of tropical cyclones.
Although the impact of eddy diffusivity on the intensity and structure of tropical cyclones has been investigated previously in depth (Gopalakrishnan et al., 2013; Zhang et al., 2017, 2020; Ma et al., 2018), there is little evaluation of the separate effects of eddy diffusivity. In numerical models, the vertical mixing of momentum, moisture, and temperature are all crucial in PBL schemes. However, the eddy diffusivities for moisture (Kq) and heat (Kh) are usually estimated by Km through the Prandtl and Schmidt numbers (Troen and Mahrt, 1986), respectively. The estimate of Prandtl number is still uncertain even with state-of-the-art PBL schemes (Shin and Hong, 2011). In previous studies, vertical diffusion sensitivity experiments conducted on Km (Gopalakrishnan et al., 2013; Zhang et al., 2020) or the height of the PBL (Ma et al., 2018) in KPP-type parameterizations affected Km, Kh and Kq at the same time. Kq and Kh have not, however, been systematically examined in tropical cyclone environments.
Observational studies (Zhang and Drennan, 2012) have suggested that the vertical momentum and latent heat eddy diffusivity estimated by vertical observations are basically of the same order of magnitude and are both much larger than that of the sensible heat. Moisture gained from the sea surface is crucial in the development and maintenance of tropical cyclones (Malkus and Riehl, 1960), whereas vertical mixing in the PBL regulates how these moisture transport processes are achieved (Ma et al., 2018). Thus, the change in the moisture diffusivity Kq may also be essential in the intensity and structure of tropical cyclones. This raises the question of the roles of moisture diffusivity and its corresponding latent heat flux in the evolution of tropical cyclones.
Since momentum and scalar diffusivities are often changed together to investigate their impact on the intensity and structure of tropical cyclones, the separate influence of the moisture eddy diffusivity (Kq) on the intensity and structure of tropical cyclones and its mechanism remains to be examined. Because the water vapor generated by vertical mixing in the TCBL only accounts for a small part of the total water vapor content (Kurihara, 1975; Yang et al., 2011), whether and how such a small amount of water vapor influences the intensity and structure of tropical cyclones is also controversial. The goal of this study is to investigate the influence of Kq on tropical cyclones using a series of idealized sensitivity experiments. The model and sensitivity experiments are described in section 2. Section 3 discusses the results of the sensitivity experiments and the impact of Kq on the intensity, structure and mechanism of tropical cyclones. Section 4 provides a discussion and our conclusions.
The model physics used were the Yonsei University (YSU) PBL scheme (Hong and Pan, 1996), the Kain–Fritsch cumulus scheme (Kain and Michael Fritsch, 1993; Kain, 2004), the Dudhia shortwave radiation scheme (Dudhia, 1989), the Rapid Radiative Transfer Model (RRTM) (Mlawer et al., 1997) longwave radiation scheme and the WSM6 microphysics scheme (Hong and Lim, 2006). The cumulus scheme was only applied to the outermost domain (18 km).
In the YSU PBL scheme, the diffusivities Kq and Km are determined as:
here, k is the von Ka?rma?n constant with a value of 0.4, ws represents the mixed-layer velocity scale, z represents the height above ground, and h is PBL depth. The values of Kh and Kq are calculated from Km using the Prandtl number (

Table 1 lists the sensitivity simulations with artificially altered diffusivities for momentum (Km) and moisture (Kq). Given that the observational peak value of the calculated diffusion coefficient ranges from 38 to 101 m2 s?2 (Zhang et al., 2011), the original diffusion coefficients were reduced to a minimum value of 50% in these sensitivity experiments and increased to 200% of the default YSU PBL scheme with a maximum of about 110 m2 s?2. The control experiment is conducted using the default YSU PBL scheme. The default Kq value of the YSU PBL scheme in the CTRL run was decreased to 50% in experiment 2 (Kq_50%) and increased to 200% in experiment 3 (Kq_200%) to investigate the influence of Kq on the simulated evolution of the tropical cyclone. Experiments 4 (Km_50%) and 5 (Km_200%) are the same as experiments 2 (Kq_50%) and 3 (Kq_200%), but for Km.
| Experiment No. | Name | Remarks |
| 1 | CTRL | Vertical eddy diffusivity calculated by default YSU PBL schemes in WRF version 3.8.1 |
| 2 | Kq_50% | As CTRL, but Kq is reduced to 50% |
| 3 | Kq_200% | As CTRL, but Kq is increased to 200% |
| 4 | Km_50% | As CTRL, but Km is reduced to 50% |
| 5 | Km_200% | As CTRL, but Km is increased to 200% |
Table1. Numerical experiments
Figure 1 shows the Km (shaded) and Kq (contour) results from the five sensitivity simulations. The Kq and Km results in the sensitivity experiments differ markedly from those in the CTRL experiments. The Km and Kq values calculated directly by the PBL schemes agree with the change in Km and Kq (Fig. 1), indicating that the eddy diffusivity is effectively changed in these simulations. For example, in the Kq experiments, the Kq maximum increases from about 46 to 133 m2 s?1 as the vertical moisture diffusivity increases from Kq_50% (Fig. 1b) to Kq_200% (Fig. 1d), corresponding to a maximum of about 72 in the CTRL experiment (Fig. 1e). The maximum Km increases about 23 m2 s?1 (about 30% that of CTRL run) from the Kq_50% to the Kq_200% experiment (Figs. 1b, d), indicating the internal interaction between moisture and momentum mixing in the YSU PBL parameterization. By contrast, the maximum Km in the Km experiments increases from about 49 to 177 m2 s?1 as the vertical momentum diffusion increases from Km_50% (Fig. 1a) to Km_200% (Fig. 1c) compared with a maximum of about 78% in the CTRL experiment (Fig. 1e).
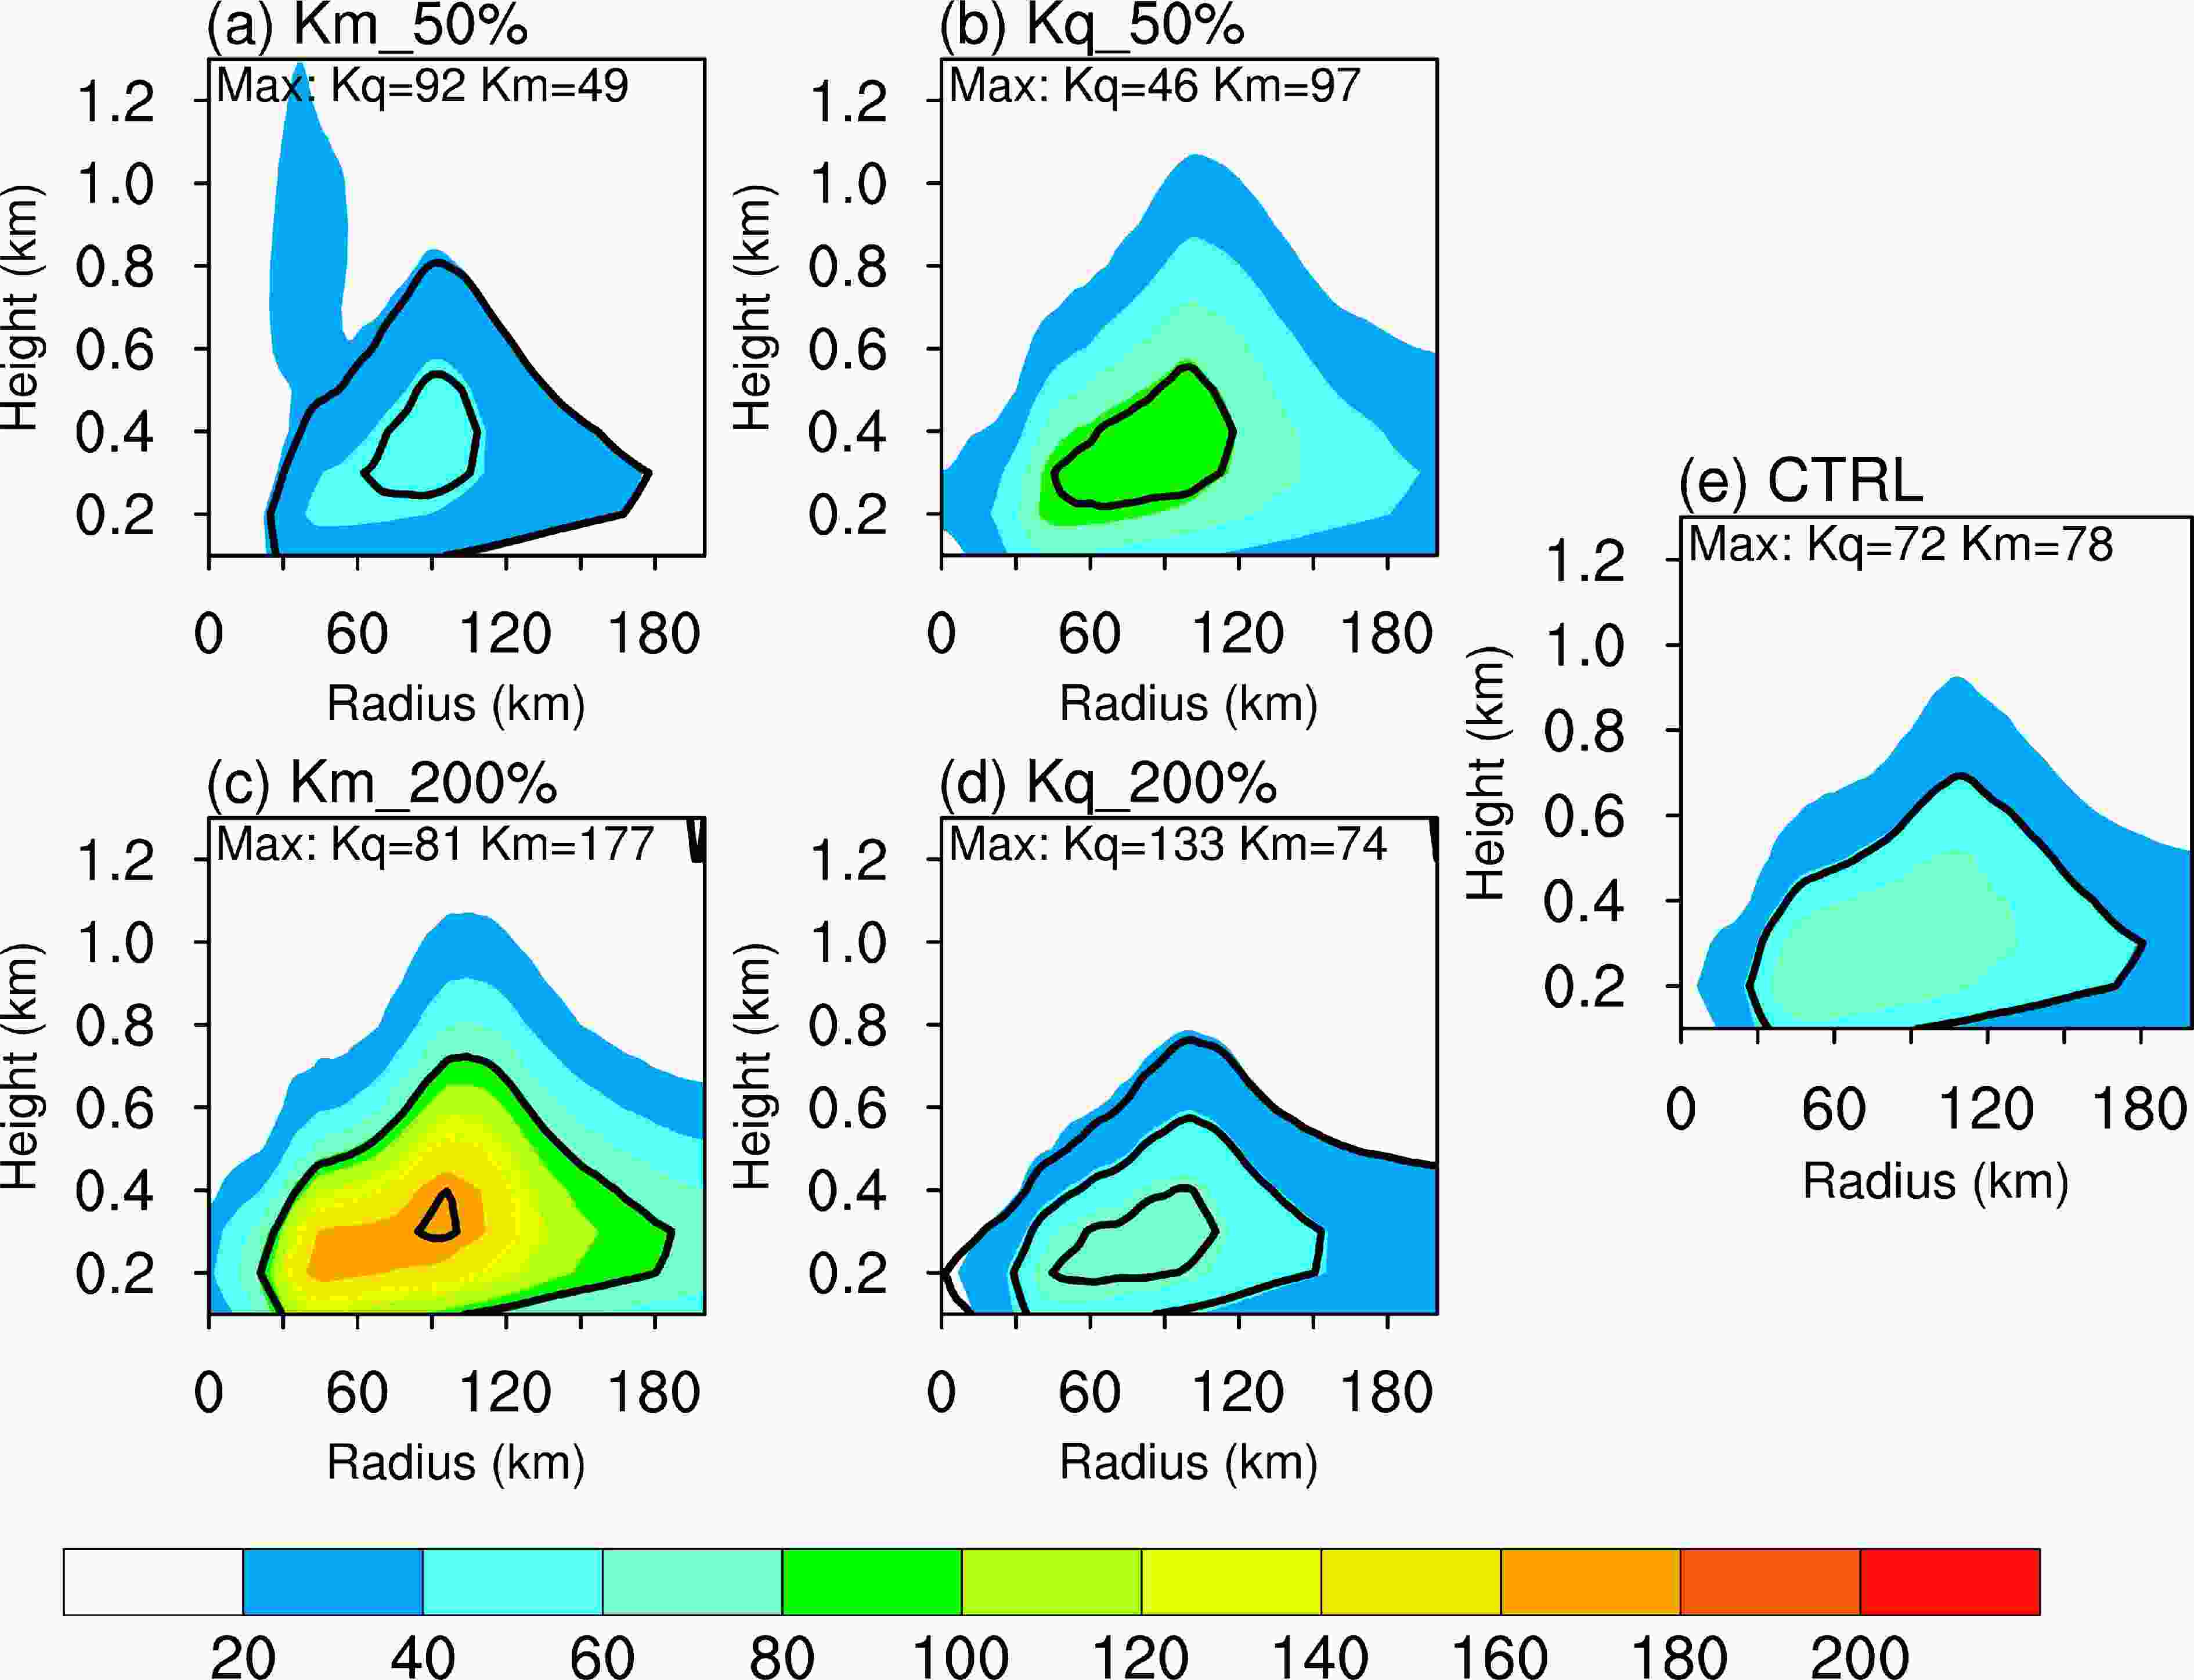 Figure1. Azimuthally and 12–36 h averaged radius–height cross-sections of the momentum exchange coefficients (shading, m s?1) superimposed on the moisture exchange coefficients (black contours; m s?1) for the (a) Km_50%, (b) Kq_50%, (c) Km_200%, (d) Kq_200% and (e) CTRL runs.
The objective of this study was to change vertical diffusivity separately for each atmospheric variable. The momentum eddy process can still be influenced by modulating the moisture diffusivity and varying the intensity and structure of the tropical cyclone. There still are some differences between these sensitivity simulations because the changes in turbulence in the PBL and the intensity of the tropical cyclone caused by varying Km (Kq) produce feedbacks to Kq (Km).
Figure 2 shows azimuthally and 12–36 h averaged radius–height cross-sections of the gradient Richardson number. All simulations show weakly unstable or neutral conditions in the lower PBL. Compared to moisture diffusivities, momentum diffusivities (Figs. 2a, e, c) have much more influence on Ri. The greater differences in the Ri vertical distribution between the Km sensitivity experiments are attributed to larger difference in vertical wind gradients. In the case of the Kq sensitivity experiments, the wind and temperature gradients indirectly related to the moisture diffusivities have weaker influence on Ri. The differences in Ri by varying the moisture diffusivities and momentum diffusivities reveal different influence on vertical mixing in TC PBL, which may impact the TC intensity and structure through different physical mechanisms. The following section discusses the impact of the modulation of moisture (Kq_50% and Kq_200%) and momentum (Km_50% and Km_200%) diffusivities on the evolution of tropical cyclones.
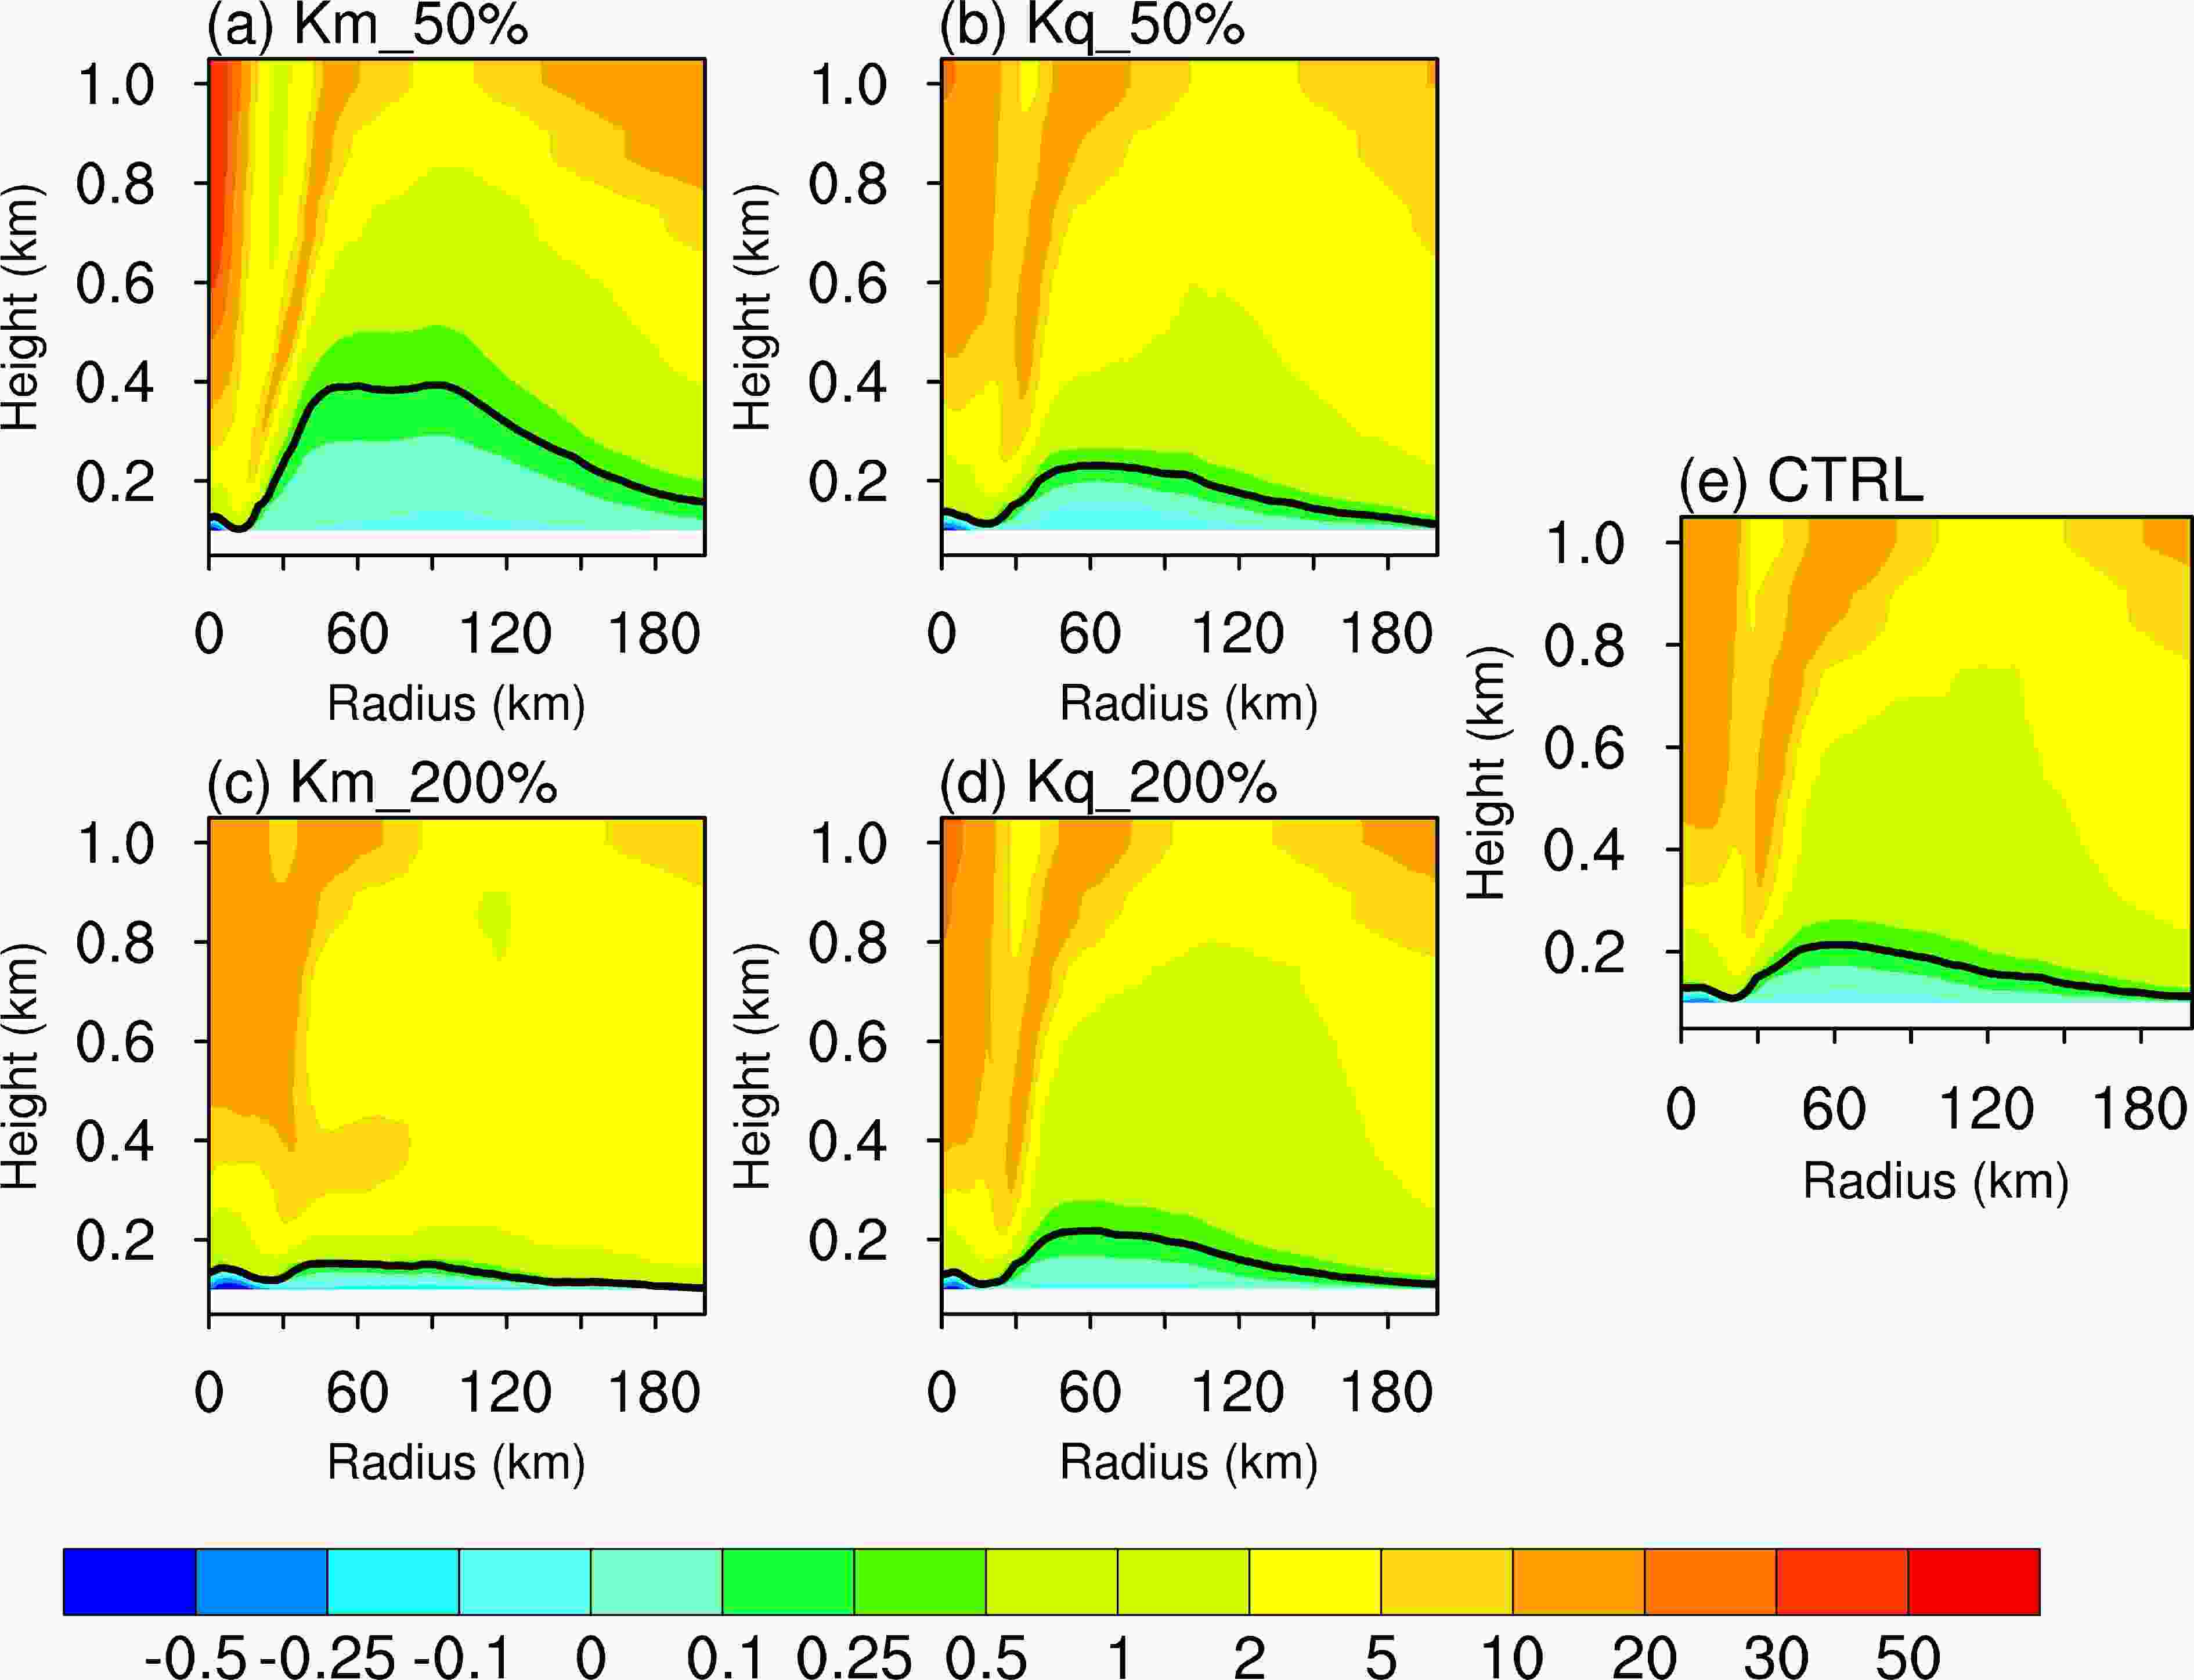 Figure2. Azimuthally and 12–36 h averaged radius–height cross-sections of the gradient Richardson number (shading) for the (a) Km_50%, (b) Kq_50%, (c) Km_200%, (d) Kq_200% and (e) CTRL runs. The black lines are contours of critical Richardson number (Ri = 0.25).
3.1. Intensity (maximum tangential wind and sea-level pressure)
Figure 3 shows the evolution of the intensity of the lowest model level maximum tangential wind (MWS) and the minimum sea-level pressure (MSLP) for all five sensitivity experiments. These sensitivity simulations show some notable features. A decrease in the momentum eddy diffusivities in the Km_50% experiment causes a simulated tropical cyclone that intensifies fastest in the 12–72 h simulation, reaching an MWS of ~ 64 m s?1 at 66 h and the lowest MSLP of 860 hPa at 120 h, the second lowest MSLP and the largest maximum wind among the five sensitivity simulations. The difference in the MSLP between the Km_50% and CTRL experiments at times reached > 30 hPa. The Kq experiments show a contrasting trend to the Km runs. The tropical cyclone in Kq_200% intensifies much slower than the tropical cyclone in Km_50%, although the intensification is faster than that in the CTRL runs. The intensification in the Km_200% and Kq_50% runs is slightly slower than that in the CTRL runs. A combination of the eddy diffusivities and intensification of the tropical cyclone in the Km_50%, Kq_50%, CTRL, Km_200% and Kq_200% experiments suggests that reducing Km or increasing Kq can produce a tropical cyclone with a more rapid decrease in the MSLP. However, an interesting feature is that the intensification rate in terms of the MWS in the Kq_50%, CTRL and Kq_200% experiments does not show large differences. Given that the MSLP is much lower in the Kq_200% experiment than in the CTRL and Kq_50% experiments (Fig. 3a) with lower moisture diffusivities (Fig. 1), the MWS of tropical cyclones appears to be marginally influenced by the moisture diffusivity, which leads to changes in the wind–pressure relationships. This indicates that the change in moisture eddy diffusivities in the PBL would result in a shift in the wind–pressure relationships.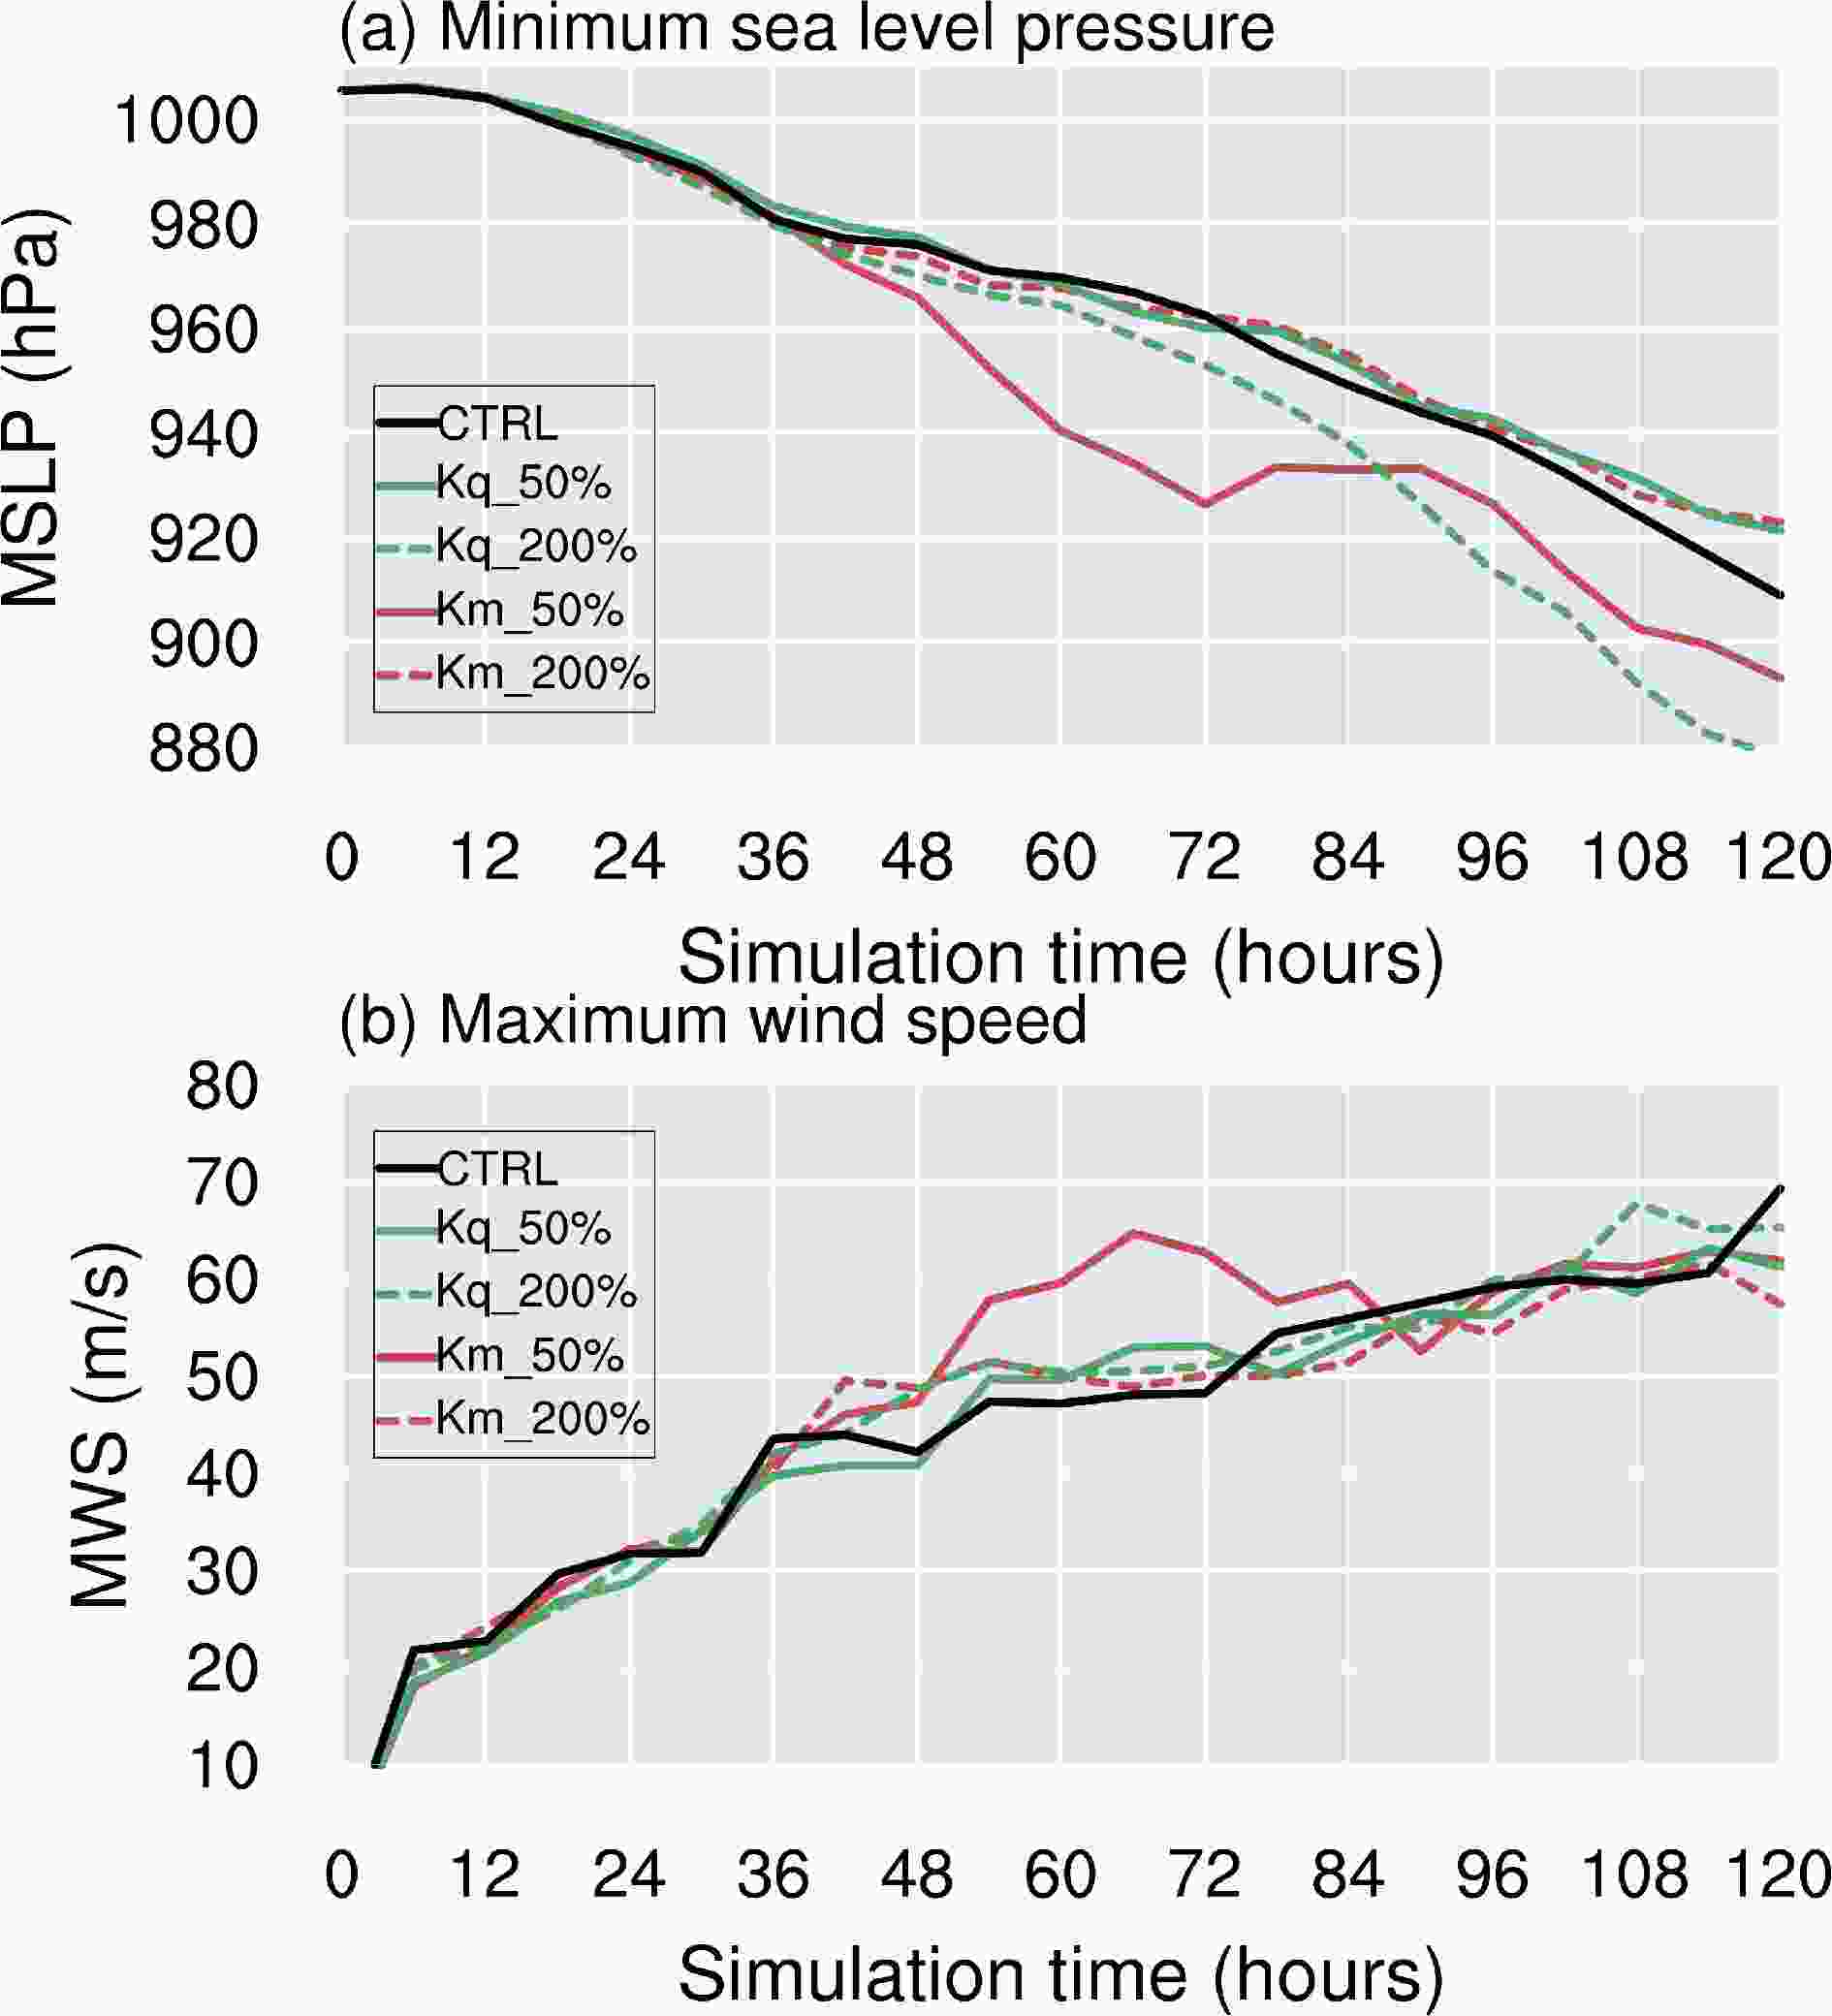 Figure3. Time series of (a) minimum sea level pressure (hPa) and (b) maximum surface wind speed (m s?1) from the CTRL, Kq_50%, Kq_200%, Km_50%, and Km_200% runs.
The MWS and MSLP reflect inconsistent growth trends among the Kq sensitivity experiments during the simulation. Figure 4 shows scatter plots of the MSW versus MSLP and linear regression of wind–pressure relationship for simulations. Note that the wind-pressure relationship from Atkinson and Holliday (1977), which was derived based on the cyclostrophic equation, is one of most widely used wind-pressure relationship in the west North Pacific. An investigation of the linear regression of wind–pressure relationships in the Kq and Km experiments confirms that the change in Kq and Km has a large influence on the tropical cyclone wind–pressure relationship in the simulation and that the stronger the tropical cyclone, the more significant the distinction. For nearly the same value of MSLP, the wind in the Kq_50% experiment was about 35 m s?1 stronger than that in both the CTRL and Kq_200% experiments. Note that the value of Kq is estimated by Km and is rarely examined by direct observations of tropical cyclone. This change in the wind–pressure relationship resulting from the modulation of Kq indicates that additional caution is needed when evaluating the performance of the PBL scheme in simulating the wind–pressure relationship.
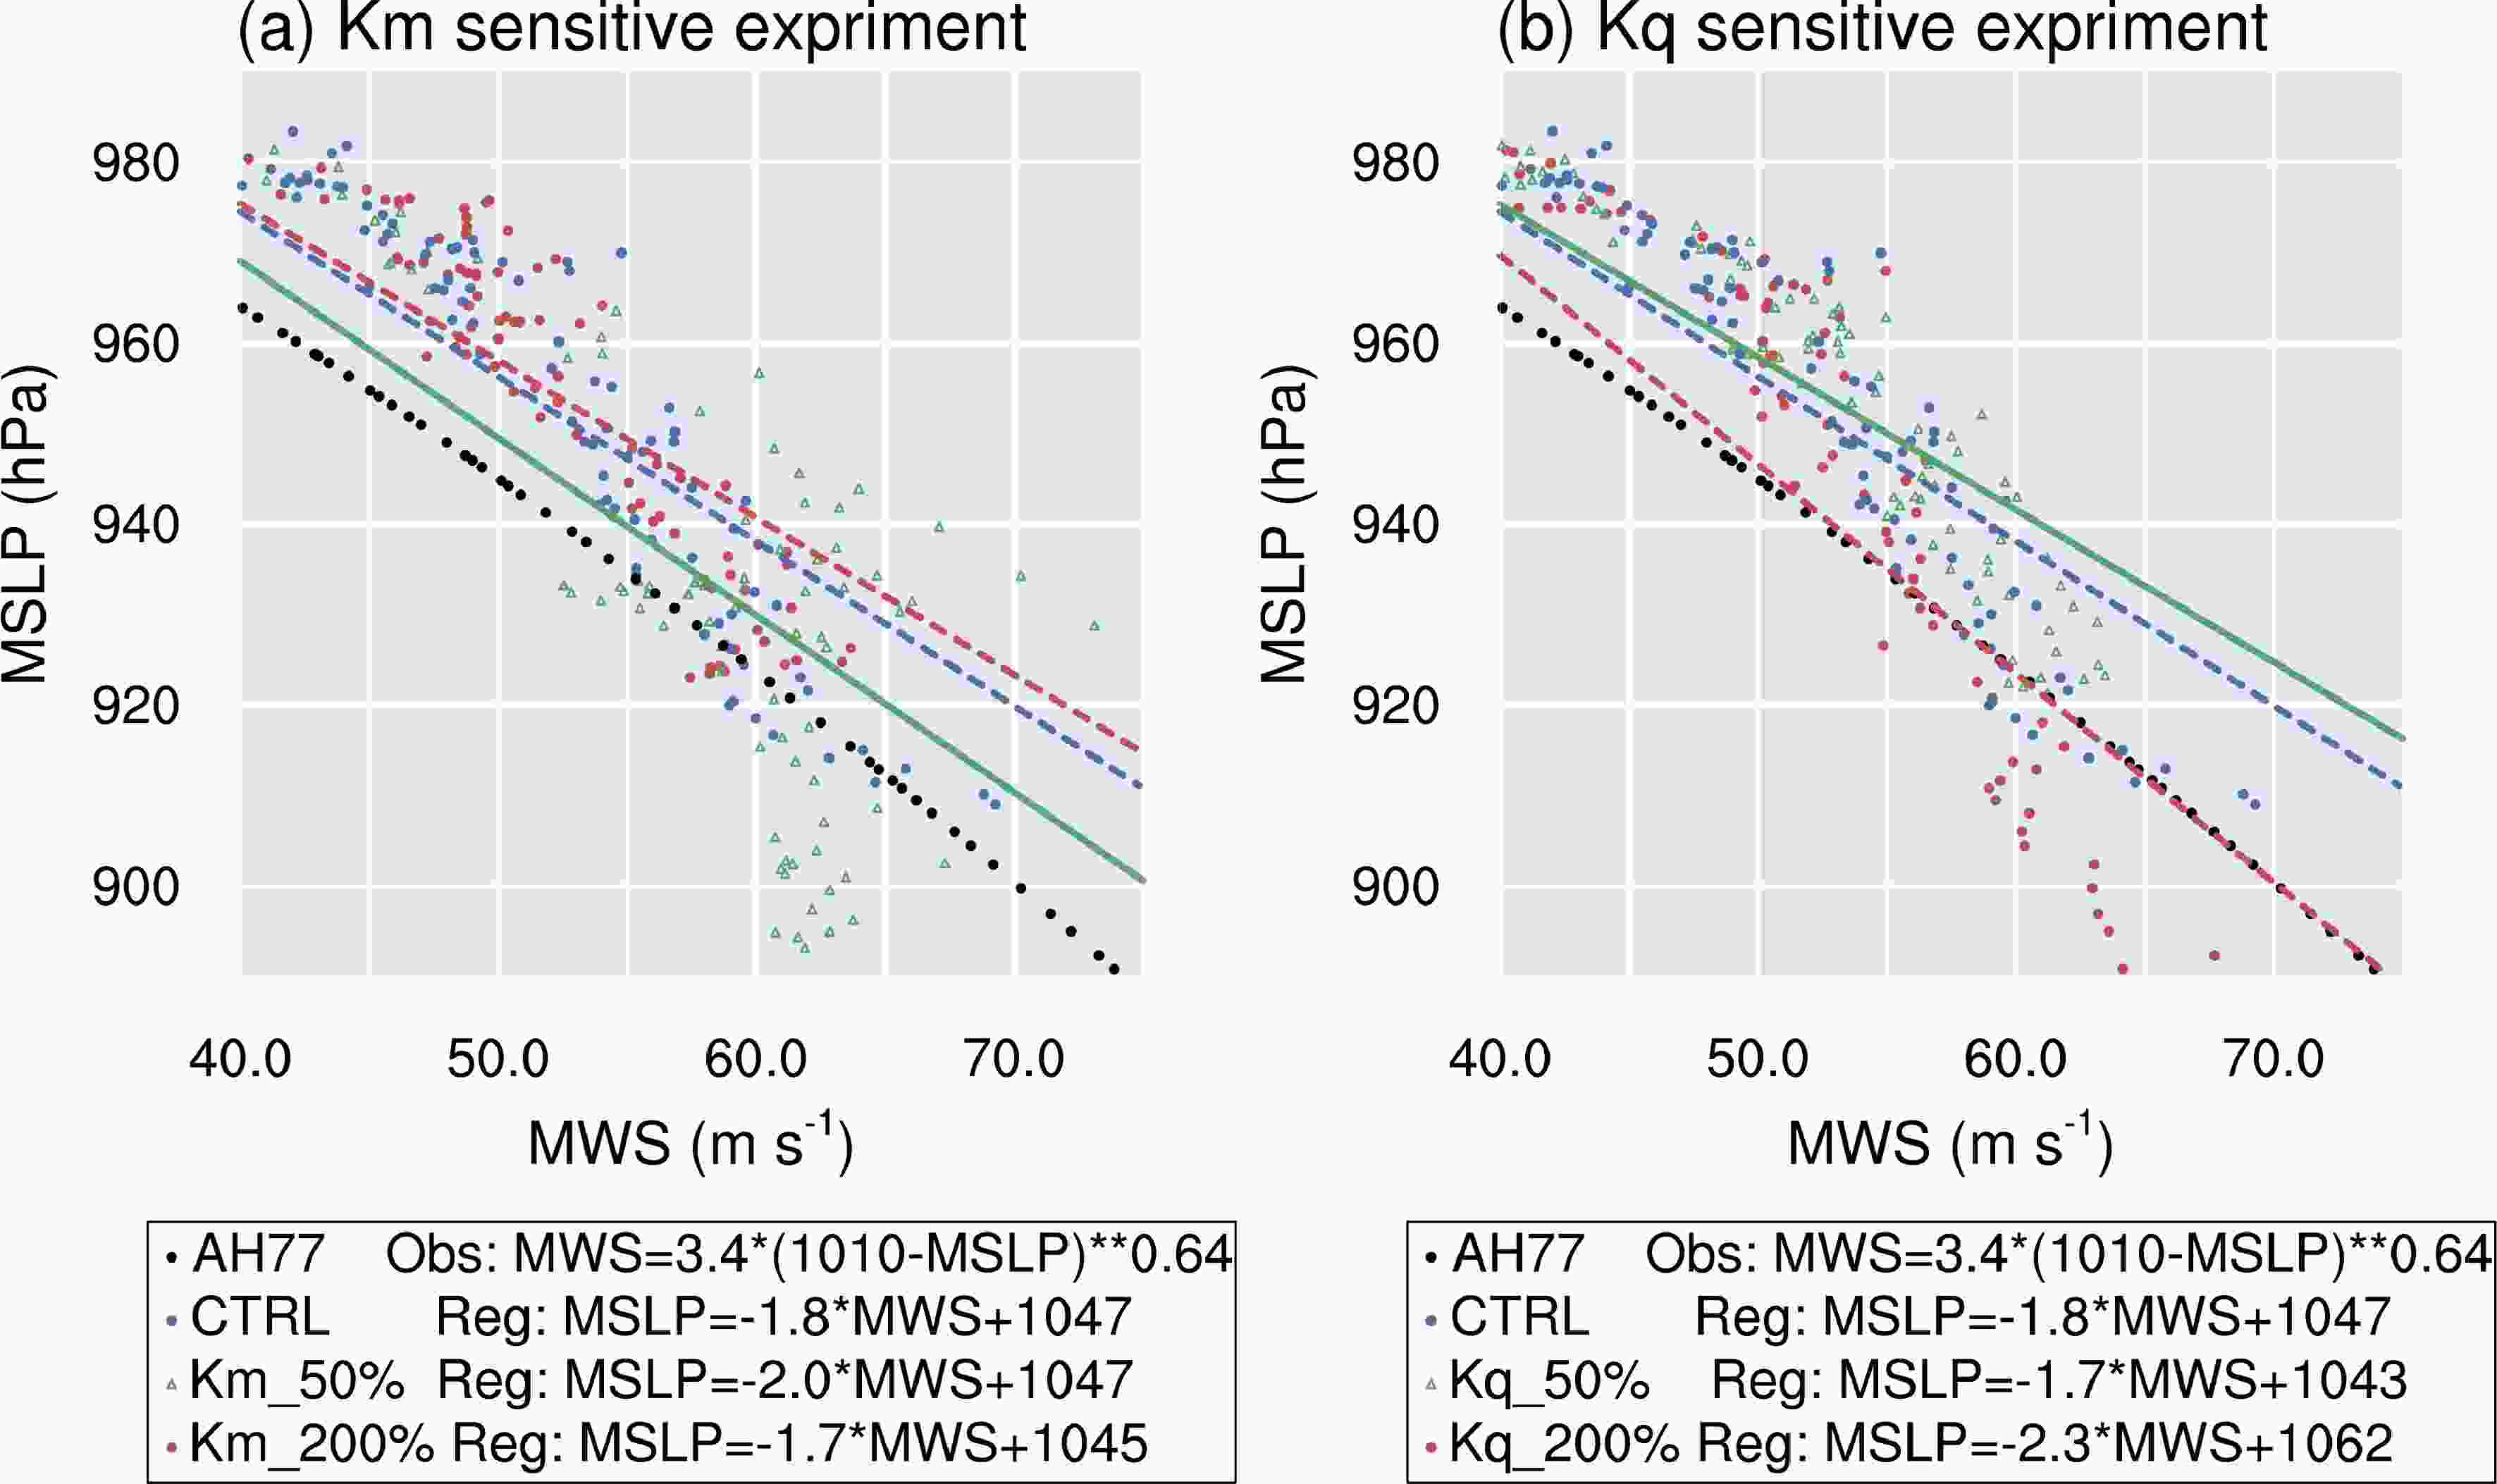 Figure4. Scatter plot of the Maximum Wind Speed (MSW, m s?1) versus Minimum Mean Sea Level Pressure (MSLP, hPa) and linear regression of wind–pressure relationship for the (a) Km and (b) Kq experiments. Solid black dots represent wind–pressure relationship from Atkinson and Holliday (1977).
On the contrary, while wind speed marginally influenced by modulation of Kq, it increases evidently in reduced Km experiment. For nearly the same value of MSLP, the wind in the Km_50% experiment was 35 m s?1 stronger than that in the Km_200% experiment. A noticeable feature is that the change in the wind–pressure relationship only occurred during the rapid intensification of the tropical cyclone (36–72 h; Fig. 3). After 84 h, the wind–pressure rate shows a similar trend in both the Km_50% and Km_200% experiments. To further investigate the roles of changing the value of Kq or Km in simulating the intensity and structure of tropical cyclones, the next section explores the simulated model results in the PBL that are directly influenced by the eddy diffusivities in the sensitivity experiments.
2
3.2. PBL structure
Figure 5 shows the azimuthally and 36–72 h averaged radius–height cross-sections of the potential temperature tendency superimposed on the vapor mixing ratio tendency resulting from the PBL parameterization scheme. The maximum vapor mixing ratio (Qv) tendencies in the Kq_50% and Kq_200% experiments are about 85 and 150% of that in the CTRL experiment, coinciding with the Kq distributions (Fig. 1). The maximum potential temperature is 20% larger in the Kq_200% experiment and slightly smaller in the Kq_50% experiment (< 3%) than in the CTRL experiment. In a similar manner, the moisture and temperature tendencies in the Kq_50% experiment are weaker than those in the CTRL and Kq_200% experiments, but the differences are much smaller than that in the eddy diffusivity. The differences in potential temperature and moisture tendency between the Km_50%, CTRL and Km_200% experiments are also evident, indicating a significant impact of Km. Kq is changed indirectly in the Km experiments, but its difference in Km experiments is much smaller than that in the Kq experiments. The large discrepancies in the PBL moisture and temperature tendencies are caused by the change in the intensity and structure of the tropical cyclone influenced by the momentum eddy diffusivities. Another interesting feature is that the moisture tendency maximum is located at the lowest levels of the PBL in the Kq_50% experiment, but is higher (~600 m) in the Kq_200% experiment than in the CTRL (~500 m) experiment. This suggests that the height of the moisture tendency maximum is enhanced by increasing Kq progressively from Kq_50% to Kq_200% (Figs. 5b, d, e). By contrast, the height in the Km_50% and Km_200% experiments is about 600 m, suggesting no clear trend. Although the increased Kq may directly impact the mixing ratio tendency, the potential temperature also has a relation with the moisture diffusivity (Figs. 5b, d).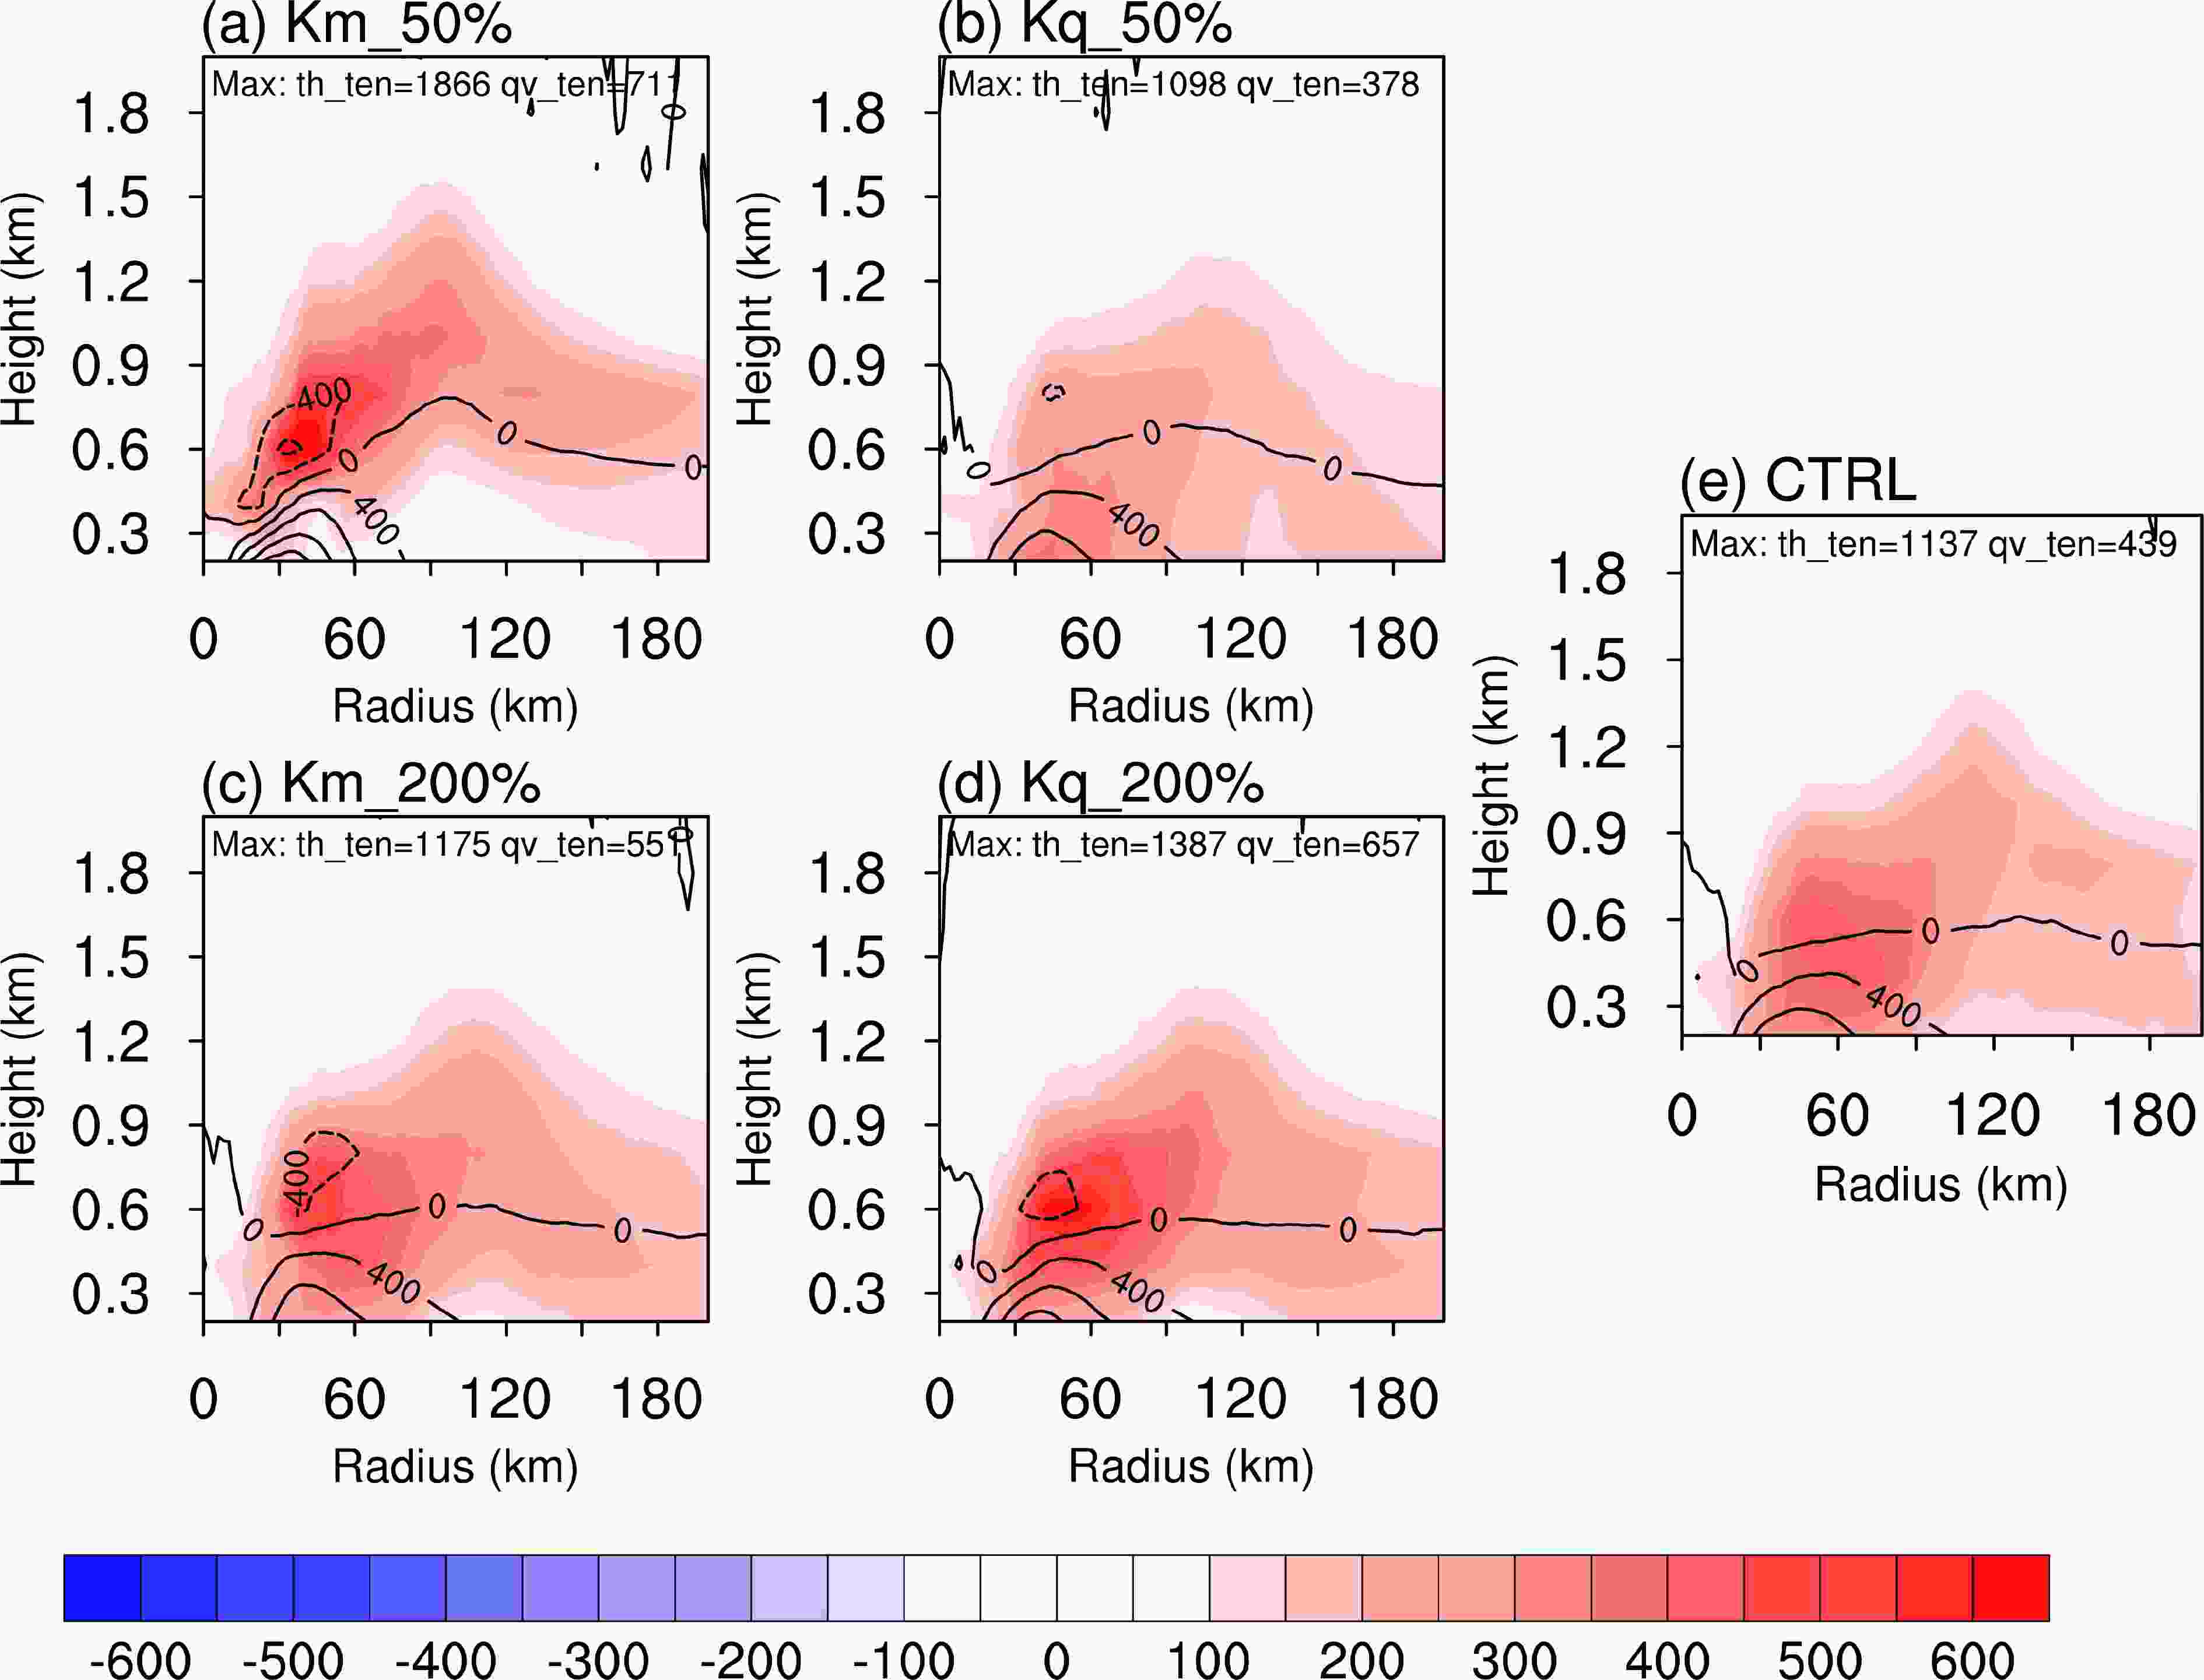 Figure5. Azimuthally and 36–72 h averaged radius–height cross-sections of the potential temperature tendency (contours, 10?6 K s?1) superimposed on the vapor mixing ratio tendency resulting from PBL parameterization (shading; 10?9 kg kg?1 s?1) for the (a) Km_50%, (b) Kq_50%, (c) Km_200%, (d) Kq_200% and (e) CTRL runs.
Figure 6 shows the azimuthally and time-averaged radius–height cross-sections of the radial wind tendency superimposed on the tangential wind tendency resulting from the PBL parameterization scheme. A comparison of the sensitivity experiments shows systematic increases in both the radial and tangential wind tendencies with a decrease in Km (or an increase in Kq). The radial wind inflow tendency in the lower PBL and the outflow tendency in the upper PBL are generally larger in the Km_50% and Kq_200% experiments than in the CTRL run. The experiment also suggests that Km has a greater impact on the wind tendency than Kq. This indicates that Km has a crucial role in the wind tendencies in these sensitivity simulations, whereas the radial wind tendency is less sensitive to the Kq sensitivity experiments. On the other hand, the PBL parameterized tangential wind tendencies are also weakly impacted by the moisture eddy diffusivities.
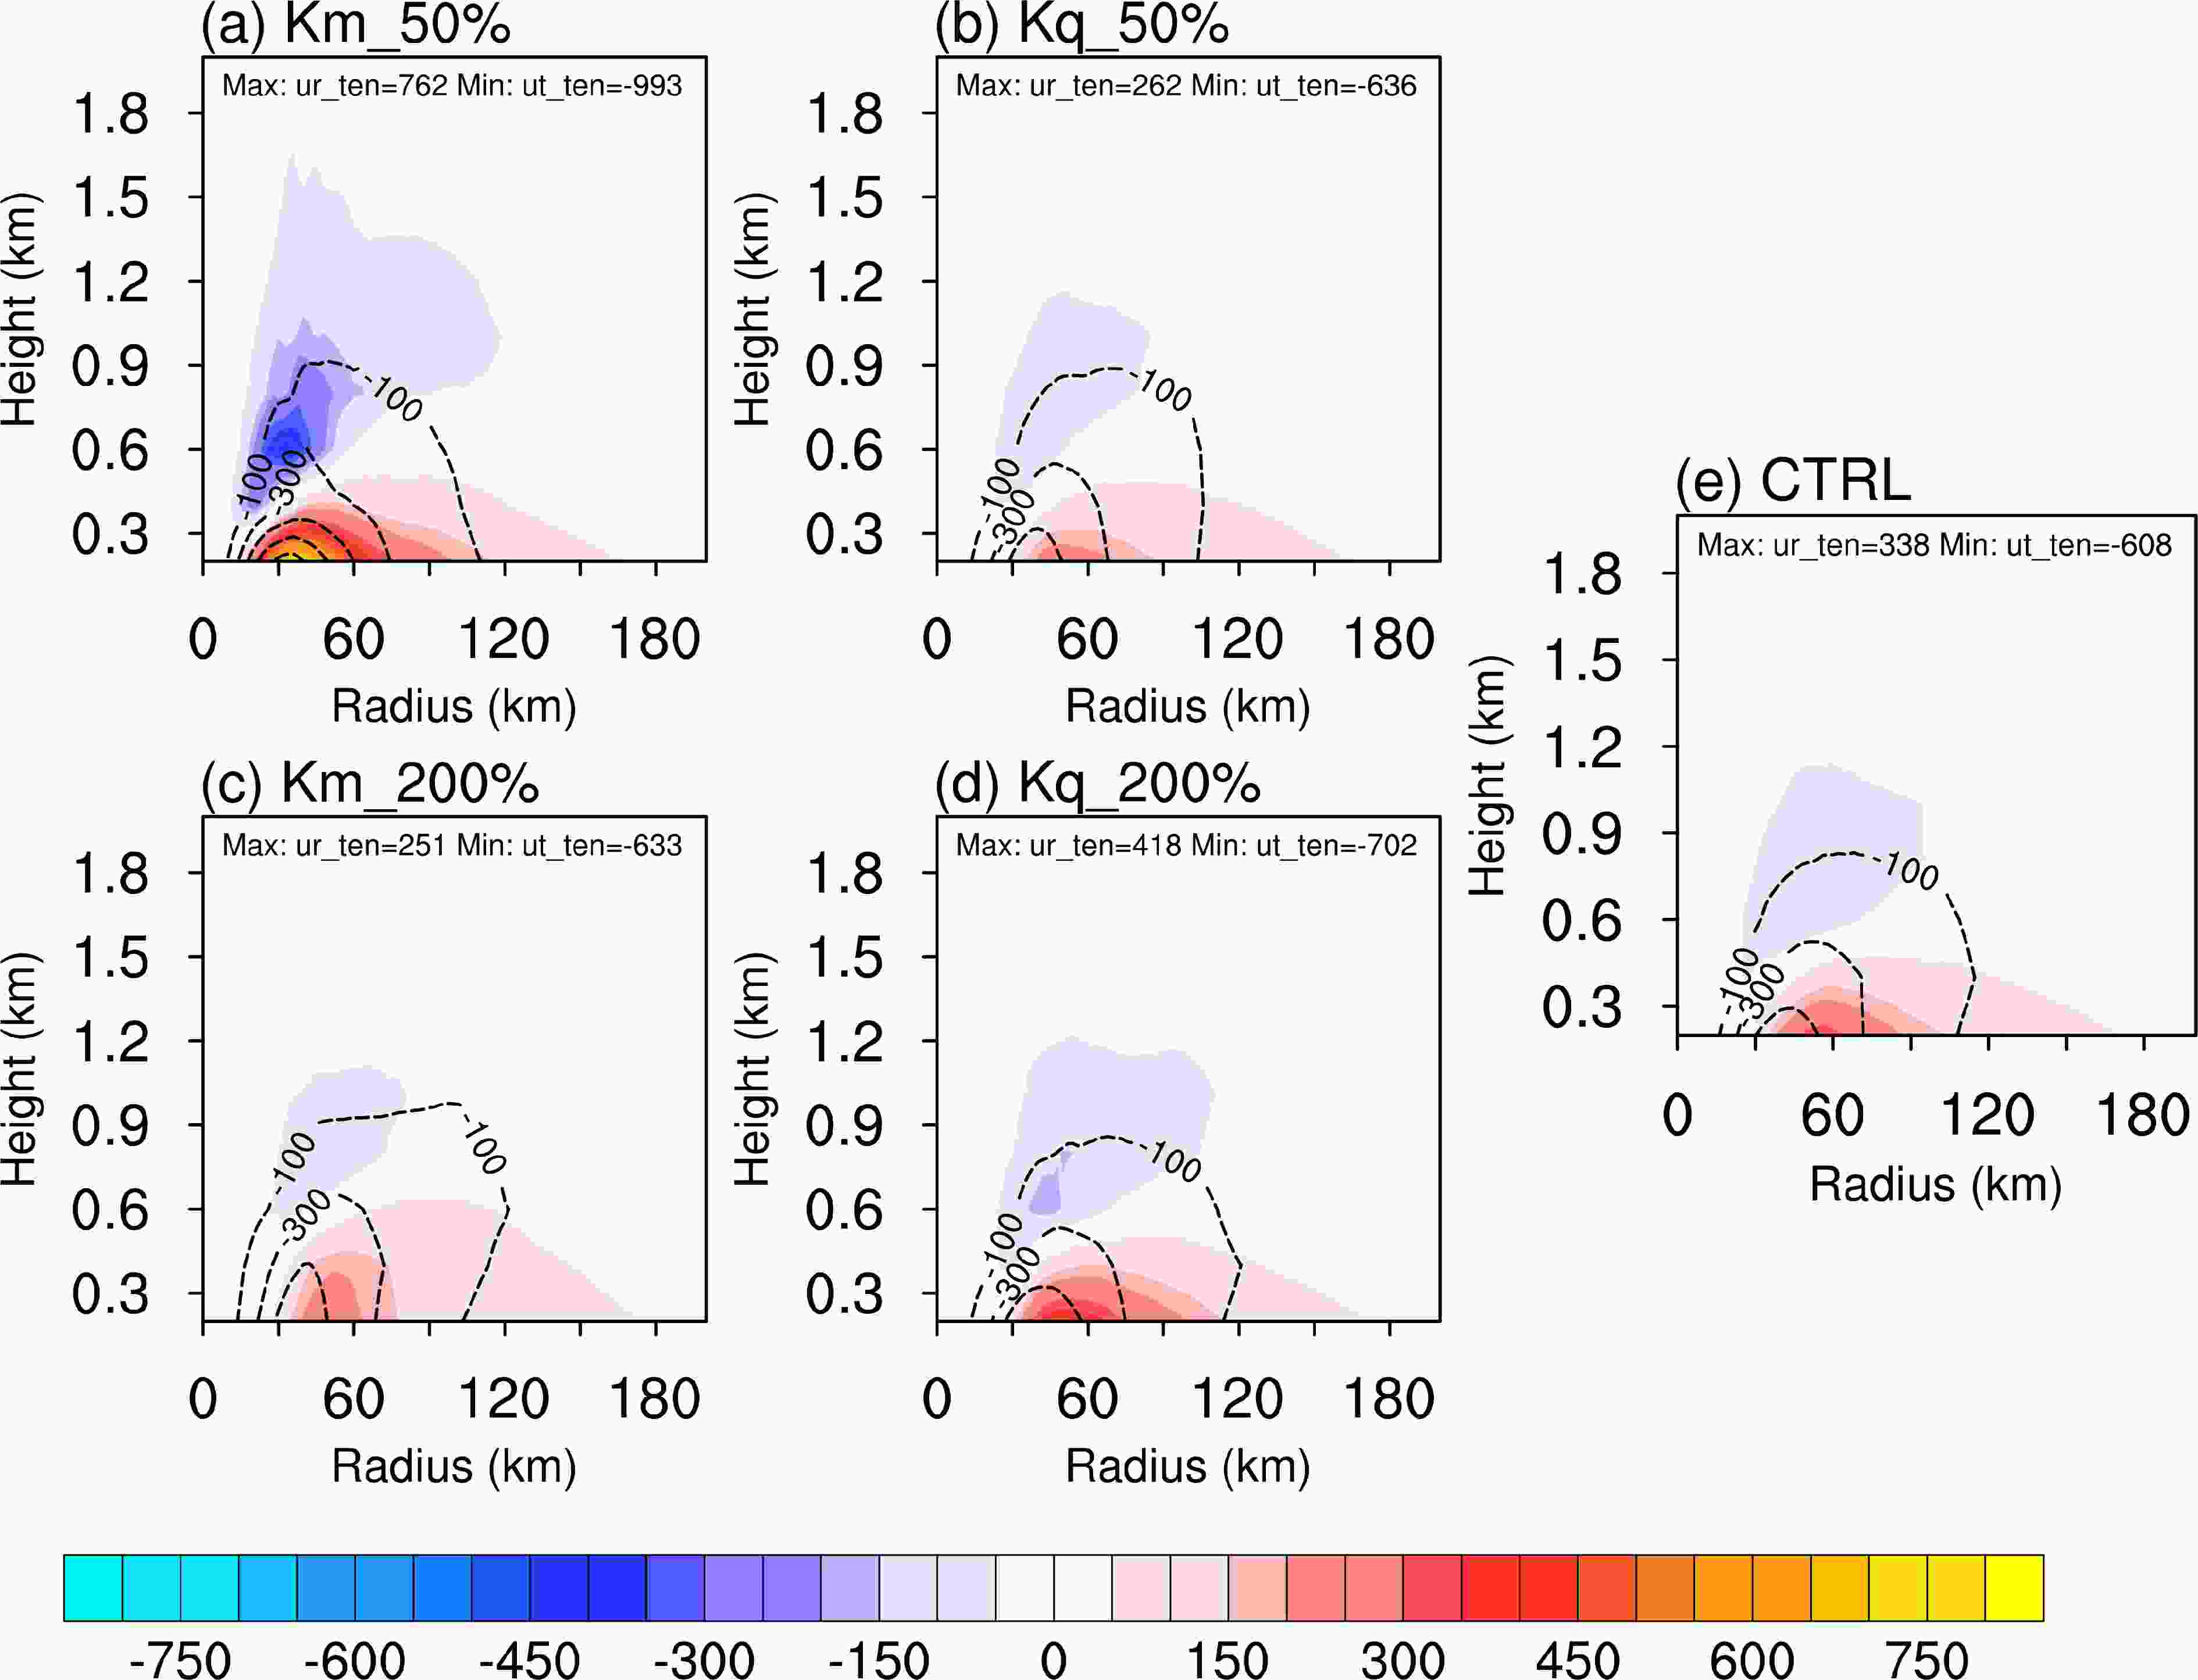 Figure6. Azimuthally and 36–72 h averaged radius–height cross-sections of the radial wind tendency (shading, 10?6 m s?2) superimposed on the tangential wind tendency resulting from PBL parameterization (contours; 10?6 m s?2) for the (a) Km_50%, (b) Kq_50%, (c) Km_200%, (d) Kq_200% and (e) CTRL runs.
Figure 7 shows radial distributions of the azimuthally averaged PBL height (PBLH). In the YSU PBL scheme, the PBLH is estimated as the first neutral level determined by the bulk Richardson number for unstable conditions (Hong et al., 2006). As Km decreases, PBLH decreases in the inner core, but increases at radii from 60 to120 km, and is nearly the same for radii > 120 km (Fig. 7a). This is similar to the results of Ma et al. (2014), suggesting that it might be caused by the intensification of the tropical cyclone. On the other hand, the reduction in Kq results in an increase in the height of the PBL (Fig. 7b), which favors an increase in the momentum eddy diffusivities. For the Kq sensitivity experiments with a larger moisture diffusivity, the top of the PBL is lower because the increase in Kq increases the PBL moisture content, so the atmosphere tends to saturation at lower altitude. The PBLH of the Kq_50% experiment is ~ 41–173 m and 120–220 m deeper than that of the CTRL and Kq_200% experiment, respectively. The difference is largest in the eyewall of the tropical cyclone and smallest in the eye and the outer part of the tropical cyclone. The magnitude of Km in the Kq_50% experiment increases (Fig. 1d) as the PBLH expands in the vertical direction (Fig. 7b), because Km is largely influenced by PBLH (Ma et al., 2018). Note that although Kq_200% and CTRL shows similar maximum Km values (Figs. 1b, d), averaged Km in CTRL is still larger than that of Kq_200% because of higher PBLH in CTRL. As reported by Gopalakrishnan et al. (2013), the decreased Km increases the gradient of the vertical wind, enhancing surface friction, which then results in a stronger radial wind tendency, increasing the intensity of the tropical cyclone. This is consistent with the results of the Km sensitivity experiments (Figs. 6a, c). However, the similar tropical cyclone wind intensities for the Kq sensitivity experiments are inconsistent with the fact that Km is weaker in the Kq_200% experiment. Increasing the PBLH induced by decreasing moisture eddy diffusion and subsequently increasing Km does not have a clear influence on the maximum surface and tangential winds in the vertical direction in the Kq experiments.
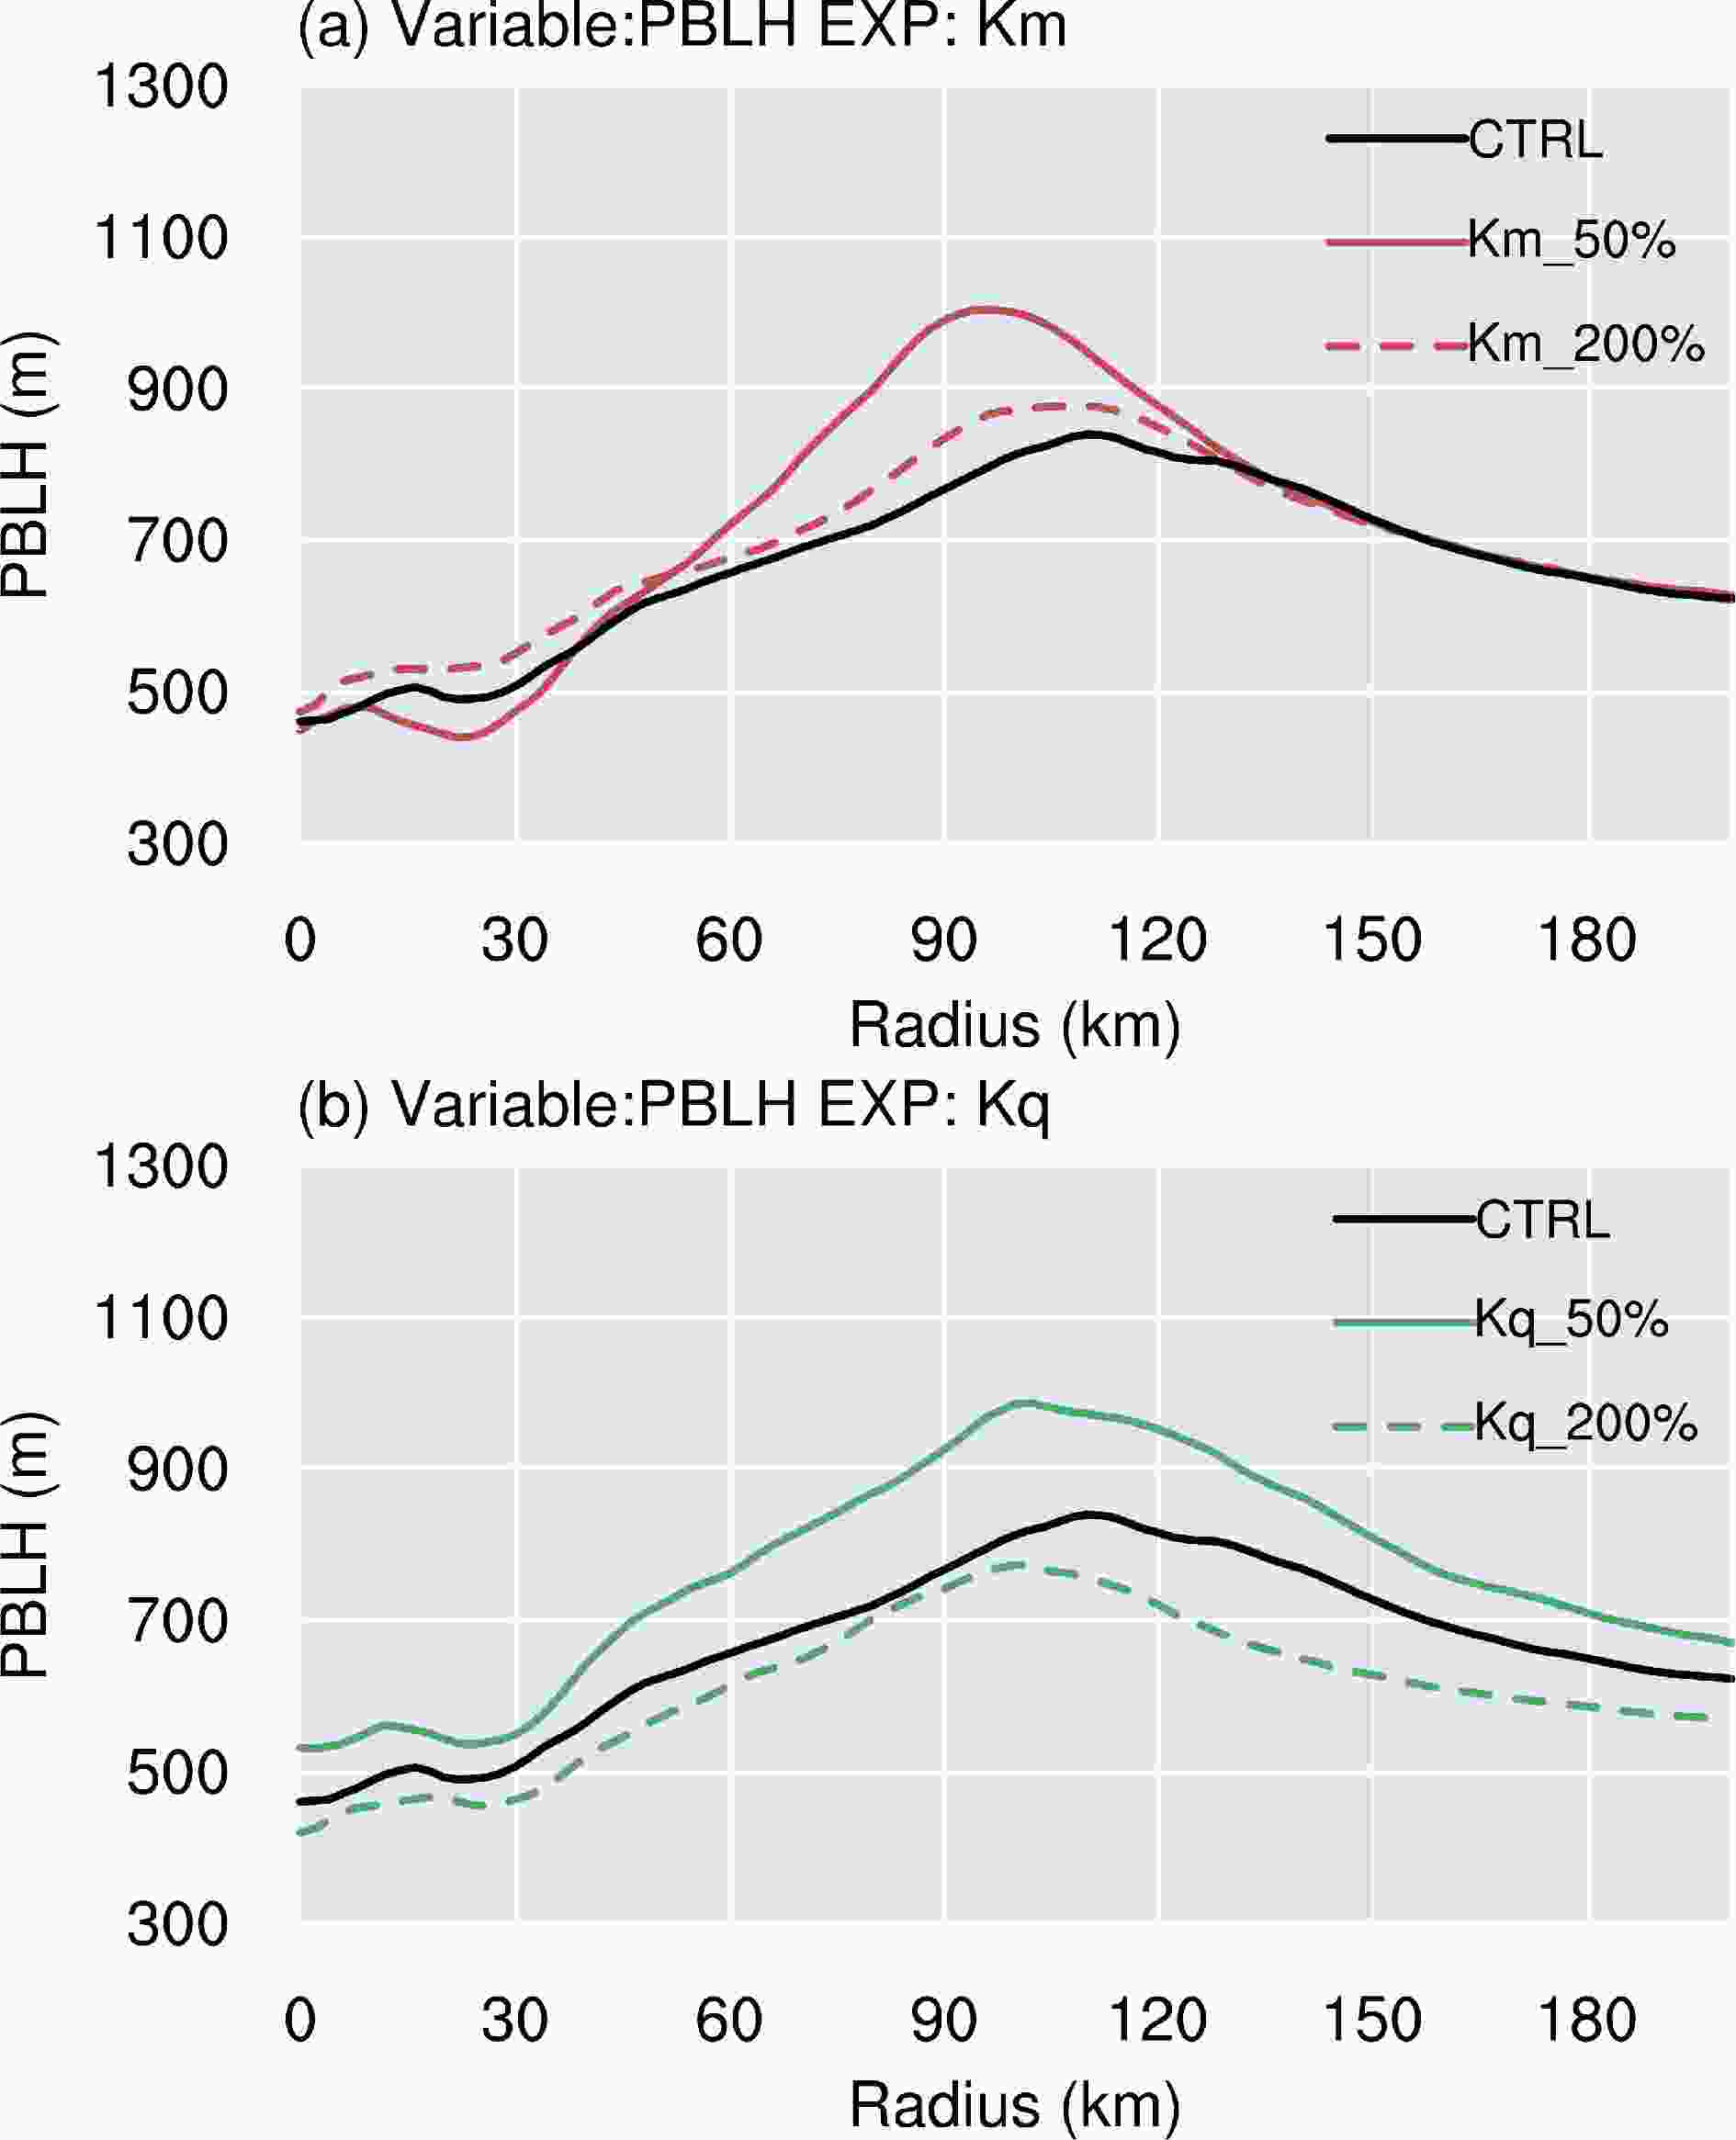 Figure7. Radial distributions of the azimuthally averaged PBL height for the (a) Km and (b) Kq experiments averaged between 36 and 72 h from the CTRL, Kq_50%, Kq_200%, Km_50%, and Km_200% runs.
There is no clear distinction between the tangential wind in the Kq experiments (Figs. 8b, d, e). However, the magnitude of the inflow slightly increases near eyewall and extends to the outer region of the tropical cyclone, resulting in small changes to its intensity. The largest increase in the radial and tangential winds is seen in the Km_50% experiment (Fig. 8a), corresponding to the strongest influence on the PBL wind tendency (Fig. 6a). Compared to the CTRL experiment, the radial and tangential winds marginally decrease in the Km_200% experiment because the intensity of the tropical cyclone is marginally affected by the eddy diffusivities in the YSU PBL scheme when it increases beyond a threshold. The non-linear effect of the eddy diffusivities has been reported previously by Gopalakrishnan et al. (2013) in their idealized tropical cyclone with the modulation of eddy diffusivities. Similar results were also reported by Ma et al. (2018). In their study, storm intensity is nearly the same as the PBLH varied from 100% to 300%, which is equivalent to the change in eddy diffusivities in the KPP PBL schemes.
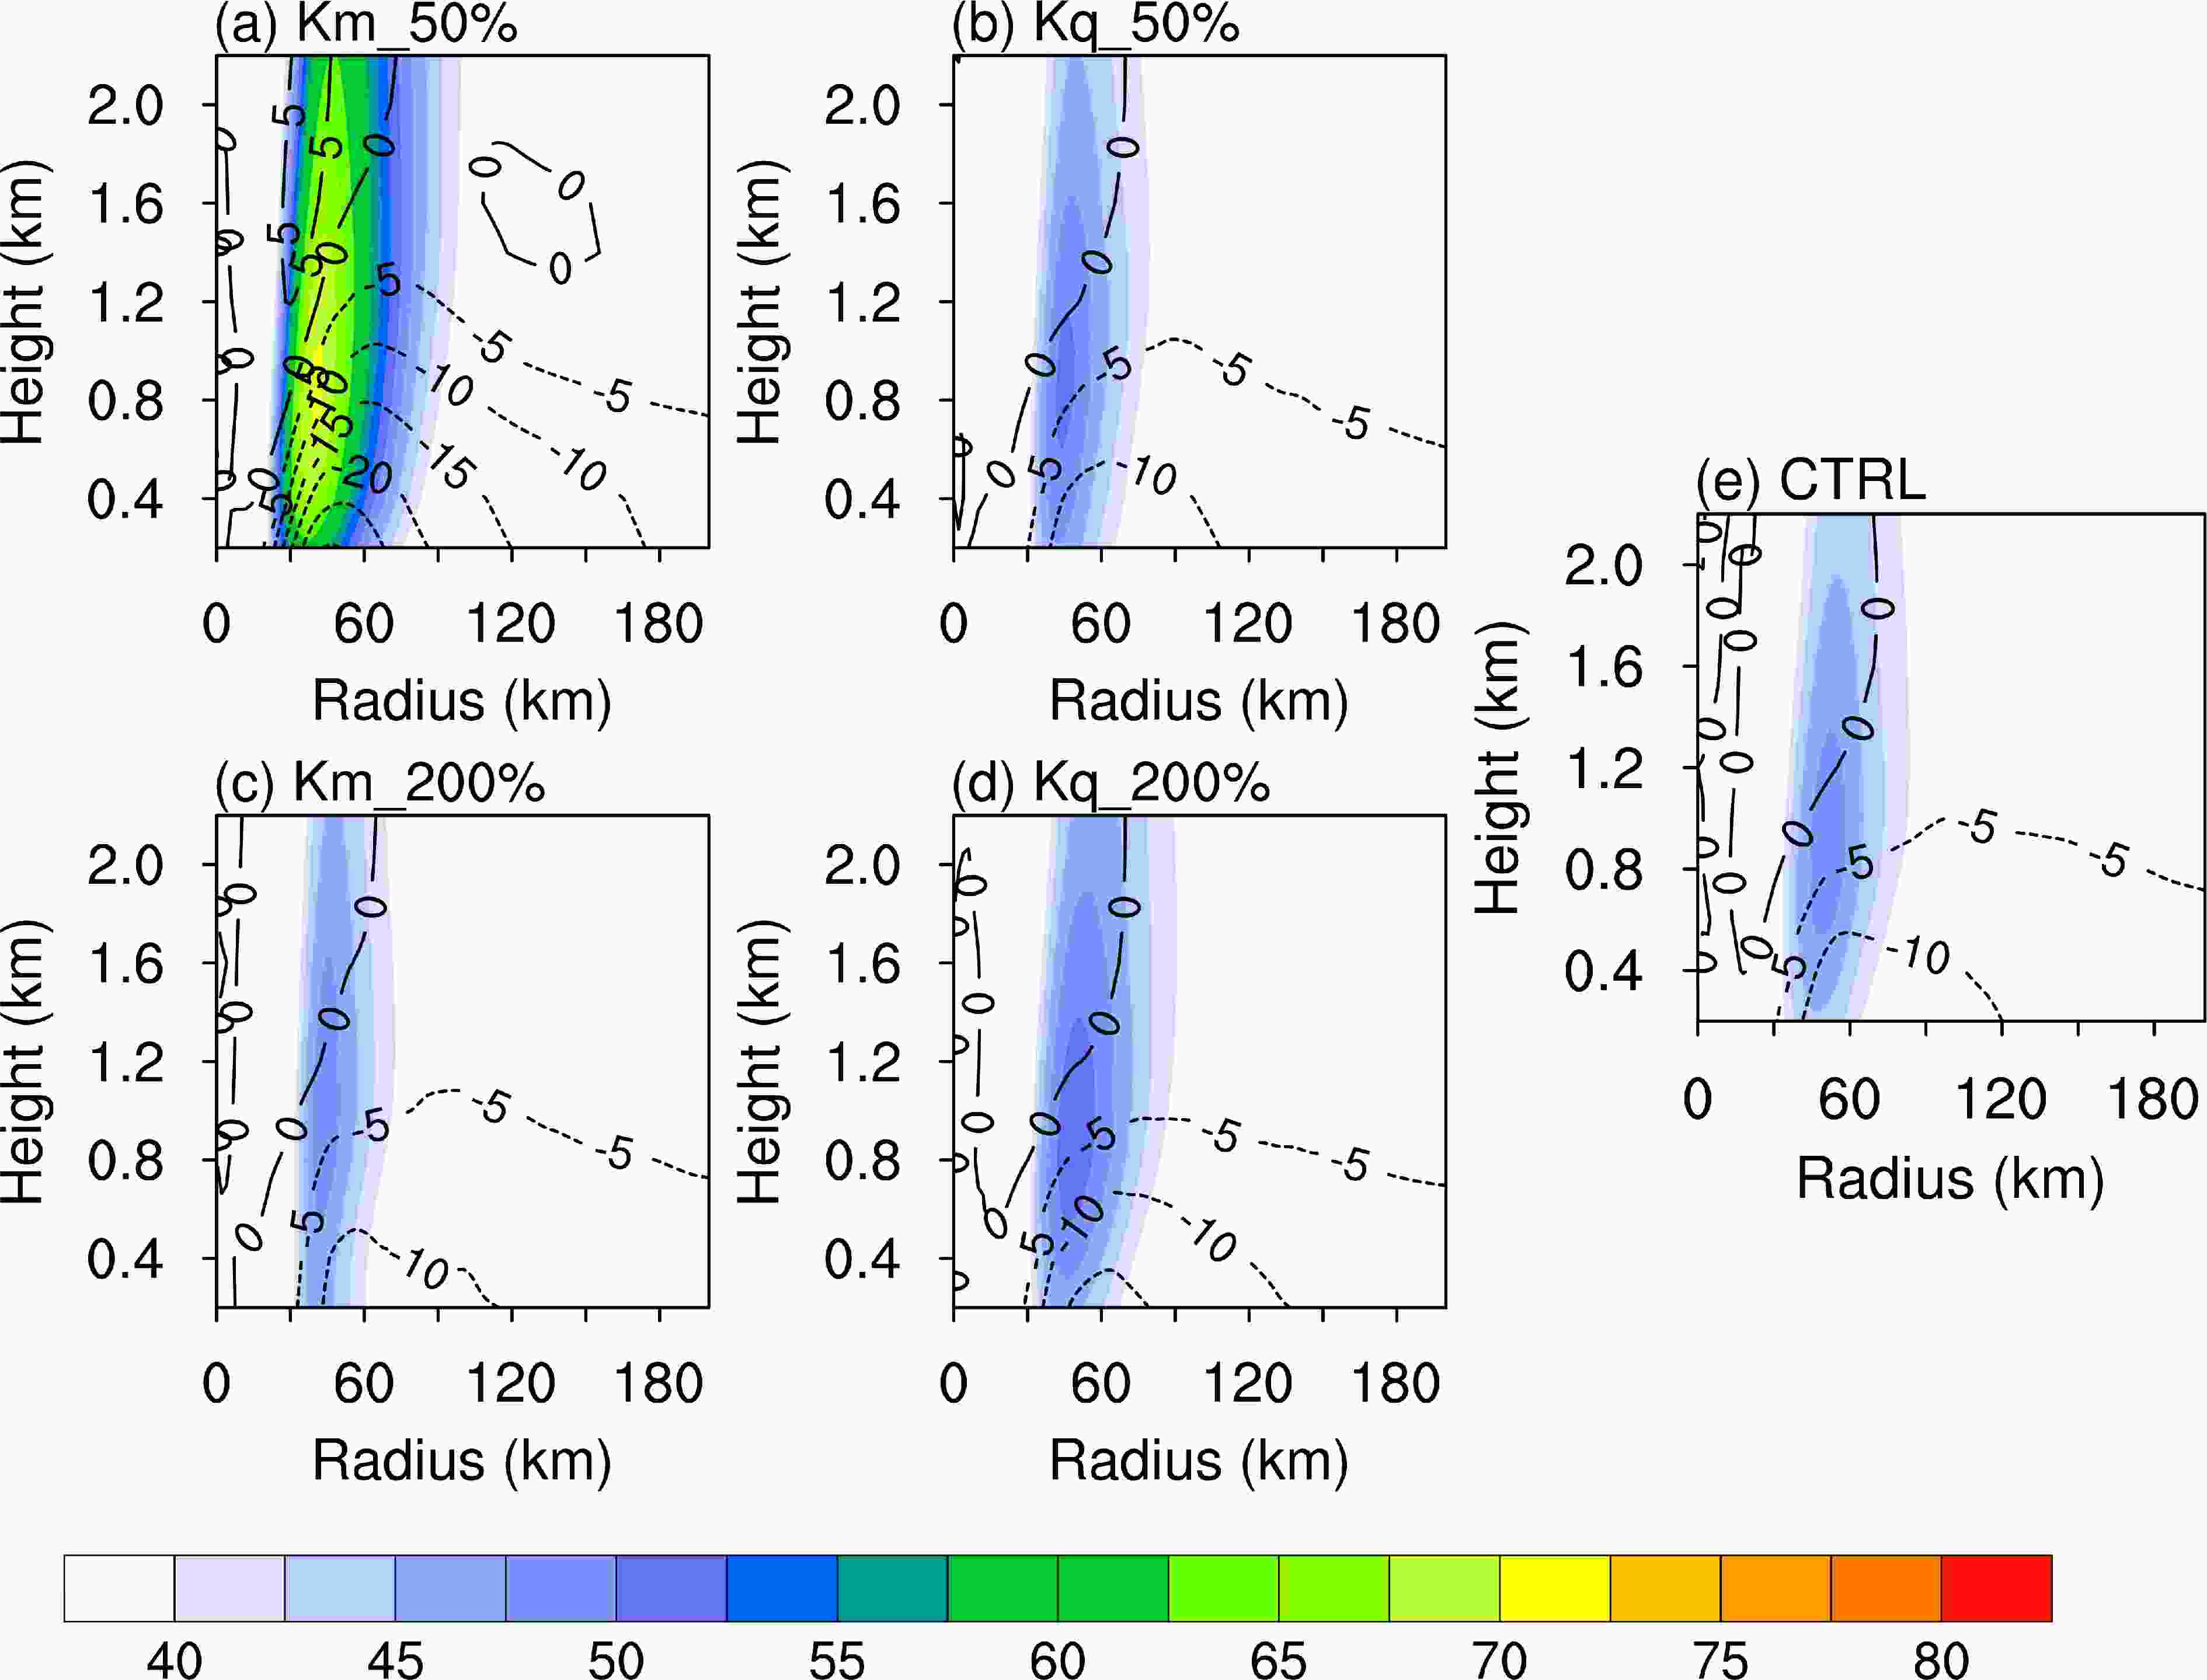 Figure8. Azimuthally and 36–72 h averaged radius–height cross-sections of the tangential wind contours (shading, m s?1) superimposed on the radial wind speed (black contours; m s?1) for the (a) Km_50%, (b) Kq_50%, (c) Km_200%, (d) Kq_200% and (e) CTRL runs.
In general, a decrease in Km increases the gradient of the vertical wind, which increases surface friction, leading to stronger radial winds (Gopalakrishnan et al., 2013). A decrease in Km can also produce more intense and smaller tropical cyclones. This is consistent with our Km sensitivity experiments. By contrast, the height of the PBL along the radial direction increases by about 100–200 m in the Kq runs as a result of the increase in the moisture of the PBL, which increases the diffusion of momentum, giving a slightly stronger radial inflow. An increase in the moisture and radial inflow leads to enhanced convergence in the eyewall, an increase in the PBL moisture in the eyewall, and an increase in diabatic heating. However, this process does not significantly increase the wind field intensity of the tropical cyclone. It is possible that the wind field intensity of the tropical cyclone may be changed by other physical processes, which will be discussed in the following section. As the impact of Km on the intensity and structure of the tropical cyclone was very similar to that reported in previous studies (Gopalakrishnan et al., 2013; Zhang et al., 2015), the following sections will only examine the influence of the moisture diffusivity on the simulation of tropical cyclones and the mechanisms involved.
2
3.3. Convection activity
As analyzed above, increasing the moisture eddy diffusivity increases the transport of moisture into the PBL and leads to saturation of the air at lower altitudes, which reduces the depth of the PBL. This may favor more intense convection activity in the rain band. Figure 9 shows Hovm?ller diagrams of the azimuth mean composite radar reflectivity to illustrate the impact of increasing the moisture content of tropical cyclones on convection. The variation in the rain band among the sensitivity experiments is more intricate than that of the vertical structure of tangential wind. The convection activities of the inner core are more active for the CTRL and Kq_200% runs (Figs. 9a, c) than for the Kq_50% experiment (Fig. 9b). However, the rain band in the Kq_50% experiment can spiral outward and lead to stronger rain bands in the far outer regions of the tropical cyclone than in the Kq_200% and CTRL experiments. The simulated horizontal composite reflectivity (not shown) also suggests a more intense eyewall and inner rain band in the higher Kq runs. Note that the extent and strength of the spiral bands are not linear with variations in Kq. The difference between the Kq_200% and CTRL runs is much less than that between the Kq_50% and CTRL runs. The difference in convection in both the eyewall and inner core rain bands in the Kq_200% and CTRL runs is uniformly stronger than that in the Kq_50% runs throughout the experiment and becomes smaller over time. The weakened convection in both the eyewall and inner core rain band is in agreement with the suppression of the moisture content in the PBL by the decrease in mixing, as well as the smaller storm size in the Kq_50% run. This indicates that the moisture eddy diffusivity is crucial in the evolution of the rain band, which may decrease the wind strength of tropical cyclones. Figure9. Hovm?ller diagrams of the azimuth mean composite radar reflectivity (dBZ) for the (a) CTRL, (b) Kq_50% and (c) Kq_200% runs.
The evolution of the lowest model level tangential wind over time reveals a steady expansion of the tropical cyclone wind field with increasing moisture eddy diffusivity in the Kq_200% experiment (Fig. 10). In the Kq_200% experiment, the tangential wind expands outward during the integration period, but the difference is much smaller from 24 to 84 h, with rapid expansion from 84 to 120 h. This feature is similar to the change of the tropical cyclone environment moisture, but the differences between the Kq sensitivity runs are much smaller than those seen by Hill and Lackmann (2009) with a changing of environment moisture. This may because the increase in moisture caused by eddy diffusion in the PBL is much less than that from the environment (Yang et al., 2011; Wu et al., 2013).
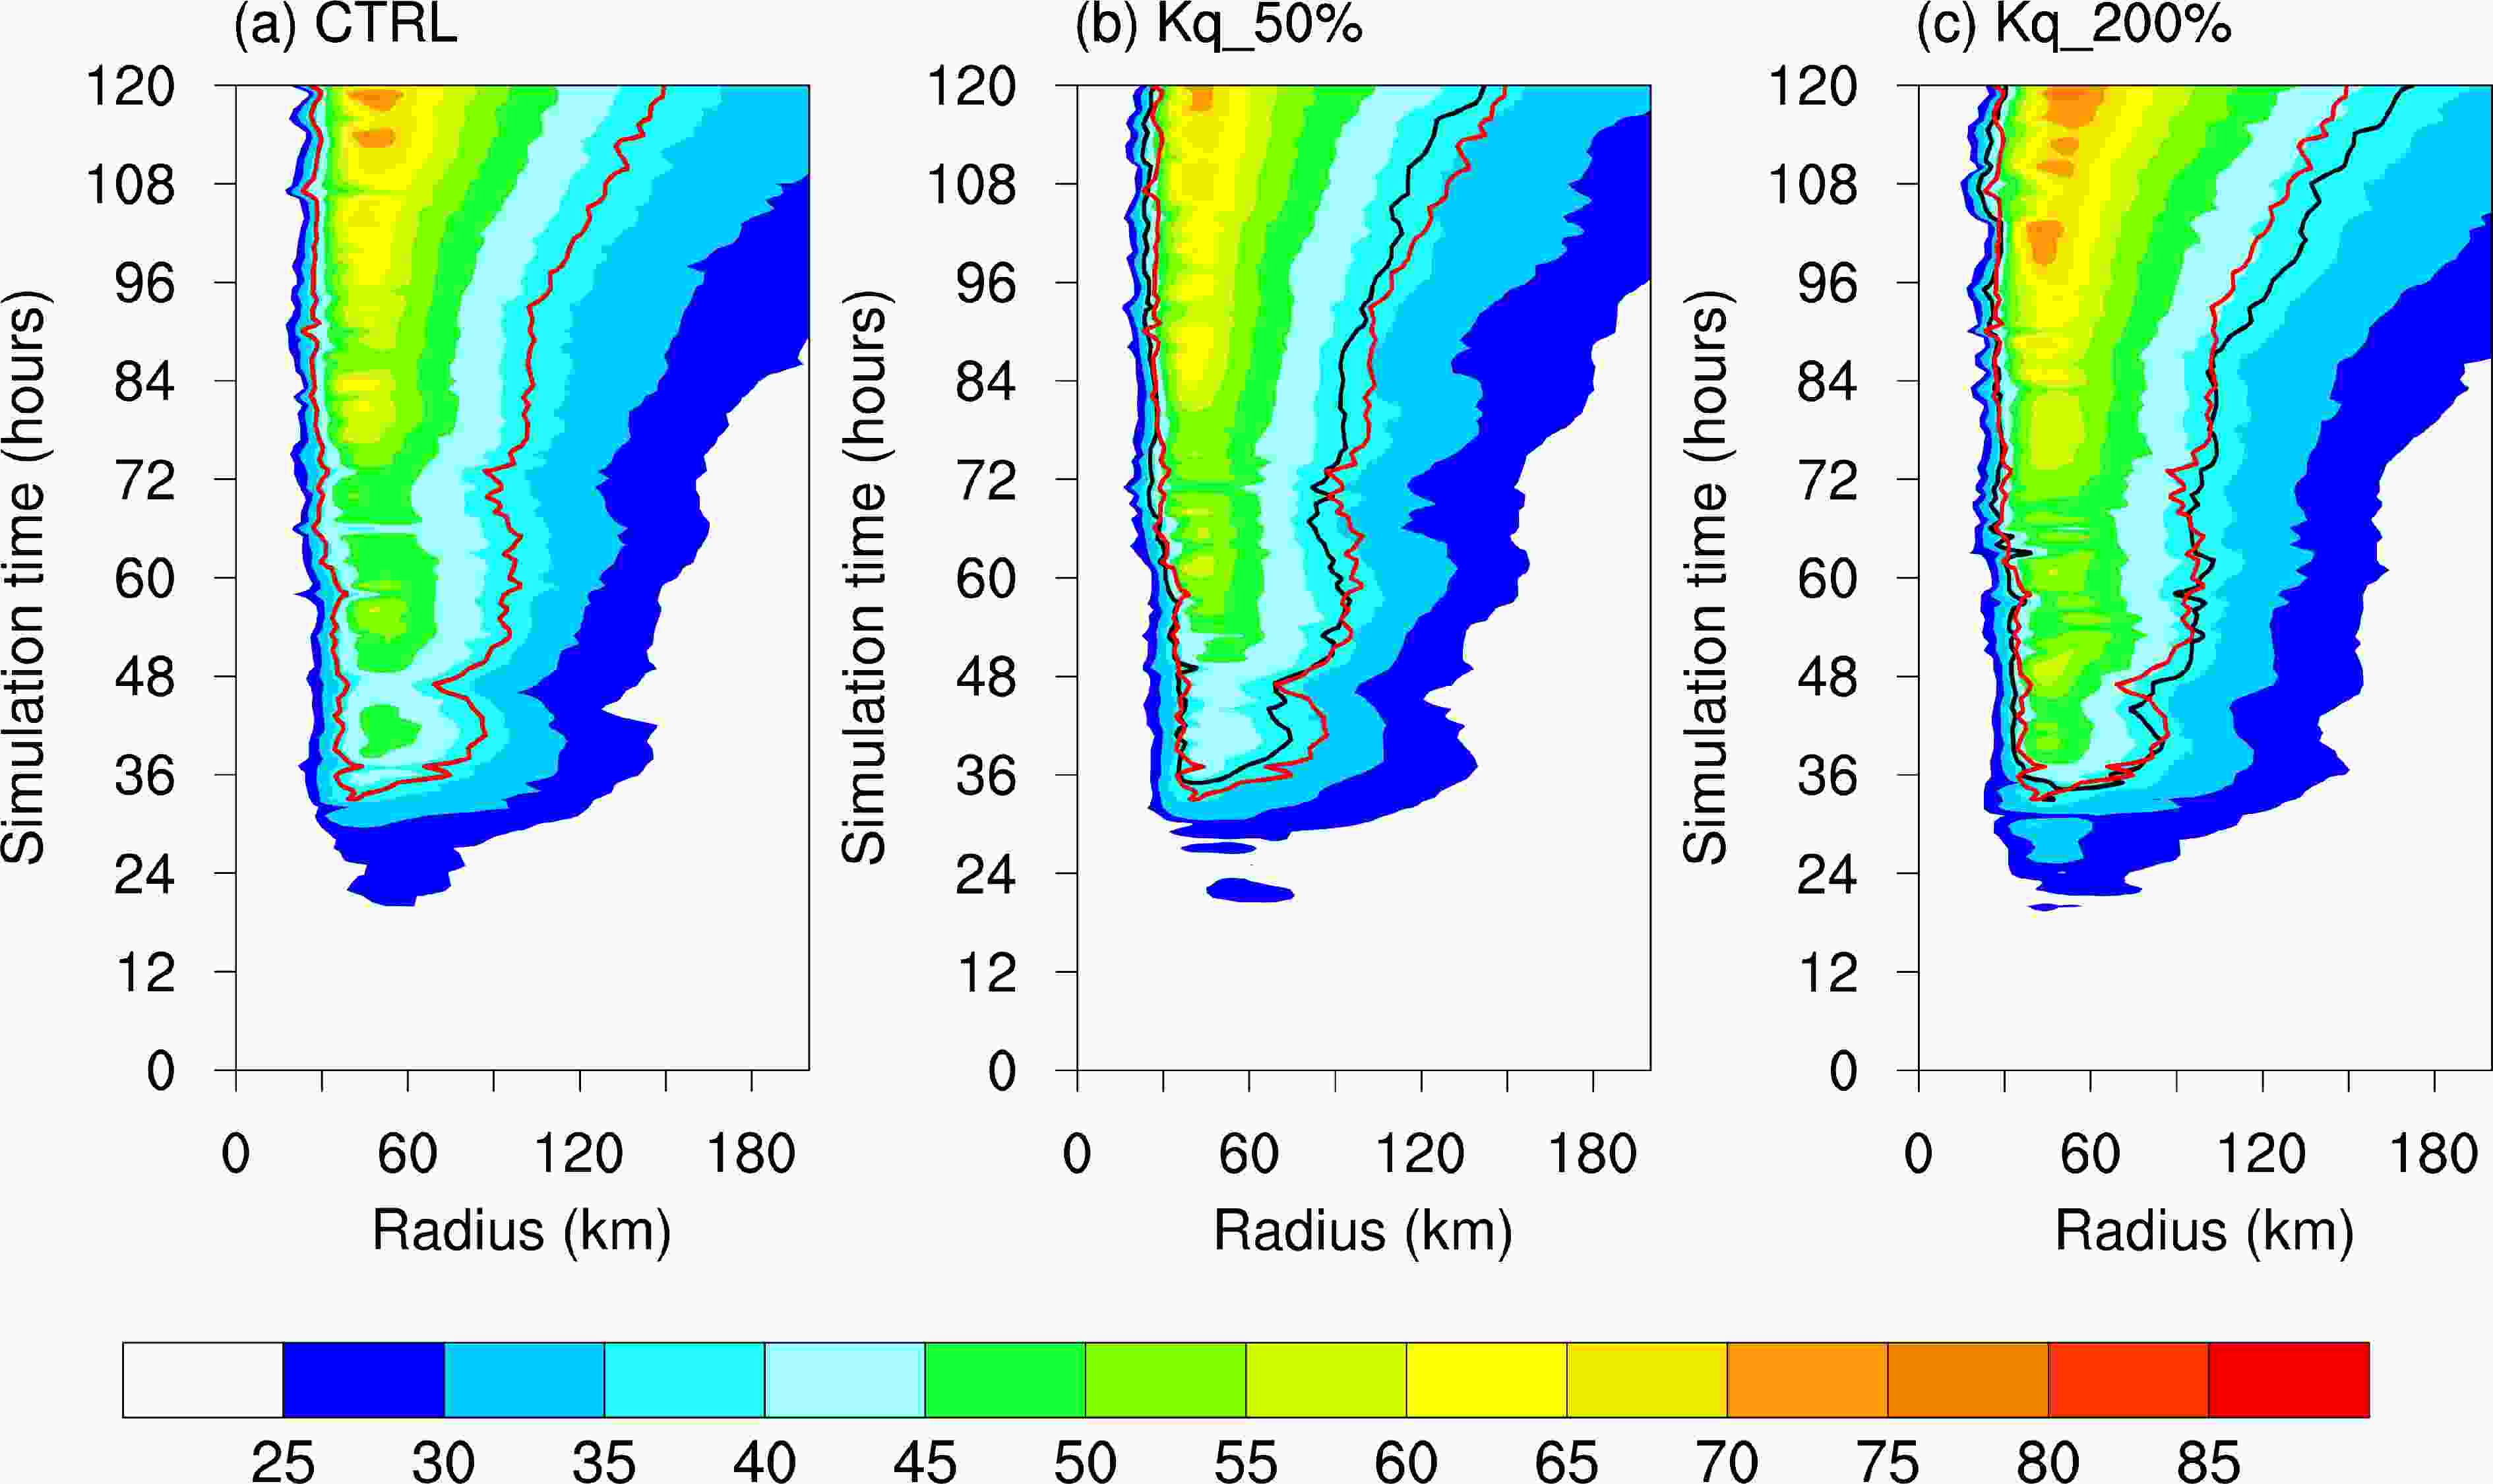 Figure10. Hovm?ller diagrams of the azimuth mean composite tangential wind speed (m s?1) and contours of the 37.5 m s?1 wind speed (black lines) for the (a) CTRL, (b) Kq_50% and (c) Kq_200% runs. The red line represent the contour of the 37.5 m s?1 wind speed in the CTRL run.
In summary, varying the vertical moisture eddy diffusion influences the distribution of convection and the rain bands. The convection activities of the eyewall and inner core in Kq_200% and CTRL were more active than in the Kq_50% run. However, the rain band of the Kq_50% run spiraled outward, resulting in a stronger rain band in the far outer region of the tropical cyclone than in the Kq_200% and CTRL experiments, similar to the results of Ma et al. (2018). The simulated horizontal composite reflectivity also suggests a better developed spiral rain band in the higher Kq runs. The extent and strength of the spiral bands are not linear with Kq. The difference between the Kq_200% and CTRL runs is much less than that of the Kq_50% and CTRL runs. This indicates that the moisture eddy diffusivity is crucial to the evolution of the rain band. The more humid air in the PBL results in more intense convection in the inner region. Heating in the outer core rain band and convection can decrease the intensity of the tropical cyclone, but increases its size (Wang, 2009). Thus, for the runs with an increased moisture eddy diffusion, an increase in the moisture content of the PBL results in an enhanced rain band, an increase in the size of the tropical cyclone and a decrease in the wind fields. This may balance the increase in wind speed caused by a decrease in the depth of the PBL.
2
3.4. Physical mechanisms
To investigate the basic structure of the TC, azimuthally averaged radius–height cross-sections of potential temperature anomaly, tangential and radial wind speed superposed with in-plane flow vectors at 120-h for the Kq sensitivity experiments are shown in Fig. 11. All experiments show a typical tropical cyclone structure: a strong radial inflow in the boundary layer, a strong updraft in the eyewall, a warm core and a pronounced outflow layer in the upper troposphere. In general, increasing the moisture diffusivities has less notable influence on the tangential winds, which is in agreement with surface maximum wind speed. For example, the maximum tangential wind speed is about 70 m s?1 in Kq_50%, 60 m s?1 in CTRL, and 78 m s?1 in Kq_200%. However, despite the simulation of a stronger TC in Kq_50%, its associated upper-level warm core is weaker than that in CTRL and much weaker than that in Kq_200%. This indicates stronger warm core tends to be realized when greater moisture diffusivities are used in PBL. The upper-level warm core shows a similar trend as MSLP in the Kq sensitivity experiments.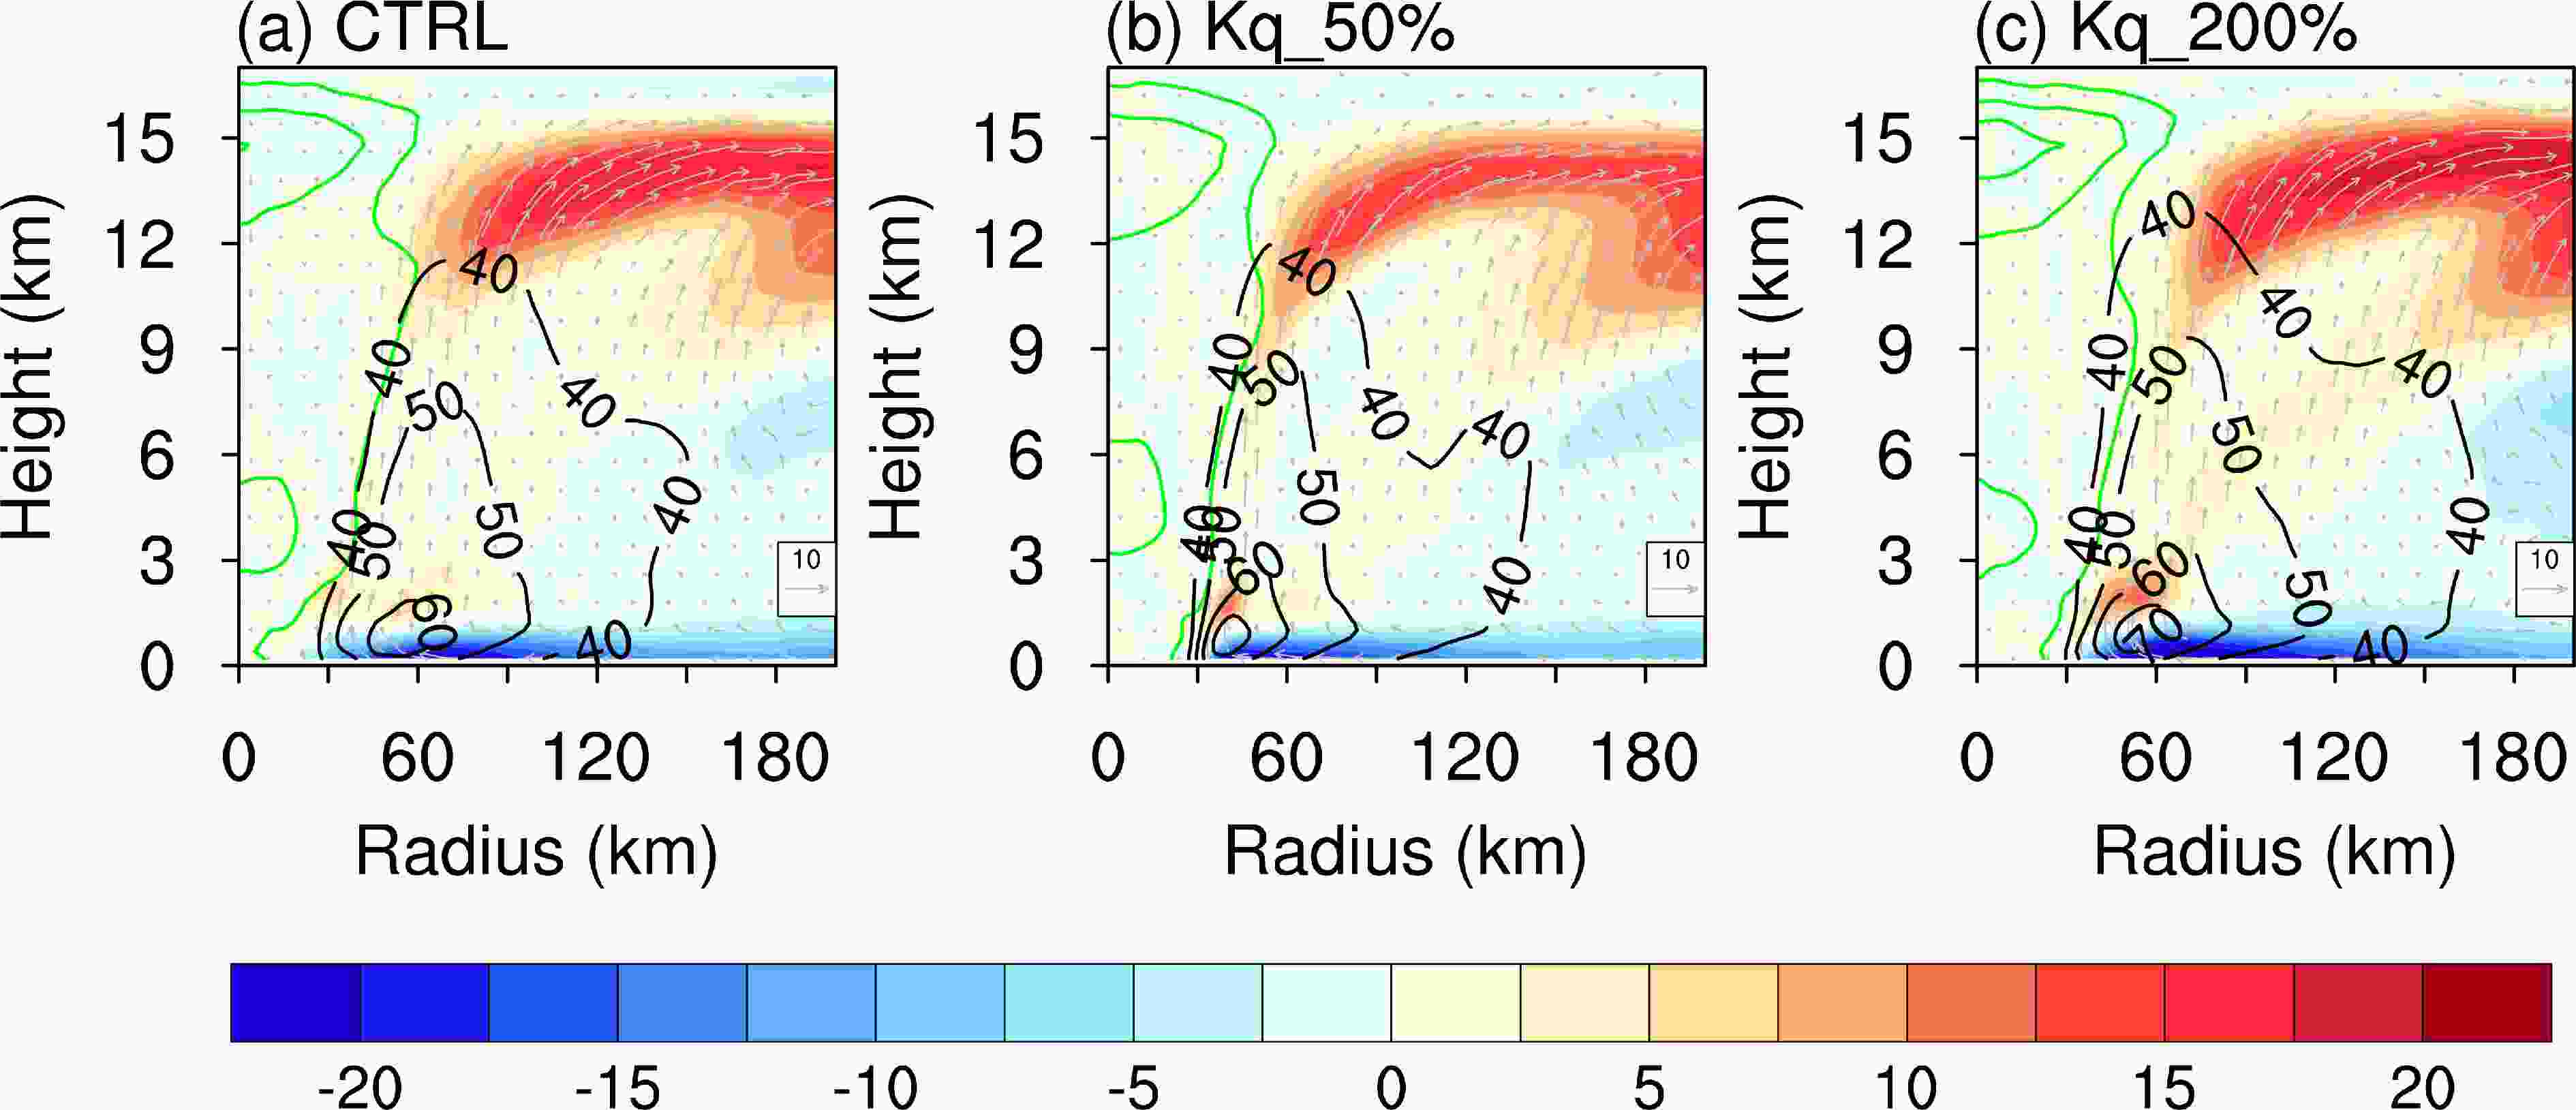 Figure11. Azimuthally averaged radius–height cross-sections potential temperature anomaly (K, green contour at intervals of 5 K), tangential wind speed (m s?1, black contours at intervals of 10 m s?1) and radial wind speed (m s?1, shaded) superposed with in-plane flow vectors at t = 120 h for the Kq sensitivity experiments.
To further investigate the impact of Kq on the variation in the PBL moisture, Figure 12 shows the 96–120 h average radius–height cross-sections of the relative humidity (Fig. 12a) and the difference in relative humidity between the Kq_%200 and Kq_50% runs (Fig. 12b) superimposed on the diabatic heating. In the different Kq runs, the enhanced moisture is mostly located in the PBL and is transported by the radial inflow, then converges and is lifted up by the updraft in the eyewall. The important point is that although the diffusion of moisture modulates the moisture content of the eyewall in the PBL, this increase in moisture is only a very small part of the total moisture content, consistent with previous studies (Yang et al., 2011; Wu et al., 2013; Fritz and Wang, 2014). Diabatic heating is directly influenced by this fraction of the moisture via the release of latent heat by convection (Fig. 12b). An increase in the moisture and vertical movement results in enhanced convergence in the eyewall, an increase in the PBL moisture in the eyewall and an increase in diabatic heating. However, this process does not significantly affect the pressure and wind field intensity of the tropical cyclone, because diabatic heating is only slightly increased by the enhanced moisture (cf., Figs. 12a, b).
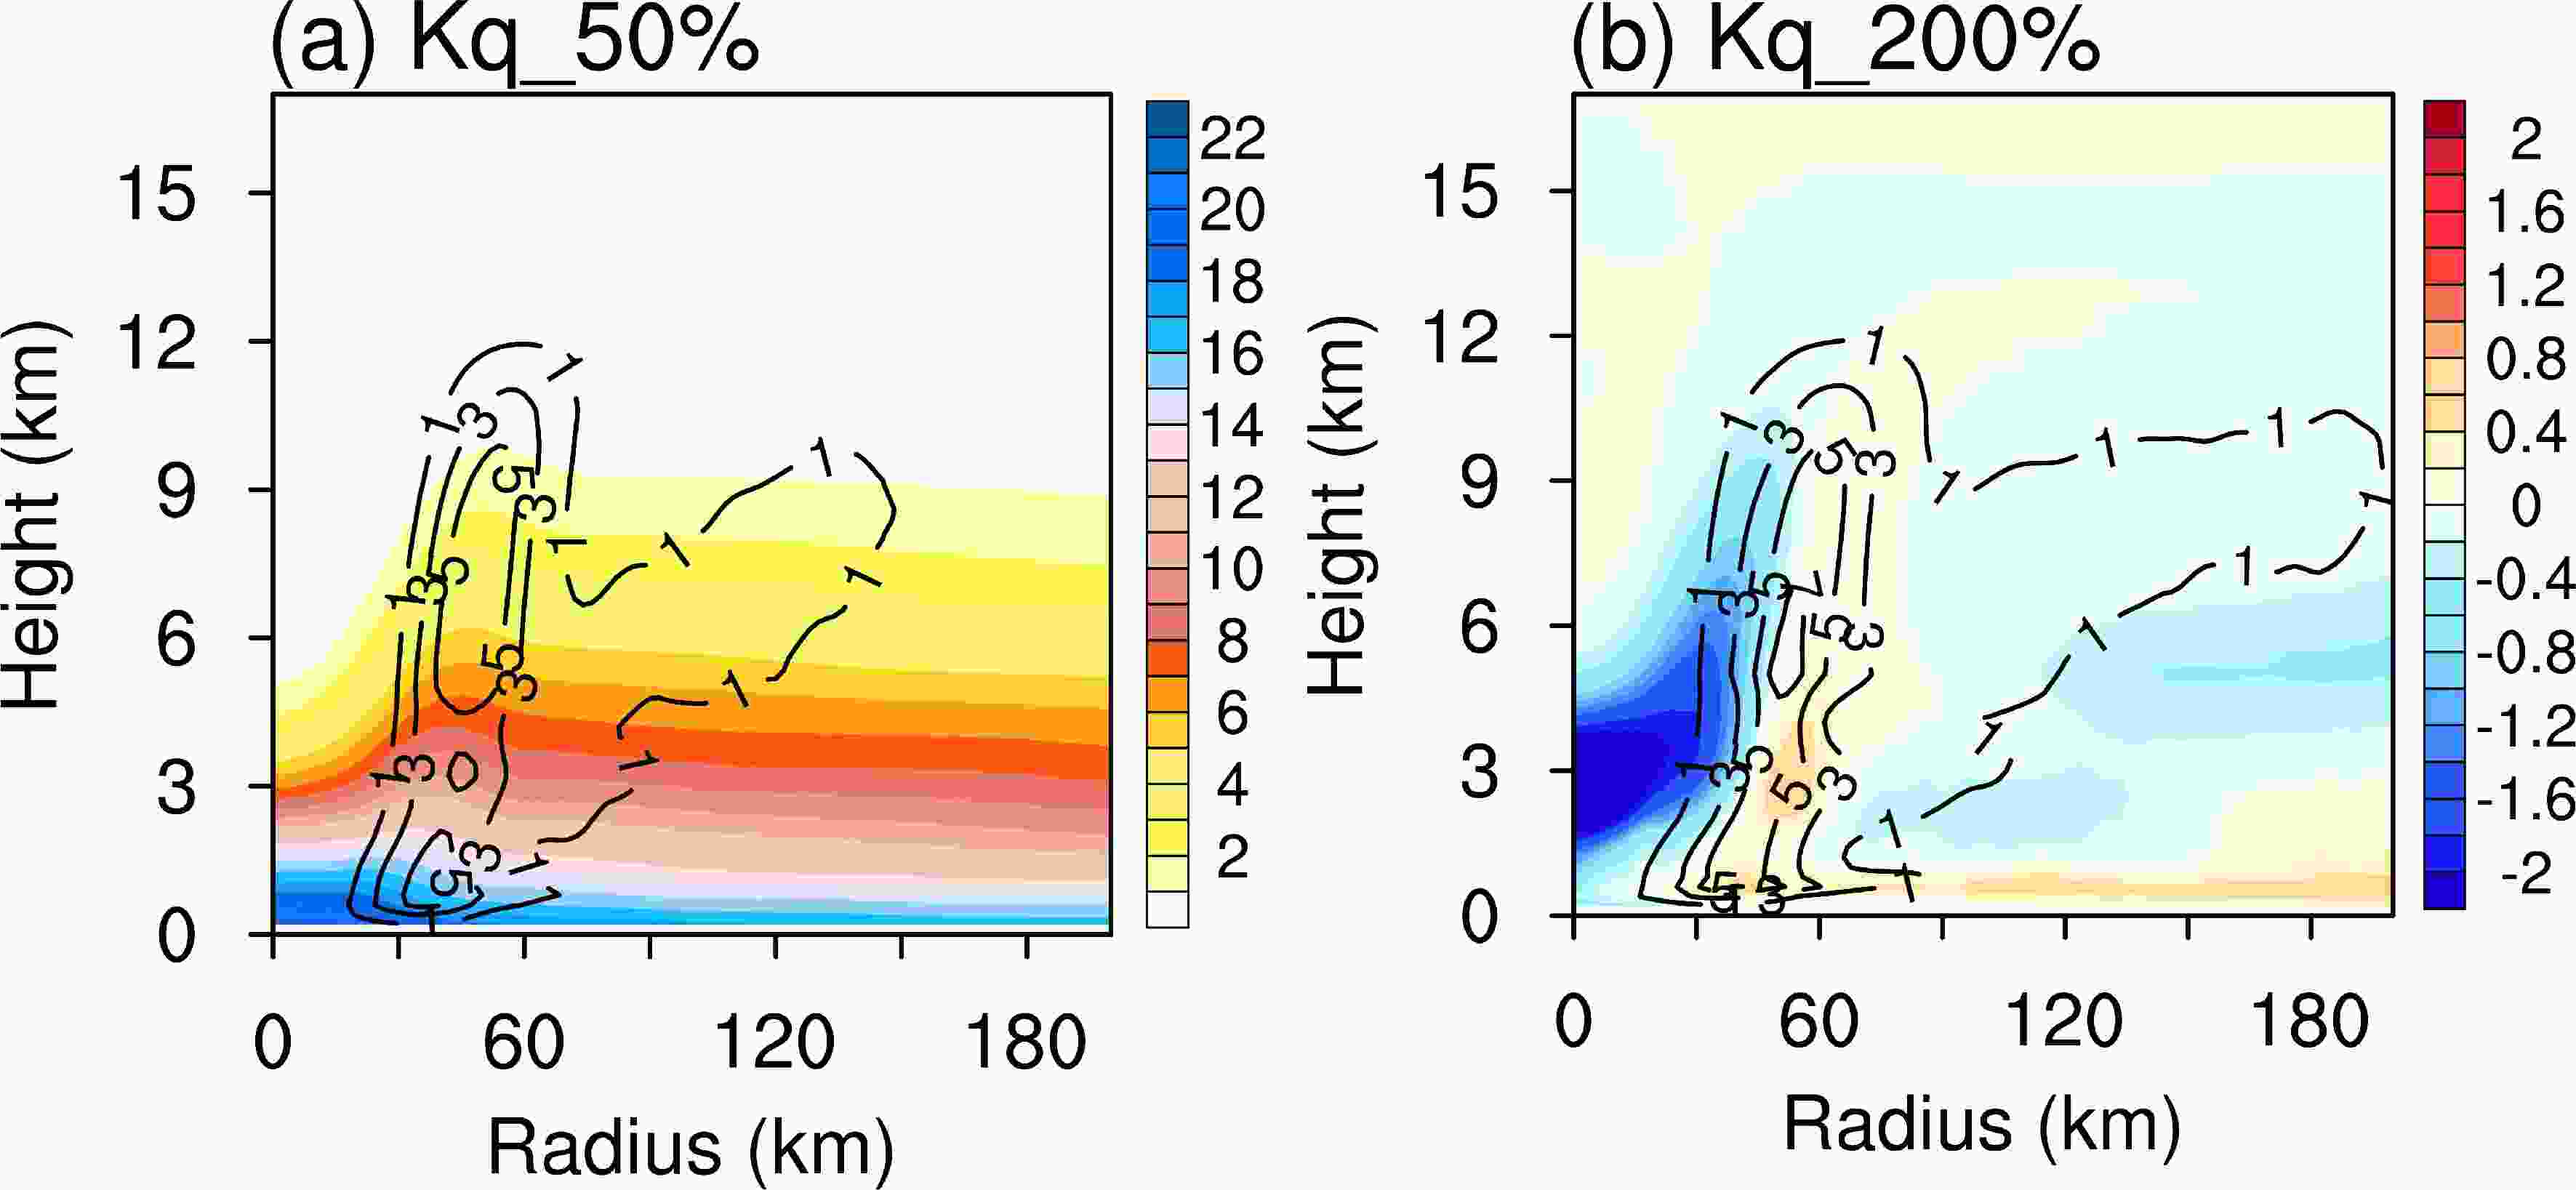 Figure12. Azimuthally and 96–120 h averaged radius–height cross-sections of (a) water vapor mixing ratio (shading, g kg?1) in the Kq_50% experiment and (b) the difference in water vapor mixing ratio (shading, g kg?1) between the Kq_200% and Kq_50% experiments superimposed on diabatic heating (black contours; K s?1).
To investigate the possible physical mechanisms for the distinct MSLP between Kq runs, Fig. 13 shows the time series of the surface latent heat flux (


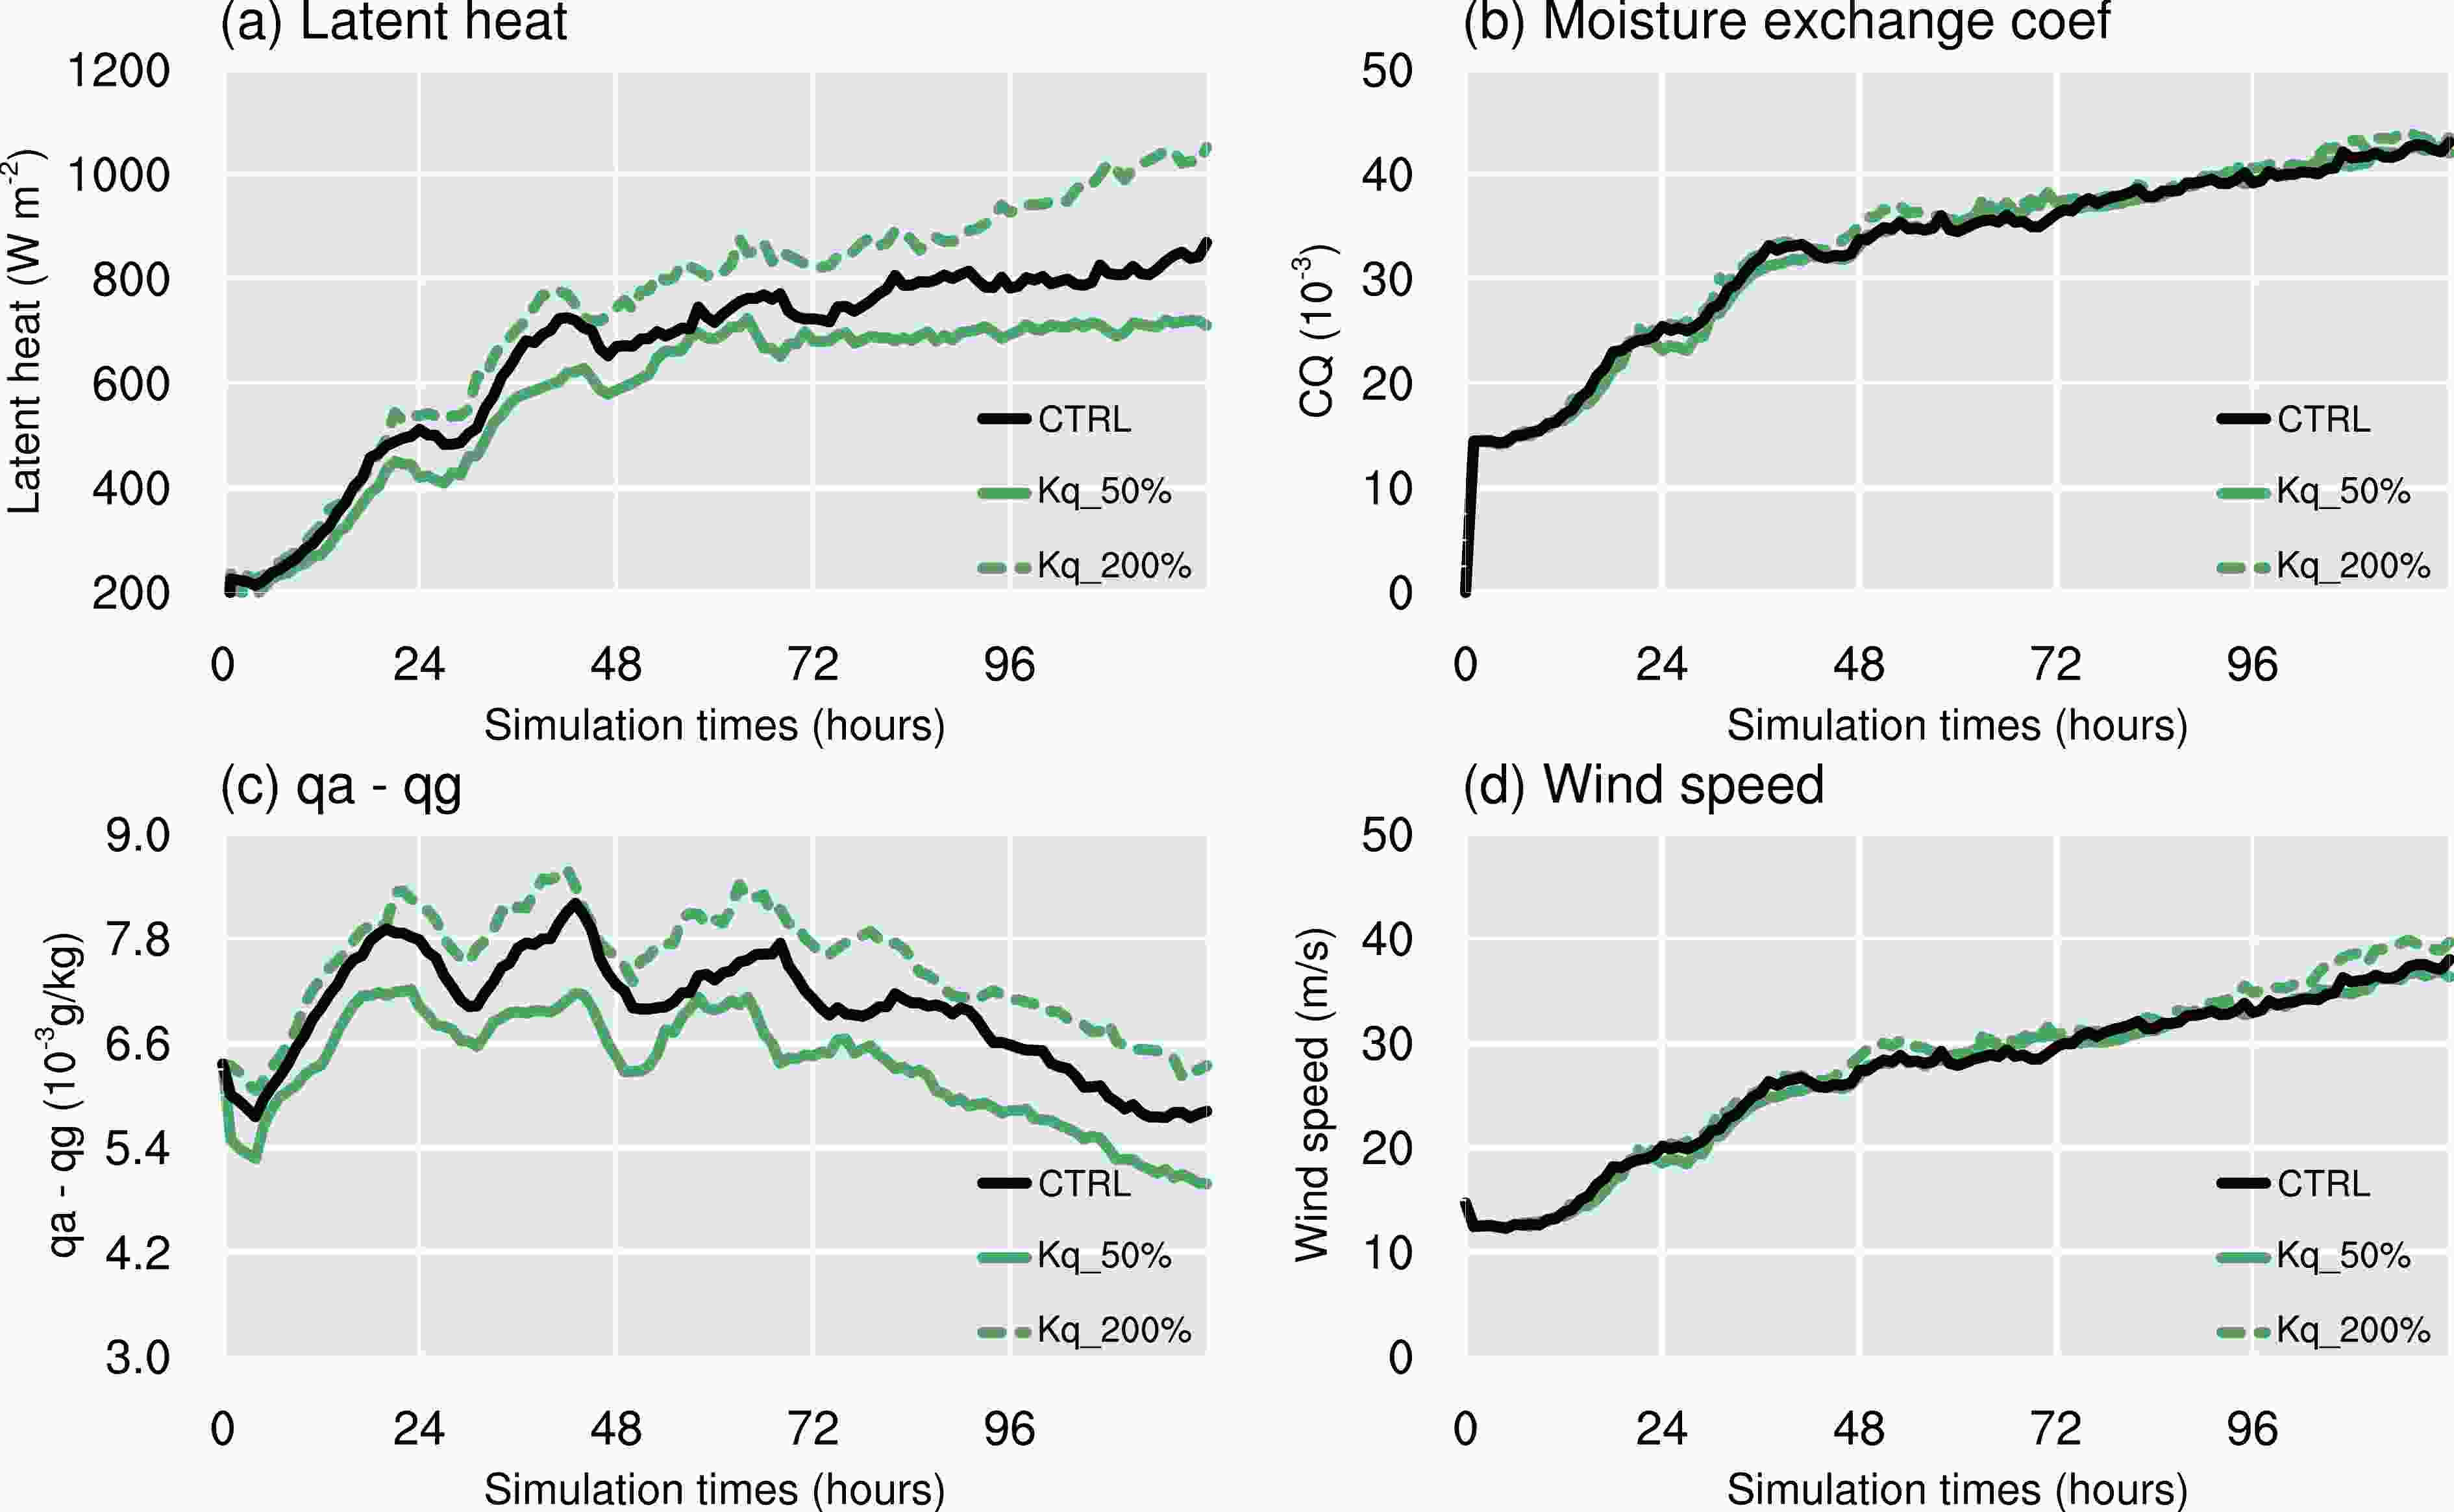 Figure13. Time series of (a) surface latent heat flux (W m?2), (b) surface moisture exchange coefficient (10?3), (c) mixing ratio difference (10?3 kg kg?1) between the surface and the lowest model level and (d) the wind speed (m s?1) at the lowest model level for the Kq sensitivity experiments. The averaging is carried out within a radius of 150 km from the storm center of each experiment.
Conceptually, a larger amount of latent heat will transport more potential energy, favoring convection in the eyewall and inner rain bands, and resulting in more intense storms (Wang, 2009; Xu and Wang, 2010). However, our results show that the comparative wind strength of the tropical cyclone in the Kq_50%, CTRL and Kq_200% experiments appear to contrast with the fact that the surface latent heat flux is much stronger in the higher Kq experiments. To illustrate the possible physical mechanisms for this, Fig. 14 shows the radial distribution of the azimuthally and time-averaged latent heat and the lowest model level potential temperature. As a result of the enhanced latent heat in the Kq_200% experiment (Fig. 14a) due to the increase in moisture eddy diffusivity, the value of the radial potential temperature is much higher than in the Kq_50% run (Fig. 14b). The supply of energy from the sea surface is more favorable for most storm regions in the Kq_200% and CTRL run, as the air in the PBL and eyewall has a higher moisture content in the Kq_200% and CTRL experiment than in the Kq_50% experiment, thus fueling convection and releasing more latent heat (Ma et al., 2015). However, these processes do not increase the radial temperature gradient across the eyewall in the Kq_200% and CTRL experiment compared with that in the Kq_50% experiment (Fig. 14b). A remarkable feature is that, although there are large discrepancies in pressure for Kq experiments(Fig. 15a), the pressure gradient along the radial direction in the Kq_200% experiment is almost the same as that in the Kq_50% and CTRL experiment (Fig. 15b). The peak pressure gradient in the Kq_200% experiment is also close to that in the CTRL run, and slightly smaller than Kq_50% run. Note that the reduced radial wind would decrease the radial pressure gradient at the surface. Thus, the slightly larger radial pressure gradient in the Kq_50% experiment is therefore mainly caused by the reduction in convection and the latent heat flux.
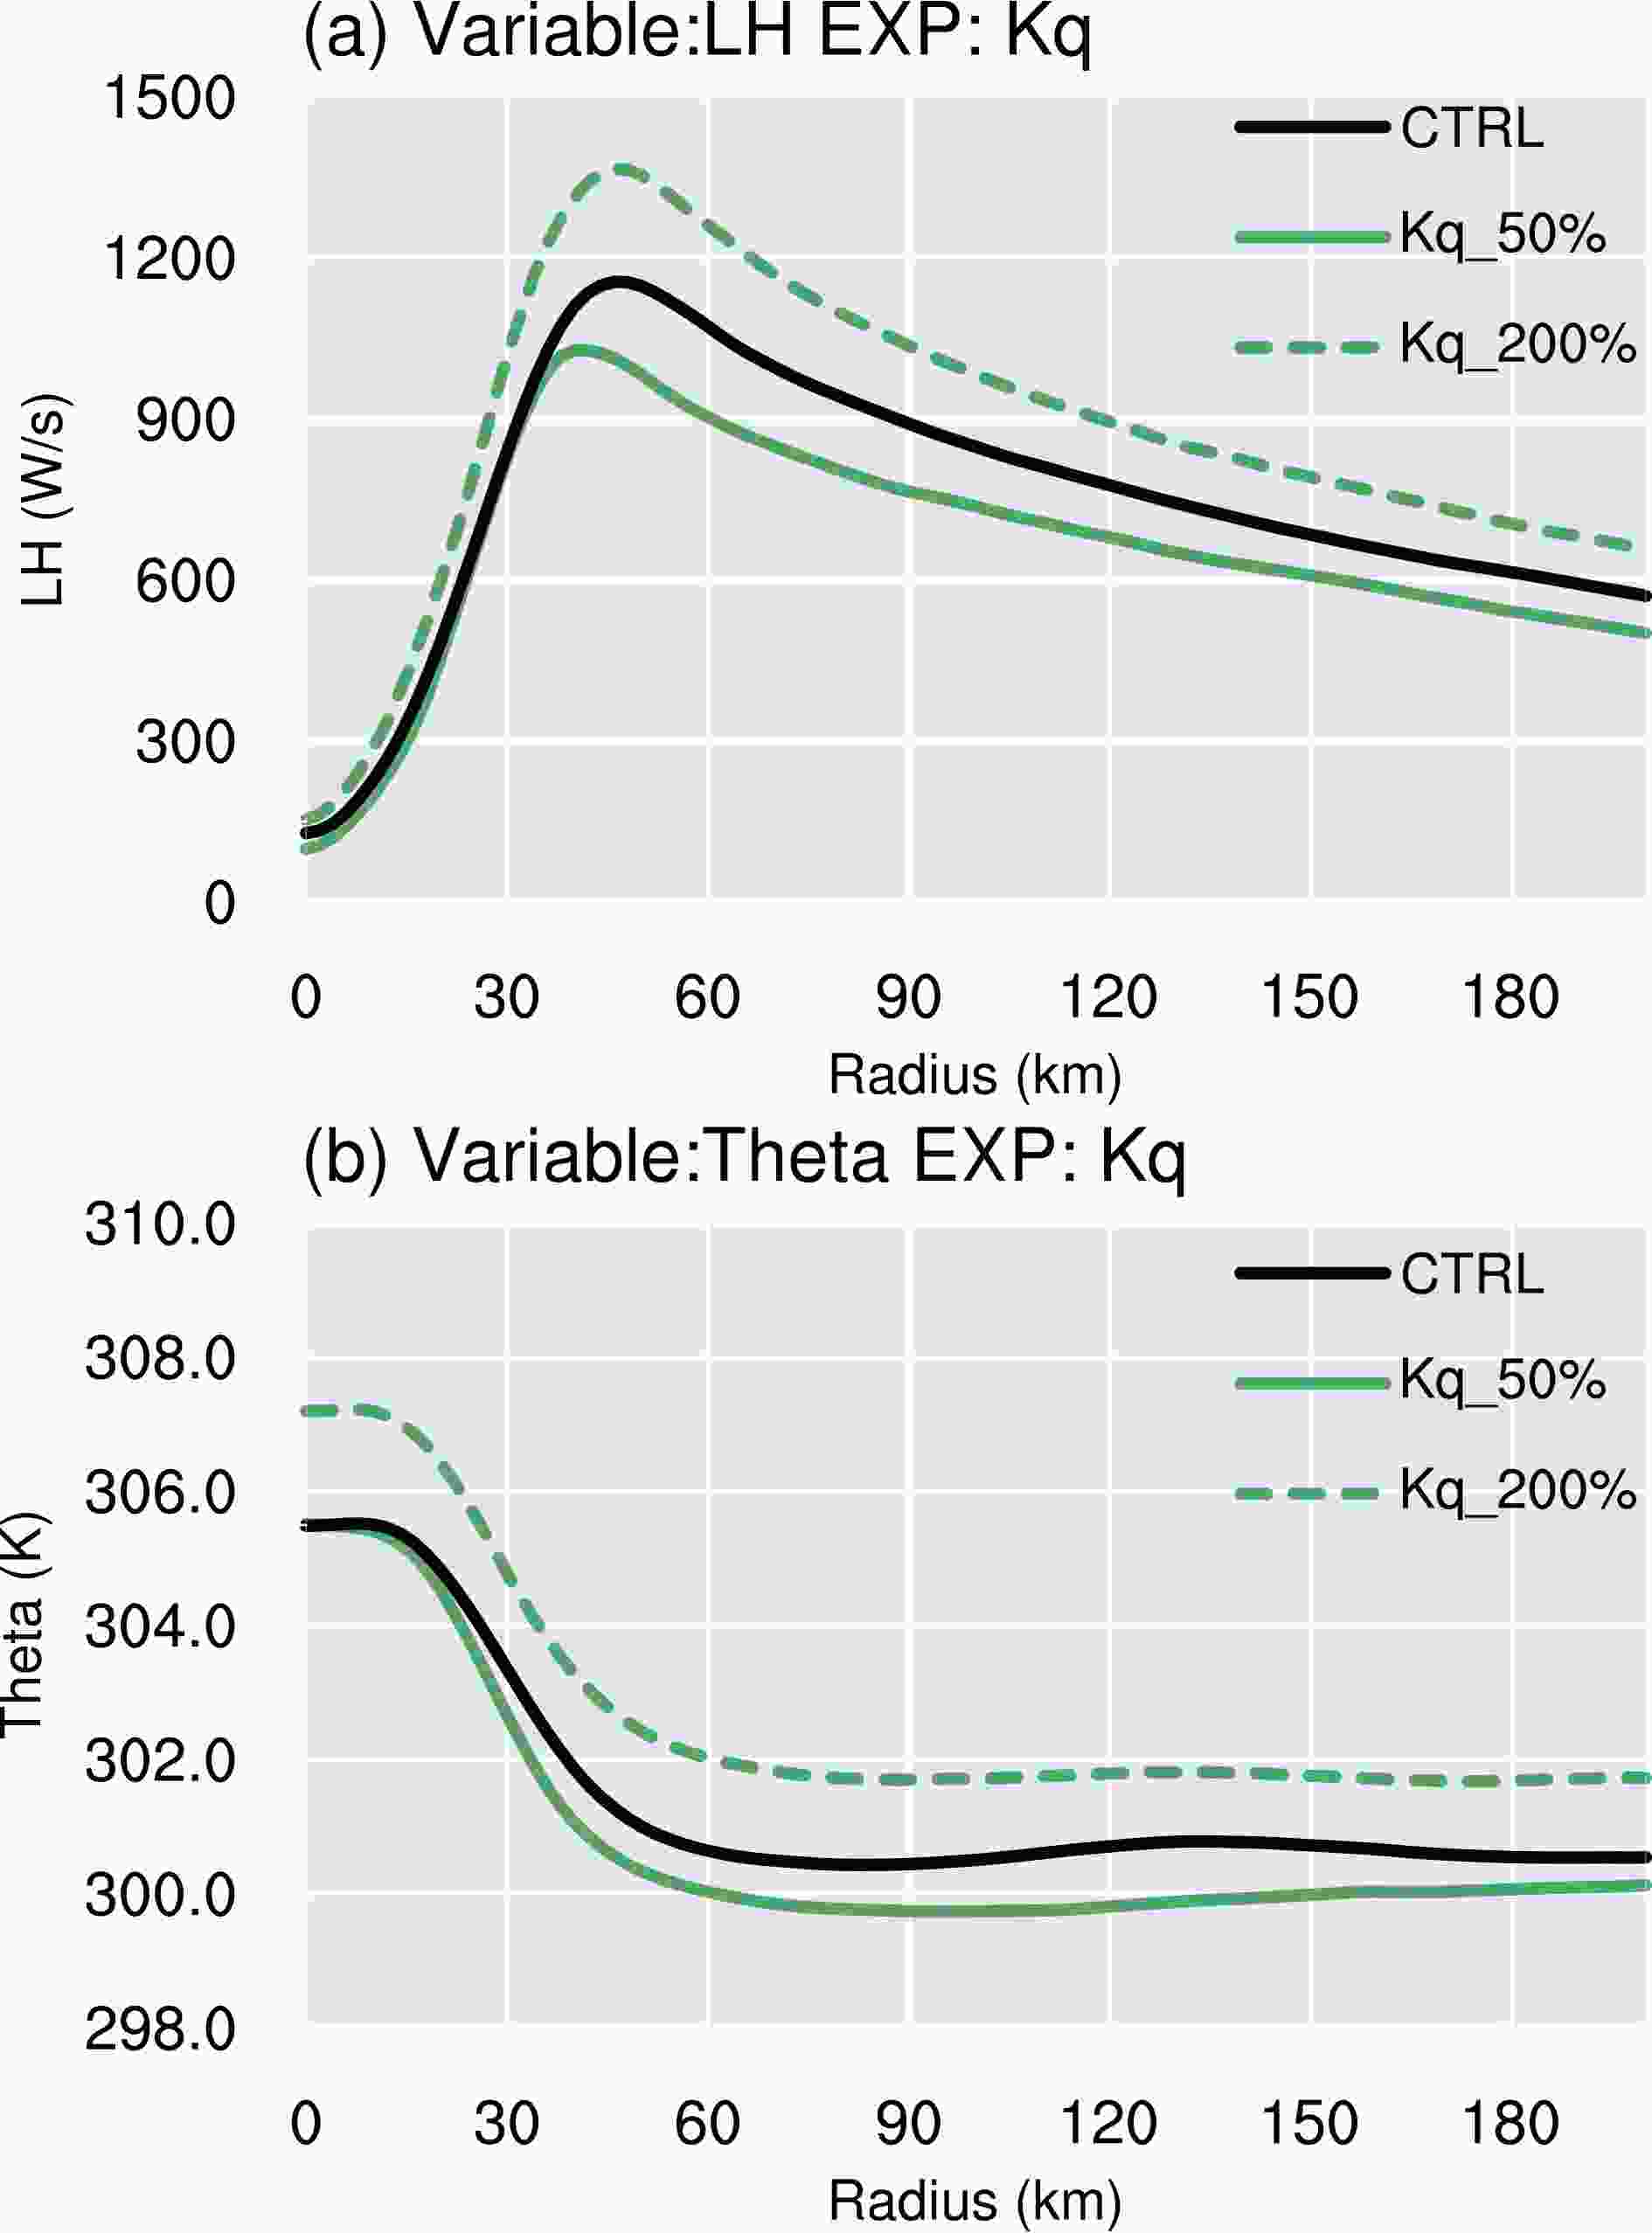 Figure14. Radial distribution of the azimuthally and 96–120 h time-averaged (a) latent heat (W s?1) and (b) potential temperature (K) at the lowest model level for the Kq experiments.
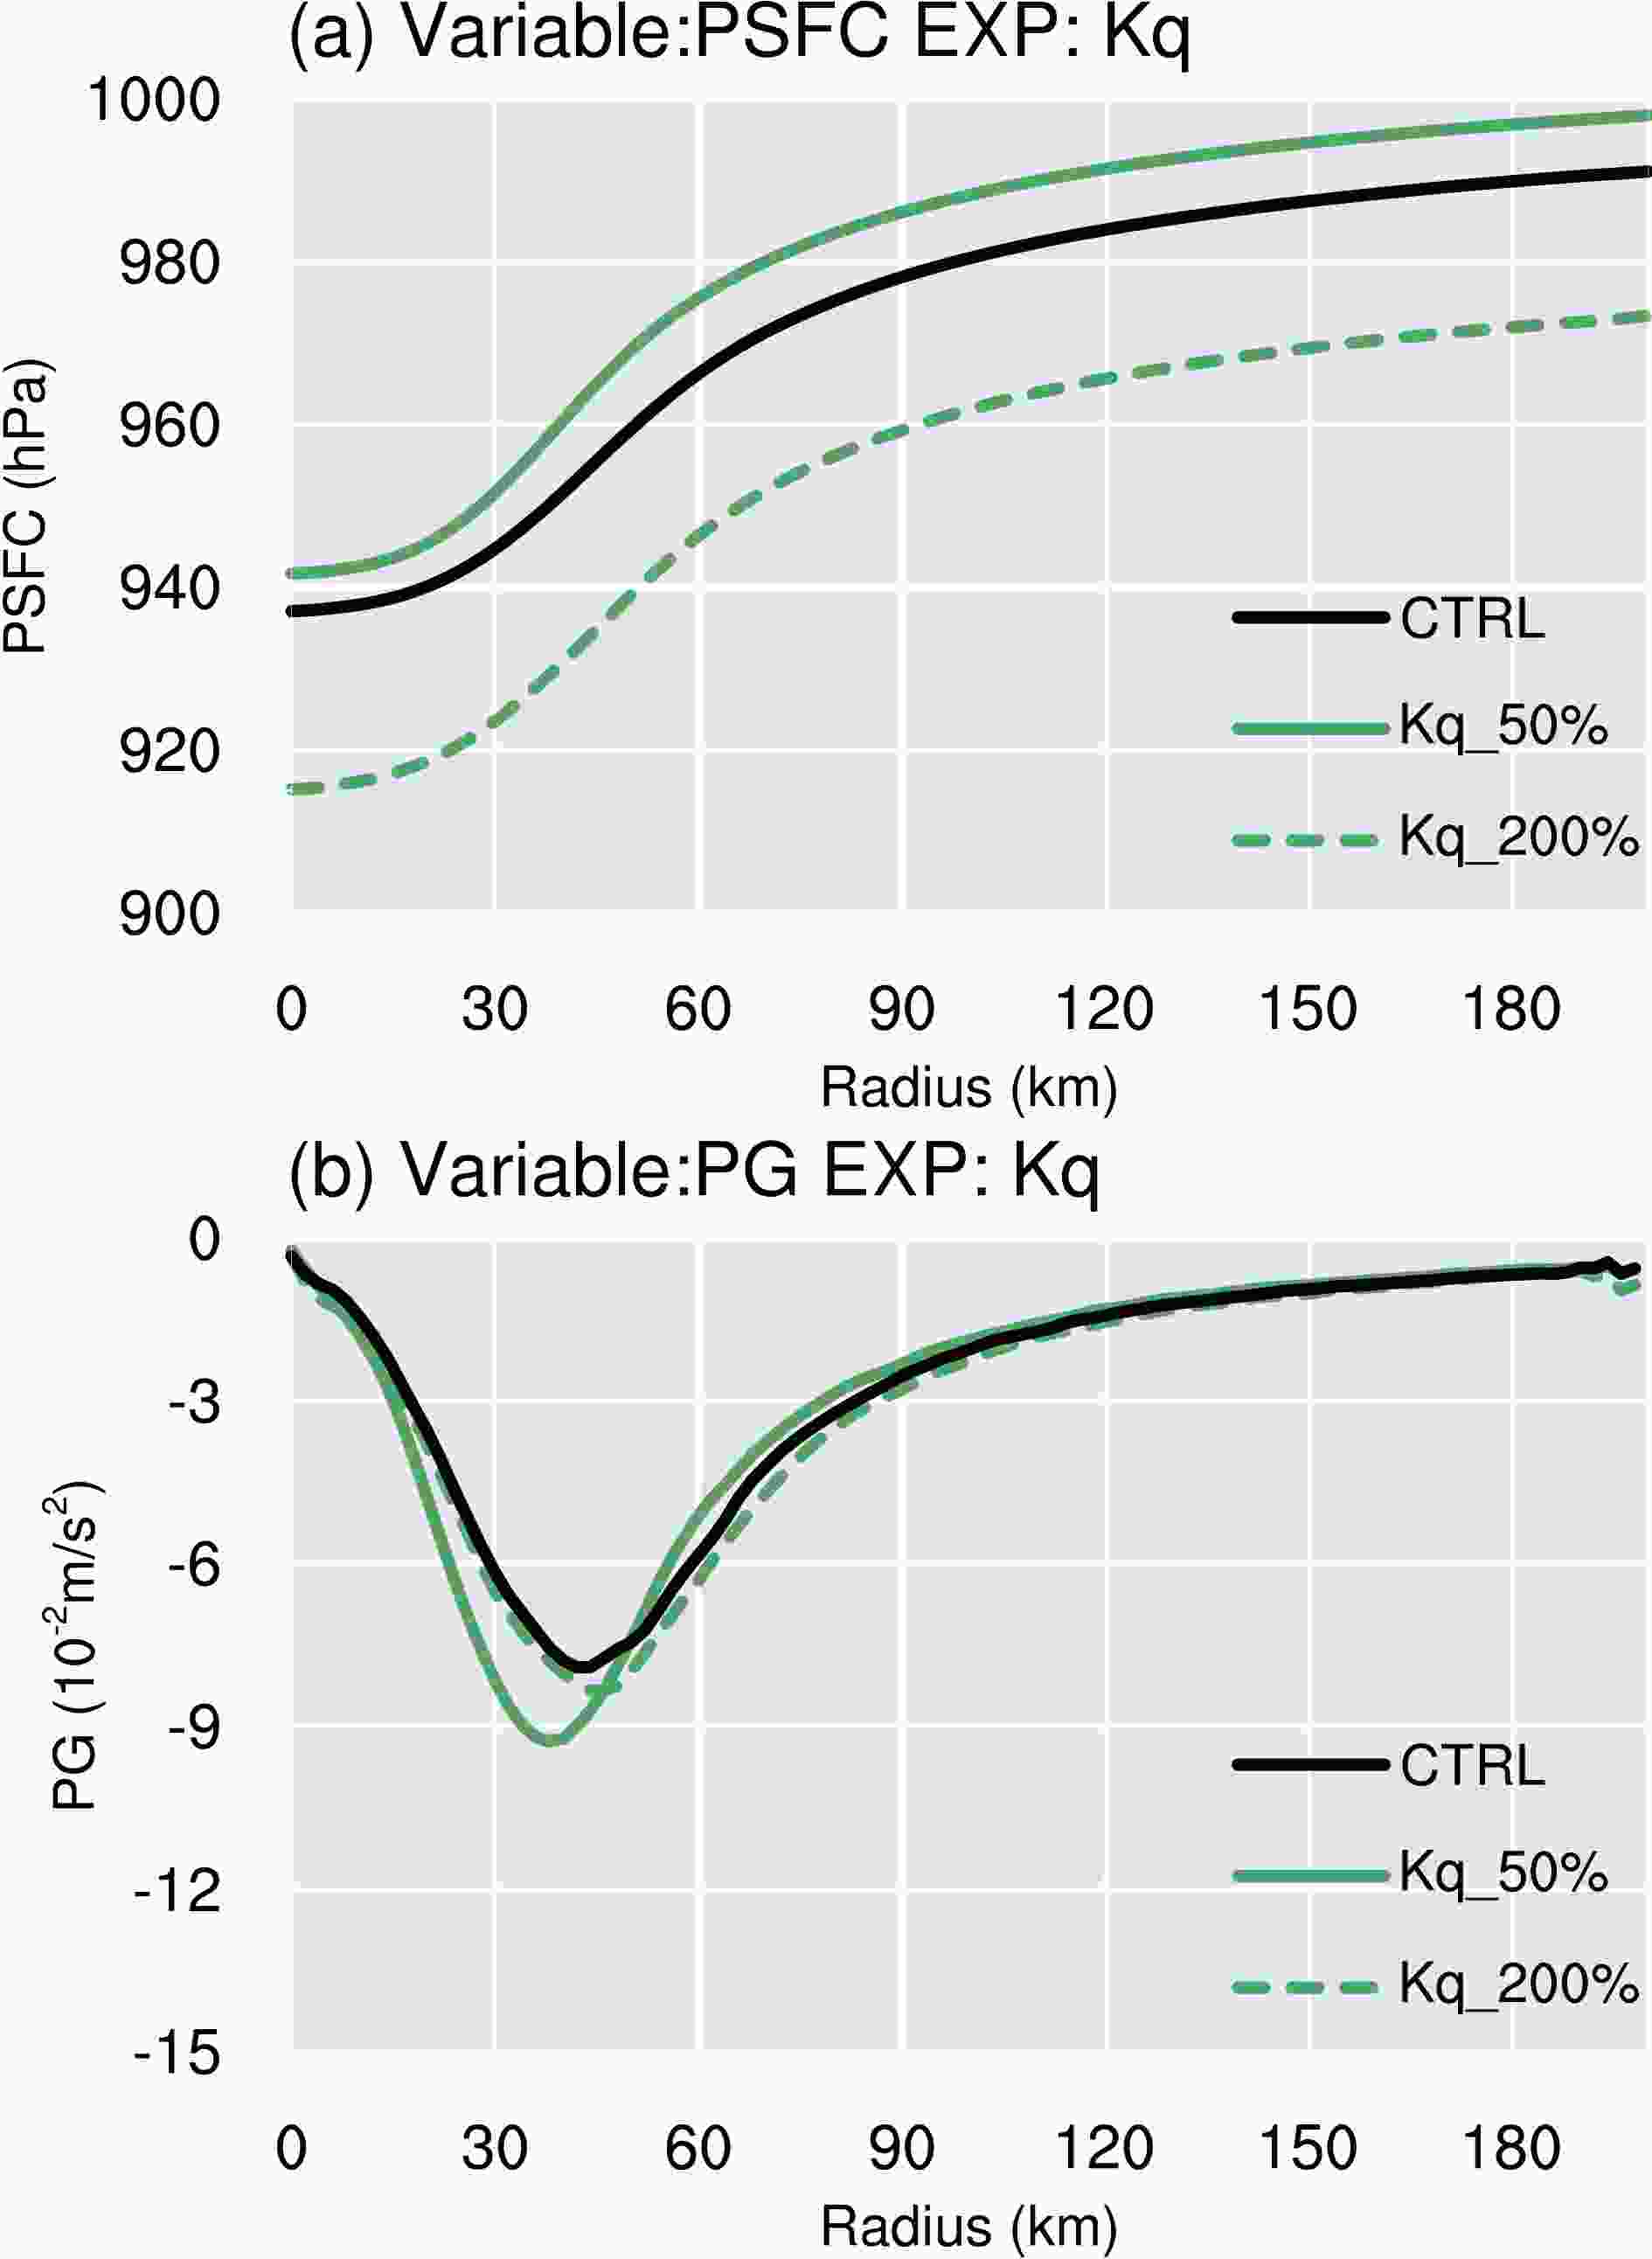 Figure15. Radial distributions of the azimuthally and 96–120 h time-averaged (a) surface pressure (Pa s?1) and (b) radial gradient of surface pressure (10?2 m s?2) for the Kq experiments.
In summary, the increased difference in the moisture content between the air and sea as a result of increased moisture eddy diffusion can be attributed to the reduced MSLP. The variation of the moisture vertical structure in the PBL caused by an increase in the moisture eddy diffusion affects the difference in the moisture content between the air and sea, leading to an increase in the surface latent heat flux. This favors the continuous transport of more energetic environmental air to the tropical cyclone. The moisture difference of the surface air and the magnitude of surface wind speed and Cq were shown to be the dominant factors in the surface latent heat flux, although the influence of changes in the difference between the moisture of the surface and air caused by differences in Kq is non-negligible. The difference between the moisture of the surface and air is nearly unchanged after integration for 24 h, and an increase in the wind speed and Cq with the intensification of the tropical cyclone results in a greater difference in the pressure of the tropical cyclone among the Kq runs. An analysis of the gradient of the surface variables shows that marginal changes in the wind speed happen because the increase in Kq increases the moisture content evenly along the radial direction. Mixing of the moisture has a significant effect on the magnitude of the temperature and pressure, but has little influence on their gradients. As a result, Kq has a clear impact on the MSLP, but not on the MWS.
The change in the difference of moisture between the surface and the air obtained in simulations modulating the moisture diffusivities shows a larger impact on the pressure in tropical cyclones than the variation of convection and PBL height. However, the simulated wind structure is insensitive to the moisture diffusivity. The distinct contributions of the PBL moisture and its relevant processes as a result of varying the moisture eddy diffusion are crucial in altering the wind–pressure relationship. Changes in the wind–pressure relationship were also found in a previous study with different lowest model levels (Ma et al., 2014). In our study, the changes in the wind–pressure relationship are not only sensitive to the configuration of the surface layer, but also to the difference between the surface and the air and energy exchange caused by the mixing of moisture in the PBL. Thus, future development of PBL parameterizations in the TCBL should focus on improving the representation of the moisture diffusivity and the structure of the moisture in PBL. One should note that the value of Kq in PBL parameterization is estimated by Km and is rarely examined in comparison with observations or large eddy simulations of tropical cyclones (Bu et al., 2017). The change in the wind–pressure relationship resulting from the modulation of Kq indicates that additional caution is needed when evaluating or improving the performance of the PBL scheme in simulating the tropical cyclone.
Finally, these results may be applicable in the context of KPP-type PBL parameterizations, such as the MRF and GFS PBL schemes used in the WRF model. This study investigated the moisture diffusivity of the YSU scheme to show its impact on tropical cyclones. Thus, the other scalar diffusivity—the heat eddy diffusivity—may also be crucial in tropical cyclones and required further study. On the other hand, our findings could be quite different if other types of PBL schemes are used, such as the TKE-based PBL schemes. Future work will investigate real cases of tropical cyclones and other types of PBL parameterization.
Acknowledgements. The authors are grateful to the three anonymous reviewers for their helpful comments. This study was supported in part by the National Natural Science Foundation of China under Grant Nos. 41905095, 41730960 and 61827901 and in part by the National Key R&D Program of China under Grant No. 2017YFC1501602.
