HTML
--> --> -->Space-based remote sensing is an important and effective tool to promote our understanding of clouds (Kuze and Chance, 1994; Hamann et al., 2014). Passive satellite measurements over the globe [e.g., those from the geostationary Chinese Fengyun-4A (FY-4A) satellite and the Japanese Himawari-8 satellite] have supported a great number of CTH data, especially for areas where surface meteorological observations are inaccessible. Both the Advanced Geostationary Radiation Imager (AGRI) onboard FY-4A and the Advanced Himawari Imager (AHI) onboard Himawari-8 utilize infrared radiance, but with different approaches, to retrieve the CTH (Bessho et al., 2016; Min et al., 2017; Yang et al., 2017; Iwabuchi et al., 2018). Errors always exist in CTH retrieval based on infrared remote sensing, due to instrument performance, the theoretical assumption of cloud being a blackbody, the inherent errors in the radiative transfer model calculation, the inconsistency between the temperature profile calculated by the numerical model and reality, and the complexity of the underlying surface (Hollars et al., 2004; Garay et al., 2008; Chen et al., 2017; Wang et al., 2018a, b). Furthermore, the proportions of high and thin clouds that particularly challenge the blackbody assumption change in different regions; additionally, the underlying surface characteristics and atmospheric properties that determine the surface and atmospheric radiation also vary among different regions, which justifies more stringent requirements in terms of the adaptive ability of the CTH inversion algorithm, thus potentially resulting in different retrieval biases for different regions.
Ground-based, millimeter-wavelength radar can penetrate clouds to obtain information on the vertical structure of clouds, such as the CTH, with high accuracy (Kollias et al., 2007). Radar offers a ground truth to evaluate the performance of satellite passive CTH retrieval, although radar has limited spatial coverage.
There have been several studies that have evaluated the CTH retrievals from the FY-4A and Himawari-8 satellites. For instance, Tan et al. (2019) compared the CTH retrieved from FY-4A with those from Himawari-8, CloudSat, Cloud-Aerosol Lidar and Infrared Pathfinder Satellite Observations (CALIPSO), and the Moderate Resolution Imaging Spectroradiometer (MODIS), globally, over a three-month period, and found the performance of FY-4A CTH retrievals to be similar to that of Himawari-8. Huang et al. (2019) evaluated the CTH retrieved from Himawari-8 using 31-day active shipborne radar–lidar data over the Southern Ocean and one-year CALIPSO data over a large sector of the Southern Ocean, and reported that the Himawari-8 CTH retrievals agree reasonably well with both estimates. Huo et al. (2020a) compared the CTH retrieved by ground-based Ka-band radar over Beijing during a two-year period with that of Himawari-8 and found that the CTH retrieval accuracy of Himawari-8 depended strongly on the cloud depth and that the retrieval accuracy for high-level thin clouds was the poorest.
In this study, the CTHs from radar at Yangbajing, Tibet, China (30.21°N, 90.43°E) (YBJ) and the Institute of Atmospheric Physics, Beijing, China (39.97°N, 116.37°E) (IAP), where the climate characteristics and altitudes are significantly different, were used to investigate the uncertainties of the FY-4A and Himawari-8 CTH products. The Tibetan Plateau (TP), often referred to as the Third Pole, exerts profound thermal and dynamic influences on the local weather and climate, as well as on the atmospheric circulation in the Northern Hemisphere (Yanai et al., 1992; Liu and Chen, 2000; Du, 2004; Lu et al., 2018), meaning that the TP possesses pivotal research value in atmospheric science. YBJ is located in the basin of the TP at an elevation of 4.3 km, and belongs to the plateau, cold-temperate, semi-arid, monsoon climate zone, with lower average pressure, lower mean temperature, larger diurnal temperature variation, and stronger solar radiation relative to the plains. Due to the special geographical location and atmospheric conditions, continuous ground-based radar observations in the TP region are scarce and precious. The IAP is located in the North China Plain region at an elevation of 43.5 m. It has a north-temperate, sub-humid, continental, monsoon climate. Beijing city has a complex urban-type surface, while the semi-arid YBJ site is surrounded by mountains and the impacts of human activity are relatively minor.
This paper aims to examine the differences in CTH retrieval among AGRI, AHI, and radar, at the YBJ and IAP sites, and to investigate the main factors generating the discrepancies, using continuous data collected from 1 February to 31 August 2019. The results of our analysis could be used as a reference for future applications of satellite CTH products (in this case, those of FY-4A and Himawari-8), especially in the TP region. Additionally, it provides a reference for improving the CTH retrieval algorithms of meteorological satellites.
The rest of this paper is organized as follows: Descriptions of the radar data, FY-4A data, Himawari-8 data, and other data, such as the atmospheric and surface properties, as well as the comparison method, are provided in section 2. Section 3 presents an analysis of the results. The main causes of the differences are investigated and presented in section 4. Finally, conclusions and some further discussion are provided in section 5.
2.1. Ka-band radar
The Ka-band polarization Doppler radar, using a frequency of 35.075 GHz, situated at the IAP (39.967°N, 116.367°E), Beijing, China, was set up in 2010. The technical specifications of the Ka-band radar at the IAP are given in Table 1.| Parameter | Ka polarization Doppler radar | Ka-FMCW (wide pulse mode) | Ka-FMCW (narrow pulse mode) |
| Wavelength (mm) | 8.55 | 8.569 | 8.569 |
| Peak power (kW) | 29 | 0.04 | 0.04 |
| Pulse width (μs) | 0.2 | 120 | 10 |
| Transmitter type | Magnetron | Solid-state | Solid-state |
| Antenna gain (dB) | 54 | 50.9 | 50.9 |
| Noise factor (dB) | 5.8 | 4.2 | 4.2 |
| Scanning mode | Vertically pointing | Vertically pointing | Vertically pointing |
| Vertical resolution (m) | 30 | 30 | 30 |
Table1. Main technical specifications of the Ka radars at the IAP and YBJ sites.
The Ka-band radar at YBJ is one part of the Atmosphere Profiling Synthetic Observation System, which was the first ground-based observation system for profiling multiple atmospheric variables and constituents from the surface up to the thermosphere (Lu et al., 2018). The radar was set up in October 2017 and began continuous observations on 23 July the following year. This Ka-band radar, with a frequency-modulated continuous-wave (FMCW), has two pulse modes: a 120 μs wide pulse mode and a 10 μs narrow pulse mode. During radar operation, switching between the two modes takes place automatically to ensure that the cloud is detected with the highest possible accuracy. The technical specifications of the Ka-band radar at YBJ are also given in Table 1 [Ka-FMCW (wide pulse mode) and Ka-FMCW (narrow pulse mode)].
Except for special cases, the two Ka radars work 24 hours a day in vertically pointing mode. A threshold of ?45 dBZ was used to identify the cloud in this study. For an arbitrary radar profile, it was considered to be cloudy if there were more than three radar bins with radar reflectivity greater than ?45 dBZ (Huo et al., 2020a). For a cloudy profile, the CTH was determined as the height of the cloudy bin at the highest level. To facilitate comparison with satellite data, for clouds detected in a certain period (i.e., within 10 min or 15 min), the radar CTH was calculated as the average CTH of all cloudy profiles, but not for upper-level clouds if there were multilayer clouds present. It can be seen from Table 1 that the radar measures three profiles per second with vertically pointing mode and the vertical resolution is 30 m.
2
2.2. FY-4A satellite
On 11 December 2016, the first of China’s new-generation geostationary meteorological satellite series, FY-4A, was successfully launched. It has been in operation by the National Satellite Meteorological Center, China Meteorological Administration (NSMC/CMA) since 1 May 2018. FY-4A has four payload instruments. The AGRI, with 14 spectral bands in the visible, near-infrared, and thermal infrared regions, is one of them, from which the CTH products are retrieved (Yang et al., 2017). The AGRI has three scanning modes: full disk (images of the whole Earth as seen from the satellite) every 15 min; Chinese area (3°–55°N, 70°–140°E) every 5 min; and target area (1000 km × 1000 km) every 1 min.The AGRI uses radiances (temperature brightness) of two infrared split window channels of 10.8 μm (channel 12) and 12 μm (channel 13), as well as a 13.5 μm (channel 14) CO2 absorption channel, to retrieve the CTH by applying the Fengyun Cloud Top Height Algorithm (FCTHA) (Min et al., 2017; Wang and Zhao, 2020). The core of the FCTHA involves a one-dimensional variational method to retrieve the cloud top temperature based on the simulations of a radiative transfer model. The parameters applied include the brightness temperature of channel 12, the brightness temperature difference between channels 12 and 13, and the brightness temperature difference between channels 12 and 14. The CTH is obtained according to the atmospheric temperature profile obtained by a numerical prediction model. Moreover, the FCTHA performs a special process for multi-layer cloud pixels, and the CTH of the lower-layer cloud is estimated from other surrounding low clouds. The AGRI CTH product used in this study was obtained from the NSMC/CMA. The temporal resolution of the product is 15 min and the spatial resolution is 4 km.
2
2.3. Himawari-8 satellite
As one of the new generations of Japanese geostationary meteorological satellites, the Himawari-8 satellite was successfully launched from Japan’s Tanegashima Space Center on 7 October 2014 and settled in geostationary orbit on 16 October. The Japan Meteorological Agency began operating the satellite on 7 July 2015 (Bessho et al., 2016). The satellite’s AHI is greatly improved over those of the MTSAT series (Multi-functional Transport Satellites—previous Japanese geostationary satellites) in terms of the number of bands, spatial resolution, and temporal frequency. The AHI has 16 spectral bands (three for visible, three for near-infrared, and ten for infrared) and observes the Japanese area and some other target or landmark areas every 2.5 min, and the entire full disk every 10 min, with a spatial resolution of 0.5–2.0 km. The scan ranges for full disk and the Japanese area are preliminarily fixed, while those for the target and landmark areas are flexible according to meteorological conditions.The AHI CTH retrieval algorithm uses radiative transfer codes developed by the European Organisation for Meteorological Satellites and the temperature and humidity profile data obtained from a numerical weather prediction model to calculate the radiance at four infrared bands (6.2, 7.3, 11.2, and 13.3 μm) (Eyre, 1991; Iwabuchi et al., 2016). The algorithm includes the interpolation method, the CO2-slicing method, and the intercept method; the appropriate method is then selected according to the cloud type in the AHI cloud type product (Nieman et al., 1993; Schmetz et al., 1993; Mouri et al., 2016; Huo et al., 2020a; Letu et al., 2020). The interpolation method is used for opaque and fractional clouds and the intercept method is suitable for translucent clouds. In the case of optically thin (or translucent) cloud retrieval, the intercept method, the CO2-slicing method, and the interpolation method were used one after another until appropriate results were obtained. The AHI CTH product used in this study was the Himawari-8 Cloud Property data released through the P-Tree System of the Japan Aerospace Exploration Agency (JAXA). The temporal resolution of the product is 10 min and the spatial resolution is 5 km.
2
2.4. Other data
The retrieval of the satellite CTH is based on the radiance observed at the satellite, which includes the radiation emitted from the surface, the contribution from the atmosphere below the cloud, the cloud contribution, and the contribution from the atmosphere above the cloud—all the way to the top of the atmosphere (Liou, 2002, p. 403). Therefore, the errors of the satellite CTH retrieval may be partly produced by the surface radiation and the contributions by the atmosphere. This study mainly focuses on quantifying the CTH retrieval differences between different areas and analyzing the relationships of these differences with the physical properties of the underlying surface and atmosphere.The 2-m temperature data are from the ERA5 dataset of the ECMWF (European Centre for Medium-Range Weather Forecasts). The surface emissivity data used in this paper are the Collection-6 MODIS Land Surface Temperature products (MOD11_L2) from the Aqua and Terra satellites. Finally, the aerosol optical depth (AOD) data used in this study are the Himawari-8 Aerosol Property data released through JAXA’s P-Tree System.
2
2.5. Data collocation method
The satellites require several minutes to make a full disk scan and the field of view is larger than that of the radar. Data allocations between the satellites and radars are therefore required. In this study, we used a similar data collocation method as in Huo et al. (2020a). Due to the satellites’ viewing geometries, an AGRI CTH pixel has a fixed 4 km × 4 km spatial resolution and 15-min temporal resolution, whereas for an AHI CTH pixel the corresponding quantities are 5 km × 5 km and 10 min, over the IAP and YBJ site. Since the AGRI presents data about every 15 min, the Ka radar data within 15 min of the AGRI observation time are extracted and averaged (from observation start time to observation end time of the AGRI). The average AGRI CTHs of the four grids nearest to the sites are used for comparison. Because the AHI presents data every 10 min, the Ka radar data within 10 min of the AHI observation time are extracted and averaged (±5 min). The AHI CTHs nearest to the sites are used for comparison.Figure 1 shows two cases from the AHI, AGRI, and radar on 8 August 2019 at YBJ, and on 16 June 2019 at IAP. It should be noted that the elevation of Beijing and YBJ are 0.04 km and 4.3 km, respectively. The satellite CTH is the CTH relative to mean sea level (NASA, 2020). For the convenience of comparison with radar, the satellite CTH at YBJ throughout this study was the original satellite CTH minus 4.3 km. In this paper, the CTH difference (CTHD) between radar and satellite (radar CTH minus satellite CTH) is calculated to quantify the discrepancy. The CTHD between the radar and the FY-4A satellite is termed CTHDrf, and that between the radar and the Himawari-8 satellite is termed CTHDrh.
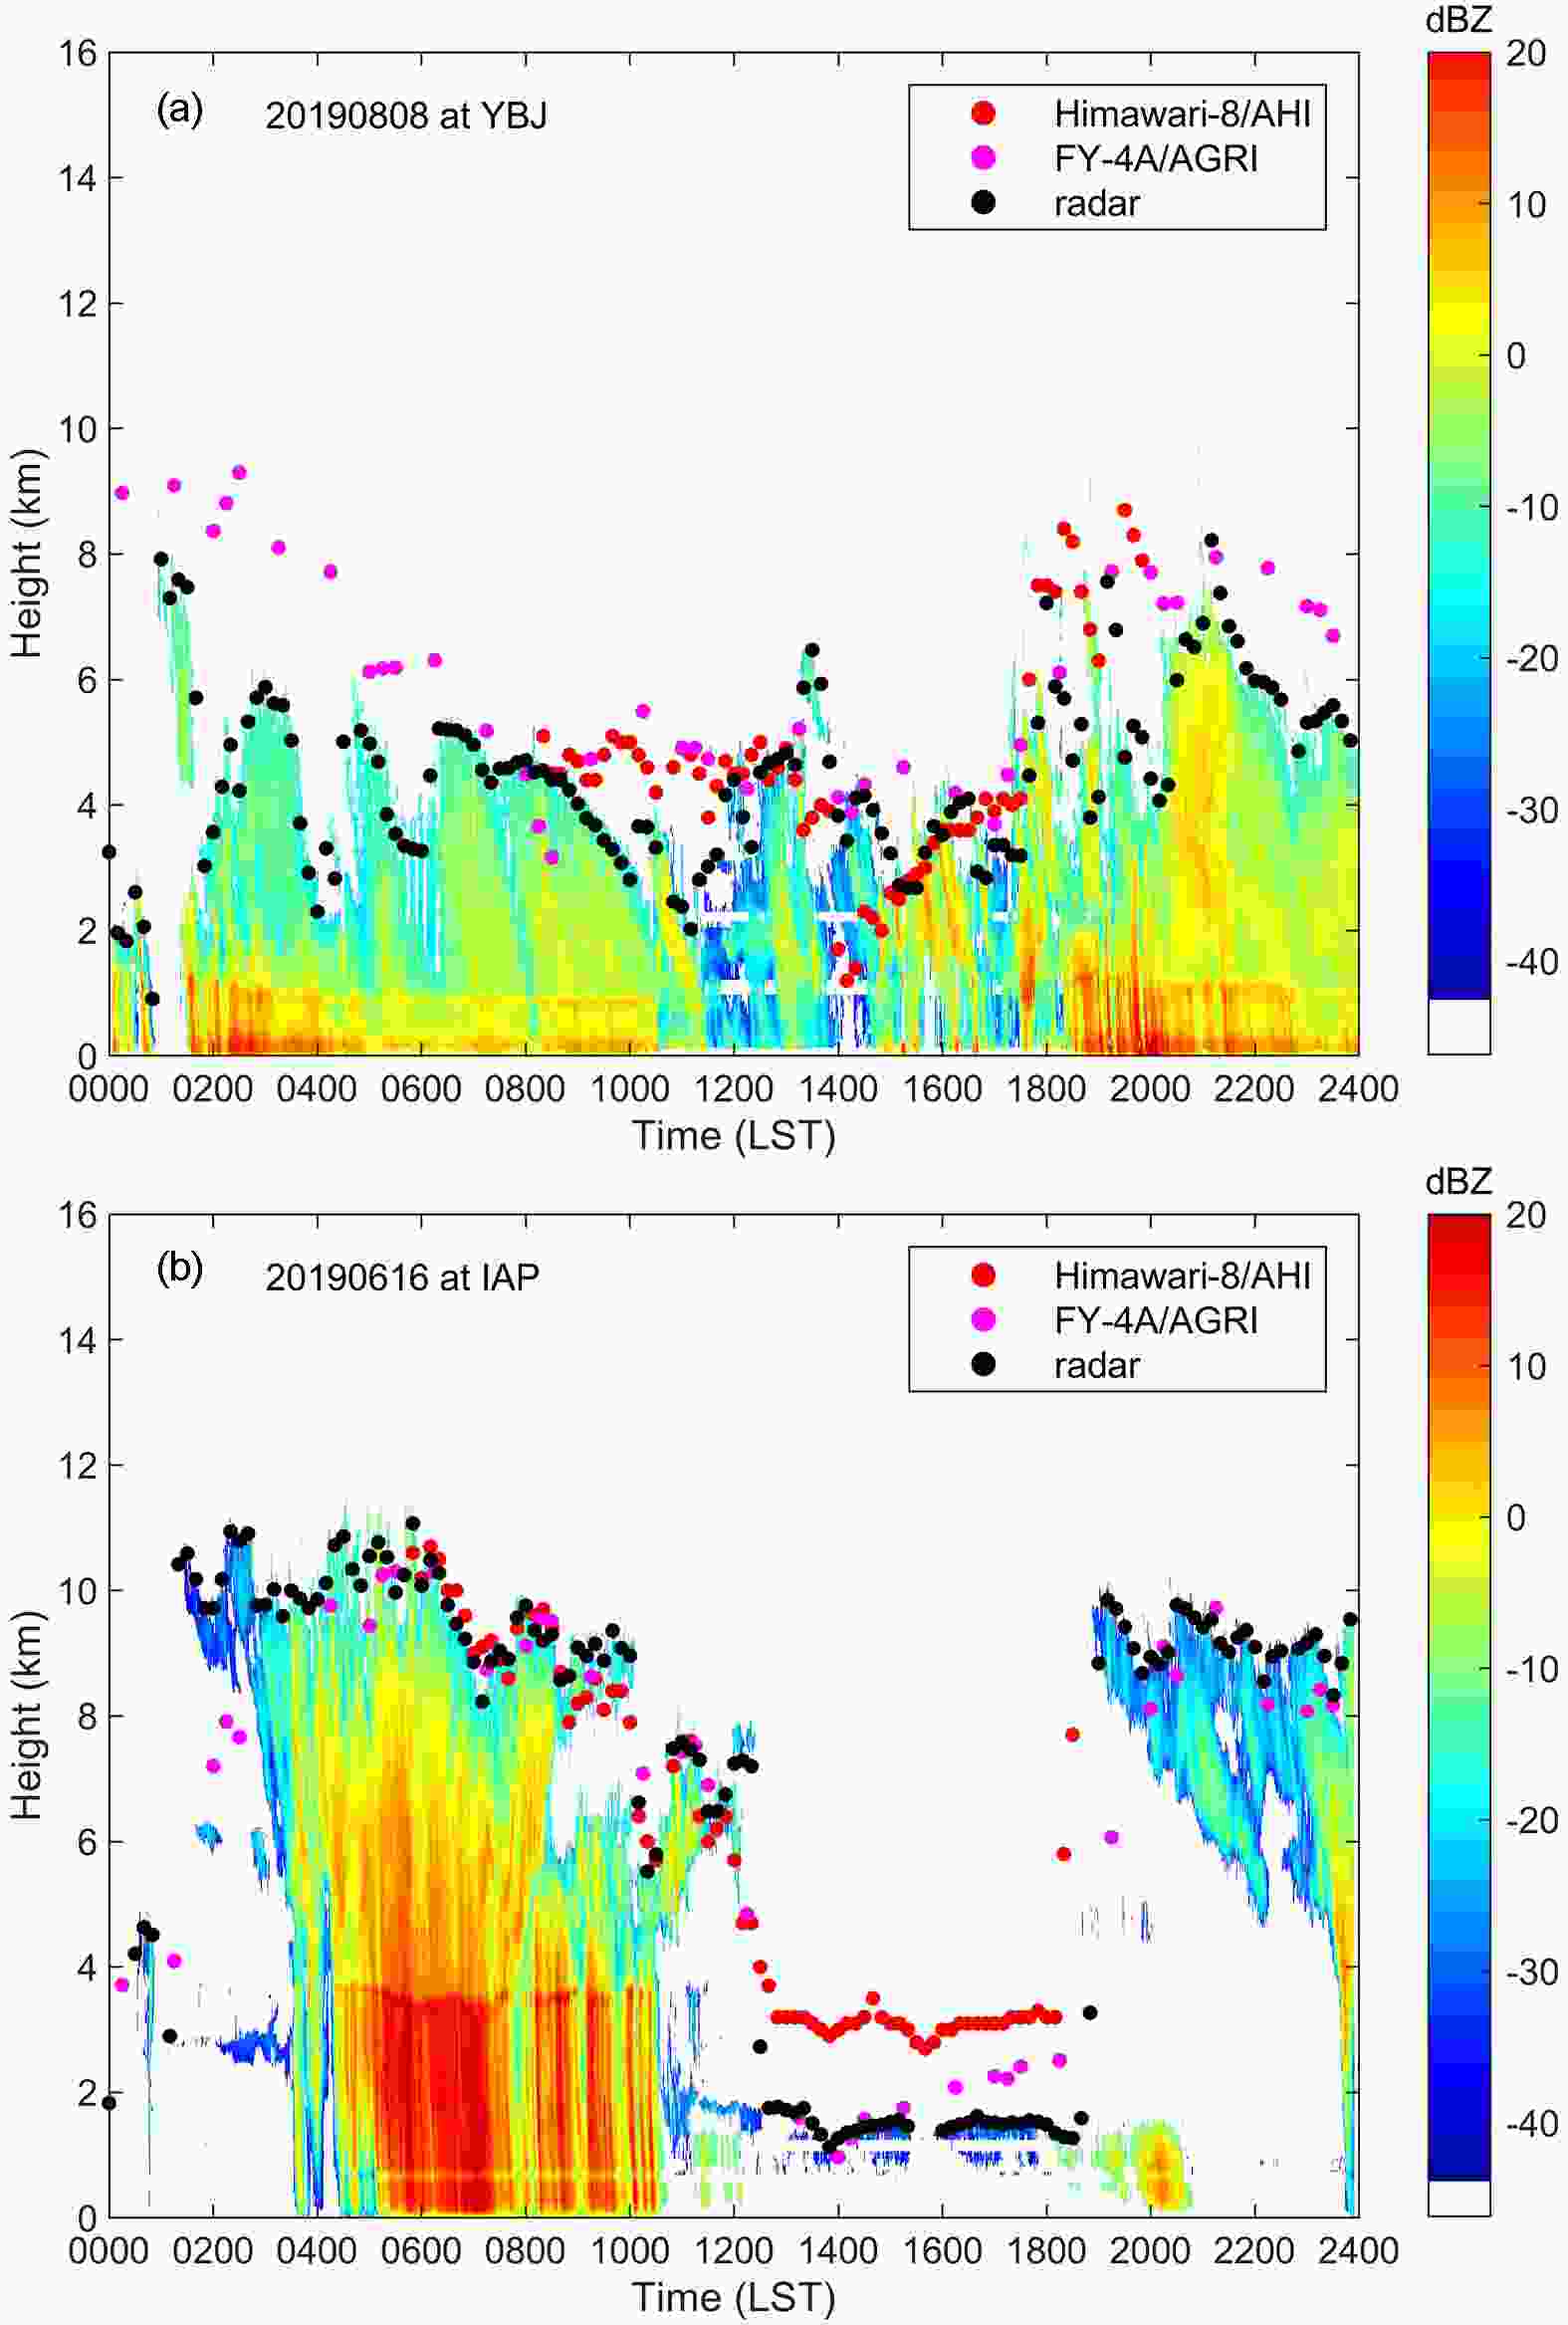 Figure1. Radar reflectivity factors (units: dBZ) on (a) 8 August 2019 at YBJ and (b) on 16 June 2019 at IAP, along with the Himawari-8/AHI CTHs (red dots), FY-4A/AGRI CTHs (magenta dots), and radar CTHs (black dots).
3.1. CTH measurements of the radar and the FY-4A and Himawari-8 satellites
Here, the ratio of the radar observation time in a month to the total time was defined as the data acquisition rate (DAR). The DAR in each month at the two sites from February to August 2019 is shown in Fig. 2a. The IAP radar missed some observations in February, March, and April; most notably in April, the DAR was only 3.99%, while that of the YBJ radar was above 95% in all months except February. During the period, the average DAR of the IAP radar was 72.88% and that of the YBJ radar was 95.15%.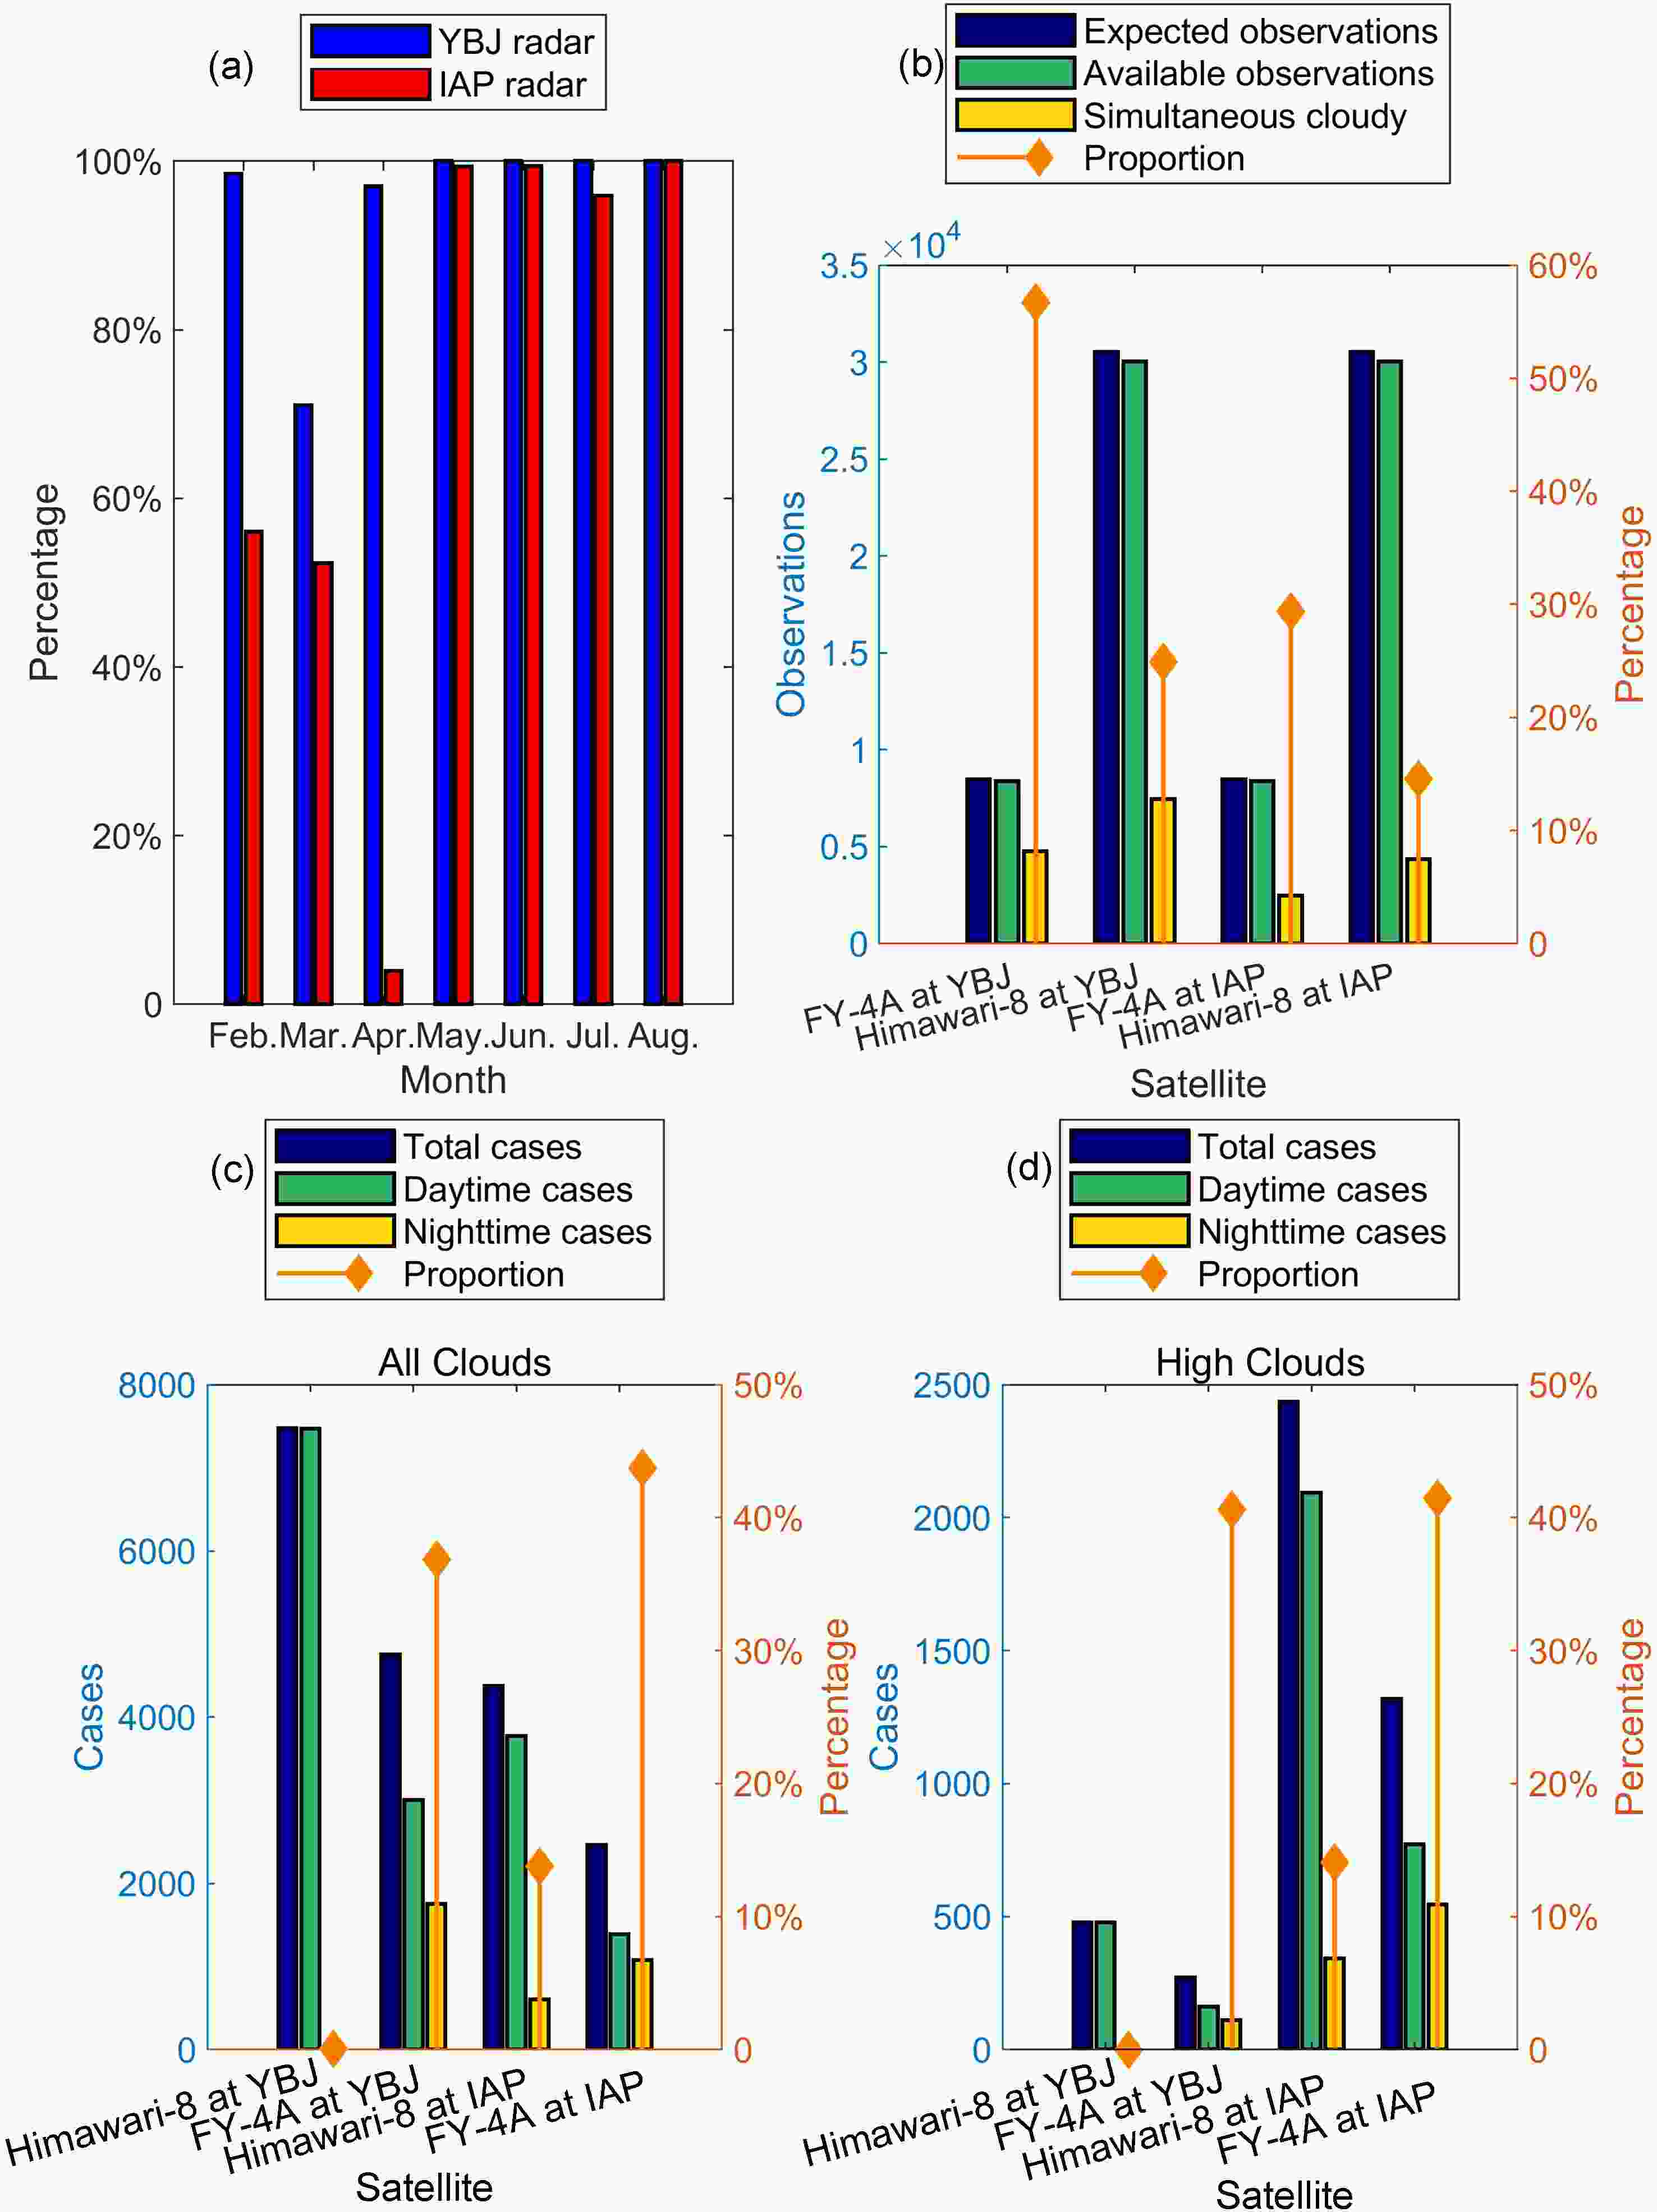 Figure2. (a) Percentage of radar observation times to all times at YBJ and IAP in each month from February through August 2019, and (b) the data numbers expected and obtained from the two satellites at both sites during the same period. (c, d) The number of comparison cases from Himawari-8 and FY-4A for (c) all and (d) high-level clouds from February through August 2019 at the YBJ and IAP sites.
The AGRI instrument onboard FY-4A makes a full-disk observation every hour and three consecutive full-disk observations every three hours. Each full-disk observation takes 15 min, so FY-4A normally generates 40 full-disk CTH files a day. The Himawari-8 satellite requires 10 min to make a full disk observation and normally generates 144 full-disk CTH files per day. Figure 2b shows the expected data number and the actual available data number from FY-4A and Himawari-8 during the study period for both sites. For CTH comparison, only the effective CTHs (i.e., CTH > 0) retrieved by both satellite and radar (termed valid collocation in this paper) were selected. The number of valid collocations from FY-4A and radar was 2465 at IAP and 4754 at YBJ, accounting for 29.4% and 56.7% of all satellite observations (termed the collocation ratio), respectively. The number of valid collocations from Himawari-8 and radar was 4374 at IAP and 7473 at YBJ, accounting for 14.6% and 24.9% of all satellite observations, respectively. The collocation ratio of FY-4A is about two times that of Himawari-8 at both sites. Additionally, the collocation ratio of both satellites at YBJ is about two times that at IAP.
The data collocation ratio also changed between daytime and nighttime. Figure 2c illustrates that the collocation ratios from Himawari-8 at night for all clouds were 13.79% and 0.08% at IAP and YBJ, respectively, while they were 43.73% and 36.85% from FY-4A at IAP and YBJ, respectively. There was a clear discrepancy between the two satellites. The collocation ratio at night from Himawari-8 is significantly lower than that from FY-4A at both sites, which means that Himawari-8 might neglect more CTHs at night compared to the radar and FY-4A. A similar feature was also observed for high clouds (which will be analyzed below), as shown in Fig. 2d. The reason for this discrepancy will be explained in sections 4.1 and 5.
2
3.2. CTH comparisons
33.2.1. Average CTH differences
Table 2 shows the quantified statistics of CTHD at both sites and Figs. 3a–d show scatterplots of the CTHs retrieved from radar and satellites. Figure 4a shows the probability density distributions of the CTHDs. Statistically, the CTHDrf ranged from ?8.49 km to 14.20 km; the mean of the CTHDrf was 0.06 km; the standard deviation (STD) of the CTHDrf was 1.90. The CTHDrh ranged from ?11.58 km to 9.96 km; the mean of the CTHDrh was ?0.02 km; the STD of the CTHDrh was 2.40. Statistically, the CTHDrf ranged from ?9.81 km to 14.84 km; the mean CTHDrf was 0.93 km; the STD of the CTHDrf was 2.24. The average CTH at IAP is about 3 km higher than that at YBJ. The CTHDrh ranged from ?12.92 km to 11.26 km; the mean CTHDrh was 0.99 km; the STD of the CTHDrh was 2.37.| Site | Satellite | Mean radar CTH (km) | Mean satellite CTH (km) | Correlation coefficient | Mean CTHD (km) | Median CTHD (km) | IQR of CTHD (km) | STD of CTHD (km) |
| YBJ, Tibet | FY-4A | 4.11 | 4.06 | 0.61 | 0.06 | 0.06 | 2.14 | 1.90 |
| Himawari-8 | 4.05 | 4.06 | 0.57 | ?0.02 | ?0.07 | 2.41 | 2.40 | |
| IAP, Beijing | FY-4A | 7.88 | 6.95 | 0.72 | 0.93 | 0.69 | 2.24 | 2.24 |
| Himawari-8 | 7.99 | 7.00 | 0.69 | 0.99 | 0.69 | 2.27 | 2.37 |
Table2. Statistics of the CTHD at the YBJ and IAP sites.
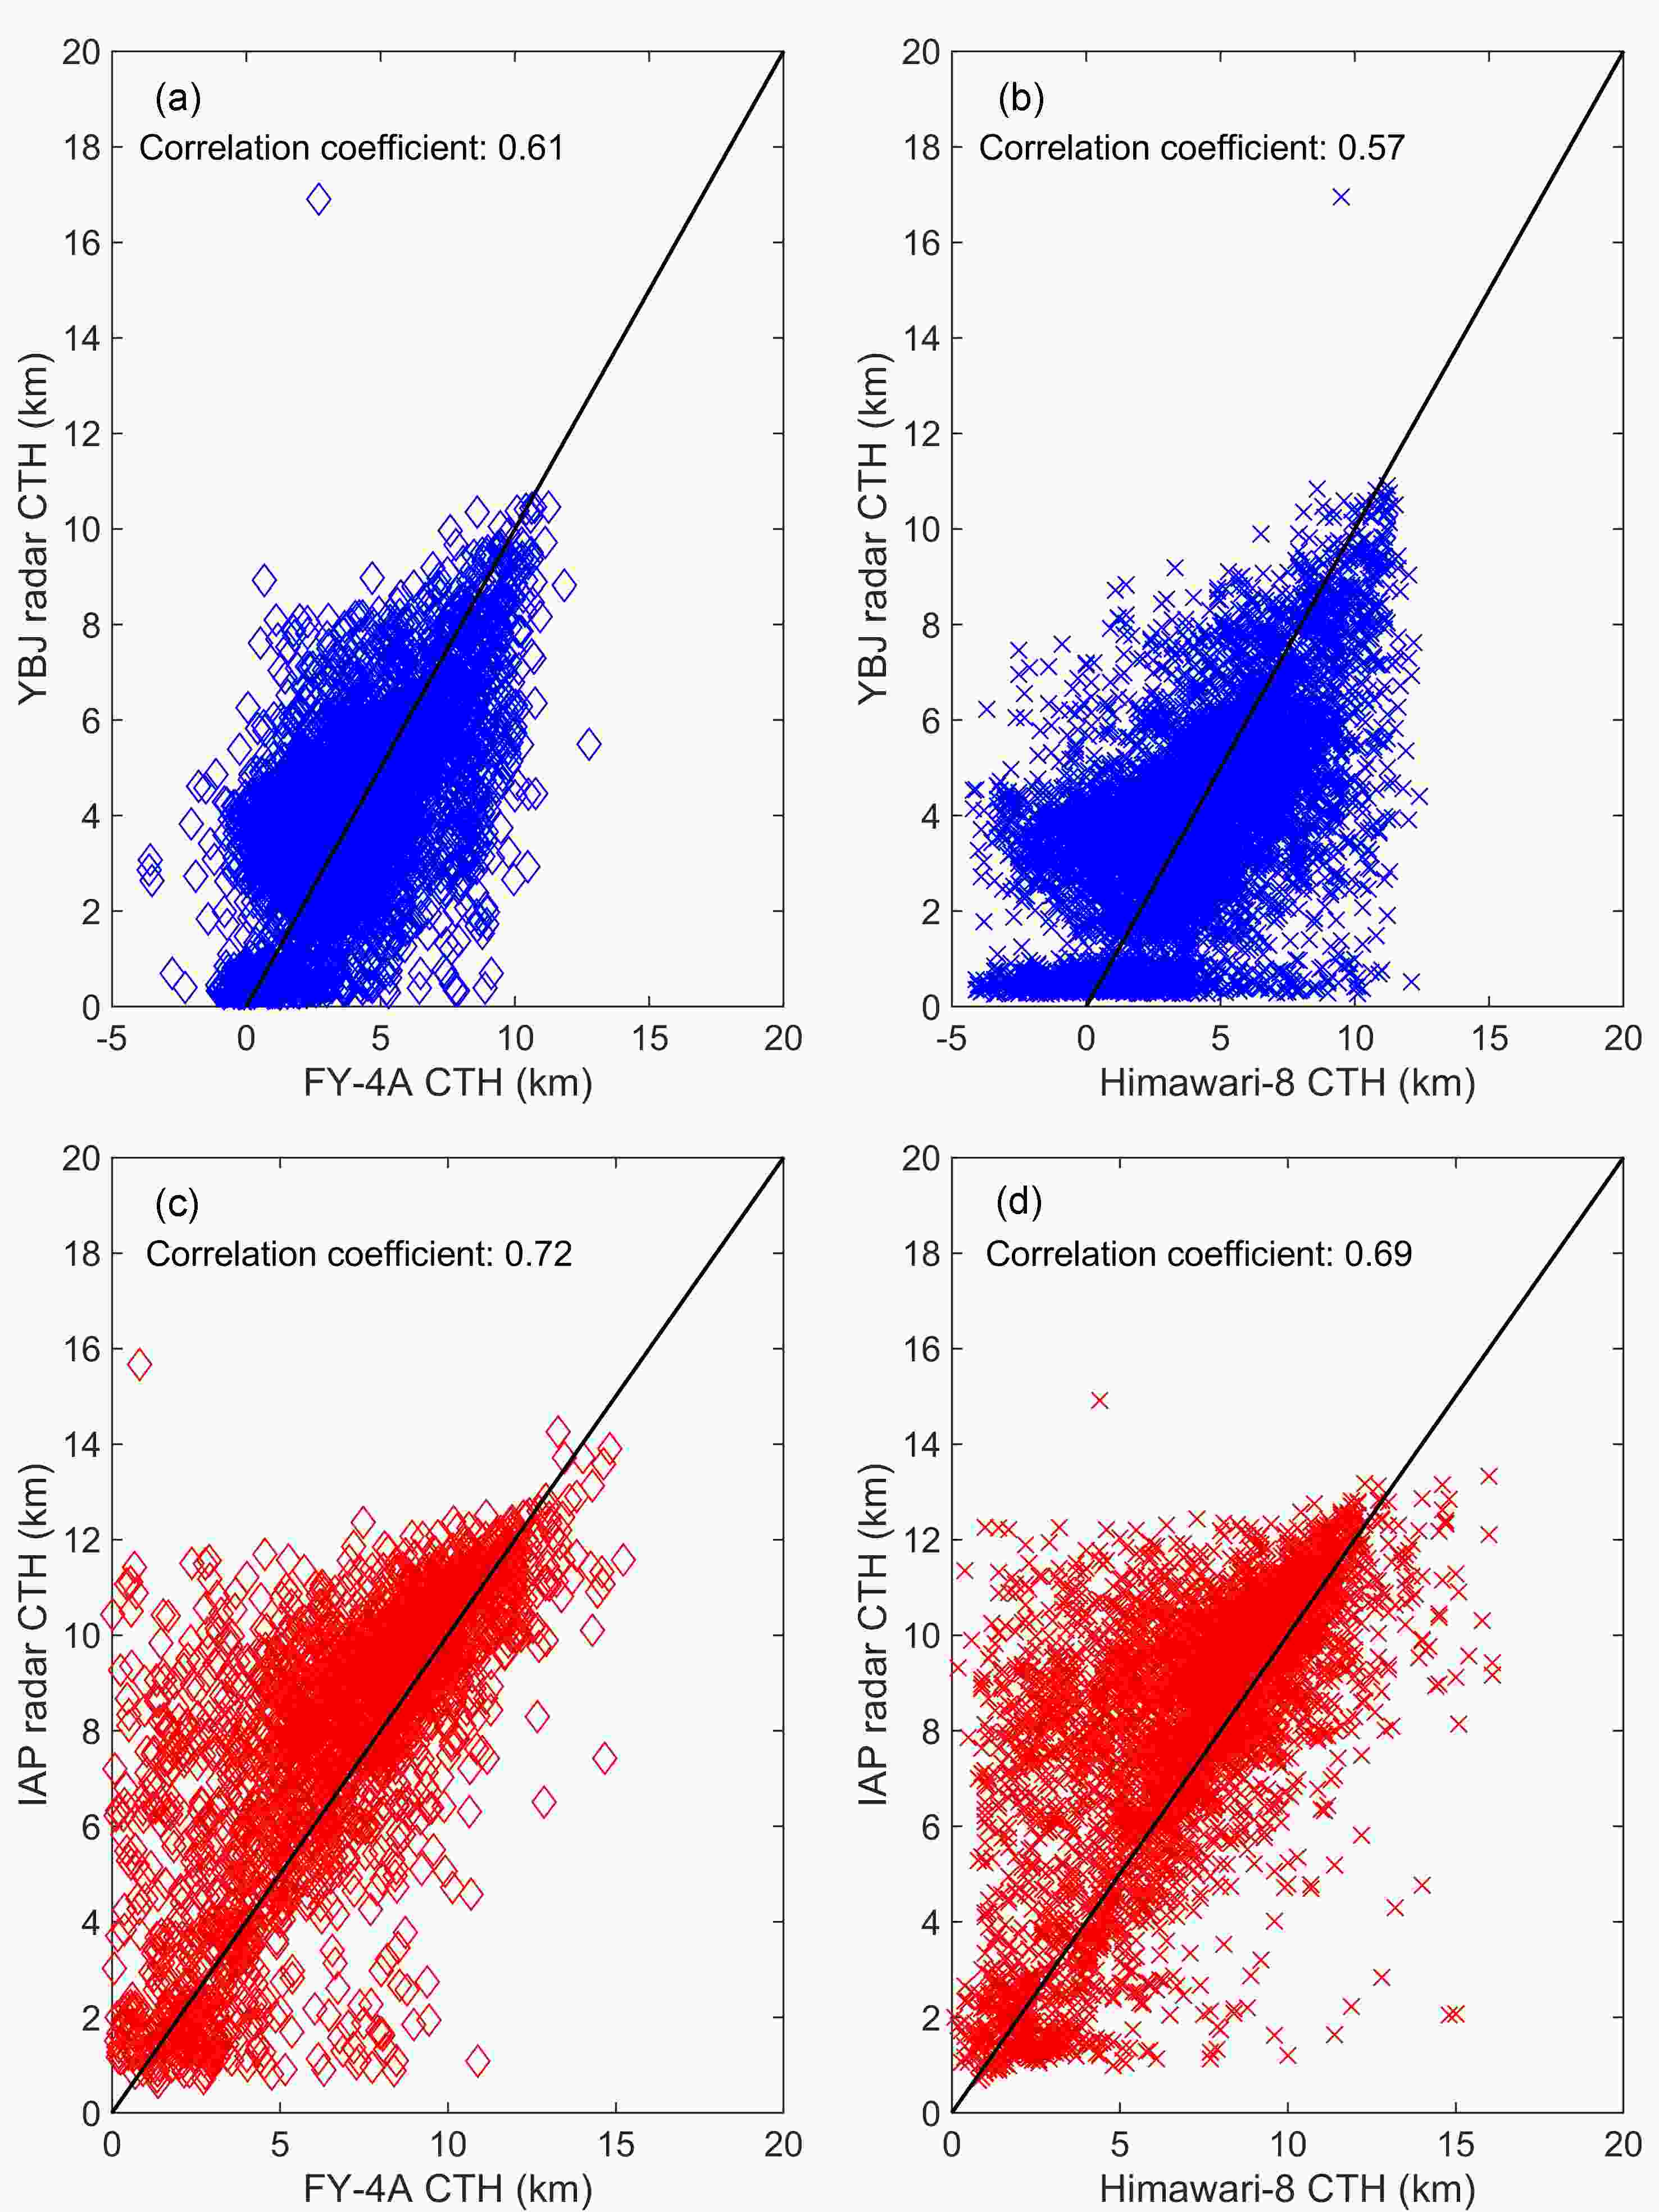 Figure3. Scatterplots of radar and satellite CTHs at both sites: (a) YBJ radar and FY-4A; (b) YBJ radar and Himawari-8; (c) IAP radar and FY-4A; (d) IAP radar and Himawari-8. A one-to-one line is included in each figure for comparison.
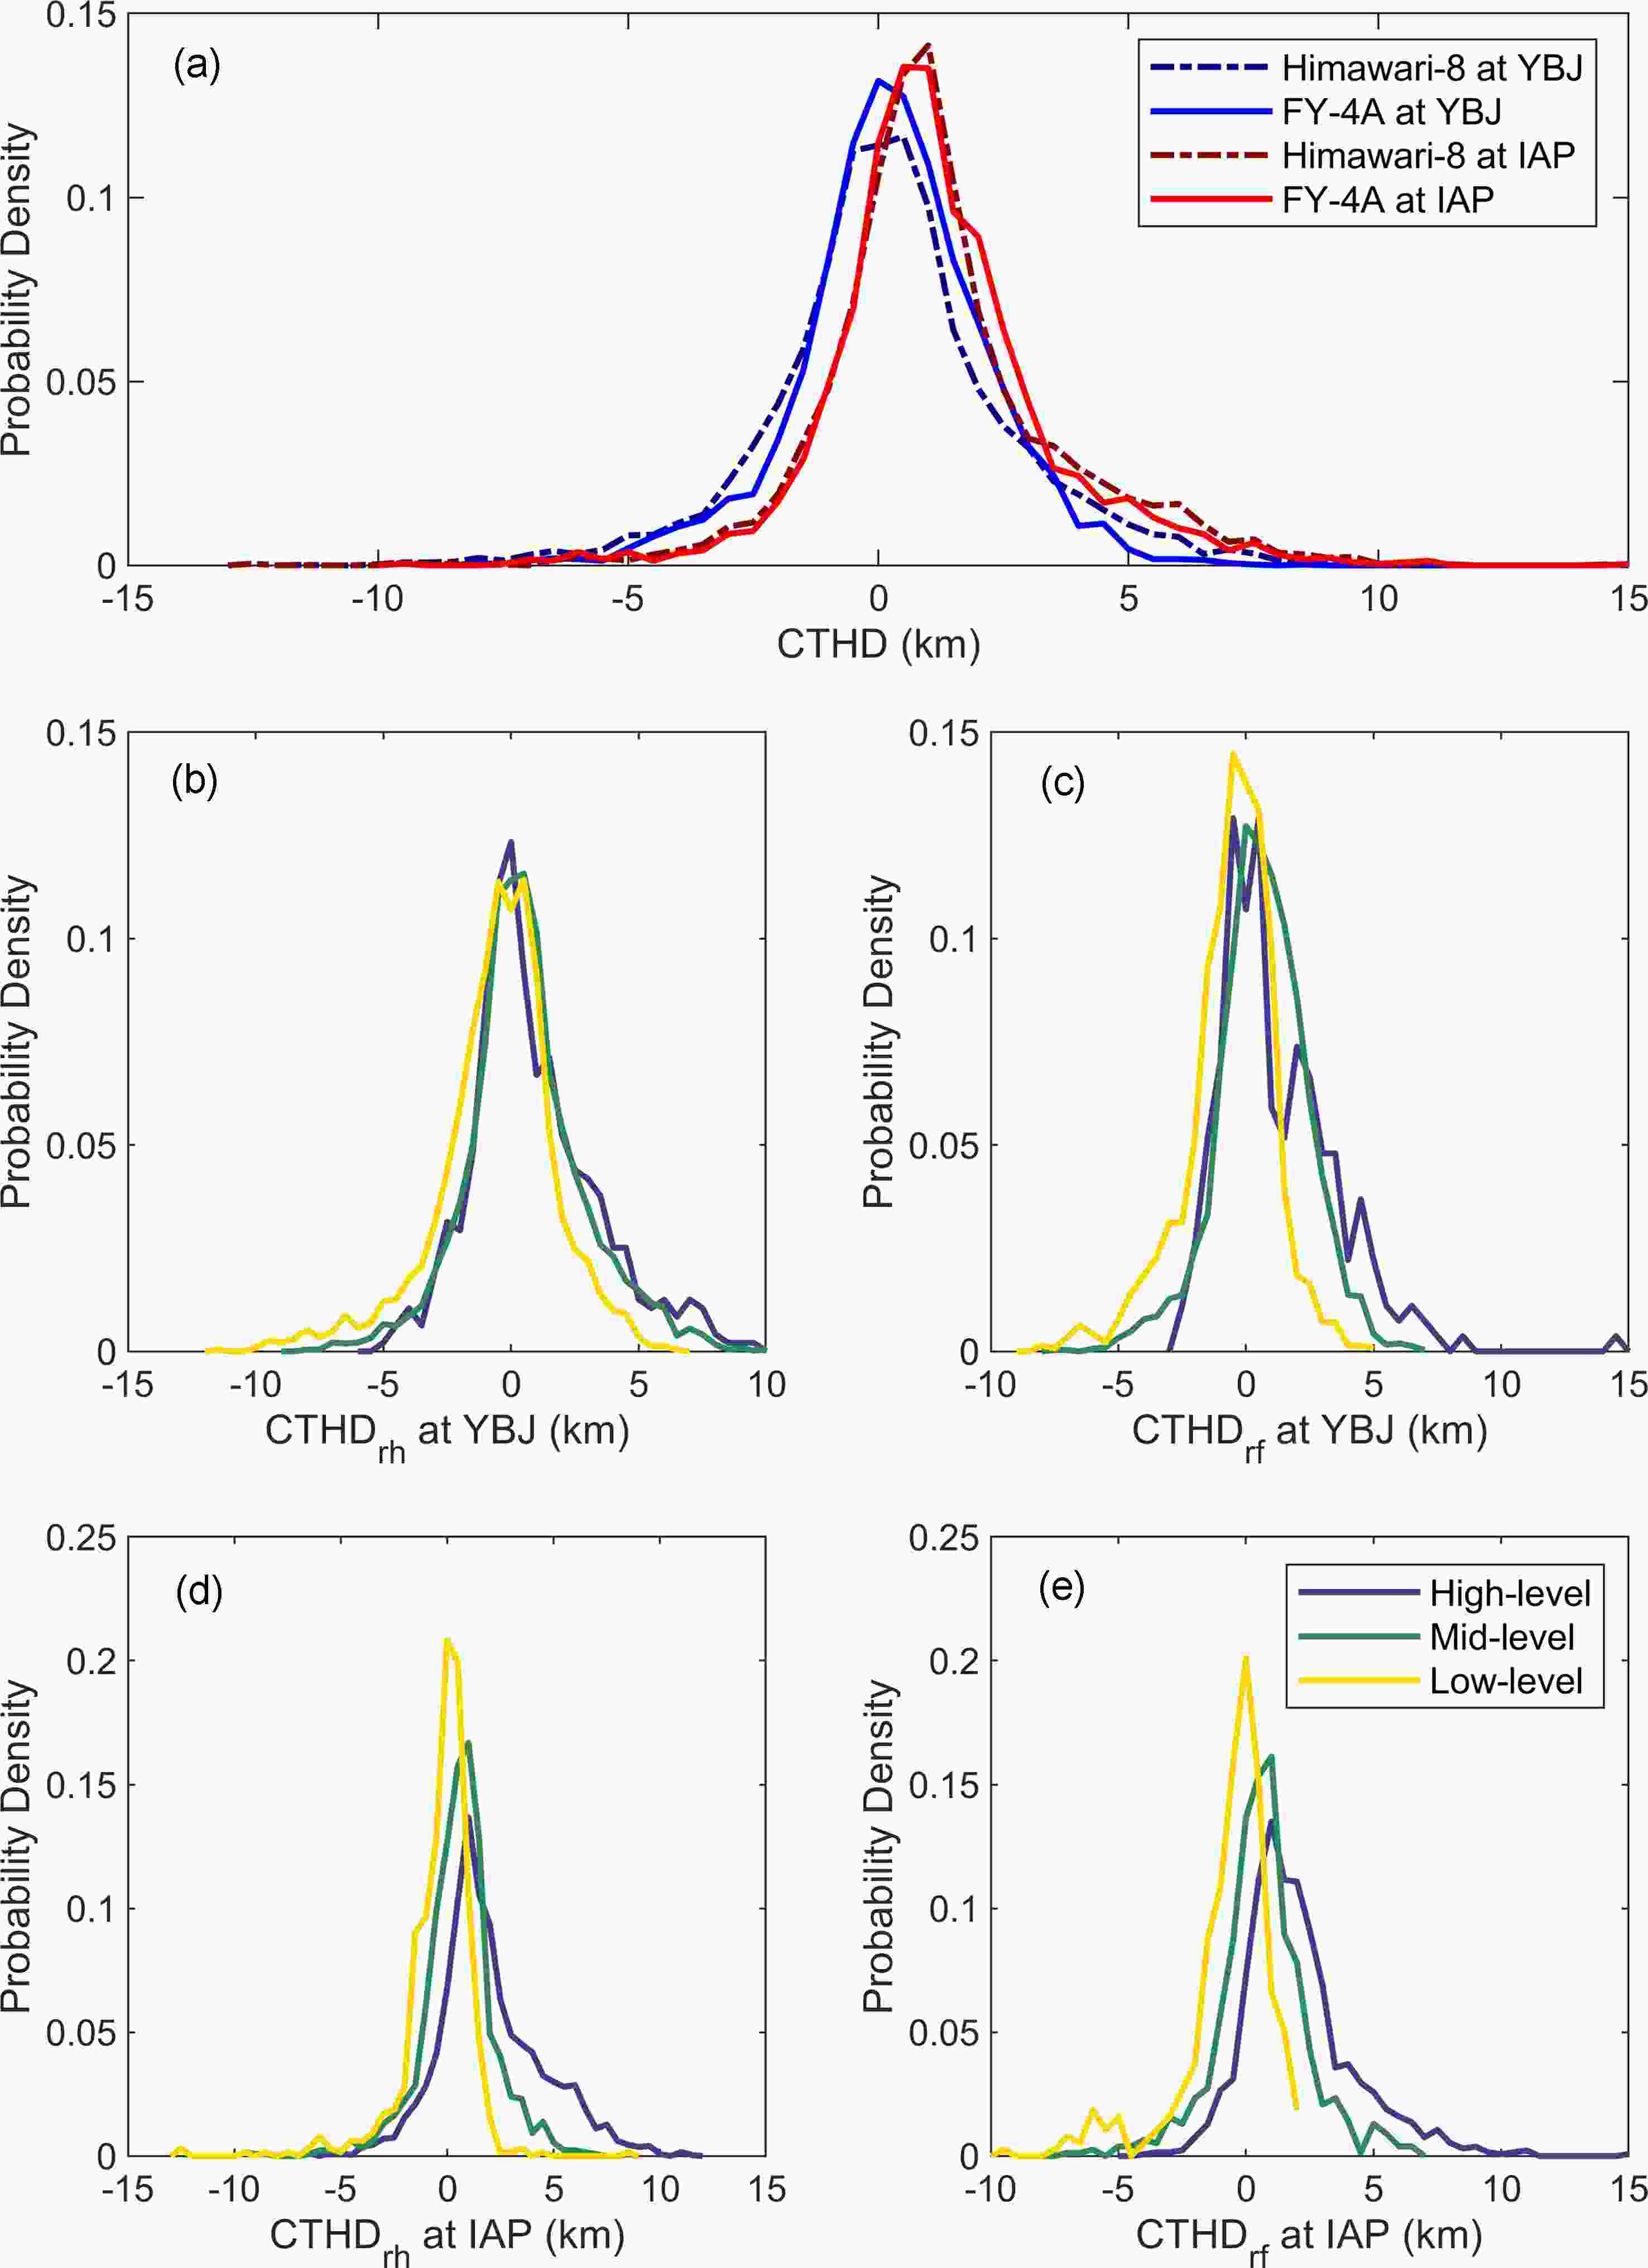 Figure4. The probability density distribution of the CTHD: (a) average CTHD at both sites; (b) CTHDrh for different cloud levels at YBJ; (c) CTHDrf for different cloud levels at YBJ; (d) CTHDrh for different cloud levels at IAP; (e) CTHDrf for different cloud levels at IAP.
From Table 2 it can be seen that the correlation coefficients of FY-4A and Himawari-8 with radar CTHs were 0.61 and 0.57 at YBJ, and 0.72 and 0.69 at IAP, respectively, all of which demonstrate good agreement between radar and both satellites. FY-4A and Himawari-8 retrievals agree quite well, with a difference of 0.08 km between the CTHDrf and the CTHDrh at YBJ, and the CTHDrh being 0.06 km higher than the CTHDrf at IAP, on average. The CTHs at YBJ are distributed symmetrically along the diagonal lines shown in Figs. 3a and b, and the distributions in Fig. 4a are not positively skewed. Different from the results at YBJ, most CTHs at IAP lie above the diagonal lines, as shown in Figs. 3c and d, and the distributions in Fig. 4a appear positively skewed, which means the satellite CTH retrievals at YBJ are more reasonable and both satellites underestimated the CTHs when compared with the radar at IAP.
It should be noted that the statistical results at YBJ contain some satellite CTHs lower than zero (see Figs. 3a and b). This is because the satellite CTH used here was equal to the original satellite CTH minus 4.3 km of surface altitude. The negative CTHs of FY-4A and Himawari-8 accounted for 2.27% and 8.91% of all collocations at YBJ, respectively. Obviously, these negative data have uncertainties.
3
3.2.2. CTH differences for low-, mid- and high-level clouds
Previous research has shown that the performances of satellite retrievals of CTH vary with the different cloud levels (Wang et al., 2018b). In this paper, comparisons of CTH retrievals are discussed and characterized according to the cloud-base height (CBH) observed by radar, wherein clouds with CBH ≥ 6 km are defined as high-level clouds, < 6 km but ≥ 2 km as mid-level clouds, and < 2 km as low-level clouds. Of all 4754 FY-4A and radar collocations at YBJ, the percentages of high-, mid-, and low-level cloud collocations were 5.70%, 64.64%, and 29.66%, respectively. Meanwhile, of all 7473 Himawari-8 collocations at YBJ, the percentages of high-, mid-, and low-level clouds collocations were 6.40%, 62.68%, and 30.92%, respectively. Of all 2465 FY-4A collocations at IAP, the percentages of high-, mid-, and low-level cloud collocations were 53.47%, 31.20%, and 15.33%, respectively. Among all 4374 Himawari-8 collocations at IAP, the percentages of high-, mid-, and low-level cloud collocations were 55.69%, 29.61%, and 14.70%, respectively. Tables 3 and 4 show the statistics of the CTHDs for different levels of clouds at the two sites, and the probability density distributions of the CTHDs for high-, mid-, and low-level clouds are shown in Figs. 4b–e.| Cloud type | Radar CBH | Satellite | No. of samples | Mean CTHD (km) | Median CTHD (km) | IQR of CTHD (km) | STD of CTHD (km) |
| High | CBH ≥ 6 km | FY-4A | 271 | 0.99 | 0.40 | 2.95 | 2.26 |
| Himawari-8 | 478 | 0.67 | 0.18 | 2.98 | 2.48 | ||
| Middle | 2 km ≤ CBH < 6 km | FY-4A | 3073 | 0.40 | 0.38 | 2.13 | 1.77 |
| Himawari-8 | 4684 | 0.31 | 0.12 | 2.46 | 2.32 | ||
| Low | CBH < 2 km | FY-4A | 1410 | ?0.86 | ?0.64 | 2.00 | 1.77 |
| Himawari-8 | 2311 | ?0.81 | ?0.61 | 2.49 | 2.34 |
Table3. CTHDs for different levels of clouds at YBJ, Tibet.
| Cloud type | Radar CBH | Satellite | No. of samples | Mean CTHD (km) | Median CTHD (km) | IQR of CTHD (km) | STD of CTHD (km) |
| High | CBH ≥ 6 km | FY-4A | 1318 | 1.80 | 1.45 | 2.27 | 2.15 |
| Himawari-8 | 2436 | 1.79 | 1.32 | 2.83 | 2.47 | ||
| Middle | 2 km ≤ CBH < 6 km | FY-4A | 769 | 0.38 | 0.39 | 1.73 | 1.79 |
| Himawari-8 | 1295 | 0.29 | 0.36 | 1.72 | 1.77 | ||
| Low | CBH < 2 km | FY-4A | 378 | ?0.96 | ?0.55 | 1.57 | 1.79 |
| Himawari-8 | 643 | ?0.61 | ?0.34 | 1.48 | 1.67 |
Table4. CTHDs for different levels of clouds at IAP, Beijing.
The average CTHDrf of high-, mid-, and low-level clouds at YBJ was 0.99 km, 0.40 km, and ?0.86 km, respectively, and the average CTHDrh was 0.67 km, 0.31 km, and ?0.81 km, respectively. That is, both satellites underestimated the CTH of the high- and mid-level clouds but overestimated the CTH of the low-level clouds at YBJ when compared with radar. The average CTHDs of mid-level clouds were the smallest, all being < 0.5 km for both satellites, and the average CTHDs of high- and low-level clouds were higher. It can be concluded that the retrieval accuracy of the two satellites for high- and low-level clouds is worse than that for mid-level clouds at YBJ.
The average CTHDrf of high-, mid-, and low-level clouds at IAP was 1.80 km, 0.38 km, and ?0.96 km respectively, and the average CTHDrh was 1.79 km, 0.29 km, and ?0.61 km, respectively. That is, like the results at YBJ, both satellites underestimated the CTH of the high- and mid-level clouds but overestimated the CTH of the low-level clouds at IAP when compared with radar. The average CTHDs of mid- and low-level clouds were all < 1.0 km, and the average CTHDs of mid-level clouds were the smallest, all being < 0.5 km for both satellites; however, the average CTHDs of high-level clouds were the biggest, with 1.80 km for FY-4A and 1.79 km for Himawari-8. Therefore, the retrieval accuracy of the two satellites for high-level clouds is the worst at IAP, while that for mid-level clouds is the best.
In general, high clouds are thinner and more transparent, making it harder to meet the blackbody assumption for clouds, ultimately resulting in poor accuracy in top-height retrieval. As for low clouds, infrared-based, space-borne measurements have inherent difficulties in detecting the CTH because of the uncertainties in the assumed temperature profiles in the lower atmosphere, especially within the boundary layer (Huang et al., 2019).
3
3.2.3. CTH differences for clouds with different depth, layers, and fraction
Clouds with greater optical thickness are more likely to be regarded as blackbodies, which meets the assumptions required for CTH retrieval using infrared radiance. Thicker clouds generally have greater optical thickness. The relationship between CTHDs and cloud depth was examined in this study, and the results are presented in Fig. 5. It can be seen that the CTHDs decreased as the cloud depth increased at both YBJ and IAP. Figure 6a shows that the mean depth of high-level clouds was smaller than that of mid- and low-level clouds at both sites. Compared to optically thick cloud, it is more difficult to identify thin cloud from the surface (background) since it is somewhat transparent to the infrared radiation from the atmosphere and surface below. Also, optically thin clouds complicate CTH retrieval since the blackbody assumptions cannot be met (Hollars et al., 2004; Weisz et al., 2007). Although FY-4 and Himawari-8 have used specialized approaches to improve the accuracy regarding the CTH of thin clouds, the analysis here shows that the current retrieval performance is still worse for thin clouds than it is for thick clouds.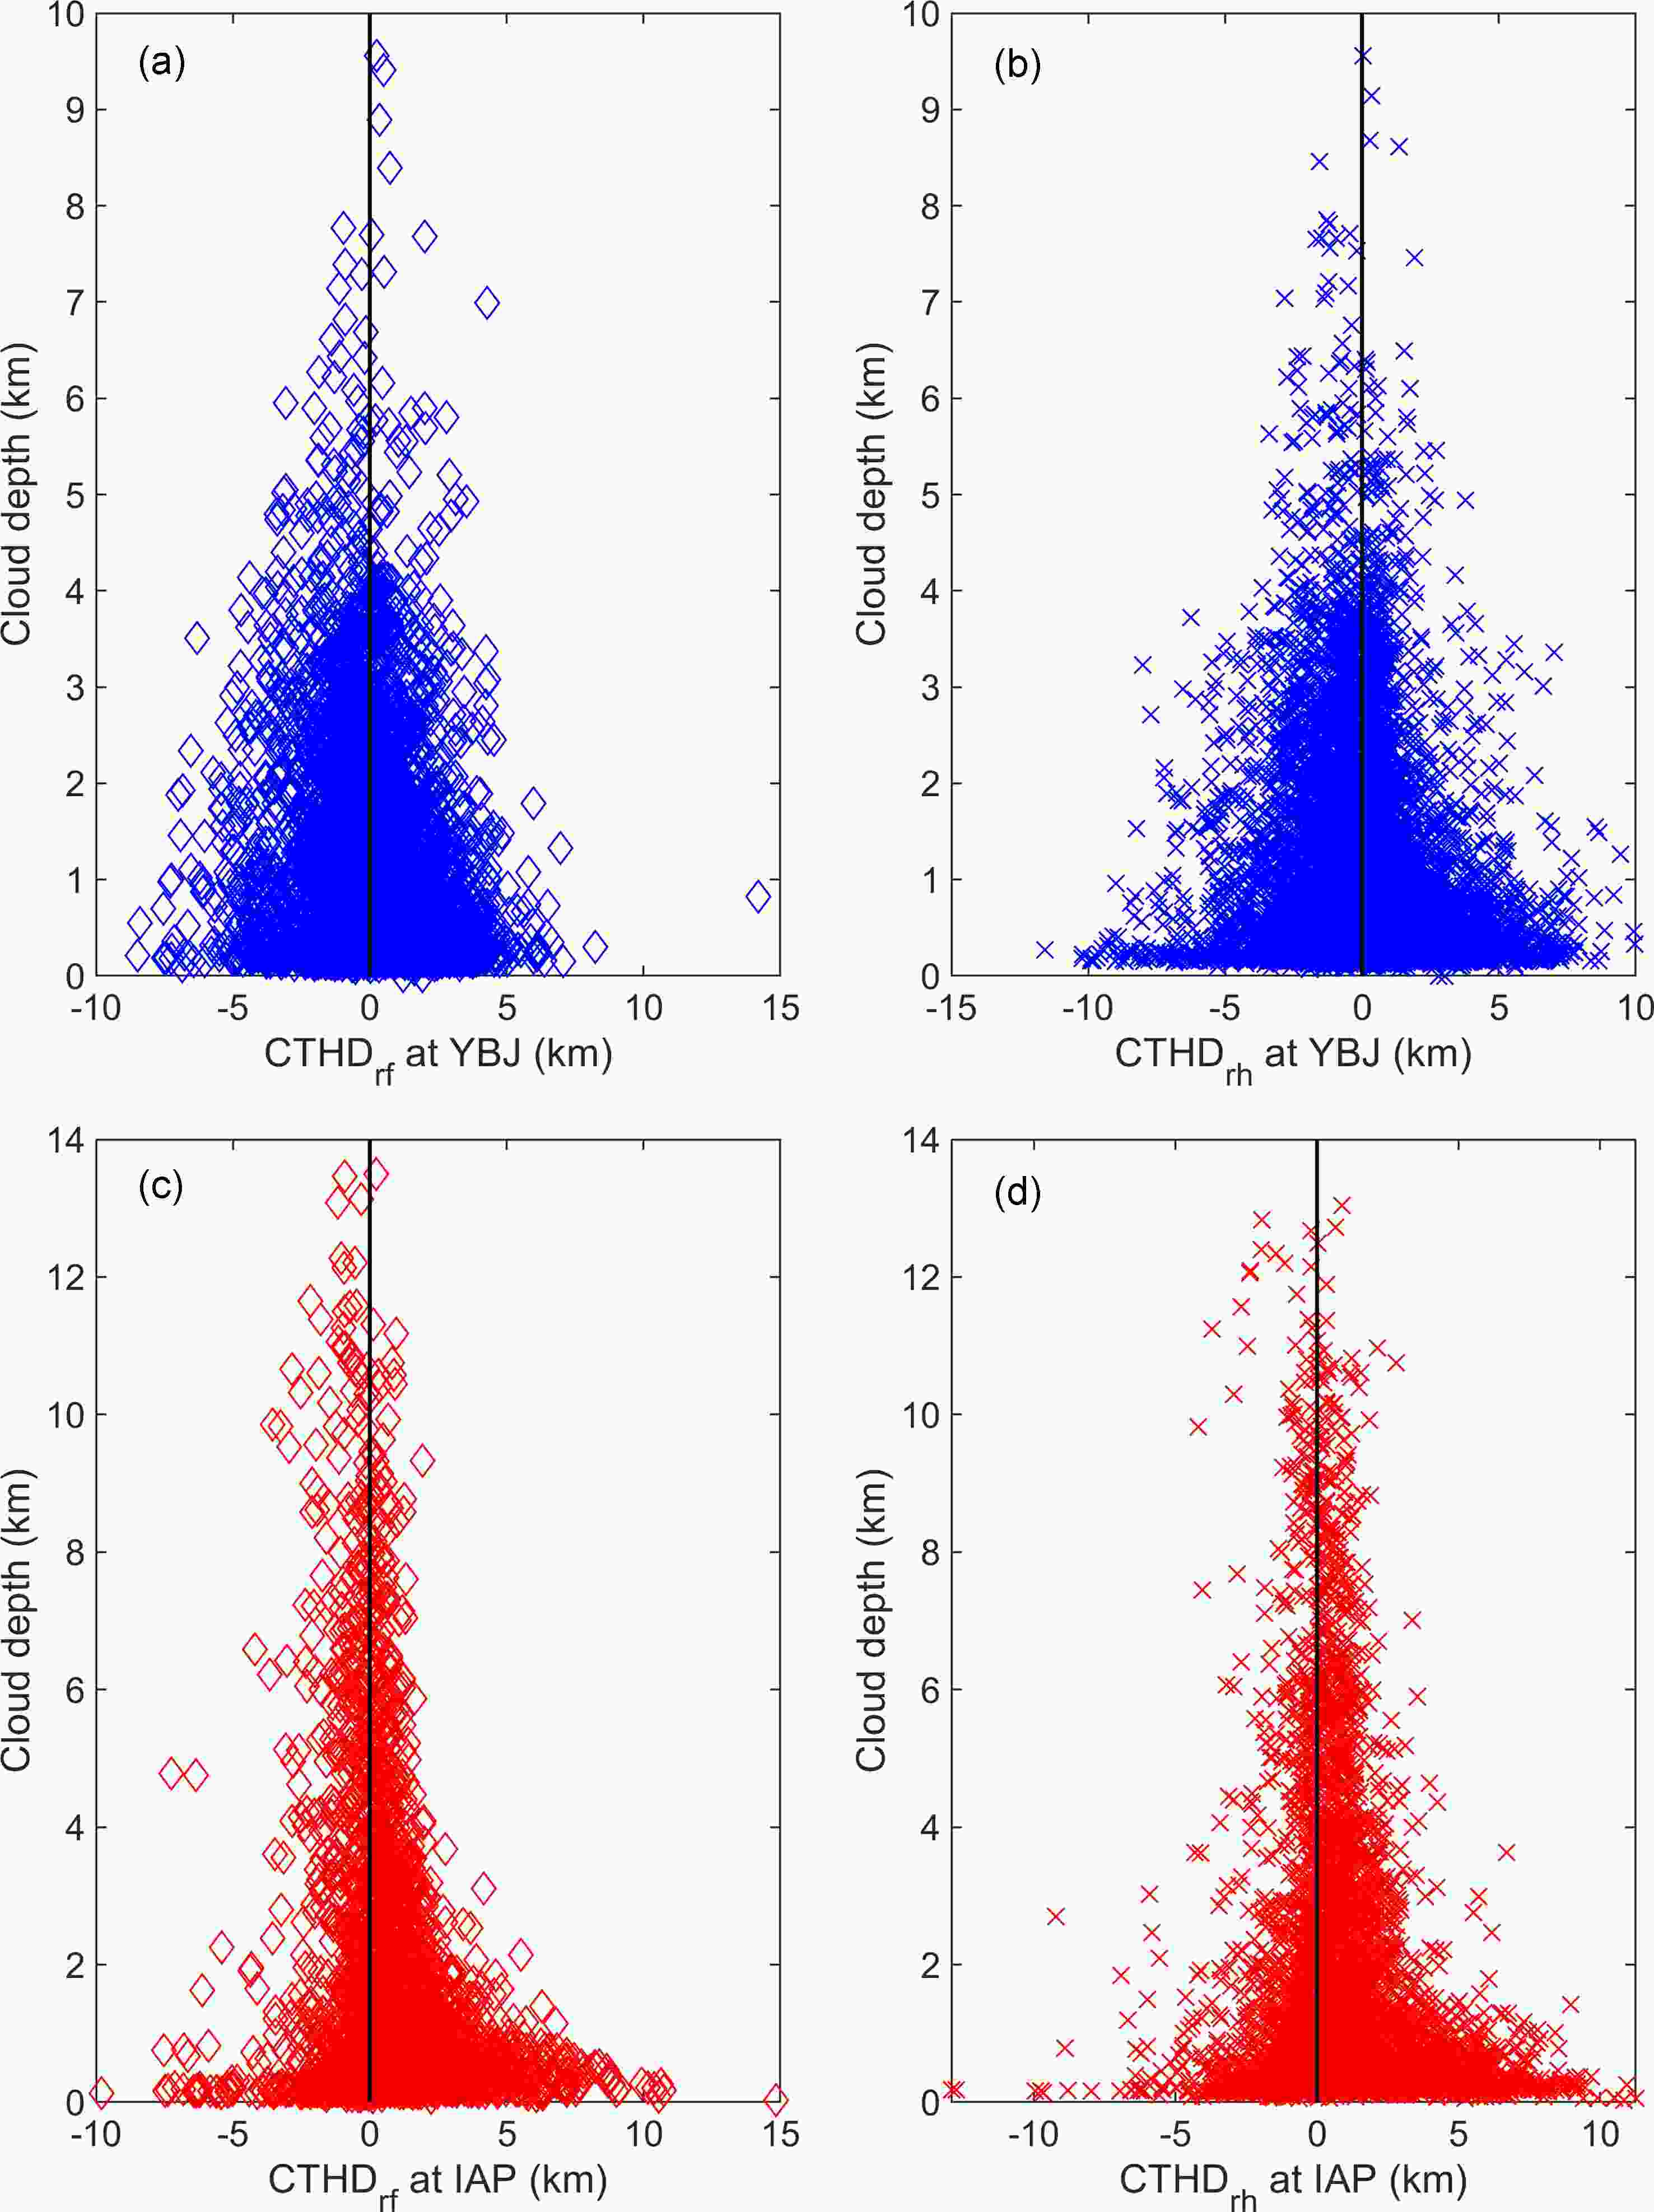 Figure5. The CTHDs associated with various cloud depths at both sites: (a) CTHDrfs with cloud depth at YBJ; (b) CTHDrhs with cloud depth at YBJ; (c) CTHDrfs with cloud depth at IAP; (d) CTHDrhs with cloud depth at IAP.
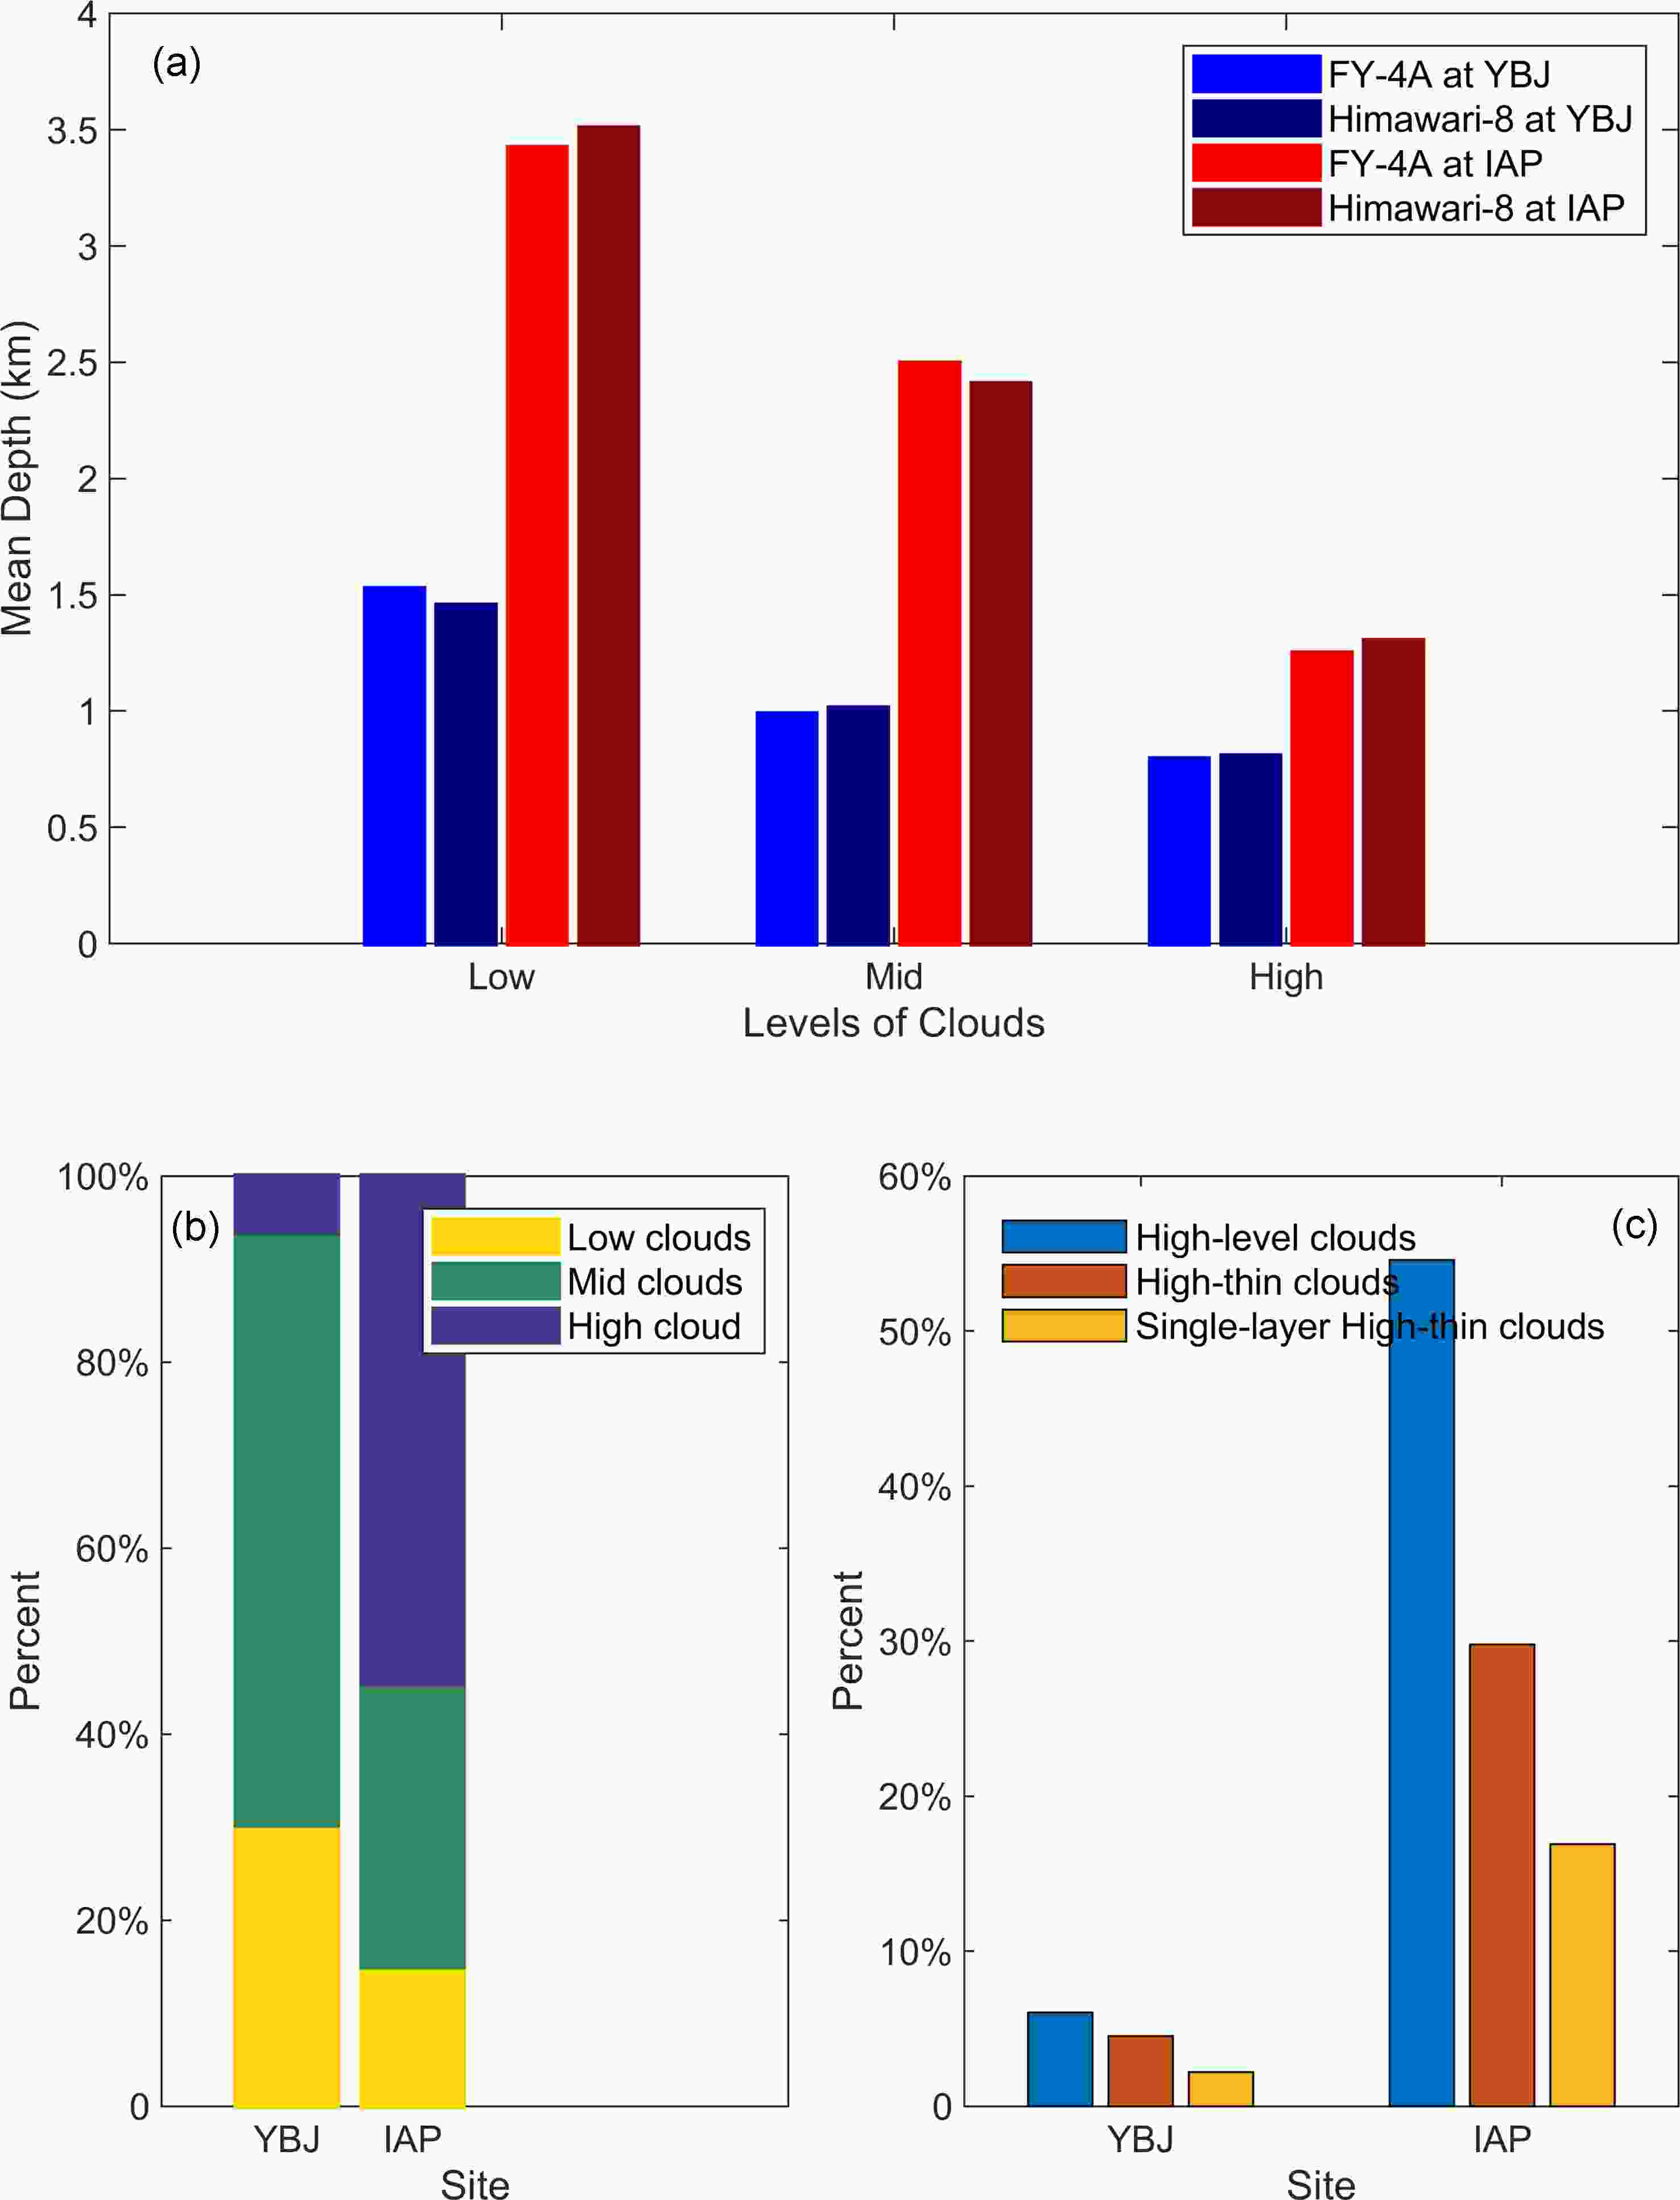 Figure6. The (a) cloud depth of different levels of clouds, (b) proportions of different levels of clouds, and (c) proportions of high-level clouds, high-thin clouds, and single-layer high-thin clouds, at the YBJ and IAP sites.
Previous research has shown that comparisons of CTH retrievals from satellite and radar will become extremely complicated when multilayer clouds exist, particularly for times when a thin cloud overlays a thick cloud, satellite retrievals place the CTHs somewhere between the upper boundaries of the two cloud layers (Hollars et al., 2004; Weisz et al., 2007; Tan et al., 2019). In addition, when retrieving the CTH of the broken clouds by satellite infrared remote sensing, the infrared radiation below the cloud layer can penetrate through the cloud, resulting in the radiation measured by the satellite being compromised by the background radiation below the cloud (Fan et al., 2017). Thus, multilayer clouds, or broken clouds, cause CTH retrieval uncertainty. We also investigated the change in CTHDs with multiple cloud layers and cloud fractions, and the statistical results showed that the CTHD demonstrated slight increases which are deemed insignificant for multilayer clouds and broken clouds at both sites (for brevity, figures not shown in this paper). This result is the same as that reported by Huo et al. (2020b). It can be concluded that the cloud fraction and the presence of multiple cloud layers are not critical factors resulting in CTHD when compared with other causes, such as the cloud height and cloud depth.
2
4.1. Influence of cloud properties
As shown in the previous section, the CTHD is largely dependent upon the cloud depth and the cloud level. The distributions of radar CTH and cloud depth are different at the two sites. The radar CTHs at IAP reach approximately 13 km, while those at YBJ are lower than 10 km (see Fig. 3). The maximum cloud depth at IAP reached 13 km, while it was lower than 10 km at YBJ. The percentage of thin clouds at YBJ is larger than that at IAP. On average, the cloud depth at IAP is about 0.83 km larger than that at YBJ. Nevertheless, the mean CTHD at YBJ was lower than that at IAP. Thus, overall, the difference in cloud depth between the two sites shows no obvious link with their CTHD discrepancy.Figure 6b shows the proportions of different cloud levels at two sites. At YBJ, the proportion of high-level clouds, high-thin clouds, and single-layer high-thin clouds was 6.05%, 4.51%, and 2.19%, respectively, while at IAP the proportion was 54.58%, 29.85%, and 16.89%, respectively. The proportion of thin clouds (cloud depth < 1 km) at the YBJ site was 60.68% compared to 50.14% at the IAP site. The percentage of high-level clouds at IAP is larger than that at YBJ. From Tables 3 and 4, it can be seen that the CTH differences for clouds at the same levels at the two sites were different. For FY-4A and Himawari-8, the differences in the average CTHD of high-level clouds between IAP and YBJ were 0.81 km and 1.12 km, respectively. The differences in the average CTHD of mid-level clouds between the two sites were 0.02 km and 0.02 km, respectively, and those of low-level clouds between the two sites were 0.10 km and 0.20 km, respectively. The average CTHDs of low-level clouds were similar at the two sites, and those of mid-level clouds were almost the same; however, the average CTHD of high-level clouds at IAP was much greater than that at YBJ. In other words, the satellite retrieval of the top heights of high clouds at YBJ is more credible than that at IAP. It might be concluded that high-level clouds, about 50% of which are thin clouds, contributed to the large average CTHD at IAP. But why does IAP show a lower retrieval accuracy than YBJ for the high-thin clouds (CBH ≥ 6 km and cloud depth < 1 km)?
We investigated the effect of satellite viewing geometry on retrieval accuracy. The distances from the sub-satellite point of FY-4A to the two sites, IAP and YBJ, were 4598.95 km and 3682.84 km, respectively, and the distances of Himawari-8 were 5082.36 km and 6279.26 km, respectively. YBJ is closer to the sub-satellite point of FY-4A and IAP is closer to the sub-satellite point of Himawari-8, indicating that viewing geometry is not the reason causing the regional discrepancy. However, satellite viewing geometry might be one of the reasons why Himawari-8 missed more CTHs at night than FY-4A at both sites.
2
4.2. Influence from AOD
The AOD may change the emissivity of the surface and atmosphere below clouds, resulting in uncertainties in the CTH retrievals. Especially for relatively thin, high clouds, the AOD may significantly enlarge the cloud-top temperature measured by the satellite, thus greatly underestimating the CTH. The influence of the AOD on CTH retrieval for high clouds was studied, and the results are reported in this section.In this paper, since the AOD generally changes gradually with time, the Himawari-8 AOD, averaged within ± 2 h, is used to represent the AOD of each collocation case. During the study period, the AOD at IAP was 0.06 larger than that at YBJ, on average. The average CTHD when the AOD changes from 0 to 1.5 was calculated at 0.1 AOD intervals. CTHDs with an AOD larger than 1.5 were grouped and then averaged. The mean and STD of CTHDs at various AODs are shown in Fig. 7. As illustrated, the mean and STD of CTHDs did not change significantly with an increase in AOD, therefore, the relationship between the CTHDs and the AOD is not significant for both high clouds and single-layer high-thin clouds. We conclude that the AOD has little influence on the CTHD. Consequently, the AOD is not the main reason causing the regional discrepancy.
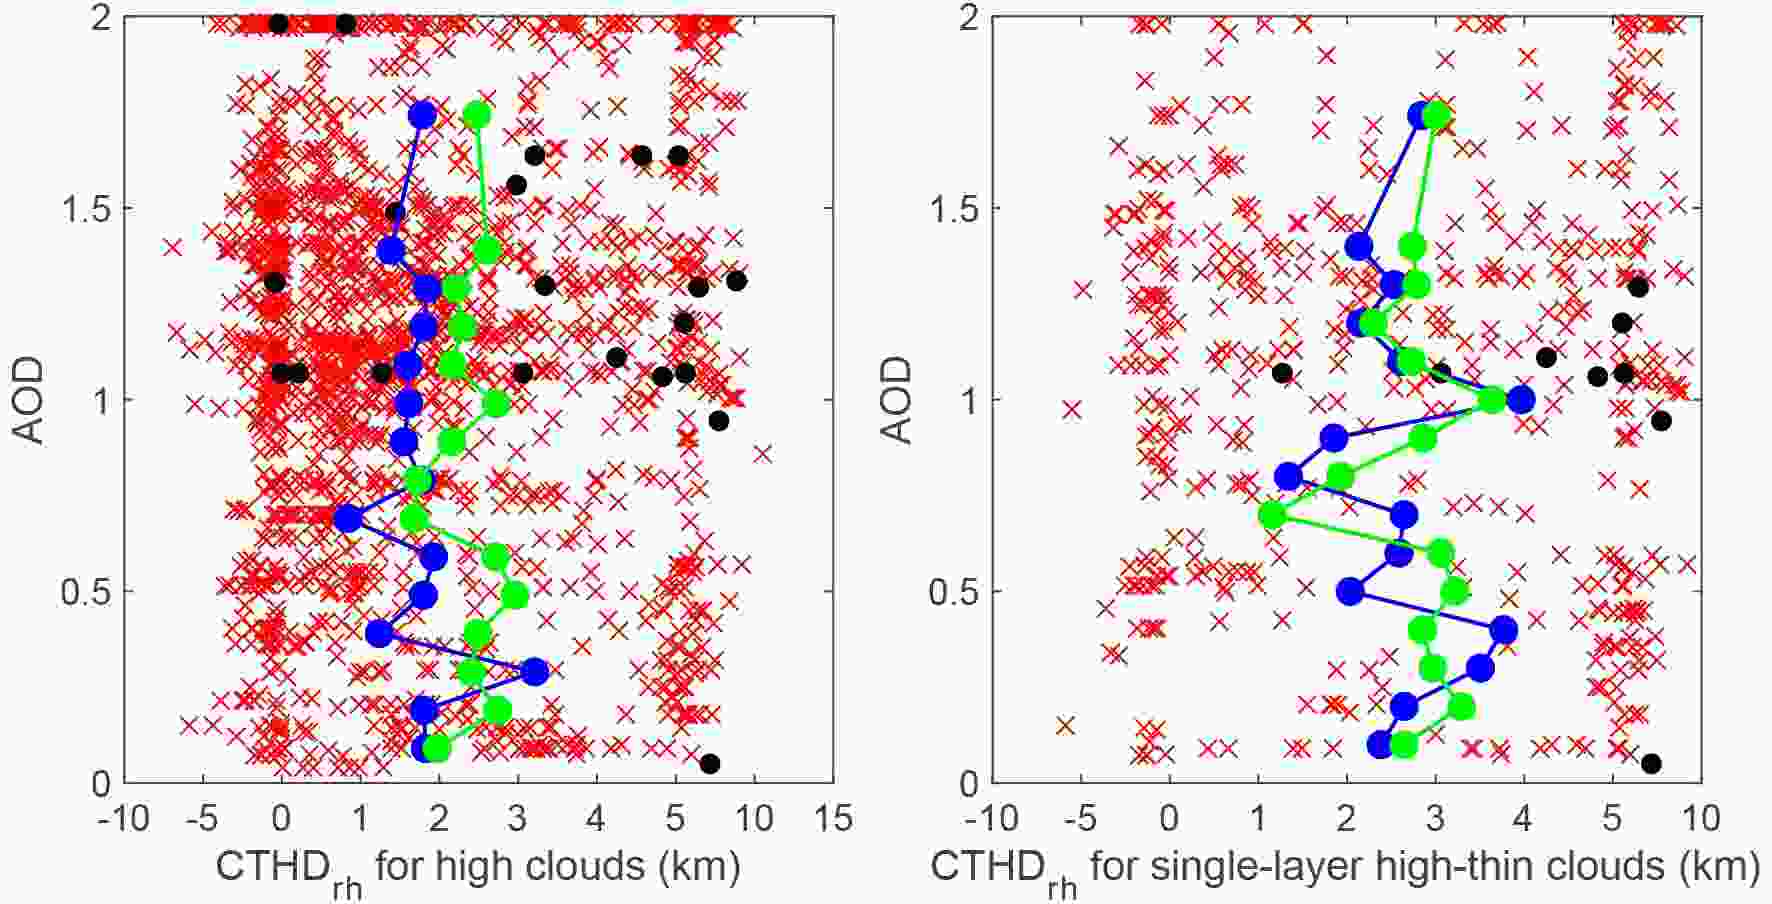 Figure7. Relationship between AOD and CTHD for high clouds and single-layer high-thin clouds for (a, b) Himawari-8 and (c, d) FY-4A, respectively. Red crosses denote IAP; black dots denote YBJ; the blue line indicates the mean CTHD and the green line indicates the STD of the CTHD.
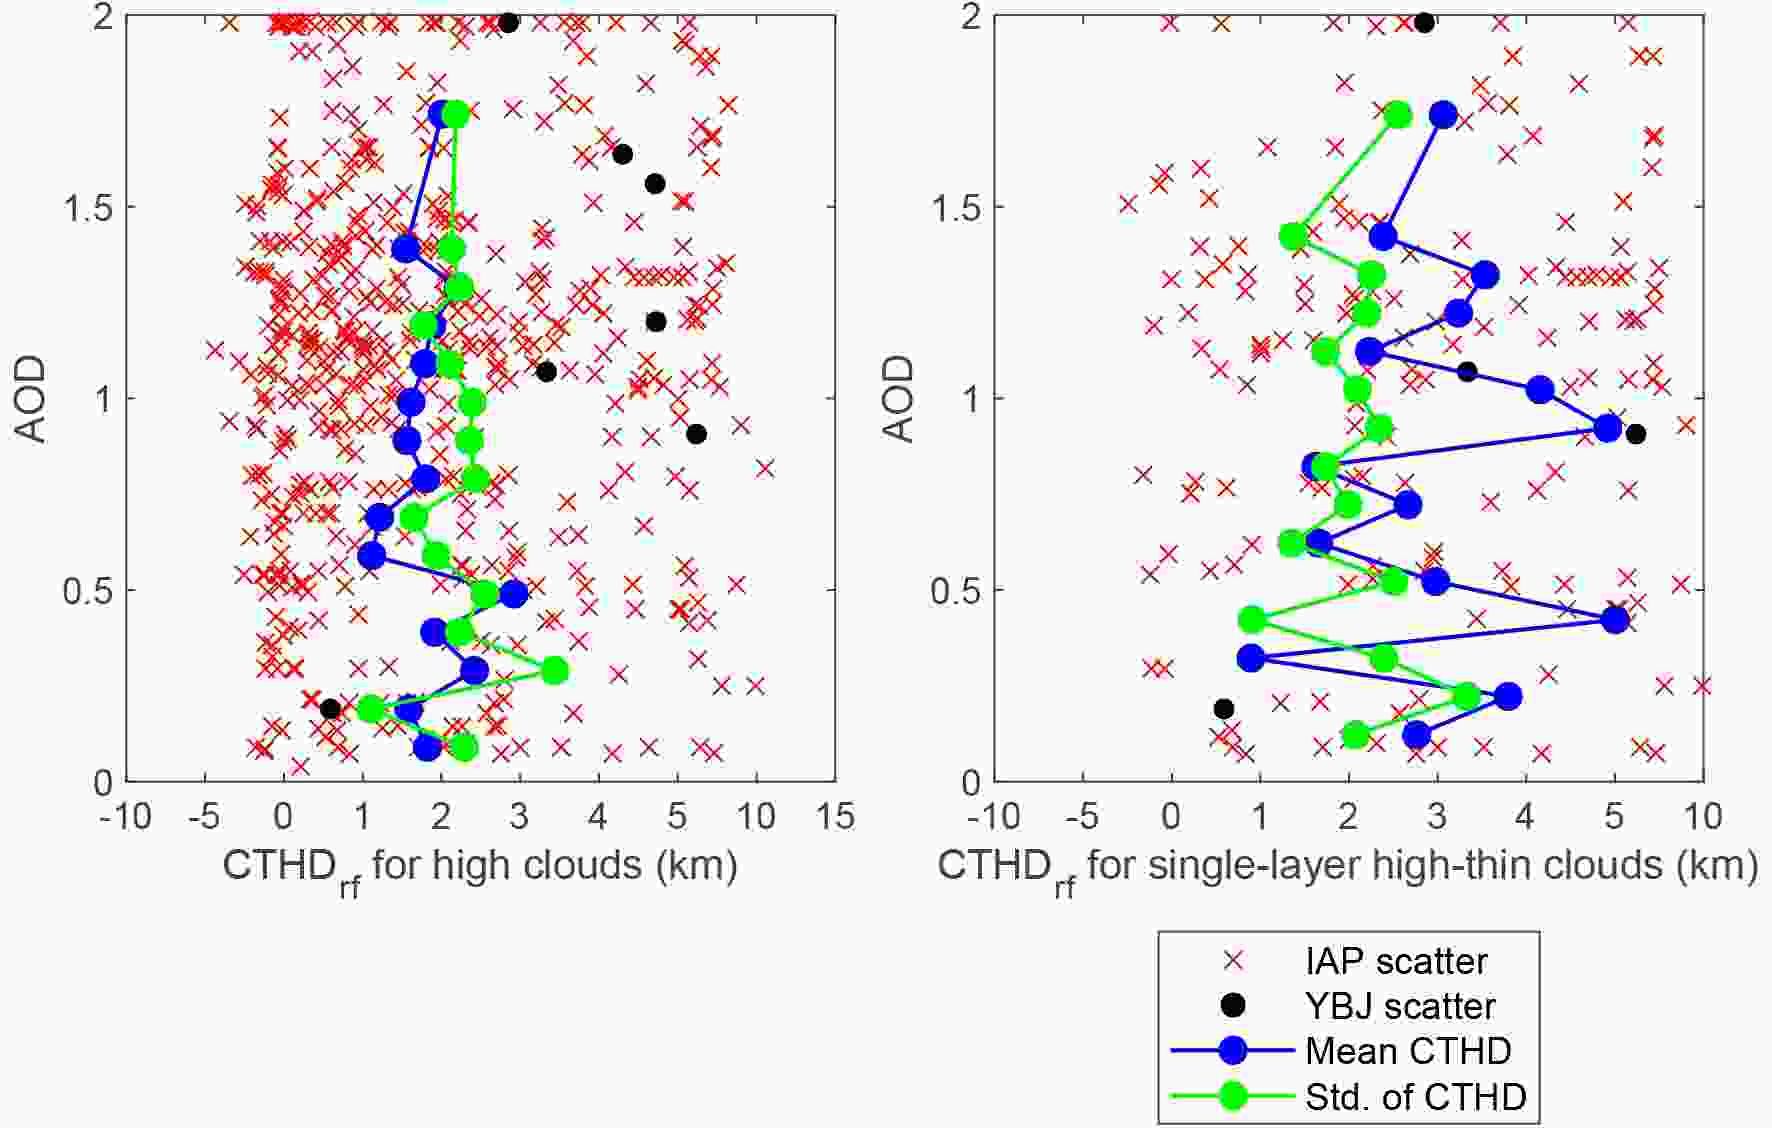 Figure7. (Continued)
2
4.3. Influence from surface temperature
The infrared radiation from the surface may pass through thin clouds and effectively increase the measured brightness temperature, which results in an underestimated CTH. Therefore, the stronger the surface radiation, the larger the brightness temperature the satellite obtains. Thus, the difference in surface radiation between the two sites may lead to the difference in CTH retrieval. Since the satellite observation of surface radiation will be affected by the presence of clouds (Gui et al., 2010), the influence of surface radiation was thus divided into two parts according to its nature: the influence of surface emissivity and the influence of surface temperature.During the study period, the average surface emissivity at IAP was 0.0079 smaller than that at YBJ and the difference between the two sites was very small. Thus, the influence from surface emissivity might be negligible. Figure 8 shows the hourly temperature and monthly mean temperature at IAP and YBJ. The surface temperature at IAP was 18.96 K higher, on average, than that at YBJ. The mean and STD of CTHDs at different surface temperatures were calculated. The results and the corresponding linear fittings are shown in Fig. 9. It can be seen that both the mean and STD of CTHDs gradually increase with the rise in surface temperature for Himawari-8 and FY-4A retrievals, for high clouds and single-layer high-thin clouds. Linear fittings of the mean and STD of CTHDs make this trend more significant. In particular, when the surface temperature exceeds 290 K, the mean CTHD of both satellites profoundly increases. It should be noted that the collocations with the temperature between 270 K and 290 K at IAP were lost due to the lack of radar data in March and April (see Fig. 9). The retrieval uncertainty for high-level clouds, when compared to the mid- or low-level clouds, will increase when more surface radiation is obtained by the satellite because the retrieved CTH might be spuriously placed closer to the surface, subsequently resulting in a larger CTHD. That is why high-level clouds show a larger CTHD than mid- or low-level clouds. Consequently, the difference in surface temperature may be an important factor causing the regional discrepancy between IAP and YBJ.
 Figure8. Hourly temperature and monthly mean temperature at the IAP and YBJ sites from February through August 2019.
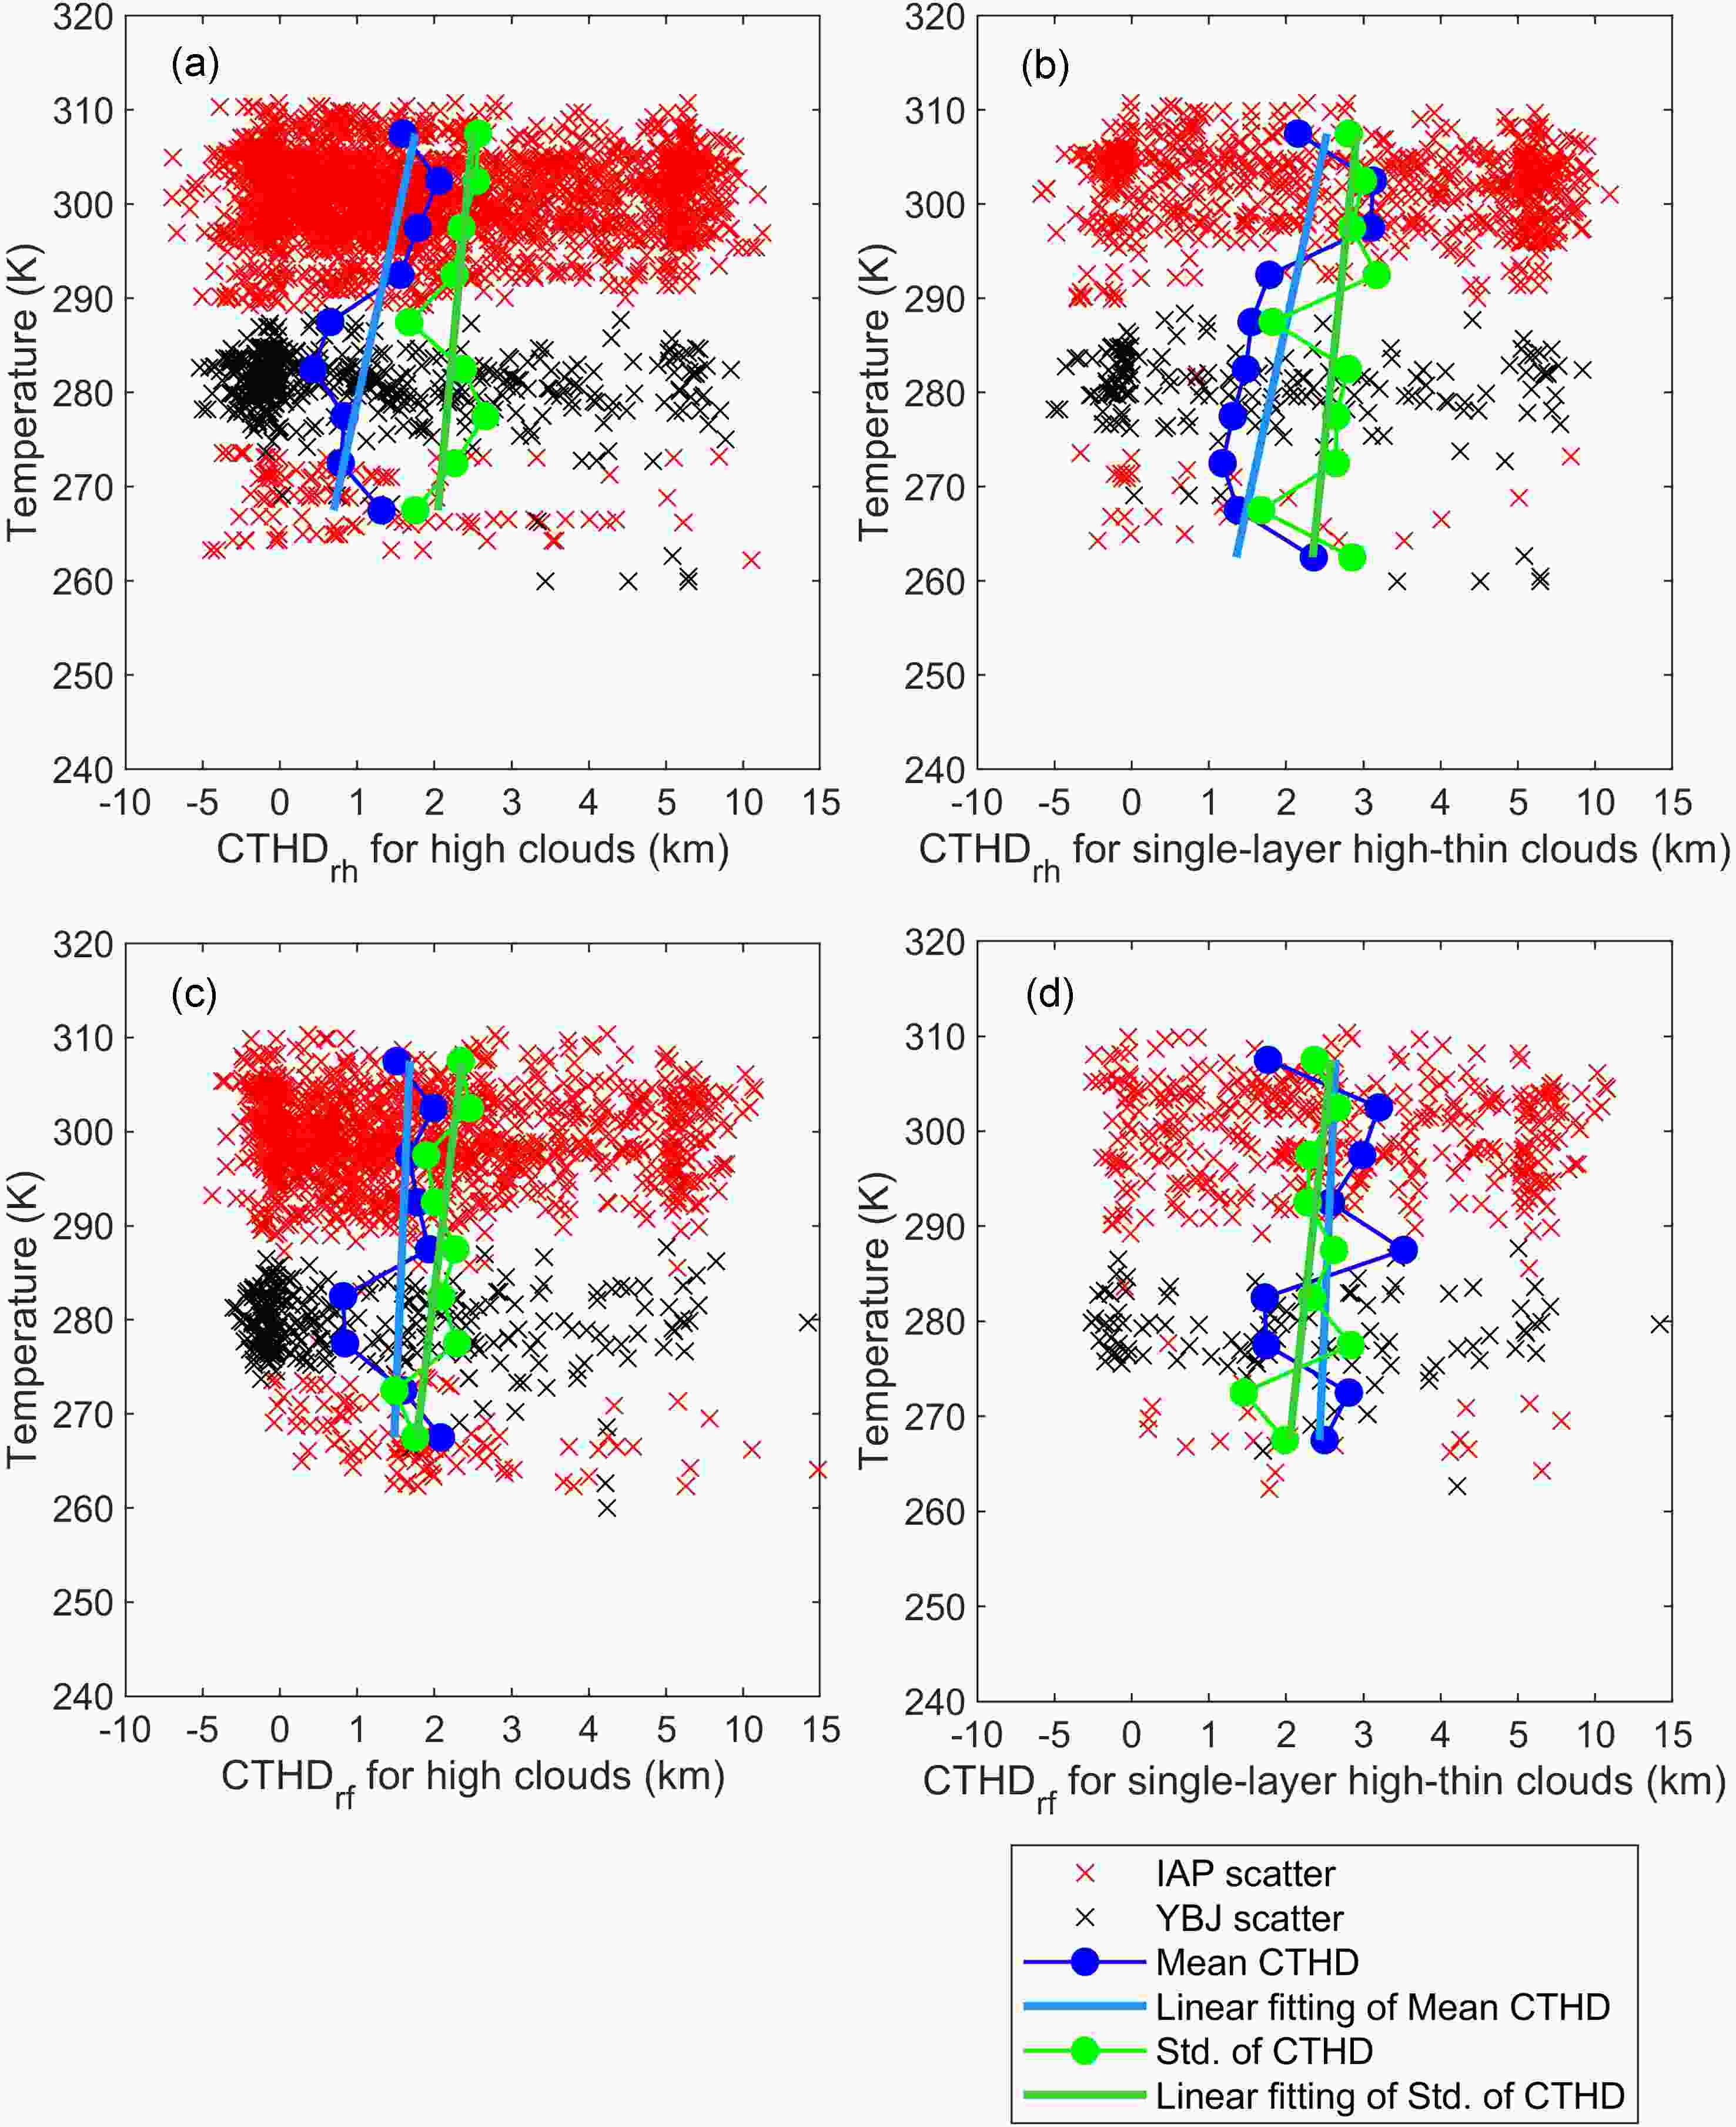 Figure9. As in Fig. 7 but for the relationship between surface temperature and the CTHD; the Dodger Blue line indicates the linear fitting of the mean CTHD and the Lime Green line indicates the linear fitting of the STD of the CTHD.
During the period, the average DAR of the IAP radar was 72.88%, and that of the YBJ radar was 95.15%. The average CTH and cloud depth at IAP were greater than those at YBJ. The errors in satellite CTH retrieval based on infrared remote sensing are mainly caused by instrument performance, the violation of the theoretical assumption that the cloud acts as a blackbody, the inherent errors in the radiative transfer model calculation, and the complexity of the underlying surface. This study did not consider the influences from instrument performance nor from calculation uncertainties in the radiative transformation model. It is known that the infrared radiance measured by the satellite is emitted from the surface and cloud, as well as the atmosphere below and above the cloud. This work investigated the influences of these factors upon retrieval uncertainties. It was found that the CTHD decreases as the cloud depth increases, while the CTHD has no obvious dependence on cloud layer nor cloud fraction.
Relative to the radar CTHs, at YBJ, the FY-4A and Himawari-8 CTHs were found to be underestimated by 0.06 ± 1.90 km and ?0.02 ± 2.40 km on average, respectively. However, their respective average discrepancies at IAP were 0.93 ± 2.24 km and 0.99 ± 2.37 km. IAP showed profoundly larger differences compared to YBJ, especially for high and thin clouds. Results from our analysis show that the satellite viewing geometry, the AOD, and the surface emissivity between the two sites are not the key factors causing the large discrepancy. On the contrary, the surface temperature may be an important factor. The surface infrared radiation could pass through thin clouds, causing the radiance measured by the satellite to become larger and the cloud-top temperature to be overestimated, thus underestimating the CTH. In the case of very small differences in surface emissivity, the magnitude of the surface radiation is determined by the surface temperature. The surface temperature at IAP is higher than that at YBJ, so the error in satellite radiance at IAP is therefore greater than that at YBJ, resulting in larger errors in CTH retrieval at IAP. Therefore, it can be concluded that the CTH retrieval algorithm demonstrates different retrieval accuracy in different regions, which is associated with the local atmospheric, surface, and cloud properties. Consequently, retrieval discrepancies among regions should not be neglected.
Even though FY-4A and Himawari-8 present similar CTH retrieval accuracies, they show distinctly different capabilities in detecting clouds at night; that is, Himawari-8 neglects some clouds. This might be attributable to the different viewing geometry and the more rigorous cloud detection algorithm of Himawari-8. During the daytime, the difference in cloud detection between the two satellites is not significant because of the addition of visible-band information. At night, only the infrared-band observation is available. As explained in section 4.1, compared with FY-4A, the two stations, especially YBJ, are farther away from the sub-satellite point of Himawari-8. This longer distance results in a greater contribution from the path accumulation to the radiance observed by the satellite which causes an overestimation of the infrared brightness temperature, which, in turn, increases the difficulty in distinguishing the cloud from the surface.
The comparative results show that thin clouds remain the biggest challenge for the two satellites, although both Himawari-8 and FY-4A have taken special measures—for example, Himawari-8 combines the use of the intercept method and interpolation method. FY-4A utilizes a special approach to deal with multi-layer clouds, but from the current comparisons, this approach does not display any obvious advantage when compared with Himawari-8. As for the satellite CTH retrieval algorithm, improving the cloud detection ability, the accuracy of real-time surface temperature data, and the ability to estimate surface thermal infrared radiance, are conducive to accelerating progress regarding the retrieval accuracy of CTH.
Acknowledgements. We would like to thank the National Satellite Meteorological Center of the China Meteorological Administration and the P-Tree System of the Japan Aerospace Exploration Agency for providing support with the observational data. We appreciate the NASA Aqua/Terra MODIS team and ECMWF ERA5 science team for generously sharing those data. We appreciate many contributors from our radar science team, especially, Mr. Yongheng BI and Prof. Shu DUAN, who made our research possible. This work was funded by the National Natural Science Foundation of China (Grant Nos. 41775032 and 41275040).
