HTML
--> --> -->Clouds play a crucial role in regulating Earth’s radiation budget. They cool the planet by reflecting incoming solar radiation and warm it by trapping outgoing infrared radiation. In our present climate, the net effect of clouds is to reduce the net [longwave (LW) + shortwave (SW)] radiation flux at the top of the atmosphere (TOA) by ~20 W m?2. As the climate warms, if cloud changes reduce net incoming energy, this will partially offset warming, resulting in a feedback process from clouds that is negative; if cloud changes increase net incoming energy, this will amplify initial warming, resulting in positive cloud feedback (Dessler, 2010). The long-term cloud feedback is caused by anthropogenic climate change, and short-term feedback calculated using a short-term record is driven by interannual climate variability. Recently, climate models and observational records have both been used to estimate cloud feedback. However, the coarse grids of climate models cannot sufficiently represent the small-scale physical processes of clouds (Ceppi et al., 2017). Moreover, the observational records of clouds are short, so it is impossible to monitor any long-term trend in clouds or provide any effective constraint on the level of their long-term feedback (Dessler, 2010; Dessler and Loeb, 2013; Zhou et al., 2015; Yue et al., 2017). Considering the inaccuracy of climate models and the short time scale of observational records, we have estimated the short-term cloud feedback using observational data in this paper, which can help to assess and improve the ability of models to simulate it and then better understand long-term feedback through the strong correlations between long- and short-term processes (Zhou et al., 2015; Colman and Hanson, 2017).
Recently, the radiative kernel method (Held and Soden, 2000; Soden and Held, 2006) has been widely used to estimate climate feedback. Zelinka et al. (2012a) proposed quantifying long-term cloud feedback using cloud radiative kernels combined with cloud fraction changes. The kernels were calculated via the Fu?Liou radiative transfer scheme (Fu and Liou, 1992), and the fraction changes from the International Satellite Cloud Climatology Project (ISCCP) cloud simulator output (Klein and Jakob, 1999; Webb et al., 2001). This showed that the global mean LW feedback has a value of 0.21 W m?2 K?1, and SW a value of 0.37 W m?2 K?1; the net value is 0.57 W m?2 K?1. The radiative kernel method can not only calculate the feedback of different cloud types but can also attribute feedback to changes in cloud amount, cloud top pressure (CTP), and cloud optical thickness (COT) (Zelinka et al., 2012b). Zhou et al. (2013b) obtained values for global mean LW, SW, and net short-term feedback of ?0.46 ± 0.74, 0.30 ± 1.10, and ?0.16 ± 0.83 W m?2 K?1, respectively, using cloud radiative kernels and MODIS observations from March 2000 to February 2010. They found that the spatial distribution of global short-term cloud feedback agrees well with that calculated by Dessler (2013) using different satellite data and a different method, which indicates that using kernels and observations to calculate short-term feedback is reliable. Furthermore, Zhou et al. (2014) estimated global short-term cirrus feedback (0.2 ± 0.21 W m?2 K?1) using cloud radiative kernels and observations from the CALIOP instrument (Cloud?Aerosol Lidar with Orthogonal Polarization) on board the CALIPSO (Cloud?Aerosol Lidar and Infrared Pathfinder Satellite Observation) satellite from December 2007 to February 2014. They concluded that cirrus feedback is primarily driven by the increasing cloud fraction in the tropical tropopause and upper troposphere. Ceppi et al. (2016) used kernels and a variety of satellite observations to show that short-term SW cloud feedback in the mid to high latitudes is negative, mainly due to optical thickening. Yue et al. (2016) calculated LW cloud radiative kernels based entirely on multiple observational data, and then Yue et al. (2019) analyzed the temporal and spatial characteristics of global and local short-term cloud feedback.
East Asia is located in the Asian monsoon region, where climate changes are sensitive and cloud feedback processes are complicated. Cloud radiative forcing in the East Asian monsoon region has unique characteristics (Yu et al., 2001), and the current deviation and uncertainty in simulating the radiation budget and cloud radiative forcing in East Asia are all related to the process of cloud radiation and its feedback (Wang et al., 2014), which will largely constrain our understanding of climate change in East Asia using climate models. Using observational data to study short-term cloud feedback in East Asia can provide an observational constraint on long-term feedback there, and thus help to assess the contribution of cloud feedback to climate sensitivity.
In this study, short-term cloud feedback in East Asia was quantitatively studied using the cloud radiative kernels built by BCC_RAD (Beijing Climate Center radiative transfer model) (Zhang, 2016) combined with MODIS observations from July 2002 to June 2018. The spatial distribution and seasonal variation of feedback processes by different cloud types were analyzed definitively. Moreover, the feedback process was decomposed into contributions from changes in cloud fraction, CTP, and COT. Section 2 describes the data and methods used in this study. Section 3 provides the analysis and discussion, and section 4 is a summary of the findings.
with units of W m?2 K?1, and where


with units of W m?2. The short-term feedback can be calculated by regressing the time series of


The first step in estimating short-term cloud feedback is to determine


Calculation of

with units of W m?2 %?1. The method for calculating K was proposed by Zelinka et al. (2012a) and was updated in this paper by replacing Fu?Liou with the BCC_RAD radiative transfer code. After the calculation of kernels, we interpolated the SW kernels to each grid using monthly climatological clear-sky surface albedos calculated via the clear-sky surface upward and downward SW fluxes from the CERES (Clouds and the Earth’s Radiant Energy System) data (Loeb et al., 2009). In Figs. 1a, d and g, we show the regional and annual mean cloud radiative kernels in East Asia. The positive LW kernels describe the ability of clouds to absorb LW radiation, and the negative SW kernels represent their ability to reflect SW radiation. The net kernels are the sum of LW and SW kernels, and they show that the thin clouds in high layers can effectively trap the outgoing infrared radiation, and the thick clouds in lower layers can strongly send back solar radiation to space.
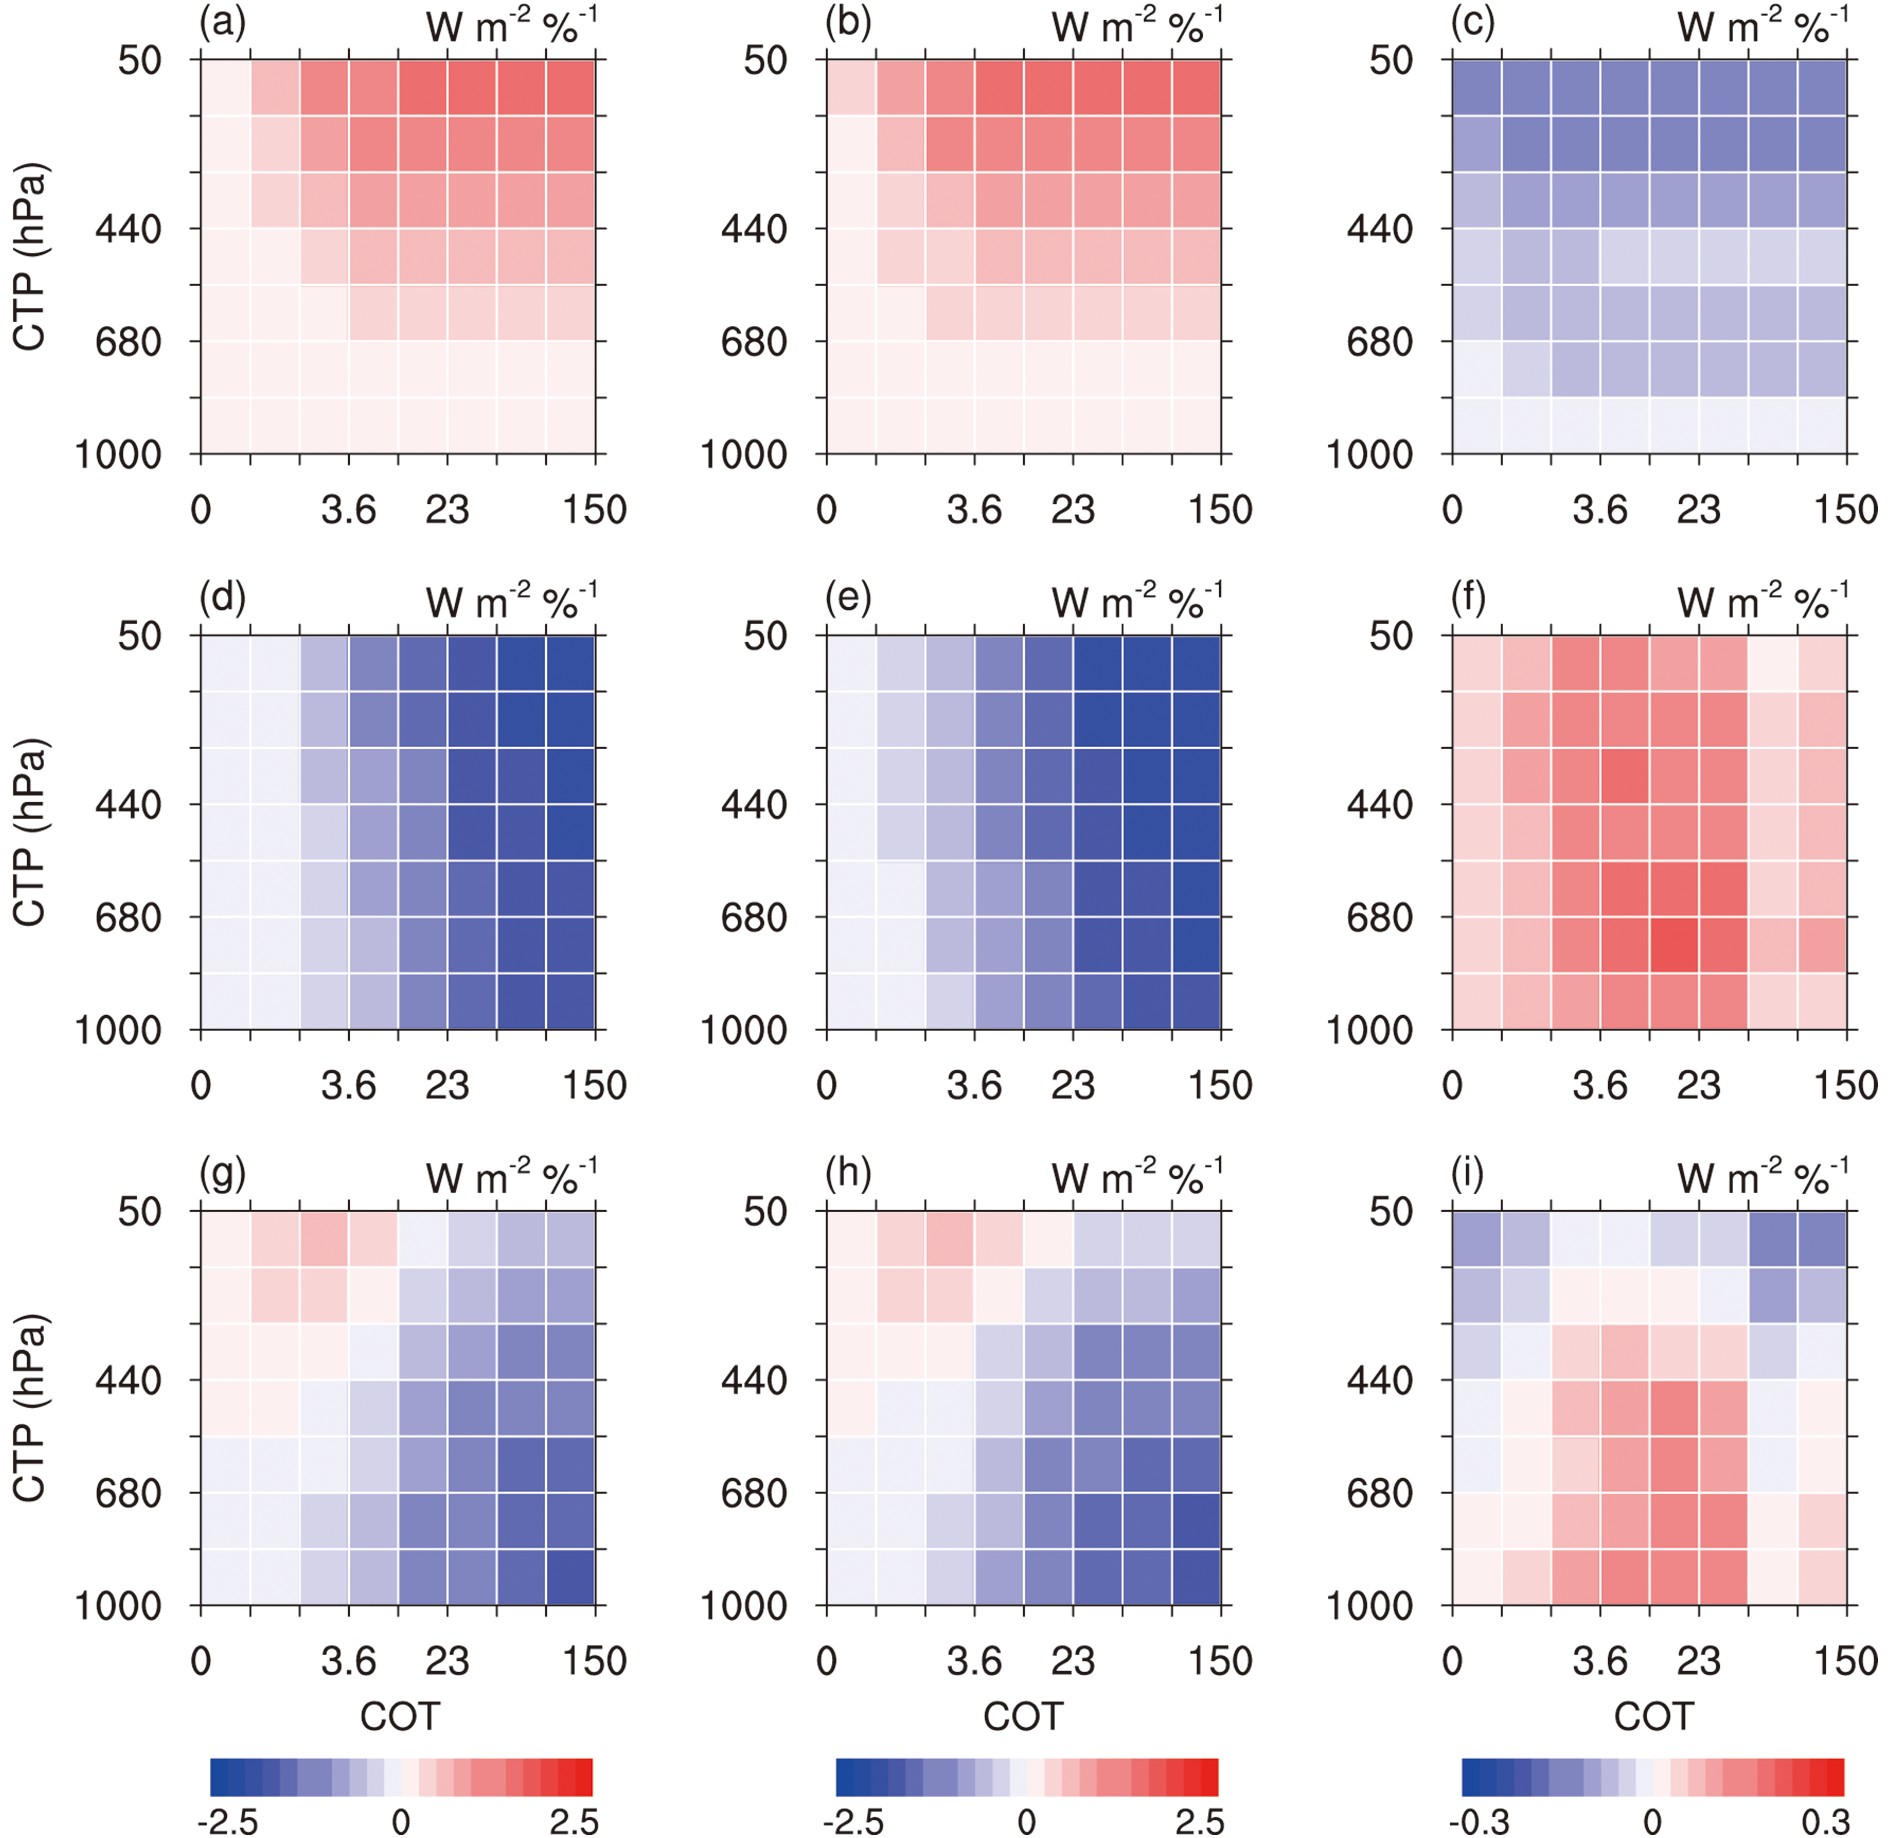 Figure1. Regional and annual mean cloud radiative kernels in East Asia calculated by (a, d, g) BCC_RAD, (b, e, h) Fu?Liou, and (c, f, i) the difference (BCC_RAD minus Fu?Liou): the (a?c) longwave, (d?f) shortwave, and (g?i) net components of cloud radiative kernels. The Fu-Liou kernels were from Zelinka et al. (2012a).
Figure 1 also compares the BCC_RAD and Fu?Liou kernels, and the latter were from Zelinka et al. (2012a). The kernel in each CTP?COT bin calculated by different radiative transfer models agrees well with each other, but the intensities of LW and SW kernels by BCC_RAD are both weaker than those by Fu?Liou, with the difference in each bin ranging only from ?0.16 to 0.22 W m?2 %?1. Compared with the net kernels by Fu?Liou, the net kernels by BCC_RAD show smaller magnitudes for thin (COT < 3.6) and thick clouds (COT > 23) above 440 hPa and larger magnitudes for medium-thickness clouds (3.6 < COT < 23) below 440 hPa. The differences between the two sets of kernels arise from both differences in the atmospheric profiles and differences in the radiative transfer models. Instead of model-mean atmospheric profiles, we used zonal and monthly mean temperature, humidity, pressure, and ozone profiles from the ECMWF’s interim reanalysis (ERA-Interim) over the period July 2002 to June 2018 (Dee et al., 2011) as the input to the radiative transfer code. In addition, the replacement of the radiative transfer model is a vital contributor to the differences in kernels. In BCC_RAD, gas absorption and overlap were calculated using the correlated K-distribution method (Zhang et al., 2003); optical properties of water clouds and ice clouds were given by Lu et al. (2011) and Zhang et al. (2015), respectively; optical properties of aerosols were given by Wei and Zhang (2011) and Zhou et al. (2013a); the cloud vertical overlap was dealt with via the semi-random method; and a two-stream approximation algorithm was selected for radiative transfer (Nakajima et al., 2000). Cloud observations were from the MYD08_M3 product (Platnick et al., 2017), provided by MODIS on board NASA’s Aqua satellite (Parkinson, 2003), with a resolution of 1° × 1°. This product contains monthly mean cloud fractions of different cloud types, partitioned by CTP and COT. It is notable that applying the kernels built by a radiative transfer model to MODIS cloud observations may introduce uncertainty because MODIS may misclassify cloud types and the CTP retrieved by MODIS may not correspond with the kernels (Zhou et al., 2013b; Yue et al., 2016). The inconsistency between kernels and cloud observations primarily affects the accuracy of LW cloud feedback (Zhou et al., 2013b).
Different cloud types have distinct LW and SW radiative effects, which leads to a wide range of cloud feedback in different climate models (Williams and Webb, 2009; Zelinka et al., 2012a); thus, it is necessary to analyze feedback from different cloud types. In this study, clouds were divided into nine types of clouds (Table 1) according to the cloud classification method provided by the ISCCP dataset (Rossow and Schiffer, 1999): cirrus, cirrostratus, deep convective cloud, altocumulus, altostratus, nimbostratus, cumulus, stratocumulus, and stratus.
| CTP (hPa) | COT | ||
| 0?3.6 | 3.6?23 | 23?150 | |
| 50?440 | Cirrus | Cirrostratus | Deep convective cloud |
| 440?680 | Altocumulus | Altostratus | Nimbostratus |
| 680?1000 | Cumulus | Stratocumulus | Stratus |
Table1. Nine cloud types partitioned by cloud top pressure (CTP) and cloud optical thickness (COT).
Figure 2 shows the subregions of East Asia. To analyze the spatial distribution characteristics of cloud feedback, we selected three subregions: the Tibetan Plateau (TP), northwest (NW), and monsoon regions, based on surface properties. TP is mainly a plateau, and NW mainly a desert. Furthermore, the monsoon subregion was divided into temperate monsoon (TM) and subtropical monsoon (SM) subregions based on monsoon types. Considering the land?sea discrepancy, we split SM into SM land and SM ocean.
 Figure2. Four subregions selected in East Asia: the Tibetan Plateau (TP), northwest (NW), temperate monsoon (TM), and subtropical monsoon (SM).
To determine the contributions of changes in cloud amount, CTP, and COT to feedback, we decomposed the feedback processes into cloud amount, altitude, optical depth, and residual terms for all clouds and for those at high (CTP < 440 hPa), mid (440 < CTP < 680 hPa), and low levels (CTP > 680 hPa) following the method proposed by Zelinka et al. (2012b) and updated by Zelinka et al. (2016). The amount feedback represents the feedback arising from the changes in total cloud fraction with the relative proportions of cloud fractions in each CTP?COT bin held fixed. The altitude feedback is the feedback arising from the changes in CTP with total cloud fraction and COT held fixed. The optical depth feedback is the feedback arising from the changes in COT with total cloud fraction and CTP held fixed.
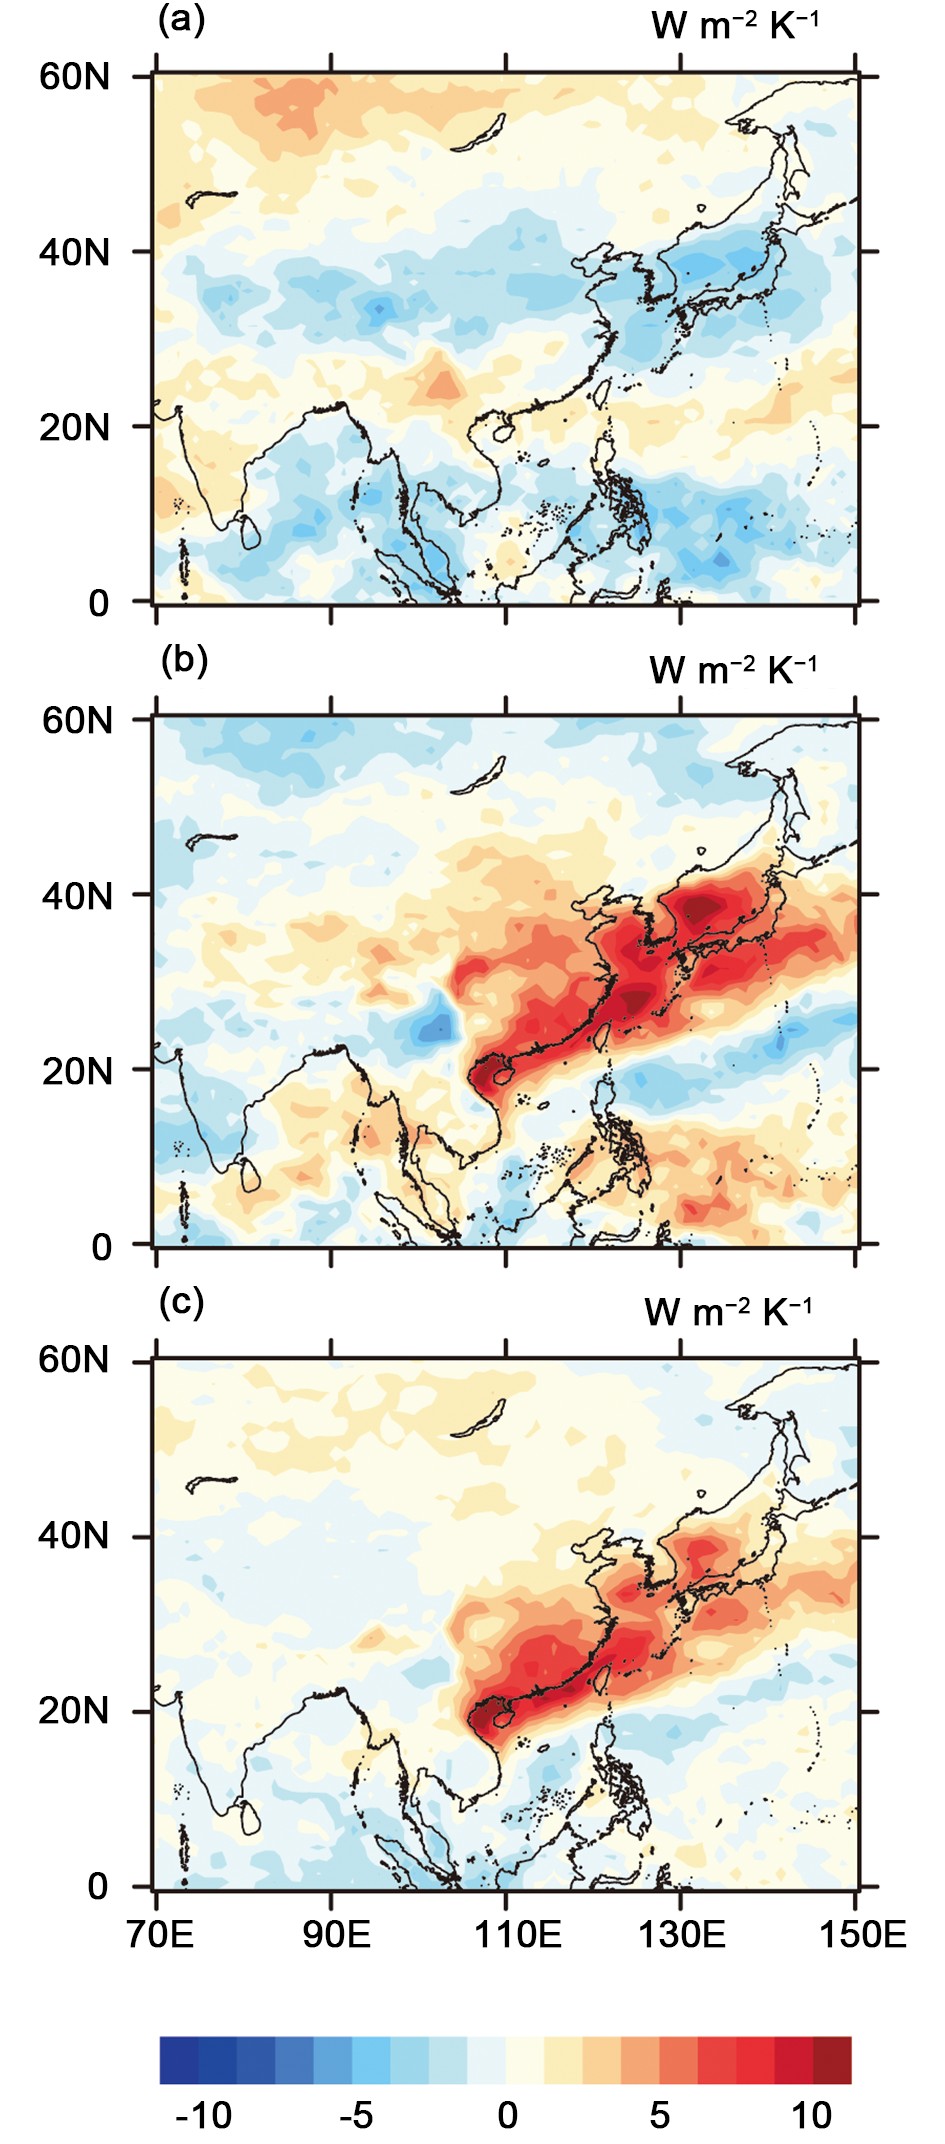 Figure3. Spatial distribution of short-term (a) longwave, (b) shortwave, and (c) net cloud feedback in East Asia.
2
3.1. Spatial distribution of cloud feedback by different cloud types
Figure 4 shows the spatial distribution of cloud feedback by different cloud types. Cirrus feedback is negative and mainly occurs over the oceans between 0° and 20°N. The spatial distributions of cirrostratus and deep convective cloud feedback are similar, but the strength of feedback is quite different in that the positive feedback of deep convective cloud is strong in eastern China and over the nearby oceans. The feedback of altocumulus and cumulus is almost zero because of the small value of K for these two cloud types, which are classified as thin clouds in the middle and lower layers. The feedback of altostratus, nimbostratus, stratocumulus, and stratus mainly occurs in eastern and southern China and surrounding waters. Short-term feedback in East Asia primarily comes from the contributions of nimbostratus and stratus.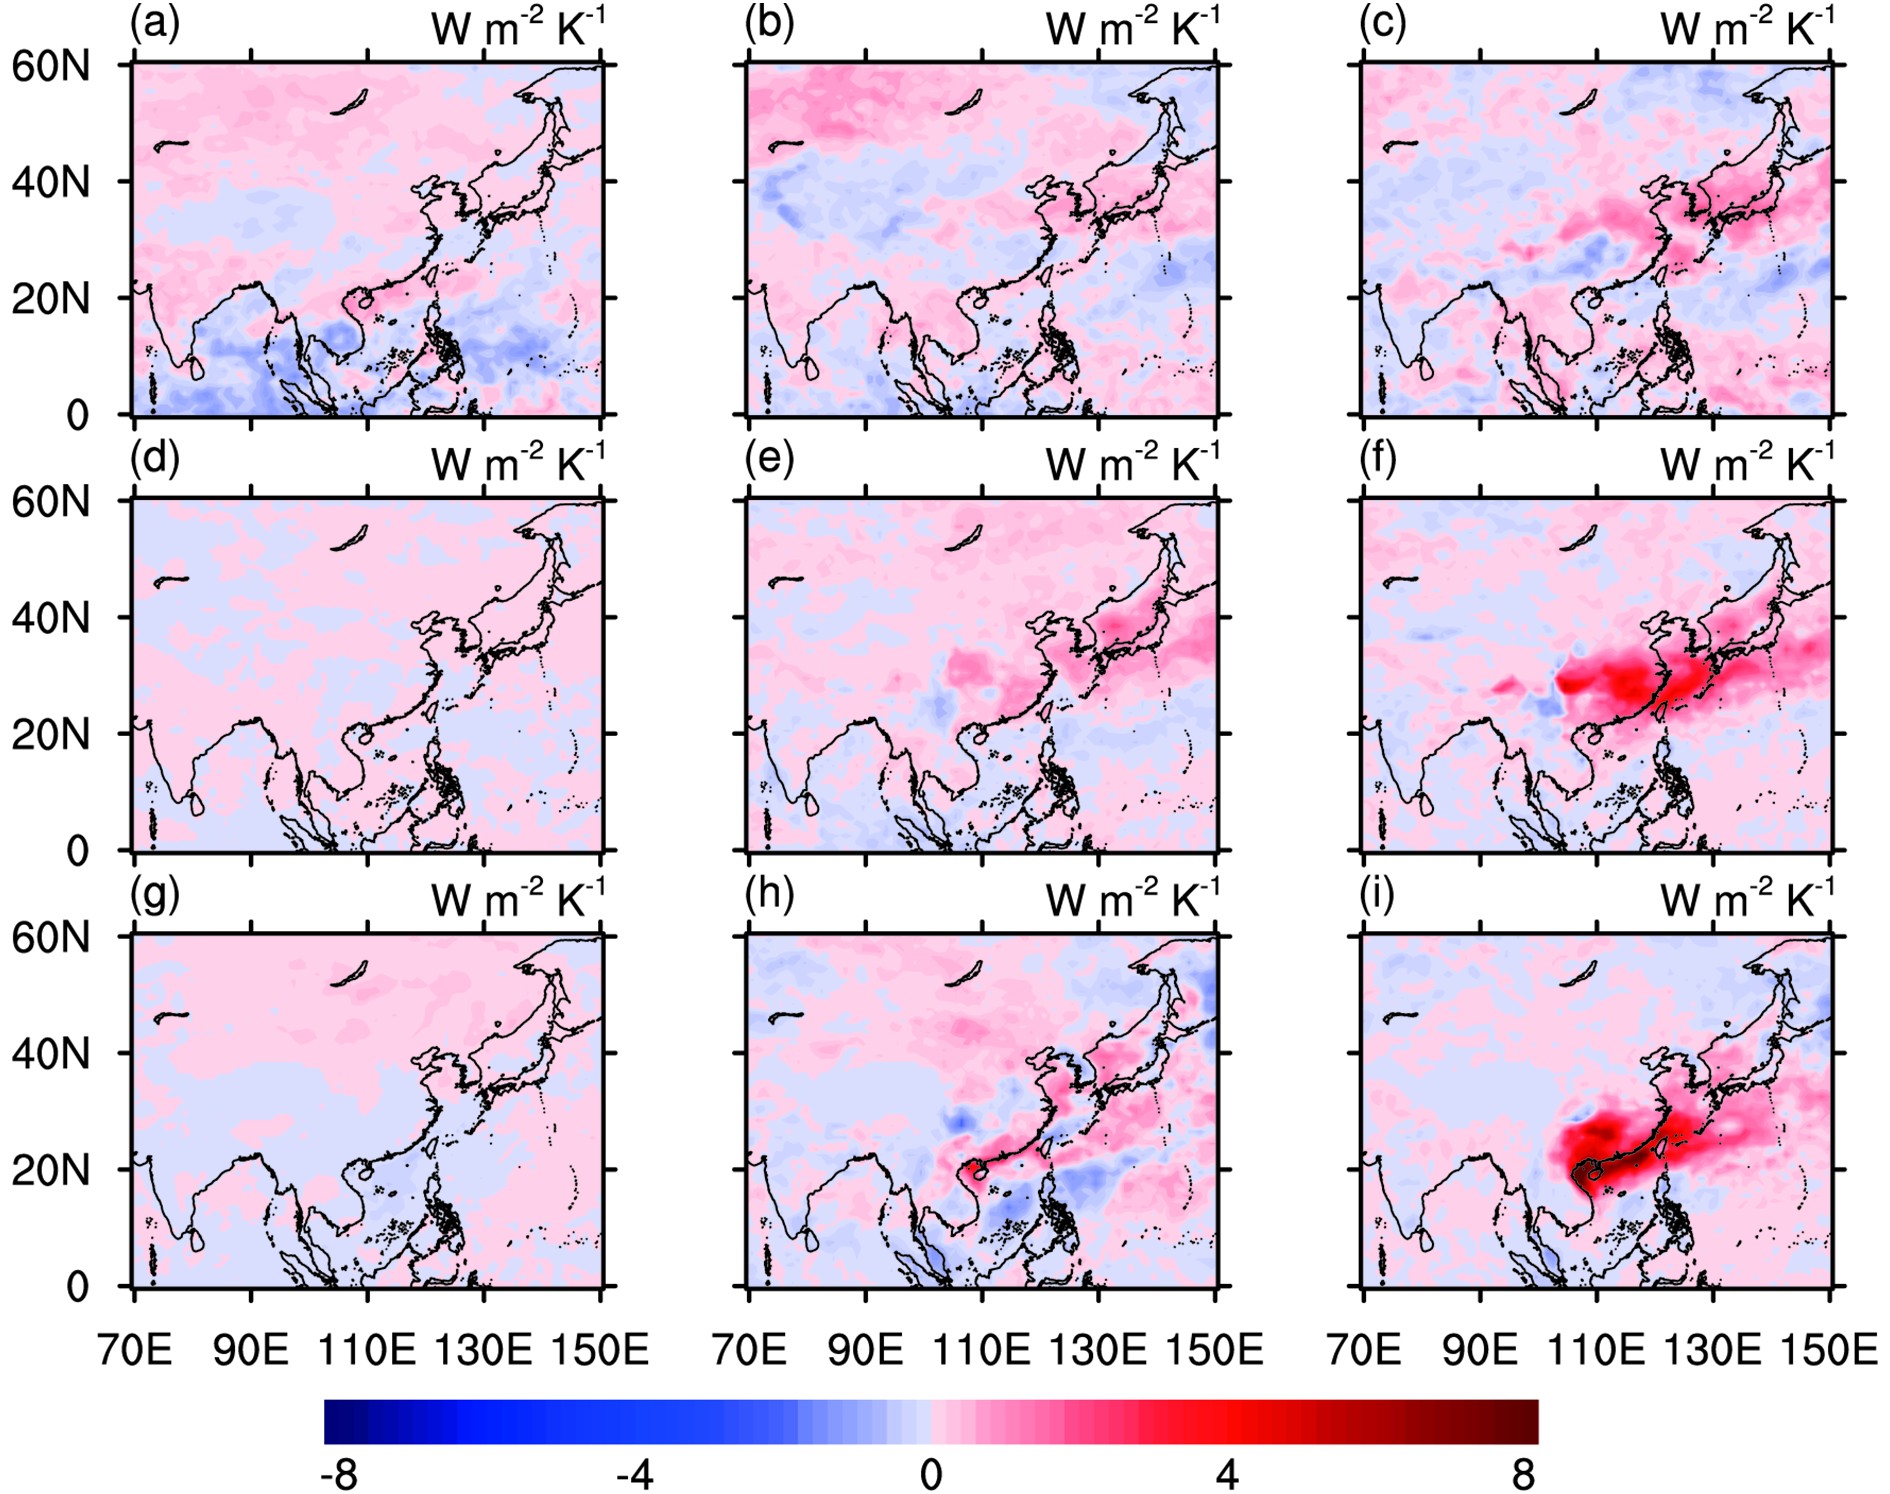 Figure4. Spatial distribution of (a) cirrus, (b) cirrostratus, (c) deep convective cloud, (d) altocumulus, (e) altostratus, (f) nimbostratus, (g) cumulus, (h) stratocumulus, and (i) stratus feedback.
Tables 2 and 3 show the regional average cloud feedback and cloud fraction responses by different cloud types in the subregions of East Asia, respectively. The cloud fraction response is the change in cloud amount in response to changes in surface temperature, and feedback is the product of K and cloud fraction response. The cloud feedback in TP is very weak (?0.15 W m?2 K?1) and it is primarily cirrostratus feedback (?0.21 W m?2 K?1). With relatively weak reflection of SW radiation and strong absorption of LW radiation, the decrease of cirrostratus amount in TP causes a weak negative feedback. The average feedback in NW is 0.58 W m?2 K?1, with the greatest contribution coming from stratocumulus (0.18 W m?2 K?1). As a medium-thickness cloud in the lower layer, stratocumulus reflects solar radiation strongly, so the decrease in cloud fraction leads to positive feedback. Unlike the feedback, the cloud fraction response in NW mainly comes from cumulus. Cumulus, classified as thin cloud in the lower layer, absorbs and reflects radiation weakly; thus, cumulus feedback is quite small. The average feedback in TM is 1.37 W m?2 K?1, and its main contributions are from deep convective cloud (0.30 W m?2 K?1) and nimbostratus (0.32 W m?2 K?1). These two thick clouds both reflect solar radiation intensively, so the decrease in cloud fraction leads to positive feedback. The average cloud feedback in SM is much stronger than that in the other three subregions. The feedback in SM land and SM ocean is 3.41 and 3.51 W m?2 K?1, respectively, both primarily from the contributions of nimbostratus and stratus owing to their drastic cloud fraction responses and strong reflection of SW radiation.
| Cloud feedback | TP | NW | TM | SM | |
| Land | Ocean | ||||
| Cirrus | ?0.06 | 0.14* | 0.06 | 0.05 | 0.01 |
| Cirrostratus | ?0.21 | 0.03 | 0.16 | 0.06 | 0.07 |
| Deep convective cloud | ?0.05 | ?0.02 | 0.30 | 0.25 | 0.26 |
| Altocumulus | 0.00 | 0.00 | 0.02* | 0.00 | 0.01* |
| Altostratus | 0.09 | 0.10 | 0.26* | 0.28* | 0.20* |
| Nimbostratus | 0.07 | 0.04 | 0.32* | 1.19* | 1.01* |
| Cumulus | 0.01 | 0.10* | 0.09* | ?0.04* | ?0.07* |
| Stratocumulus | ?0.03 | 0.18* | 0.12 | 0.12 | 0.27 |
| Stratus | 0.03 | 0.01 | 0.05 | 1.50* | 1.74* |
| Total | ?0.15 | 0.58* | 1.37* | 3.41* | 3.51* |
| *Significance > 95% | |||||
Table2. Average cloud feedback (W m?2 K?1) of different cloud types in the subregions of East Asia.
| Cloud fraction response | TP | NW | TM | SM | |
| Land | Ocean | ||||
| Cirrus | ?0.26 | 0.44* | 0.19 | 0.12 | 0.11 |
| Cirrostratus | ?1.33* | ?0.18 | ?0.66* | 0.29 | 0.03 |
| Deep convective cloud | ?0.16 | 0.03 | ?0.36* | ?0.14 | ?0.27 |
| Altocumulus | ?0.07 | ?0.23* | ?0.09 | 0.01 | ?0.01 |
| Altostratus | ?0.17 | ?0.22* | ?0.34* | ?0.32 | ?0.32* |
| Nimbostratus | ?0.06 | 0.01 | ?0.31* | ?1.10* | ?0.93* |
| Cumulus | ?0.06 | ?0.70* | ?0.59* | 0.18* | 0.26* |
| Stratocumulus | 0.03 | ?0.37* | ?0.14 | ?0.08 | ?0.21 |
| Stratus | ?0.03 | 0.03 | ?0.01 | ?1.18* | ?1.19* |
| Total | ?2.11* | ?1.19* | ?2.03* | ?2.23* | ?2.52* |
| *Significance > 95% | |||||
Table3. Average cloud fraction responses (% K?1) of different cloud types in the subregions of East Asia.
The total cloud fractions in all subregions show significant decreases (Table 3). The average cloud fraction responses to East Asian surface temperature anomalies in TP, NW, TM, SM land, and SM ocean are ?2.11, ?1.19, ?2.03, ?2.23, and ?2.52% K?1, respectively. However, the cloud feedback in TP and NW is very weak because of the small value of K for the dominant clouds in these two subregions.
2
3.2. Seasonal variation in cloud feedback by different cloud types
Figures 5a, d, g and j show that seasonal variation in cloud feedback is very significant in East Asia and that the feedback in all four seasons is dominated by positive feedback. The average feedback values in spring, summer, autumn, and winter are 1.37, 2.07, 0.73, and 0.04 W m?2 K?1, respectively. In spring, the feedback is very strong and positive over the oceans around eastern China. In summer, positive feedback is widely distributed and is strongest over the Yellow Sea and Sea of Japan. In autumn, feedback is quite positive in southern China and over the nearby oceans. In winter, feedback in most regions is very low, except for strong positive feedback in southern China.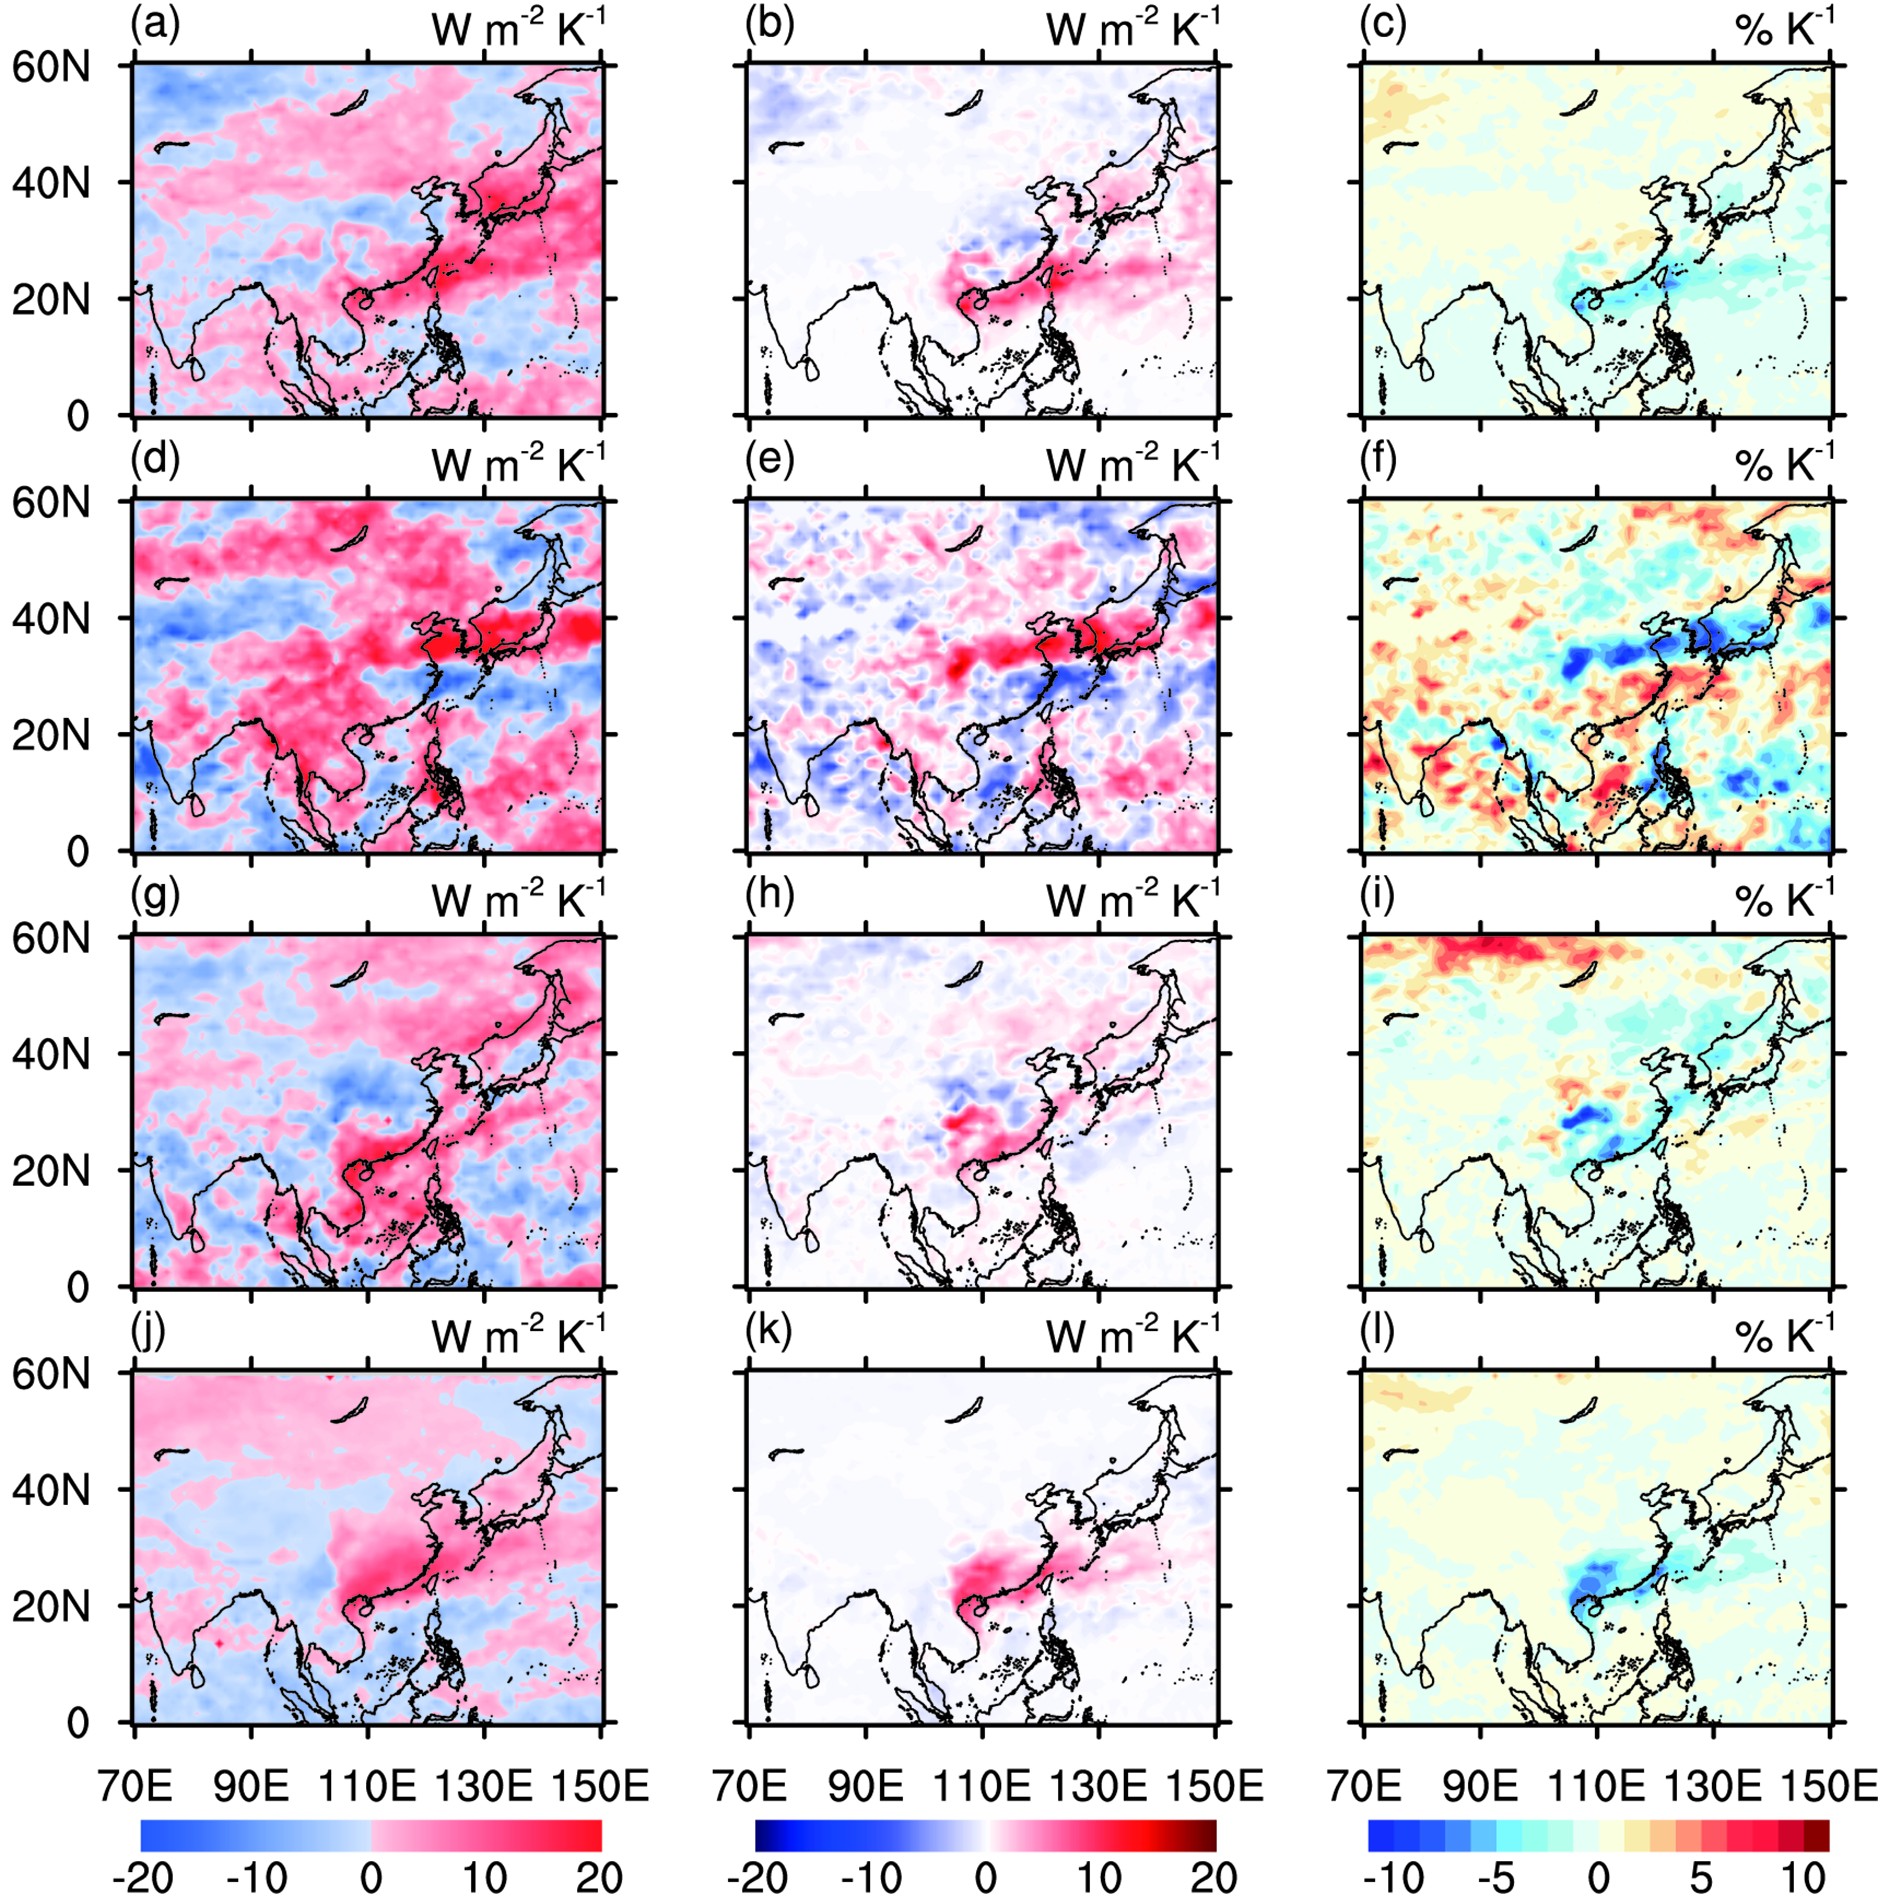 Figure5. Cloud feedback (units: W m?2 K?1) in (a) spring, (d) summer, (g) autumn, and (j) winter. Stratus (b) feedback (units: W m?2 K?1) and (c) response (units:% K?1) in spring; deep convective cloud (e) feedback and (f) response in summer; nimbostratus (h) feedback and (i) response in autumn; stratus (k) feedback and (l) response in winter.
Among the four subregions of East Asia, the cloud feedback in the East Asian monsoon subregion is the strongest during all seasons, which implies that monsoon activities have a significant effect on short-term feedback. The strongest feedback in spring, autumn, and winter occurs in SM, and the strongest in summer occurs in TM. In spring, the feedback in SM has a value of 5.22 W m?2 K?1, mainly due to marine stratus (3.11 W m?2 K?1) located over the oceans around southern China (Fig. 5b). Subtropical oceans are mainly covered with marine stratus (IPCC, 2014), so the negative cloud fraction response of stratus (Fig. 5c) results in positive feedback. In summer, the cloud feedback value in TM is 6.41 W m?2 K?1, with its greatest contribution from deep convective cloud (2.75 W m?2 K?1). The strong convection caused by the summer monsoon is favorable to changes in deep convective clouds, and the cloud fraction of these clouds changes dramatically (Fig. 5f), resulting in strong feedback (Fig. 5e). In autumn, feedback is strongest in SM (2.35 W m?2 K?1) and is mainly caused by land nimbostratus (1.65 W m?2 K?1) located in southern China (Fig. 5h). The nimbostratus amount decreases in response to internal climate variability (Fig. 5i), so its feedback is positive. In winter, the feedback value in SM is 3.15 W m?2 K?1, primarily from the contribution of land stratus (1.93 W m?2 K?1) located in southern China (Fig. 5k). The negative fraction response of stratus (Fig. 5l) leads to positive cloud feedback.
2
3.3. Decomposition of cloud feedback
Cloud feedback can be attributed to changes in three cloud properties: cloud fraction, CTP, and COT. Changes in cloud fraction at different altitudes are controlled by different physical processes, and changes in total cloud fraction are usually only residuals of cloud fraction responses at different altitudes (Zelinka et al., 2016). Therefore, we separately decomposed the feedback processes for all clouds, high clouds (CTP < 440 hPa), mid-level clouds (440 < CTP < 680 hPa), and low clouds (CTP > 680 hPa). Figure 6 shows this decomposition of cloud feedback processes. In East Asia, the feedback (0.66 W m?2 K?1) is mainly amount feedback (0.41 W m?2 K?1) and optical depth feedback (0.22 W m?2 K?1). Amount feedback is mainly caused by mid-level (0.31 W m?2 K?1) and low clouds (0.21 W m?2 K?1), and optical depth feedback is mainly caused by low clouds (0.12 W m?2 K?1). We also found that the feedback in NW is primarily from the positive amount feedback of low clouds, and in TM and SM it is mainly from the positive amount feedback of mid-level clouds, while in TP it chiefly comes from the negative amount feedback of high clouds.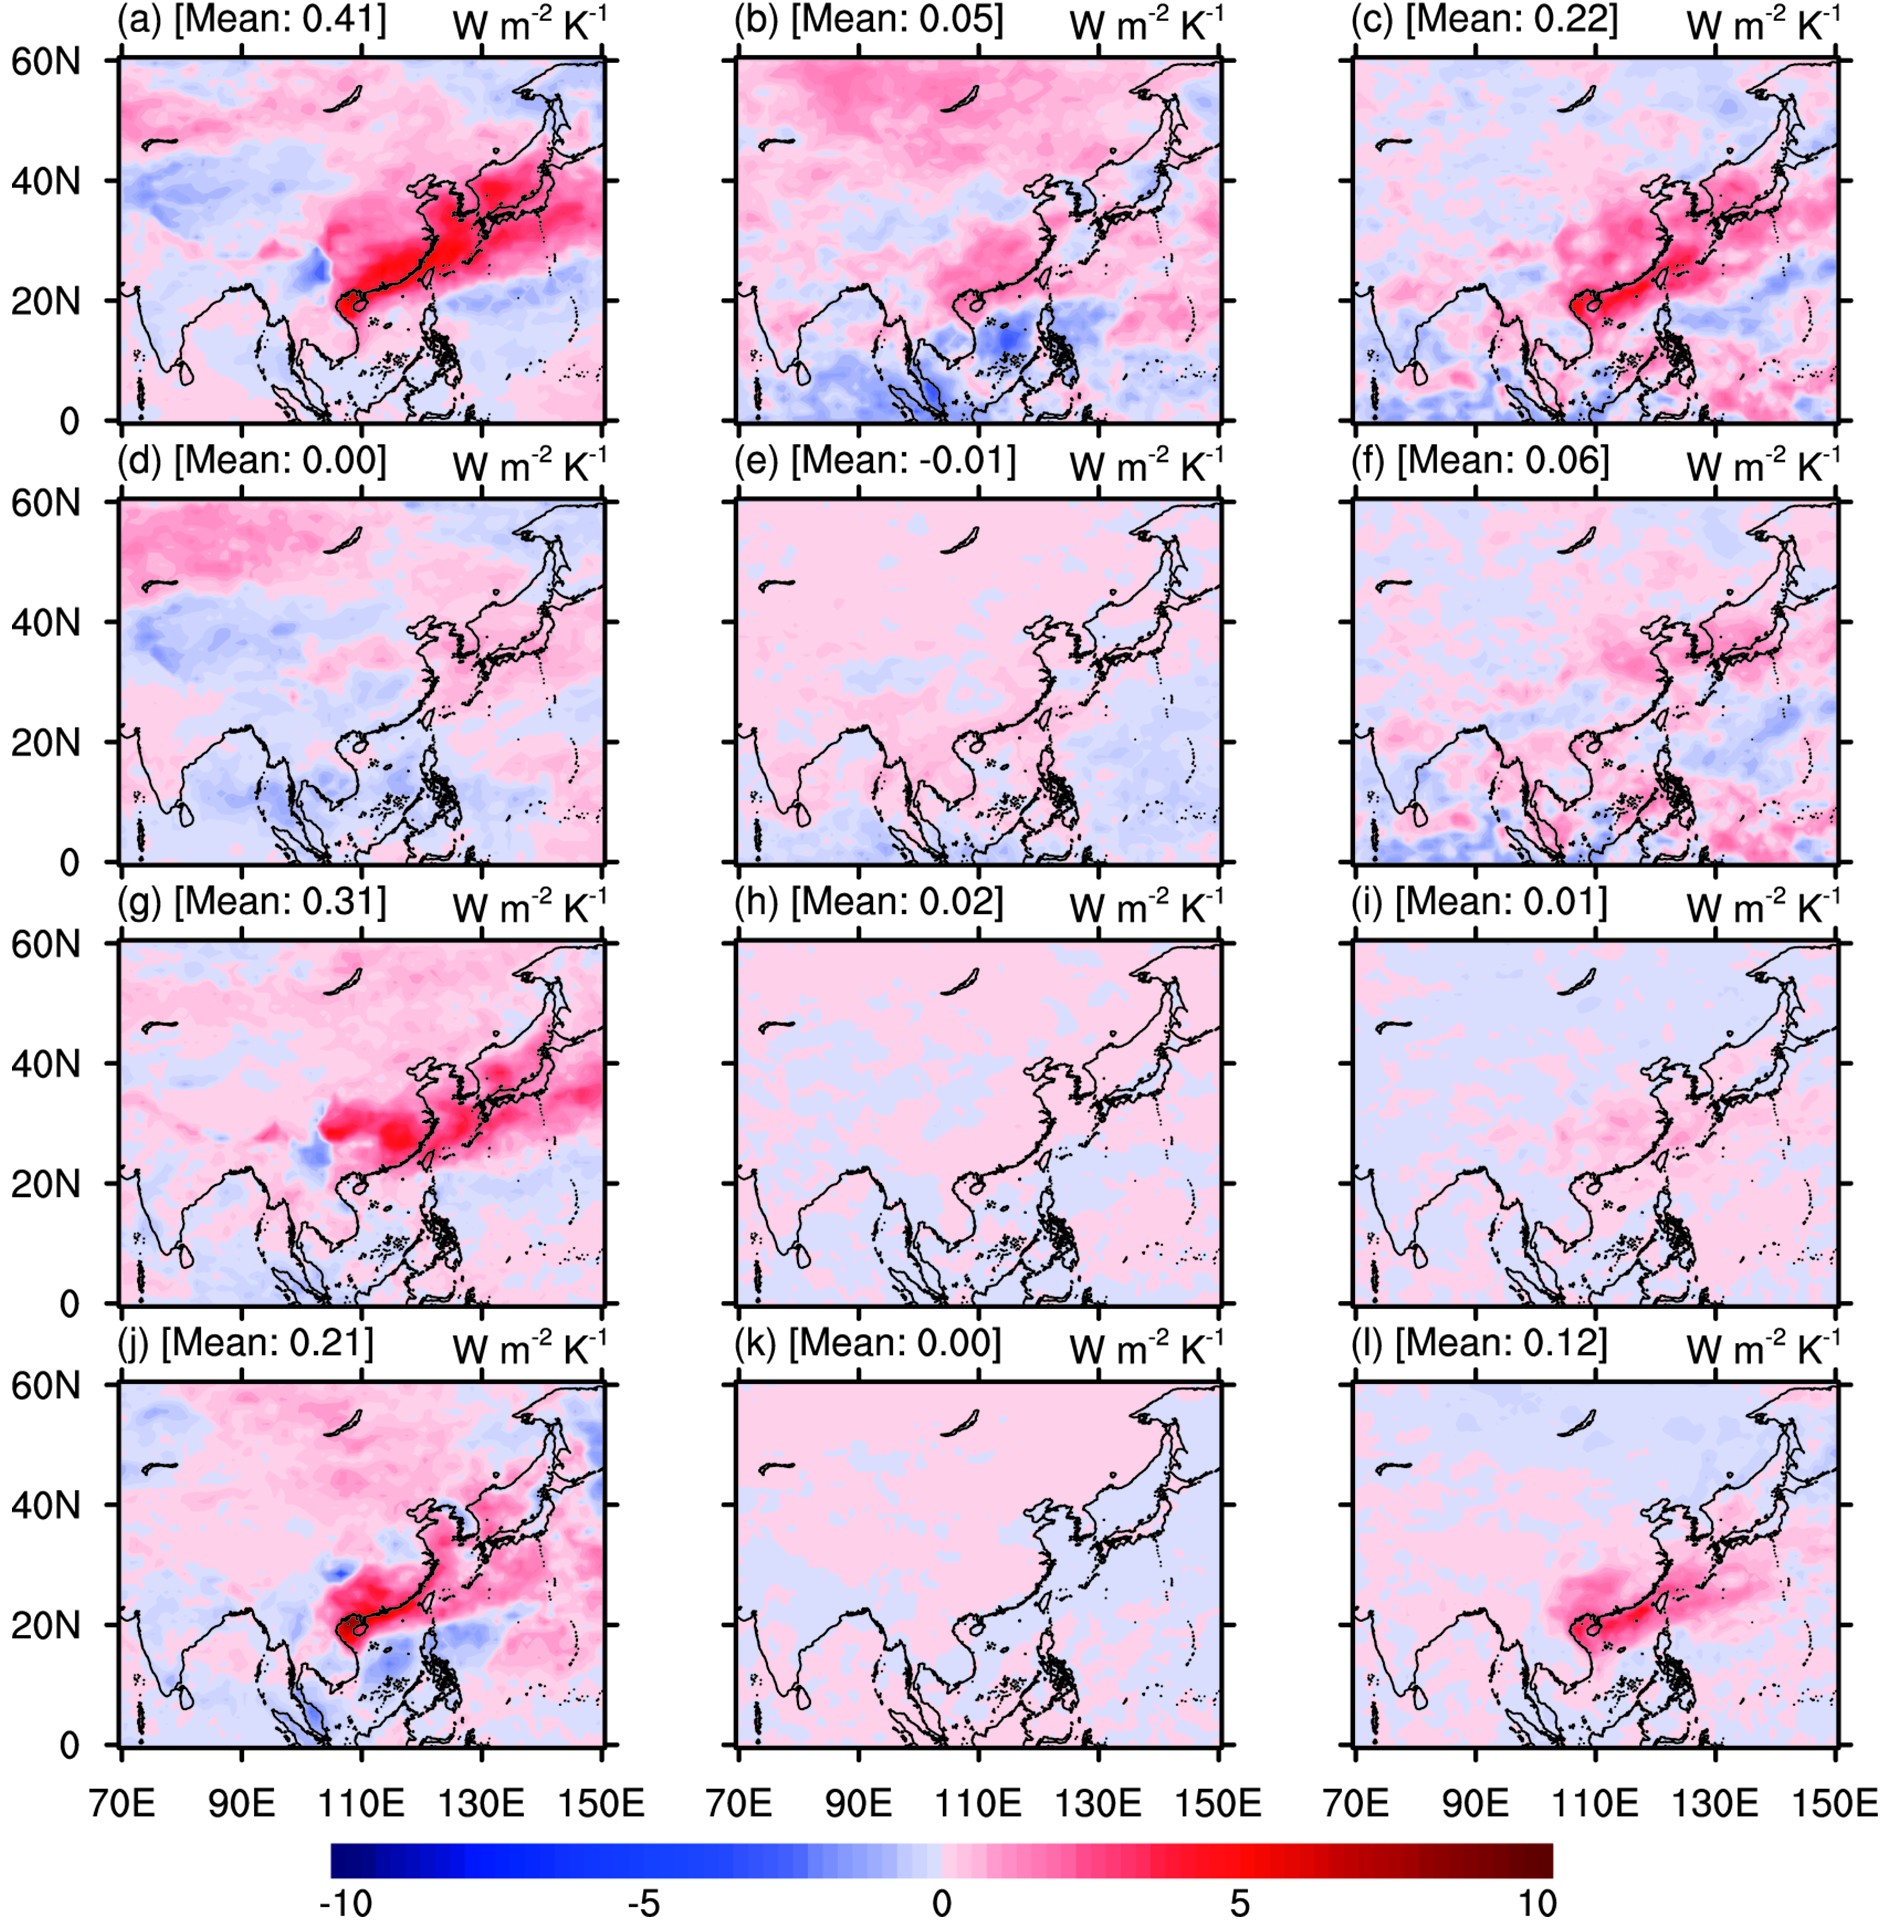 Figure6. Decomposition of cloud feedback (units: W m?2 K?1) into (a, d, g, j) amount, (b, e, h, k) altitude, and (c, f, i, l) optical depth feedback for (a?c) all clouds, (d?f) high clouds, (g?i) mid-level clouds, and (j?l) low clouds.
The average cloud fraction response in East Asia is ?0.73% K?1. Bony et al. (2004) suggested that the changes in cloud fraction should be sensitive to changes in large-scale circulation and thermodynamic structure of the atmosphere. Figures 7g-j show the spatial distribution of relative humidity (RH) responses averaged from the whole atmosphere and vertical pressure velocity responses at 500 hPa (


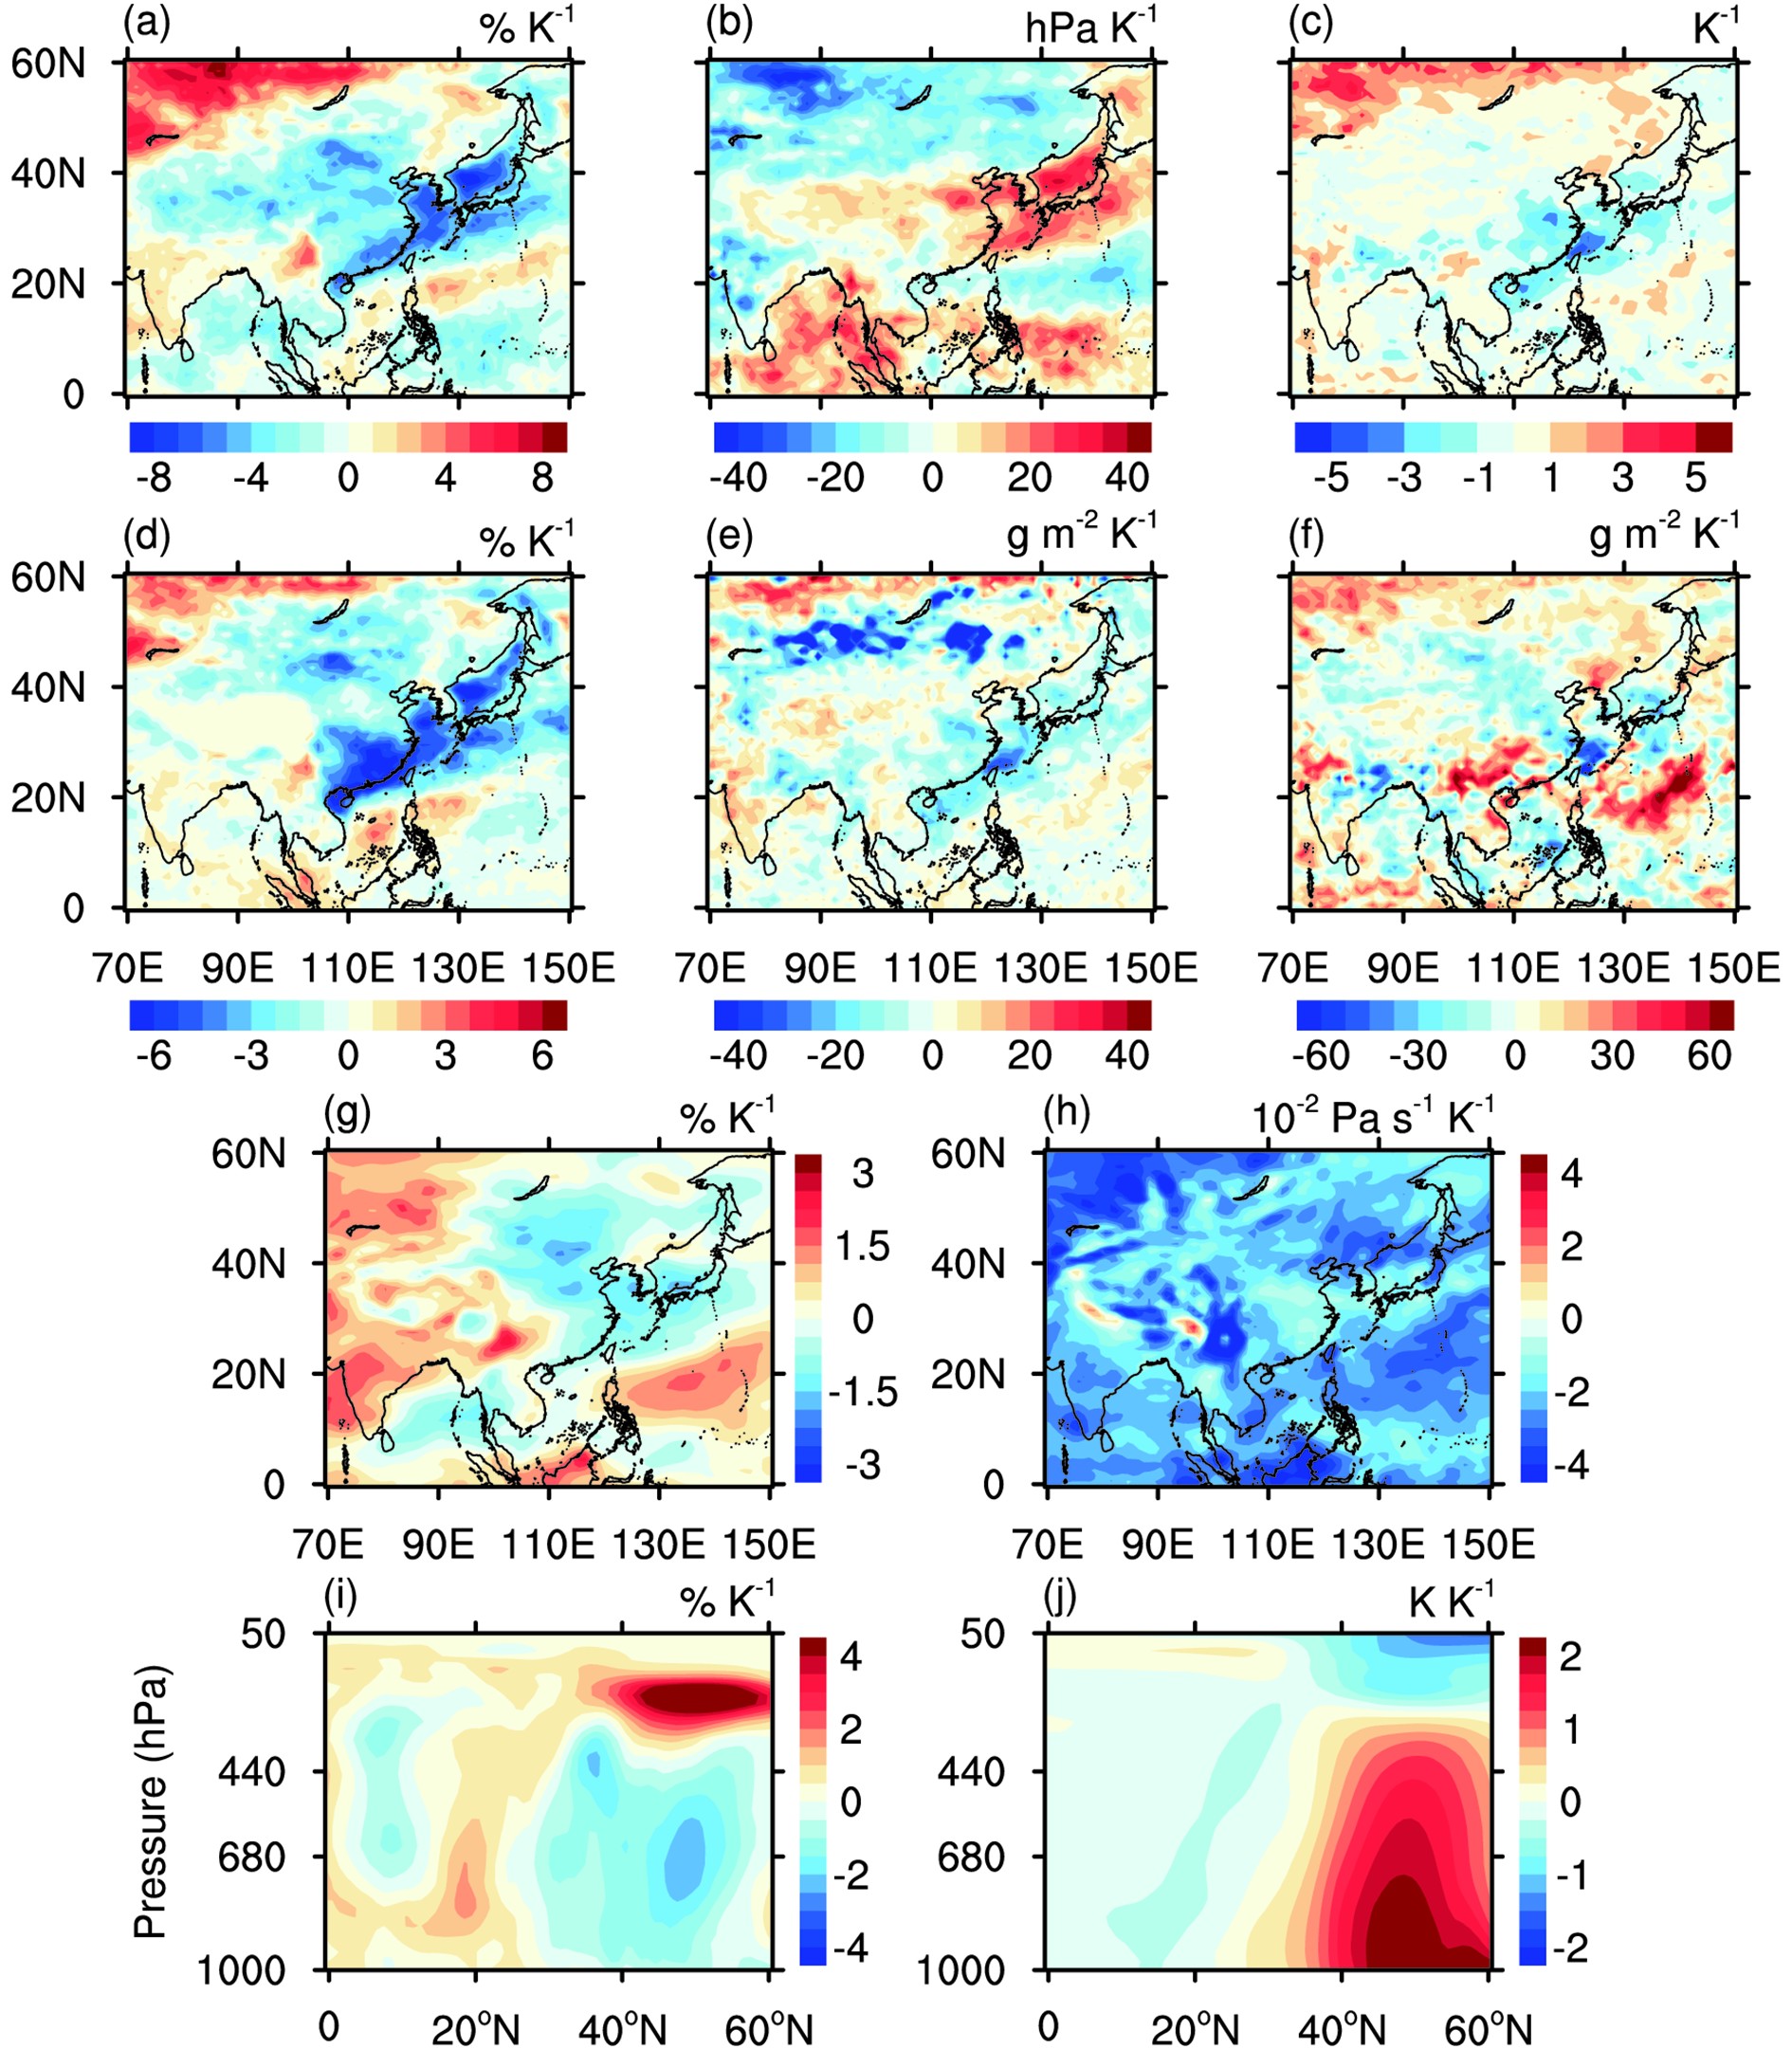 Figure7. Responses of (a) total cloud fraction (units:% K?1), (b) cloud top pressure (units: hPa K?1), (c) cloud optical thickness (units: K?1), (d) cloud fraction of mid-level and low clouds (units:% K?1), (e) liquid water path (units: g m?2 K?1), (f) ice water path (units: g m?2 K?1), (g) relative humidity averaged from the whole atmosphere (units:% K?1), (h) vertical pressure velocity at 500 hPa (units: 10?2 Pa s?1 K?1), (i) zonal mean relative humidity (units:% K?1), and (j) zonal mean air temperature (units: K K?1).
The average CTP response in East Asia is 1.18 hPa K?1. CTP increases over the oceans between 0° and 40°N and decreases in other subregions (Fig. 7b). However, the LW, SW, and net altitude feedback of high, mid-level, and low clouds are all nearly zero (Figs. 6e, h and k), because the cloud feedback in East Asia is dominated by mid-level and low clouds, which can be seen from the context. The changes in CTP are probably caused by changes in the thin clouds in the middle and lower layers, and these clouds have a weak effect on both LW and SW radiation, resulting in small LW, SW, and net altitude feedback.
The average optical depth response in East Asia is very small (0.05 K?1). The strong decreases in COT over the oceans near eastern China and strong increases in the west and north of Inner Mongolia (Fig. 7c) correspond well with the spatial patterns of liquid and ice water path responses (Figs. 7e and f), suggesting that the changes in COT are connected with the changes in cloud water content. The results of climate models show that global warming leads to a slight reduction in COT at middle and low latitudes and an increase in COT at high latitudes (IPCC, 2014), and the increase in high-latitude COT results from increases in cloud water content (Zelinka et al., 2012b). In addition, the changes in COT may be related to phase changes of clouds at high latitudes (Senior and Mitchell, 1993; Tsushima et al., 2006; Zelinka et al., 2012b) and poleward vapor transport (Vavrus et al., 2009).
The average cloud fraction responses to East Asian surface temperature anomalies in TP, NW, TM, SM land, and SM ocean are ?2.11% K?1, ?1.19% K?1, ?2.03% K?1, ?2.23% K?1, and ?2.52% K?1, respectively. Cloud feedback in TP is very weak (?0.15 W m?2 K?1), with its largest contribution from cirrostratus. Its average value in NW is 0.58 W m?2 K?1, mainly due to stratocumulus. Its average value in TM is 1.37 W m?2 K?1, mainly due to deep convective cloud and nimbostratus. The feedback in SM is the strongest, with 3.41 and 3.51 W m?2 K?1 in SM land and SM ocean, respectively, mainly due to nimbostratus and stratus. In general, short-term feedback in East Asia is primarily driven by nimbostratus and stratus because these two thick clouds can reflect solar radiation strongly; thus, the sharp reduction in cloud fraction results in positive feedback.
Short-term cloud feedback in East Asia is strongest in summer (2.07 W m?2 K?1) and weakest in winter (0.04 W m?2 K?1). Its average value is 1.37 W m?2 K?1 in spring and 0.73 W m?2 K?1 in autumn. Feedback in spring is chiefly due to the contribution of marine stratus in SM, mainly driven by deep convective cloud in TM in summer, mainly by land nimbostratus in SM in autumn, and primarily by land stratus in SM in winter.
In East Asia, the average cloud amount response is ?0.73% K?1, the altitude response is 1.18 hPa K?1, and the optical depth response is 0.05 K?1. Cloud feedback is mainly due to the cloud amount feedback (0.41 W m?2 K?1) and optical depth feedback (0.22 W m?2 K?1). Amount feedback is caused by the decreases in cloud fraction of mid-level and low clouds, resulting from changes in the thermodynamic structure of the atmosphere. Optical depth feedback is caused by the reduction in COT of low clouds, related to changes in cloud water content.
Short-term cloud feedback is a useful variable for estimating the uncertainties relating to clouds, and its quantitative analysis can provide a reference for the study of long-term cloud feedback. Furthermore, deepening the understanding of short-term cloud feedback can help climate models to better simulate the cloud radiative process and cloud feedback as a whole, thus improving the accuracy of climate models.
Acknowledgements. This work was financially supported by the National Key R&D Program of China (Grant No. 2017YFA0603502) and the National Natural Science Foundation of China (Grant Nos. 91644211 and 41575002).
