HTML
--> --> -->The concept of potential vorticity (PV) can be traced back to the studies of Rossby (1940) and Ertel (1942). Ertel’s PV is defined as


Yao et al. (2007, 2008) found that the easterlies vortex (EV) in the upper troposphere moved westward and the westerlies vortex (WV) moved eastward during 22?25 June 2003, which caused the short-term eastward retreat of the WPSA and terminated the first rainstorm during the mei-yu period over the Yangtze River?Huaihe River Basin. This phenomenon confirms the close relationship between the WPSA and the easterly systems in the low latitudes. The EV is a synoptic-scale system with a deep vertical scale and a “warm up and cold down” structure. The strength and structure of the EV changes before and after the eastward retreat of the WPSA. According to composite analysis of several cases (Zhang et al., 2010), the positive PV variations in the EV and the WV join together and form a belt-like zone before and after the eastward retreat of the WPSA. Vorticity advection, vertical motion and heterogeneous heating all play important roles. Further research on thermal forcing (Sun et al., 2013; Yao and Sun, 2016) has shown that the distribution and intensity of the diabatic effect near the EV leads to the retreat of the WPSA. The above studies have shown that the dynamic and thermal mechanisms are two interrelated factors, which are both important in the short-term movement of the WPSA influenced by the EV. As a comprehensive physical quantity containing both thermodynamic and dynamic factors, PV probably plays an important role in the short-term movement of the WPSA. Studies in recent years have also shown that the existence of the Tibetan Plateau leads to a unique exchange of substances in the stratosphere and troposphere over East Asia in summer (Xia et al., 2016). The diabatic heating of the Tibetan Plateau can cause a surrounding circulation anomaly in the troposphere (Ren et al., 2014; Wu et al., 2015). Thus, an examination of the thermodynamic and dynamic effects of the Tibetan Plateau on the movement of the WPSA is of important scientific value. Combined with the above facts and research results, the forcing effect of the EV in the upper troposphere over the tropics on the short-term zonal movement of the WPSA is explored more deeply in this paper, and the causes are also discussed from the perspective of PV.
Figure 1 shows the distributions of the PV and wind field on the isentropic surfaces of 348 K and 330 K during 22?25 June 2003. On the isentropic surface of 348 K, it can be seen that the SAH corresponds to the low PV. Meanwhile, in the westerlies, the high PV first moves eastward, then propagates to the lower latitudes along the east side of the SAH, and finally moves westward forming a high-PV belt in the tropical region. The large-scale closed circulation system formed in this process is the EV. On the 330-K isentropic surface, the WPSA corresponds to the low PV while the EV corresponds to the high PV. On 22 June (Fig. 1a), the SAH extends eastward to 160°E, and the high PV in the EV centered near 140°E and 17.5°N moves westward. The strong steering flow in the south of the SAH imports high PV at the rear of the EV into the disturbance from the northeast, which further intensifies the disturbance. The high PV corresponding to the WV at 110°E constantly moves eastward. On the 330-K isentropic surface (Fig. 1b), the 588-dagpm contour is obviously bent at the position of the EV, and the WPSA extends westward to 112°E. On 23 June, the main body of the SAH strengthens. A westerlies trough moves to the same longitude as the EV. Meanwhile, the high PV corresponding to the westerlies trough is transported southward by the north wind in the east of the SAH and propagates to the lower latitude. Together with the continuous involvement of the high PV on the east side of the EV, the development of the EV reaches its maximum intensity. At the same time, the high PV corresponding to the WV moves eastwards and equatorward. On the 330-K isentropic surface at the low level, the range of the high-PV zone on the north side of the WPSA increases rapidly. The 0.5-PVU line expands southward to the vicinity of 30°N, and the WPSA extends westward beyond 110°E. On 24 June, influenced by the north wind on the east side of the SAH, the WV with high PV continues to invade into the lower latitudes, forming an independent high-PV center, which is basically close to the EV in the meridional direction. On the 330-K isentropic surface, the WV corresponds to an independent high-PV value region, and the 0.5-PVU line at its south side expands southward to 27°N. The main body of the WPSA retreats to east of 130°E. On 25 June, with the strengthening and eastward extending of the SAH, the high PV corresponding to the WV continues to move eastward, and then deviates from the main body of the SAH and moves northeastward. Meanwhile, the EV moves westward, followed by the westward extension of the WPSA.
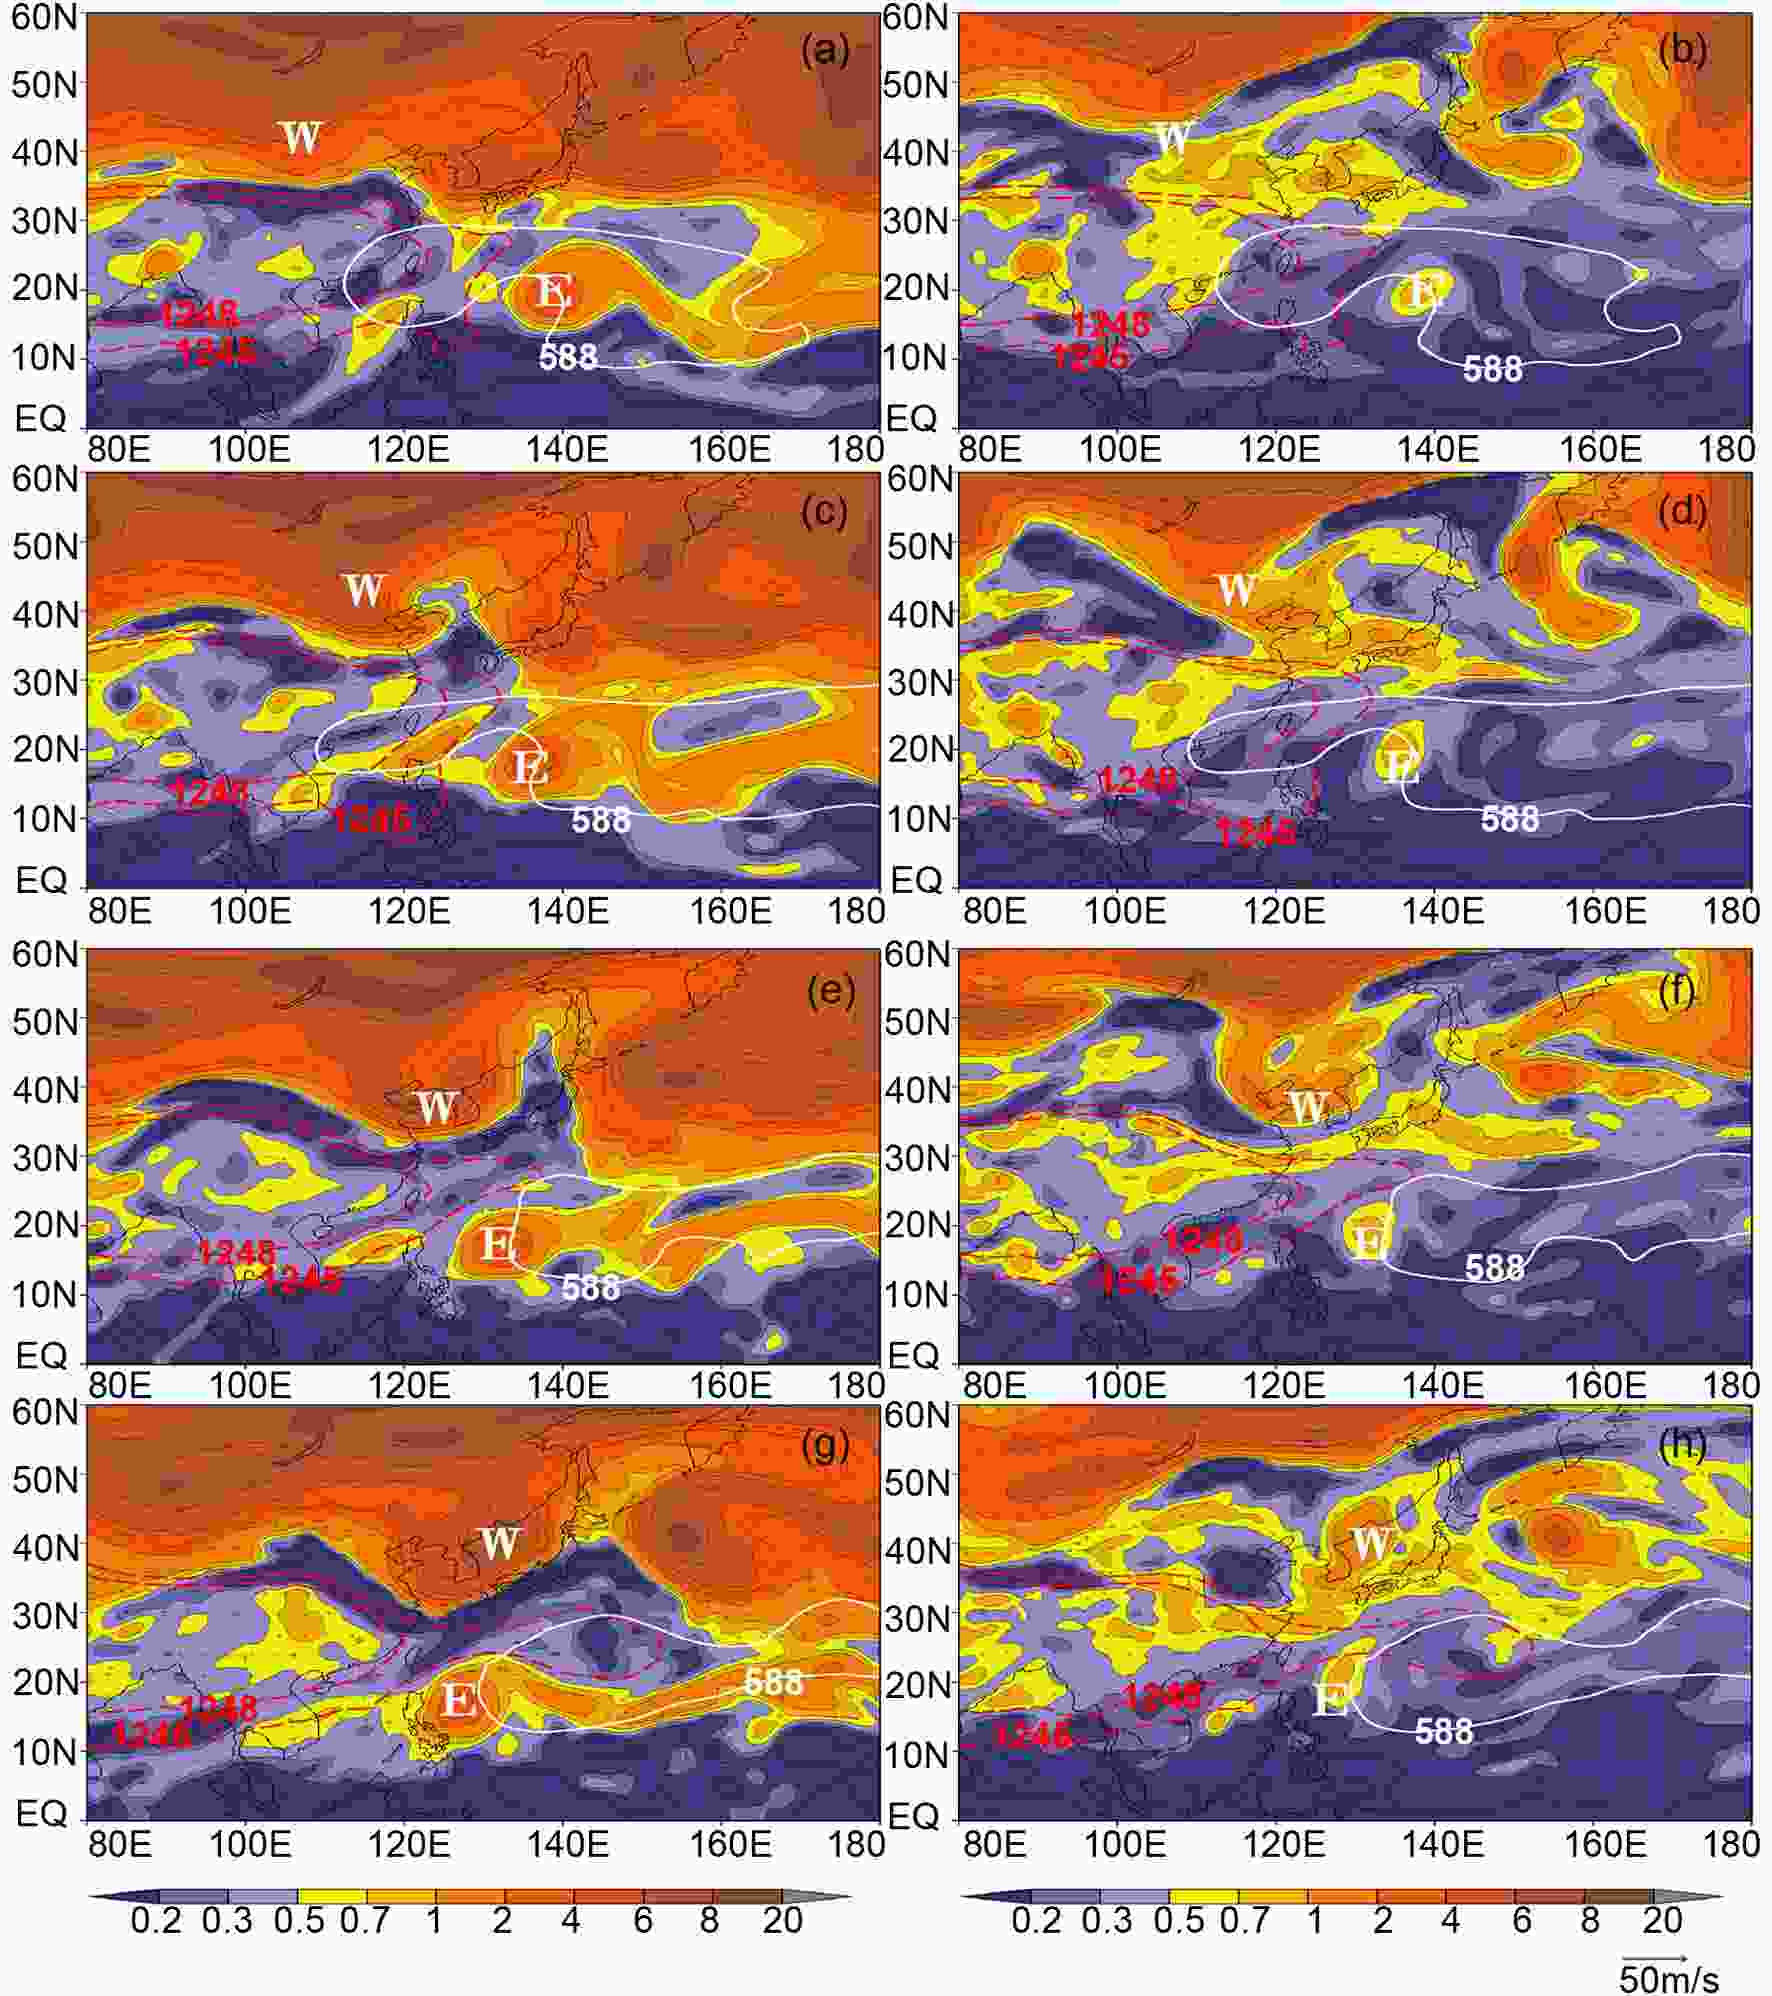 Figure1. PV fields (shading; units: 10?6 m2 s?1 K kg?1) and potential height fields (red dotted line and white thick solid isoline; units: dagpm) on the 348-K (left) and 330-K (right) isentropic surfaces from 22 to 25 June 2003.
It can be seen that the high PV corresponding to the WV moves southeastward, getting closer to the EV, which regularly moves westward. When the high PV corresponding to the EV and that corresponding to the WV basically reach the same longitude in the meridional direction, it causes the abnormal eastward retreat of the WPSA, and the process is accompanied by the southward movement of the high PV in the lower troposphere. The movement and evolution of the high PV corresponding to the EV and WV are related to the SAH, and the change in the EV intensity is also affected by the high-latitude system.
3.1. Vertical structural characteristics and evolution
According to the study of Yao et al. (2008), the structure and intensity of the EV itself also changes when it affects the short-term movement of the WPSA. Some of these changes occur prior to the short-term movement of the WPSA, which has a certain predictive effect.In order to reveal the structural characteristics of the EV in the PV field, the vertical-cross-section distribution of the dry PV is discussed without considering the influence of water vapor. Figure 2 shows the longitude?height cross section of the PV and the potential temperature along the center of the EV. It can be seen that the high-value region of PV above 200 hPa is wave-like. There is a PV tongue extending to the lower level at the longitude of the EV, and this PV anomaly is distributed symmetrically along the zero line of the meridional wind in the EV. The isentropic surfaces converge to the center of the EV, indicating that the EV is a region with large-value static stability, which also has a structure that is warmer at the upper level and colder at the lower level. Here, 1 PVU is regarded as the characteristic line that represents the activity of the high-value region of PV. From the figure, it is clear that the PV anomaly region continuously moves westward. Before the WPSA retreats eastward, the lowest position of the high-value region of PV locates at about 250 hPa on 22 June and it extends down to about 300 hPa on 23 June, accompanied by the significant strengthening of PV in the upper troposphere. At this time, the isentropic surface closes strongly inward, resulting in an increase of the distance between the upper and lower isentropic surfaces over the EV center, a decrease of the static stability, and a strengthening of the cyclonic circulation. Therefore, the downward transport of the high PV is beneficial to the enhancement and vertical expansion of the EV. After the WPSA retreats, the PV anomaly region shrinks up slightly, corresponding to the decrease in the intensity and range of the EV.
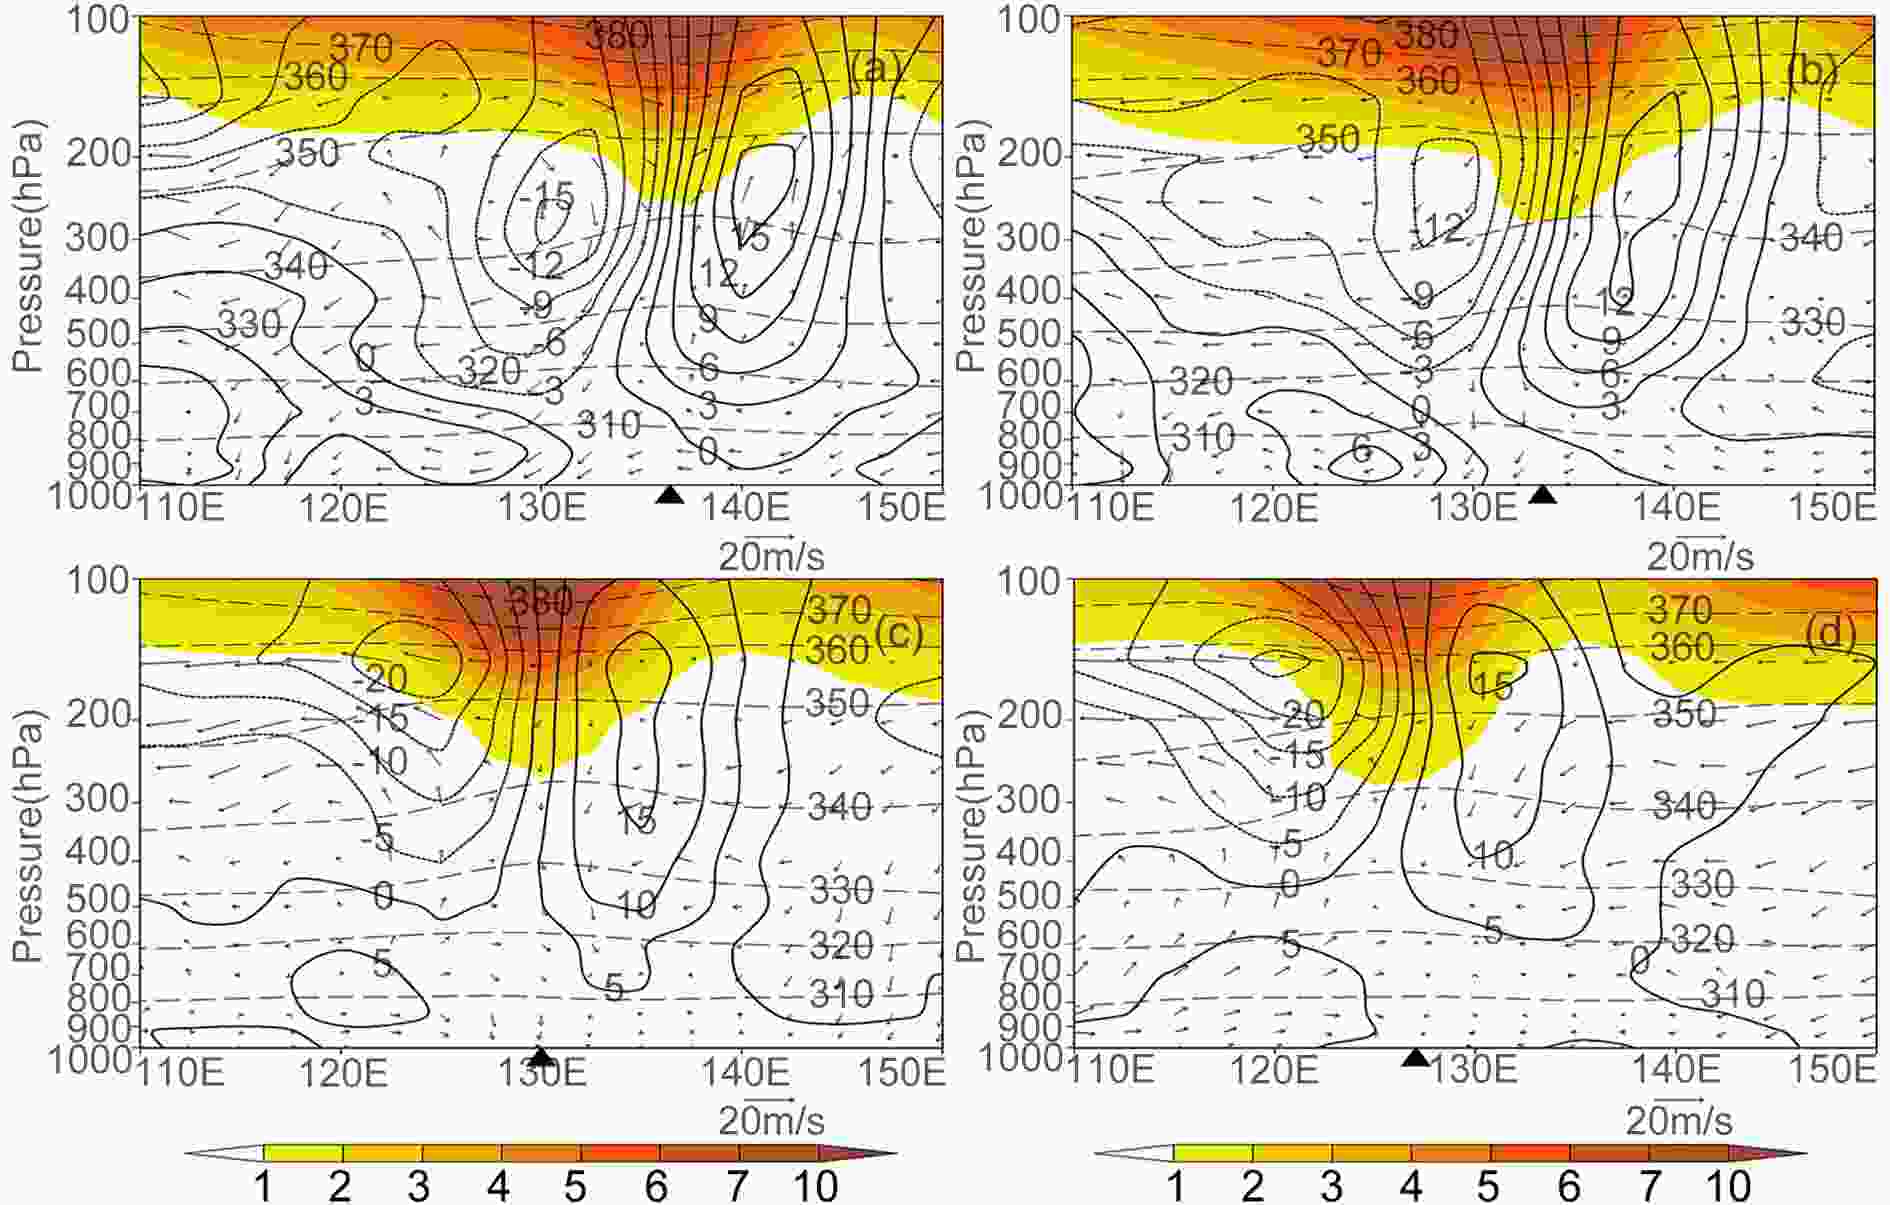 Figure2. Vertical profiles of PV (shading; units: 10?6 m2 s?1 K kg?1), meridional wind (solid line; units: m s?1) and potential temperature (dotted line; units: K) field on (a) 22, (b) 23, (c) 24 and (d) 25 June.
According to the analysis in section 2, the development of the EV is accompanied by the entry of the external high PV. In order to illustrate the influence of the high-PV transport from the high latitudes on the intensity change of the EV, the evolution of the meridional PV transport north of the EV (near 25°N) on the 348-K isentropic surface is analyzed by using the equation


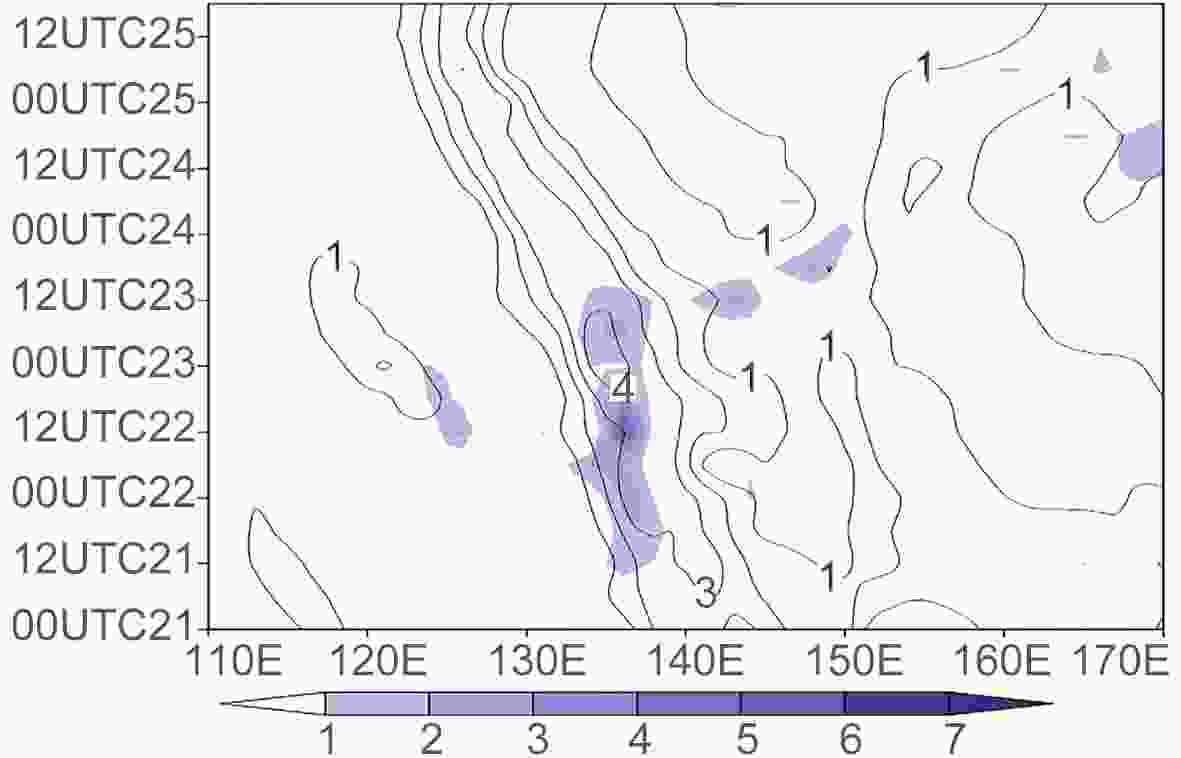 Figure3. Evolution of PV along 17.5°N (solid line; units: 10?6 m2 s?1 K kg?1) and meridional PV conveying
The above analyses show that the high-value anomaly of PV in the upper troposphere or lower stratosphere corresponds to the location of the EV. The maintenance of the EV is the result of the downward transport of PV from the upper troposphere. Also, its central intensity is determined by the intensity of the downward transport of PV and the meridional propagation of the positive PV from the high latitudes.
2
3.2. Vertical motion
Hoskins et al. (Hoskins, 1974; Hoskins et al., 1985) proposed the concept of “potential vorticity substance”, considering the isentropic surface as a semi-transparent film, which can be freely passed through by ordinary air substances, but on which the “potential vorticity substance” could only make two-dimensional motion. Therefore, not only can PV theory explain the occurrence and development of cyclones, but its conservation on the isentropic surface cloud can also provide an interpretation of the change in vertical motions occurring on both sides of the positive PV anomaly at the upper level. The vertical motion on the west (east) side of the EV changes from subsidence (ascent) to ascent (subsidence) before and after the eastward retreat of the WPSA, which could be used to predict the short-term retreat of the WPSA (Yao and Sun, 2016). The inversion of the EV’s vertical motion is discussed from the viewpoint of PV.Based on the PV viewpoint (Hoskins et al., 2003), the


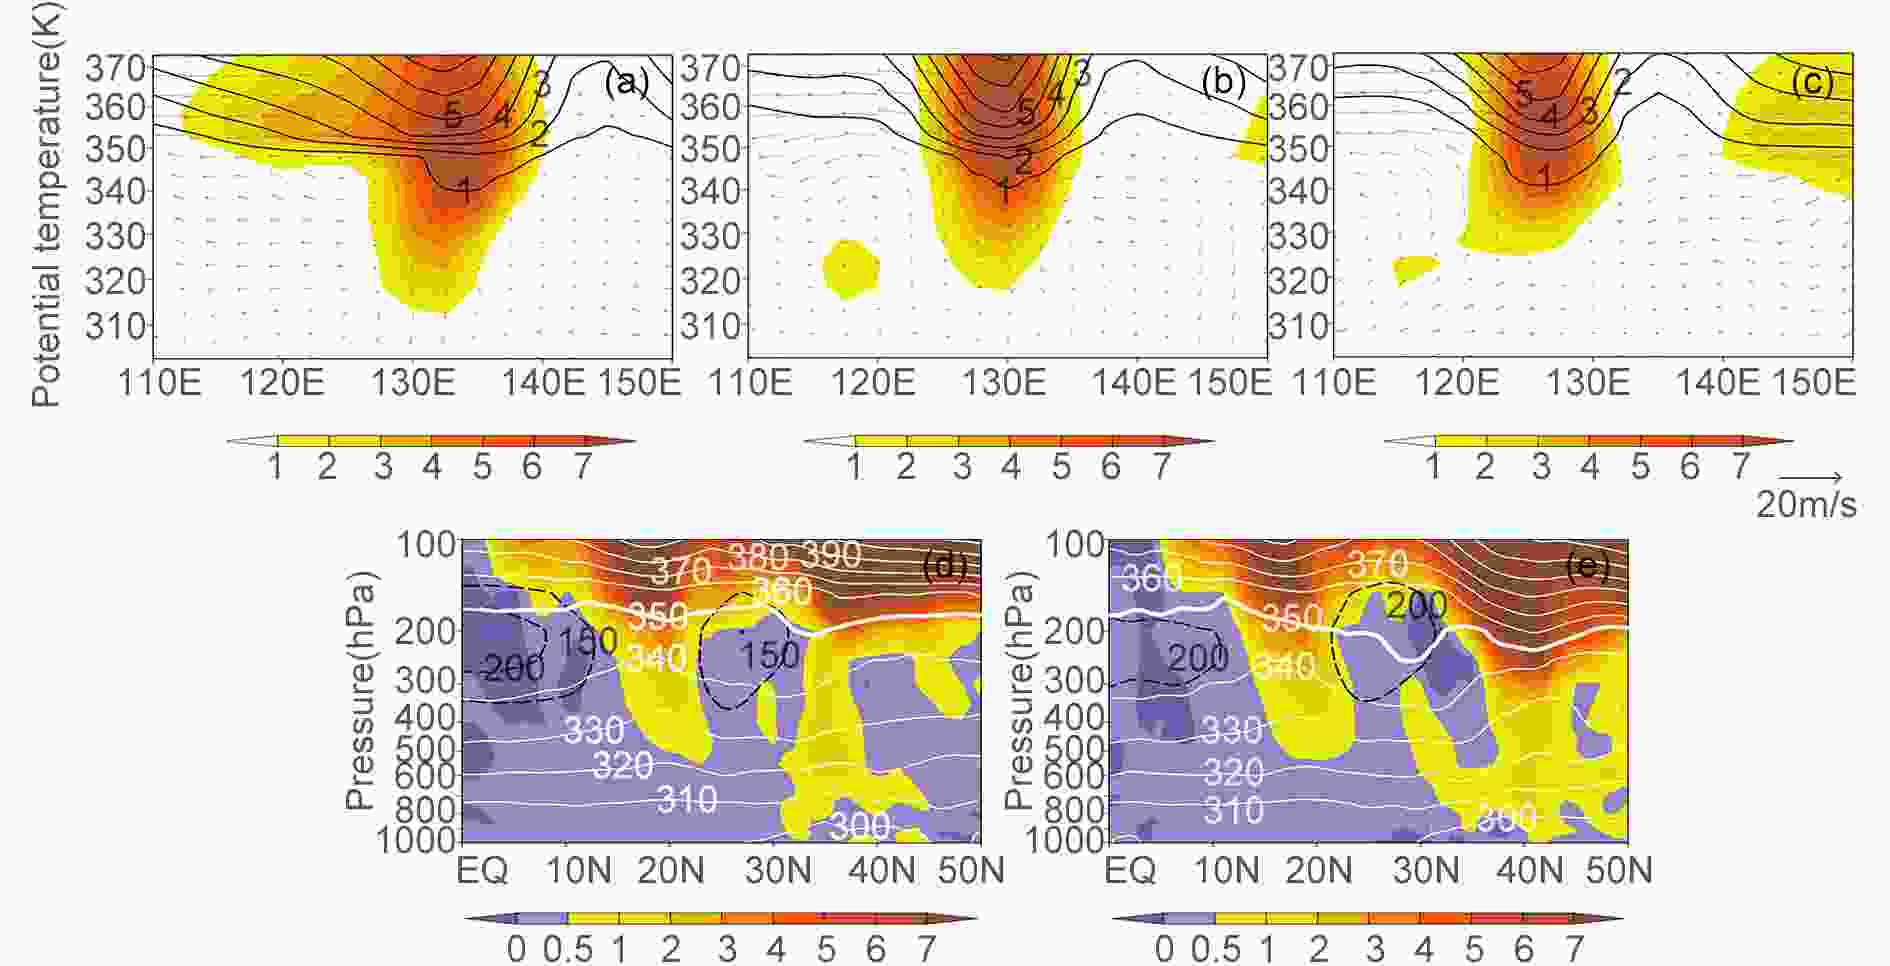 Figure4. Vertical cross section of vorticity (shading; units: 10?5 s?1), PV (isolines; units: 10?6 m2 s?1 K kg?1) and vertical circulation (vectors; units: 10?2 Pa s?1 along 17.5°N on (a) 23, (b) 24 and (c) 25 June. Meridional cross section of PV (shading), isentropic temperature (white isolines; units: K) and the zonal anomalous height field (black isolines; units: gpm) along the center of EV at (d) 0000 UTC 23 June and (e) 0600 UTC 24 June.
In conclusion, the EV is a deep tropical system, whose vertical movement depends on the ambient airflow. The changes in vertical motion on both sides of the EV are closely related to the relative positions of the EV with the WPSA and the SAH. This can be well explained by the “isentropic up-glide”.
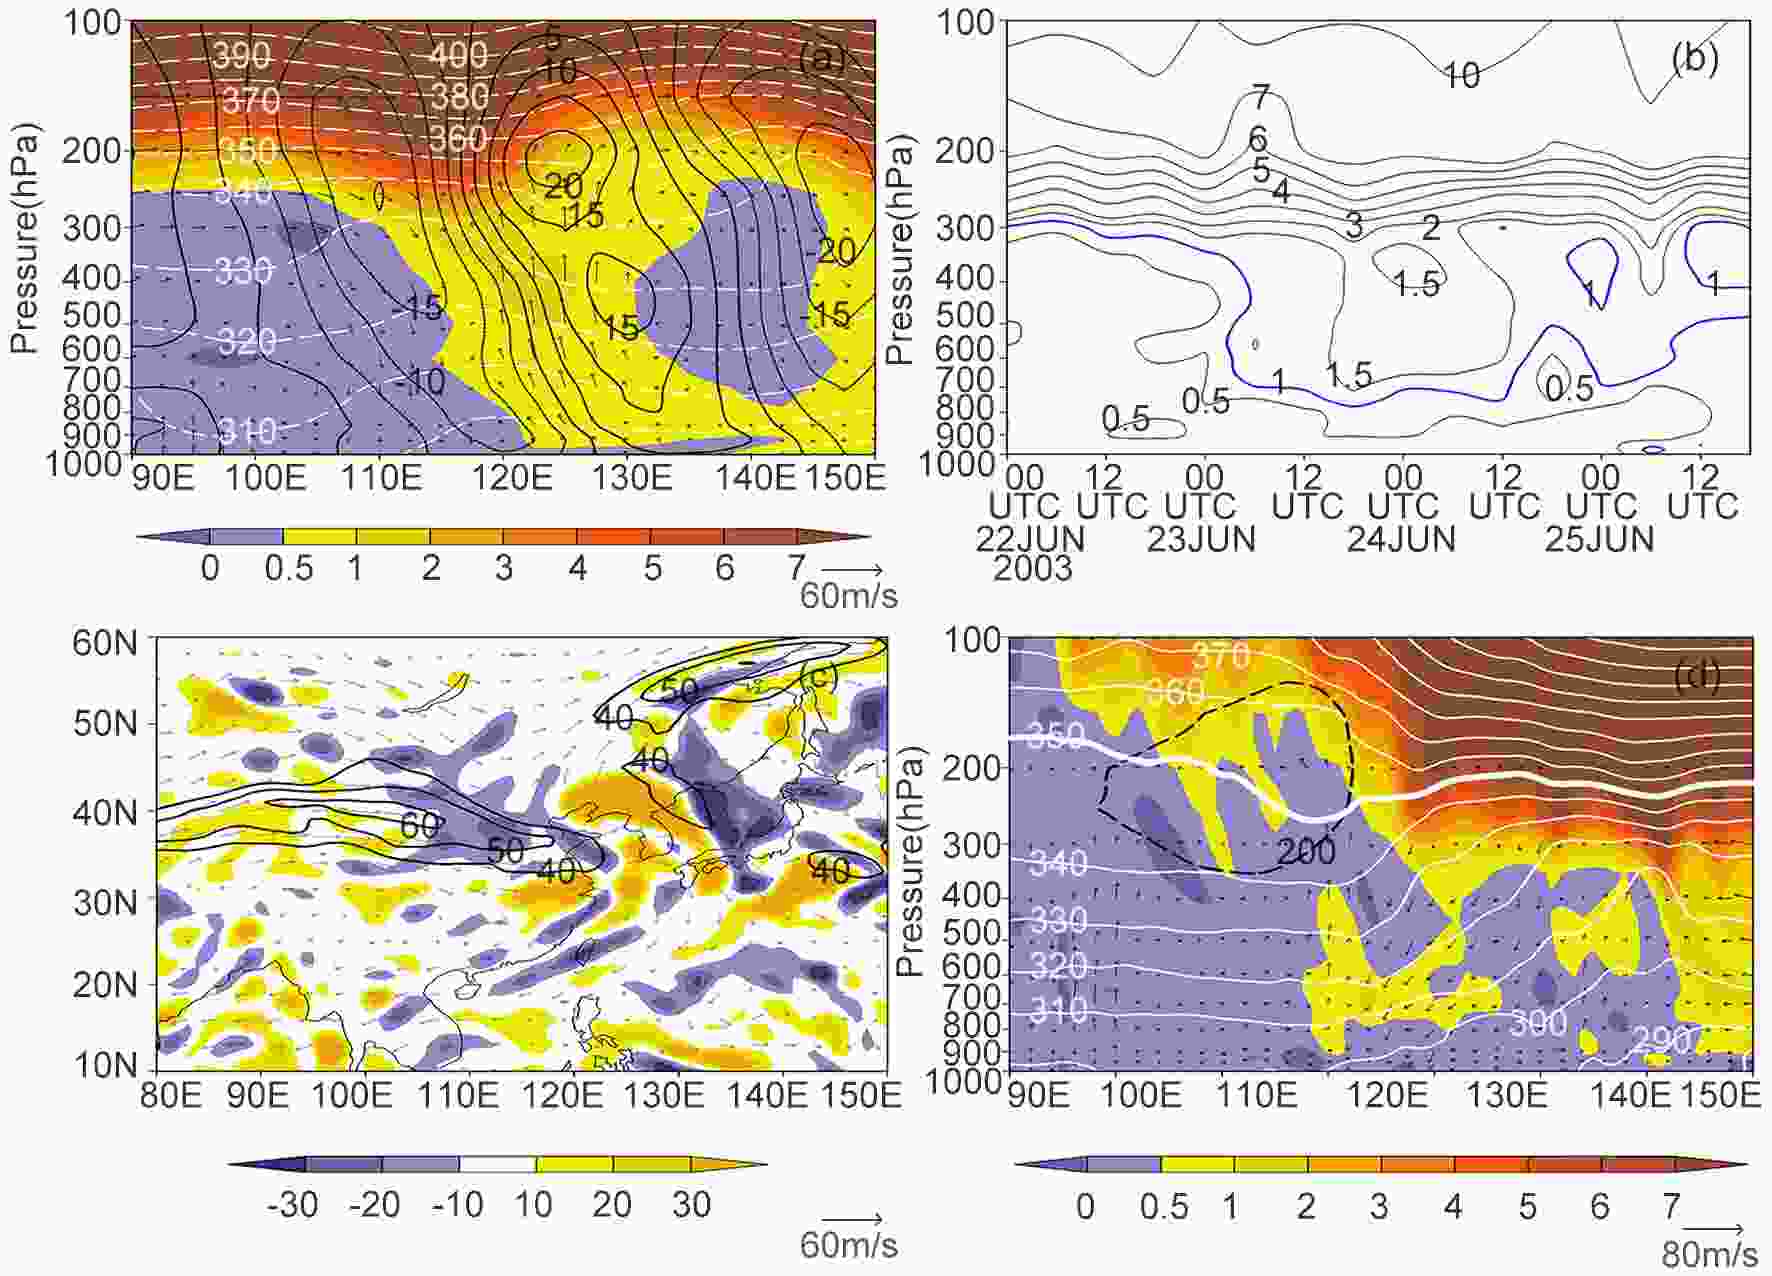 Figure5. (a) Vertical cross section of PV (shading; units: 10?6 m2 s?1 K kg?1), meridional wind (isolines; units: m s?1), isentropic temperature (dashed lines; units: K) and vertical circulation (vectors; units: 10?2 Pa s?1 along the center of the WV on 23 June. (b) Evolution of PV along the center of the WV. (c) Divergence (shading; units: 10?5 s?1), full wind speed (contours; units m s?1) and wind field at 200 hPa. (d) Meridional cross section of PV (shading), potential temperature (white isolines; units: K) and the zonal anomalous height field (black isolines; units: gpm) along the center of the WV at 0000 UTC 23 June.
According to the previous analysis, during the eastward retreat of the WPSA, the southward movement of the high-PV zone appears near the south side of the WV at 30°N in the lower troposphere, which is in favor of the eastward retreat of the WPSA. This phenomenon can be reflected by the PV column with the center intensity greater than 1 PVU in the vertical cross section (Fig. 5d). Its formation may be attributable to the fact that the eastern margin of the SAH narrows and weakens under the pressure of high PV corresponding to the EV and the WV (Figs. 1c and e), which leads to the weakening in the intensity of the negative PV in the upper troposphere on the isentropic surface and the strengthening of the cyclonic circulation at the lower level, and further maintenance of the upward movement at 30°N. The condensation latent heat released by precipitation can lead to the generation of a cyclonic PV anomaly in the lower troposphere, which may be the cause of the generation of high PV in the lower troposphere (Brennan et al., 2008).
Figure 6 shows the cross section along the line between the centers of the EV and WV, and the ridge line of the WPSA is marked by the zero line of zonal wind. It can be seen that, while the high PV anomaly of the WV moves eastward, it continuously extends from the upper troposphere to the lower troposphere. Since the data are the daily mean, the positive large-value (about 330 K) PV area on the south side of the WV in the vertical direction is actually the reflection of the high-PV zone at 30°N in the middle troposphere. When the high PV anomalies of the EV and WV approach the same longitude, the distance between them is the shortest. Along the ridge line of the WPSA, the position of the WPSA corresponds to the abnormal low-value area of columnar PV. On 22 June, the isoline of 0.5 PVU is below 345 K on the ridge line of the WPSA, and there is a low-PV anomaly center at 350 K on its west, corresponding to the location of the SAH. On 23 June, under the effect of ambient wind, the high PV corresponding to the EV tilts northward at the lower level. As the high PV anomalies of the EV and WV approach each other, the columnar low PV anomalies intensify and narrow in the whole atmosphere, and a low-value center appears at the lower level. On the ridge line of the WPSA, the 0.5-PVU line is raised to 350 K, corresponding to the enhanced westward movement of the WPSA. On 24 June, the distance between the high PV anomalies of the EV and WV continues to decrease as the EV becomes more inclined to the north at the lower level. The columnar structure of the low PV anomaly begins to fracture from the middle, while the high PV anomaly of the EV intrudes into the ridge line of the WPSA, leading to the rapid eastward retreat of the WPSA.
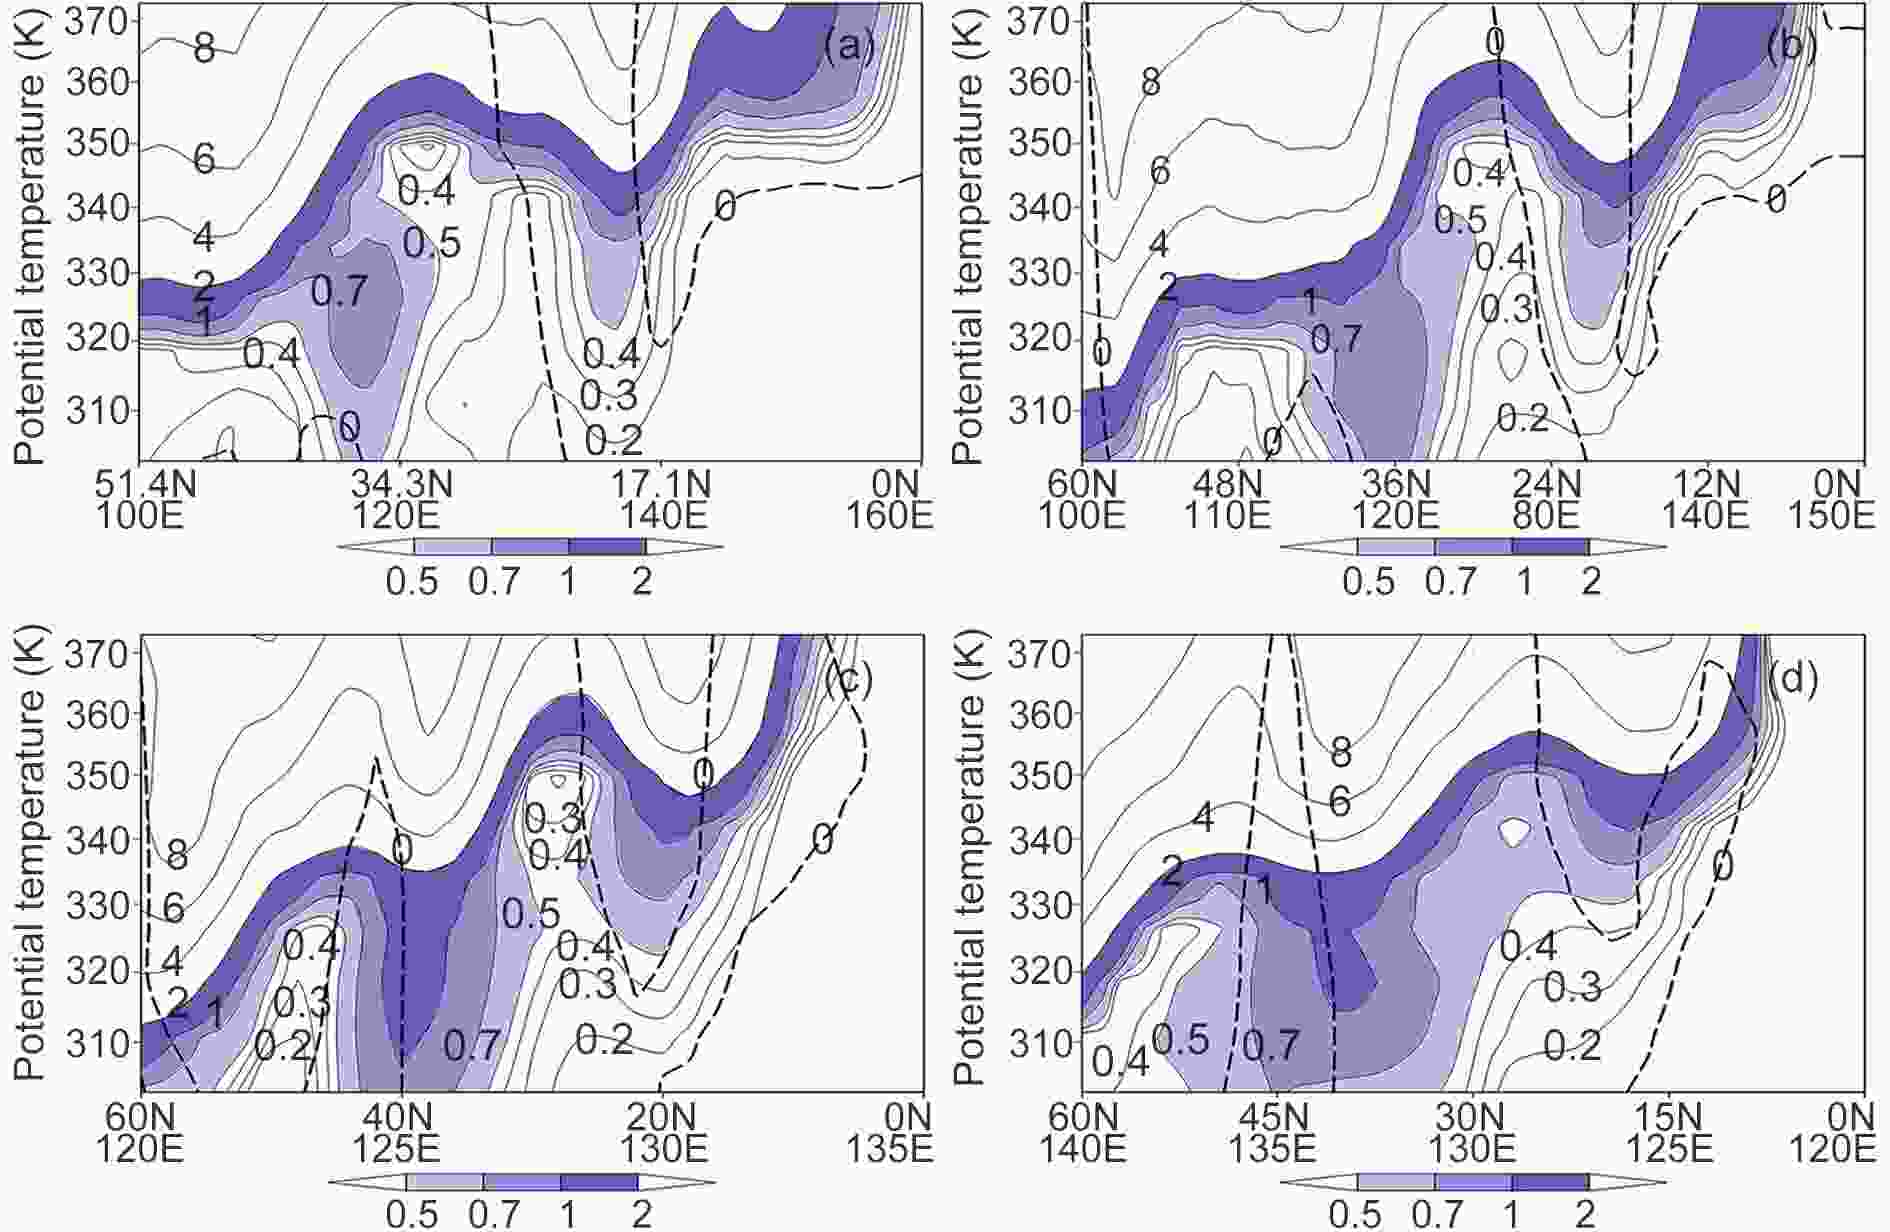 Figure6. Vertical cross section of PV (isolines; values in the shaded region are greater than 0.5 PVU; units: 10?6 m2 s?1 K kg?1) along the line between the centers of the EV and WV from 22 to 25 June. The dotted line represents the zero line of zonal wind.
It can be seen that the low PV anomaly on the ridge line of WPSA first intensifies and then weakens during the process that the high PV anomalies of the WV and EV move toward each other. The intensity variation is consistent with the variation of the 588-dagpm contour of the WPSA at 500 hPa. According to Hoskins (1974), anticyclonic circulations would appear above and below the negative PV anomaly of the upper level. According to the principle of PV conservation, when the negative PV anomaly intensifies, the distance between the upper and lower isentropic surfaces would be shortened, the static stability would increase, and the anticyclonic circulation would strengthen. Therefore, the WPSA would strengthen when the positive PV anomaly on the ridge of the WPSA decreases, and vice versa. Therefore, it is more intuitive and simpler to discuss the intensity change of the WPSA via the change in the PV anomaly at high altitude. Why, then, does the variation in the PV anomaly corresponding to the WPSA at the upper level appear and how does the high PV anomalies of the EV and WV affect the intensity change of the WPSA? The above analyses only focus on the change in the intensity of the WPSA between the PV anomalies of the EV and the WV. Further discussion is conducted about the change in the PV distribution on the fixed isentropic surface to reveal the causes for the short-term east?west movement of the WPSA.
The Ertel PV equation with quasi-hydrostatic approximation (Bluestein, 1992) is given as follows:
where A is the local variation, B is the horizontal advection, C is the vertical advection, D is the vertical differential term of heating, E is the horizontal differential term of heating, and F is the friction term. The expression of PV on the isentropic surface is


2
6.1. Local variation of PV
According to the above analysis, the EV and WV both correspond to the funnel-shaped high PV anomalies at high altitude, while the WPSA corresponds to the low PV anomaly. Figure 7 shows the local variation of PV at 348 K from 22 to 25 June, representing the intensity change and moving direction of the PV anomaly. Before the eastward retreat of the WPSA, the local variation of negative (positive) PV corresponding to the east (west) side of the EV strengthens, indicating that the intensity of the positive PV anomaly corresponding to the EV strengthens while moving westward. The east (west) side of the WV corresponds to the local variation of the positive (negative) PV, and the positive center moves towards the southeast side of the WV center while developing, indicating that the WV has been continuously strengthening and tends to move equatorward. On 23 June, the weak local variation of positive PV in the WPSA begins to weaken, and the area corresponding to the negative local variation appears on the south of the local-variation positive center of PV corresponding to the WV, which is beneficial to the development of the low-level anticyclonic circulation and the westward extension of the WPSA. However, due to the close proximity and enhanced development of the positive PV anomalies of the EV and WV, the low PV anomaly corresponding to the WPSA is squeezed into the belt-like distribution by the positive PV anomalies on the north and south sides. As the EV and WV move toward each other, when they reach the same longitude, the local-variation centers of positive PV on the east side of the EV and west side of the WV are connected. A belt-like zone with positive local variation of PV is formed to the west of 130°E, which enhances the positive PV anomaly over the WPSA west of 130°E and is not beneficial to maintaining the anticyclonic circulation. The intensity of the WPSA decreases, indicating an abnormally eastward retreat at 500 hPa. On 25 June, the high PV anomaly of the EV (WV) continues to move westward (eastward), and the positive local-variation center of the positive PV anomaly also moves to the west (northeast). The WPSA begins to develop westward along with the negative local variation area of PV on the east side of EV.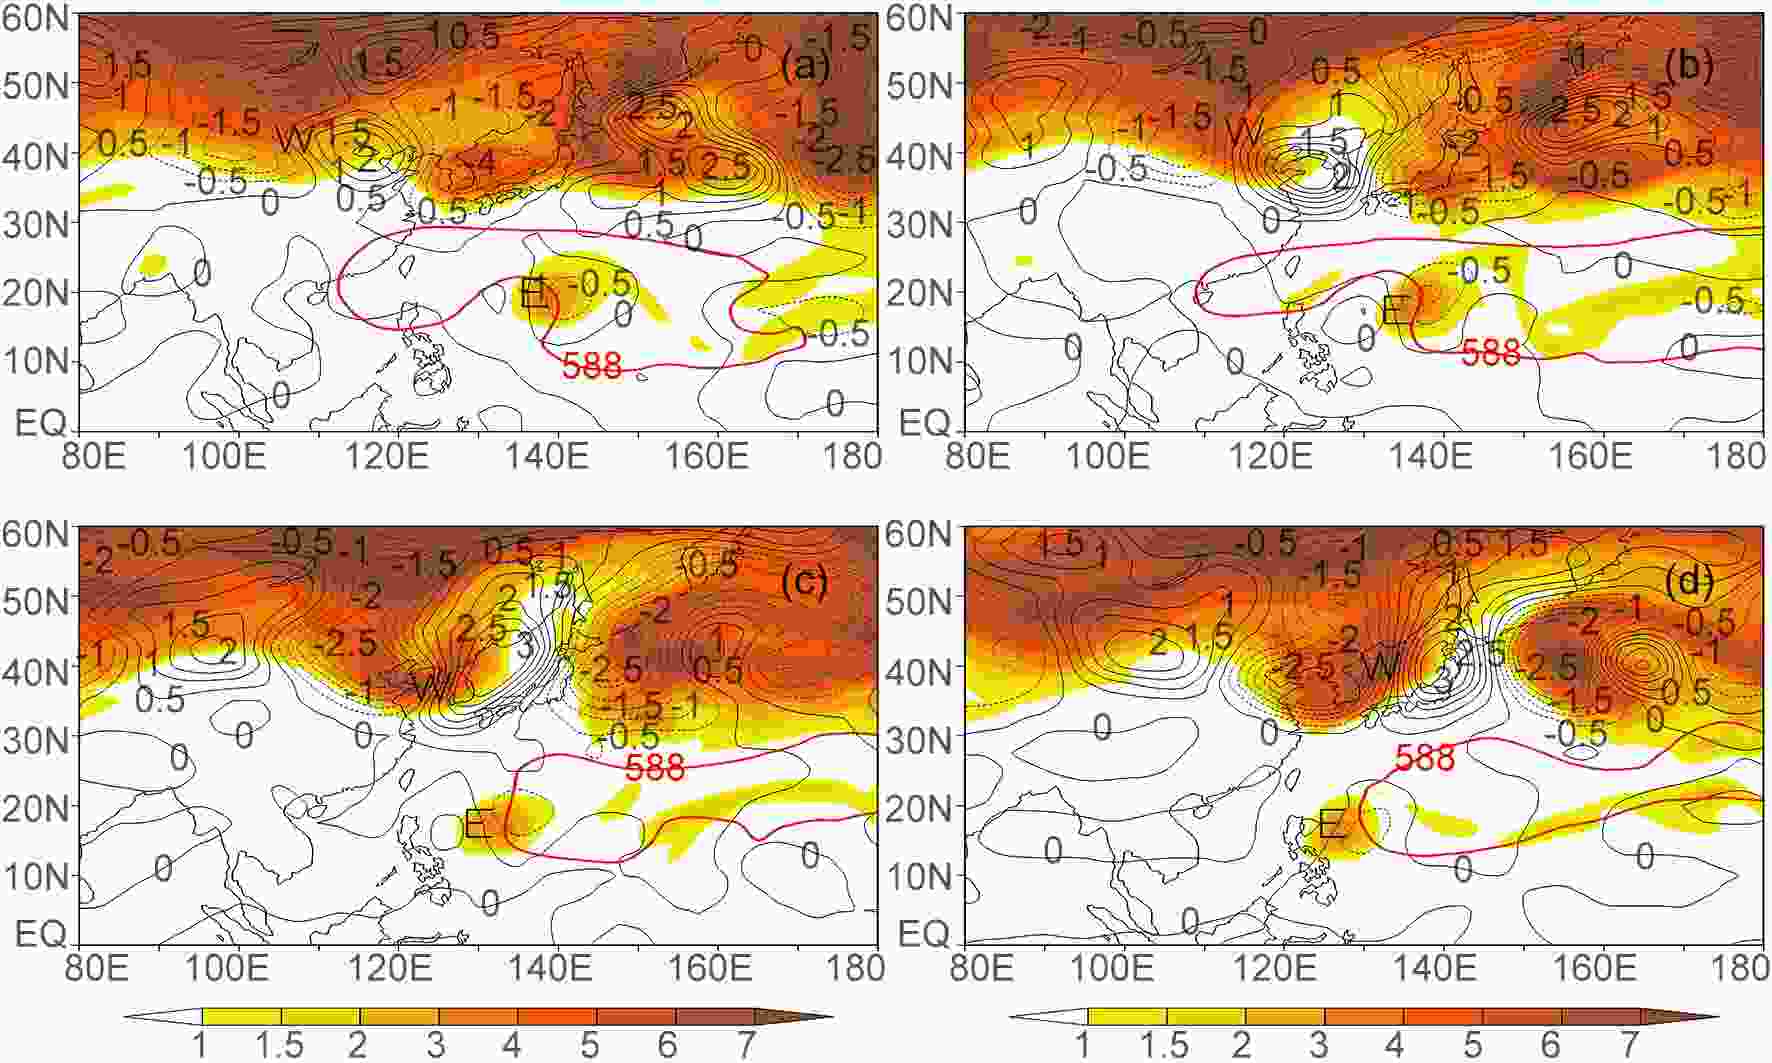 Figure7. Distribution of PV (shaded area is the region with PV larger than 1 PVU; units: 10?6 m2 s?1 K kg?1) and the local variation of PV
It can be seen that the short-term movement of the WPSA is related to the evolution of the positive PV anomalies of the EV and WV at the high level. Due to the enhancement of the positive PV anomaly at the high level, the distance between the isentropic surfaces at the upper and lower levels decreases, the static stability increases, and the cyclonic circulation weakens, which leads to the weakening of the WPSA. Next, to further explore the causes for the short-term movement of the WPSA, the budget of the PV equation on the 348-K isentropic surface is analyzed before and after the eastward retreat of WPSA.
2
6.2. Evolution of each term in the PV equation
Figures 8 and 9 show the distributions of each term in the PV equation [Eq. (1)] before and after the eastward retreat of the WPSA. In the calculation, it is found that among them, the effects of the horizontal advection and residual are the greatest, while those of the vertical advection and residual terms are slightly weaker. The horizontal distribution of the advection terms of PV is very similar to that of the local variation of PV, which increases (decreases) on the west side of the EV (WV) and decreases (increases) on the east side. This shows that the conservation terms make an important contribution to the local variation of PV on both sides of the EV and WV. However, it is noted that the value of the conservation term is much larger than that of the local variation, especially for the positive PV variation on the west (east) side of the EV (WV), which necessarily requires an equilibrium from the non-conservation terms. Before the WPSA retreats eastward (Fig. 8), the positive PV variation on the west side of the EV not only comes from the advection term, but also from the vertical advection term and the vertical differential term of heating, which make the PV variation on the east (west) side of EV tend to be negative (positive). However, the distribution of the residual term is opposite, thus weakening the distribution of the PV variation mentioned above. For the WV, the intensity of the PV variation on the east (west) side caused by the PV advection is greater, but the vertical advection, vertical differential of heating and the residual term all tend to weaken the effect of the conservation term. After the WPSA retreats eastward (Fig. 9), the negative variation of PV disappears between the EV and the WV, and their corresponding positive variations get through from north to south. The distribution of the advection term clearly reveals this characteristic, similar to that of the PV variation. The remaining non-conservation terms are quite different from those before the eastward retreat of the WPSA. The distributions of vertical advection in the EV and the WV both correspond to the positive variation of PV. The vertical differential term of heating becomes negative (positive) on the left (right) side of the WV, while it shows a positive value corresponding to the EV. Contrary to the advection term, the residual term has the effect of offsetting the advection term.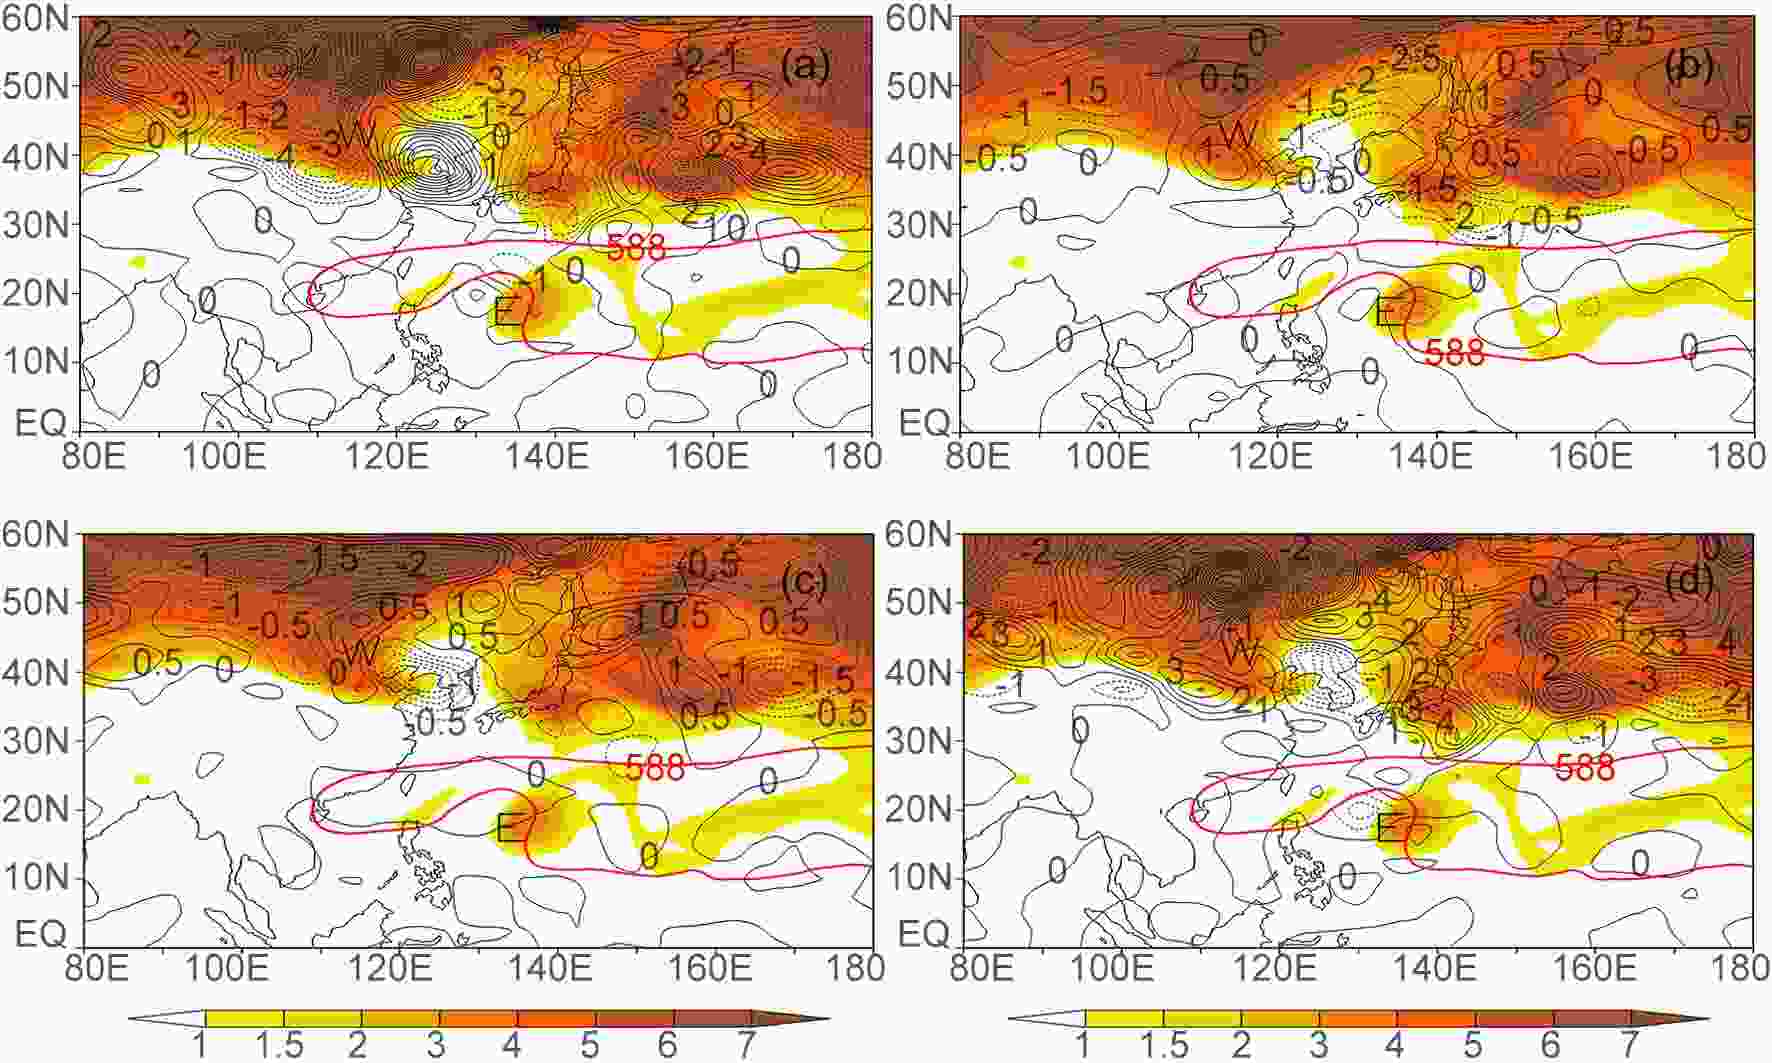 Figure8. Distribution of PV (shading; units: 10?6 m2 s?1 K kg?1) and the terms (a) B, (b) C, (c) D and (d) E+F in Eq. (1) (solid and dotted isolines; units: 10?6 m2 s?2 K kg?1) on the 348-K isentropic surface on 23 June.
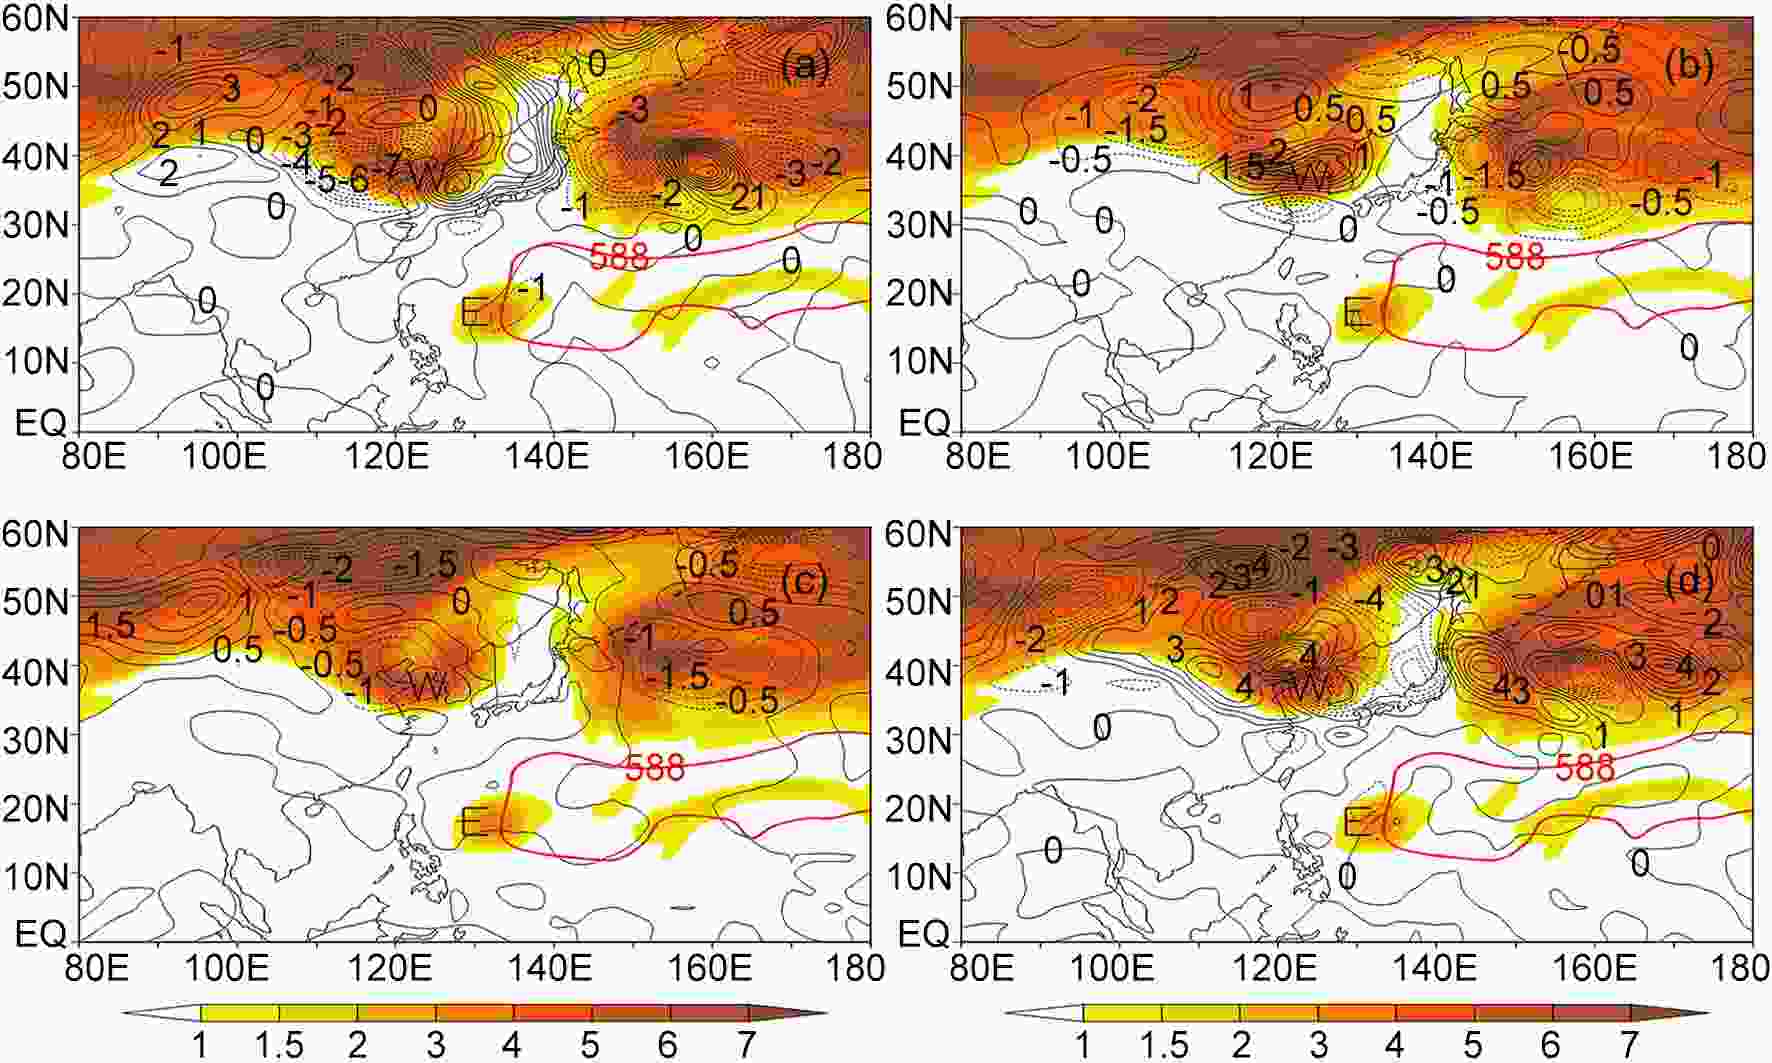 Figure9. As in Fig. 8 but on 24 June.
It can be seen that the PV at the upper level is not conserved due to the existence of residual and diabatic heating, and its local variation is related to the horizontal and vertical advection of PV, the vertical differentiation of heating and the residual. Although the horizontal advection term of PV—namely, the conservation term—describes well the distribution of the two regions of the positive PV variation in the north and south before and after the eastward retreat of WPSA, the intensity is inconsistent with the PV-variation field and requires corrections from the non-conservation terms.
It is worth noting that we only diagnose the nature of how the EV affects the WPSA by using PV in this paper. For better application in manual and numerical prediction, the influence of the WV and EV’s strength and position on the WPSA’s short-term movement needs to be considered. Therefore, in future research work, we will consider using numerical sensitivity experiments to examine the impact of the two systems, so as to further study the quantitative contributions of the WV and EV.
On the 348-K isentropic PV diagram, the north wind on the east side of the SAH leads the high PV corresponding to the westerlies to move southeastward, forming the WV, which reaches the same longitude as the high PV corresponding to the EV, and the WPSA is forced to retreat eastward abnormally. The SAH plays an important role in the movement and evolution of these two systems.
The EV corresponds to the high PV in the upper troposphere, and its maintenance is the result of PV downward transport at the upper level. The intensity of the EV center depends on the intensity of PV downward transport, which is related to the meridional propagation of PV at high latitude. The change in vertical motion on both sides of the EV depends on the relative position between the WPSA and the SAH. The WV is controlled by the positive PV anomaly area. Under the configuration of the isentropic surface and the PV surface at the east edge of the SAH, the PV anomaly at the upper level is transported downward, which promotes the growth of cyclonic circulation at the lower level of the WV. The weakening of the SAH in the meridional direction is beneficial to the development and southward movement of high PV at the middle and lower levels over the Yangtze River?Huaihe River Basin.
When the WPSA retreats eastward, the high PV corresponding to the EV and the WV continuously approach each other in the meridional direction and the position of the 1-PVU isoline on the ridge of the WPSA is lowered, which forces the enhancement of cyclonic circulation at the lower level and leads to the abnormally eastward retreat of the WPSA at 500 hPa.
Before the WPSA retreats eastward, the positive PV variation on the west side of the EV begins to strengthen. When the positive PV variations in the EV and the WV join together and form a belt-like zone, the WPSA retreats abnormally. The budget analyses of isentropic PV show that the horizontal advection of the PV has the greatest effect. The contribution of the vertical advection of PV and the vertical differential of heating is also positive, but the values are relatively small. The contribution of the residual was negative and it becomes smaller before and after the WPSA retreats.
Acknowledgements. This study was supported by the National Natural Science Foundation of China (Grant Nos. 41775048, 91937301, 41775050 and 91637105), the National Key R&D Program of China (Grant No. 2018YFC1507804), and the Second Tibetan Plateau Scientific Expedition and Research (STEP) program (Grant No. 2019QZKK0105).
