HTML
--> --> -->To reveal the microphysical characteristics of stratiform clouds, in situ aircraft measurements have been conducted in recent years in China (Ma et al., 2007; Hou et al., 2014; Guo et al., 2015; Yang and Lei, 2016). High ice particle concentrations with a magnitude of 102 L?1 were observed at temperatures between ?3ЁуC and ?6ЁуC in nimbostratus clouds (Zhao and Lei, 2014; Yang et al., 2017), which could be explained by the Hallett-Mossop ice multiplication process (Hallett and Mossop, 1974). Yang et al. (2014) showed that high ice particle concentrations occur due to breakup dendrite crystal-crystal collisions in the region of ?10ЁуC to ?15ЁуC in stratiform clouds. The active riming and aggregation processes at temperatures warmer than ?9.5ЁуC (Zhu et al., 2015) were responsible for the broader particle size distributions within embedded convective regions as opposed to stratiform regions. These previous studies have provided insights into ice particle size distributions and growth modes, but much remains to be learned. The physical mechanisms that control supercooled droplet size distributions and secondary ice particle processes are not well understood. The distribution of cloud droplets influences the development of cloud microphysics via conversion to ice particles. Knowledge of supercooled water is therefore important for evaluating the optimum temperatures for riming occurrence and the potential of clouds for precipitation enhancement.
One important feature of stratiform clouds over northern China is the existence of embedded convective cells with enhanced reflectivity. The radar returns within the convective region are approximately 10 to 20 dBZ larger than those observed in the surrounding stratiform region (Zhu et al., 2015; Yang et al., 2017), indicating either high ice particle concentrations or a heavy degree of riming. However, few observations are available variations in the particle size distributions in the vertical direction and within different regions of clouds over northern China. Field (1999) studied the evolution of ice particle size distributions based on observations of Lagrangian spiral descents within an altostratus cloud and found that aggregation dominated particle growth at temperatures between ?10ЁуC and ?20ЁуC. Several previous studies (e.g., Herzegh and Hobbs, 1980; Stith et al., 2002; Lawson and Zuidema, 2009; Crosier et al., 2011) have supported enhanced ice particle growth in the embedded convective region. Herzegh and Hobbs (1980) found that riming was important in the convective cells of warm frontal clouds where the updrafts reached 60 cm s?1. The embedded convection in the frontal Arctic cloud system (Lawson and Zuidema, 2009) produced more graupel particles and larger snowflakes. The ice concentrations in the convective region of the stratus (Crosier et al., 2011) were more than one order of magnitude greater than the concentration of primary ice in the overlaying stratus. The embedded convection significantly affected the ice microphysical properties and precipitation development. However, the differences in the supercooled water content and particle size distributions between the convective and stratiform regions are not well understood.
The Taihang Mountains Precipitation Enhancement and Hail Suppression Experiment, which is an observational field program, was conducted to the east of the Taihang Mountains during 2017 and 2019. The experiment focused on observations of stratiform clouds with embedded convection and hailstorms to provide insights into precipitation formation processes and to contribute to water resource management. For stratiform clouds, aircraft and ground observations were performed to reveal the microphysical characteristics and subsequently assess the potential for weather modification.
In this paper, we present aircraft measurements of a precipitating stratiform cloud case over northern China on 22 May 2017. The King-350 aircraft conducted spiral ascents and descents at different regions of the cloud system. The aircraft flew to a height of 7.26 km, which is higher than the previous measurement height of 6 km from the Y-12E and Xiayan 3A aircraft. Microphysical parameters including supercooled liquid water content, particle concentrations, habits, and combined size distributions, were used to demonstrate the differences between the convective and stratiform cloud regions.
The primary goal of this study is to learn more about how supercooled water and particle size distributions vary from upper to lower levels and from convective to stratiform regions. The cloud droplet probe (CDP) and the King probe were used together in this study for quantitative liquid water measurements and cloud phase identification. Through a comparison of particle imagery and associated concentrations, we aim to investigate the temperature region where riming and the associated rime splintering occur. Rime splintering, known as the Hallett-Mossop process (Hallett and Mossop, 1974), has been used to explain the high ice particle concentrations in some clouds. The Hallett-Mossop effect occurs between approximately ?3ЁуC and ?8ЁуC in the presence of supercooled droplets smaller than 13 ІЬm and larger than 25 ІЬm in diameter. We present small and large particle concentration variations in the vertical combined with particle habits to discuss the broader particle size distributions observed in convective regions compared to those observed in stratiform regions.
The remainder of this paper is organized as follows. In section 2, the instrumentation and data processing are presented. An overview of the synoptic features, radar information, and flight paths are presented in section 3. The results, including the distribution of the supercooled liquid water content (LWC), particle size distributions, ice particle habits, and growth processes are analyzed in sections 4 and 5. Finally, the study is summarized and conclusions are presented in section 6.
| Instrument | Parameters | Measurement range |
| King LWC | Liquid water content | 0ЈC3 g mЈC3 |
| CDP | Cloud particle size distribution | 2ЈC50 ІЬm |
| 2D-S | Particle size distribution and images | 10 ІЬmЈC3 mm |
| HVPS | Particle size distribution and images | 150 ІЬmЈC2 cm |
| CPI | High-resolution images | 10ЈC2000 ІЬm |
Table1. Overview of the airborne instruments.
The CDP, which is manufactured by Droplet Measurement Technologies, Inc. (DMT), measures particles with a maximum dimension (D) between 2 and 50 ІЬm. It has a bin width of 1 ІЬm for particles smaller than 14 ІЬm and a bin width of 2 ІЬm for particles larger than 14 ІЬm. The CDP features an open-path laser that is passed between two arms with anti-shattering tips; therefore, ice crystal shattering does not substantially affect the CDP size distribution measurements (Lance et al., 2010).
The 2D-S has a size range of 10 ІЬm to 3 mm, and the HVPS has a size range of 150 ІЬm to 2 cm. The 2D-S consists of two independent 128 photodiode arrays that are occulted when a particle passes through the sample volume. The averaged data from the two channels were used in this study. To reduce the effects of large ice particle shattering, 2D-S probe tips are designed to reduce the number of shattered particles reaching the probe sample volume and apply postprocessing techniques that use an interarrival time algorithm to remove shattered particles (Lawson, 2011; Lawson et al., 2015).
The CPI, which has a resolution of 2.3 ІЬm, provided high-resolution cloud particle images for particles in the size range from 10 to 2000 ІЬm. The probe was used to assess ice particle habits and to identify the occurrence of riming.
2
2.1. LWC measurements and phase determination
The King probe is a widely used probe for measuring liquid water. The LWC in this study refers to that measured by the King probe unless otherwise specified. However, the King hotwire also has limitations in the LWC measurements, including uncertainty in collecting small droplets < 5 ІЬm (King et al., 1978), incomplete response to the large end of the cloud droplet spectrum (Feind et al., 2000), and is subject to contamination by ice particles in mixed-phase conditions. The presence of ice crystals generally biases the hotwire LWC by less than 0.025 g m?3, but the difference can be as much as 0.1 g m?3 (Cober et al., 1995).Considering the aforementioned uncertainties in King LWCs, LWC measurements from the CDP were also presented in this study. The CDP provided particle concentration measurements for sizes smaller than 50 ІЬm and could be used to derive liquid water content. Since the CDP has difficulty distinguishing small ice particles from droplets during measurements, the droplet spectra measured by the CDP were inevitably contaminated by ice particles for mixed-phase conditions. It also had uncertainty in sizing droplets; therefore, these biases should be considered when analyzing the CDP estimated liquid water content. Comparisons of LWCs between the CDP and a Nevzorov hotwire probe (Faber et al., 2018) suggested that the CDP-estimated LWC exceeded that measured by the Nevzorov by approximately 20%. The CDP and hotwire have been used together to estimate LWC in previous studies (Heymsfield and Willis, 2014; Wang et al., 2015; Giangrande et al., 2016).
Figure 1 shows a comparison of King LWCs and CDP-estimated LWCs. The CDP-estimated LWC was broadly consistent with that measured by the King probe. The best linear fit was LWCKing = 0.02 + 0.82 LWCCDP with a correlation coefficient of 0.87.
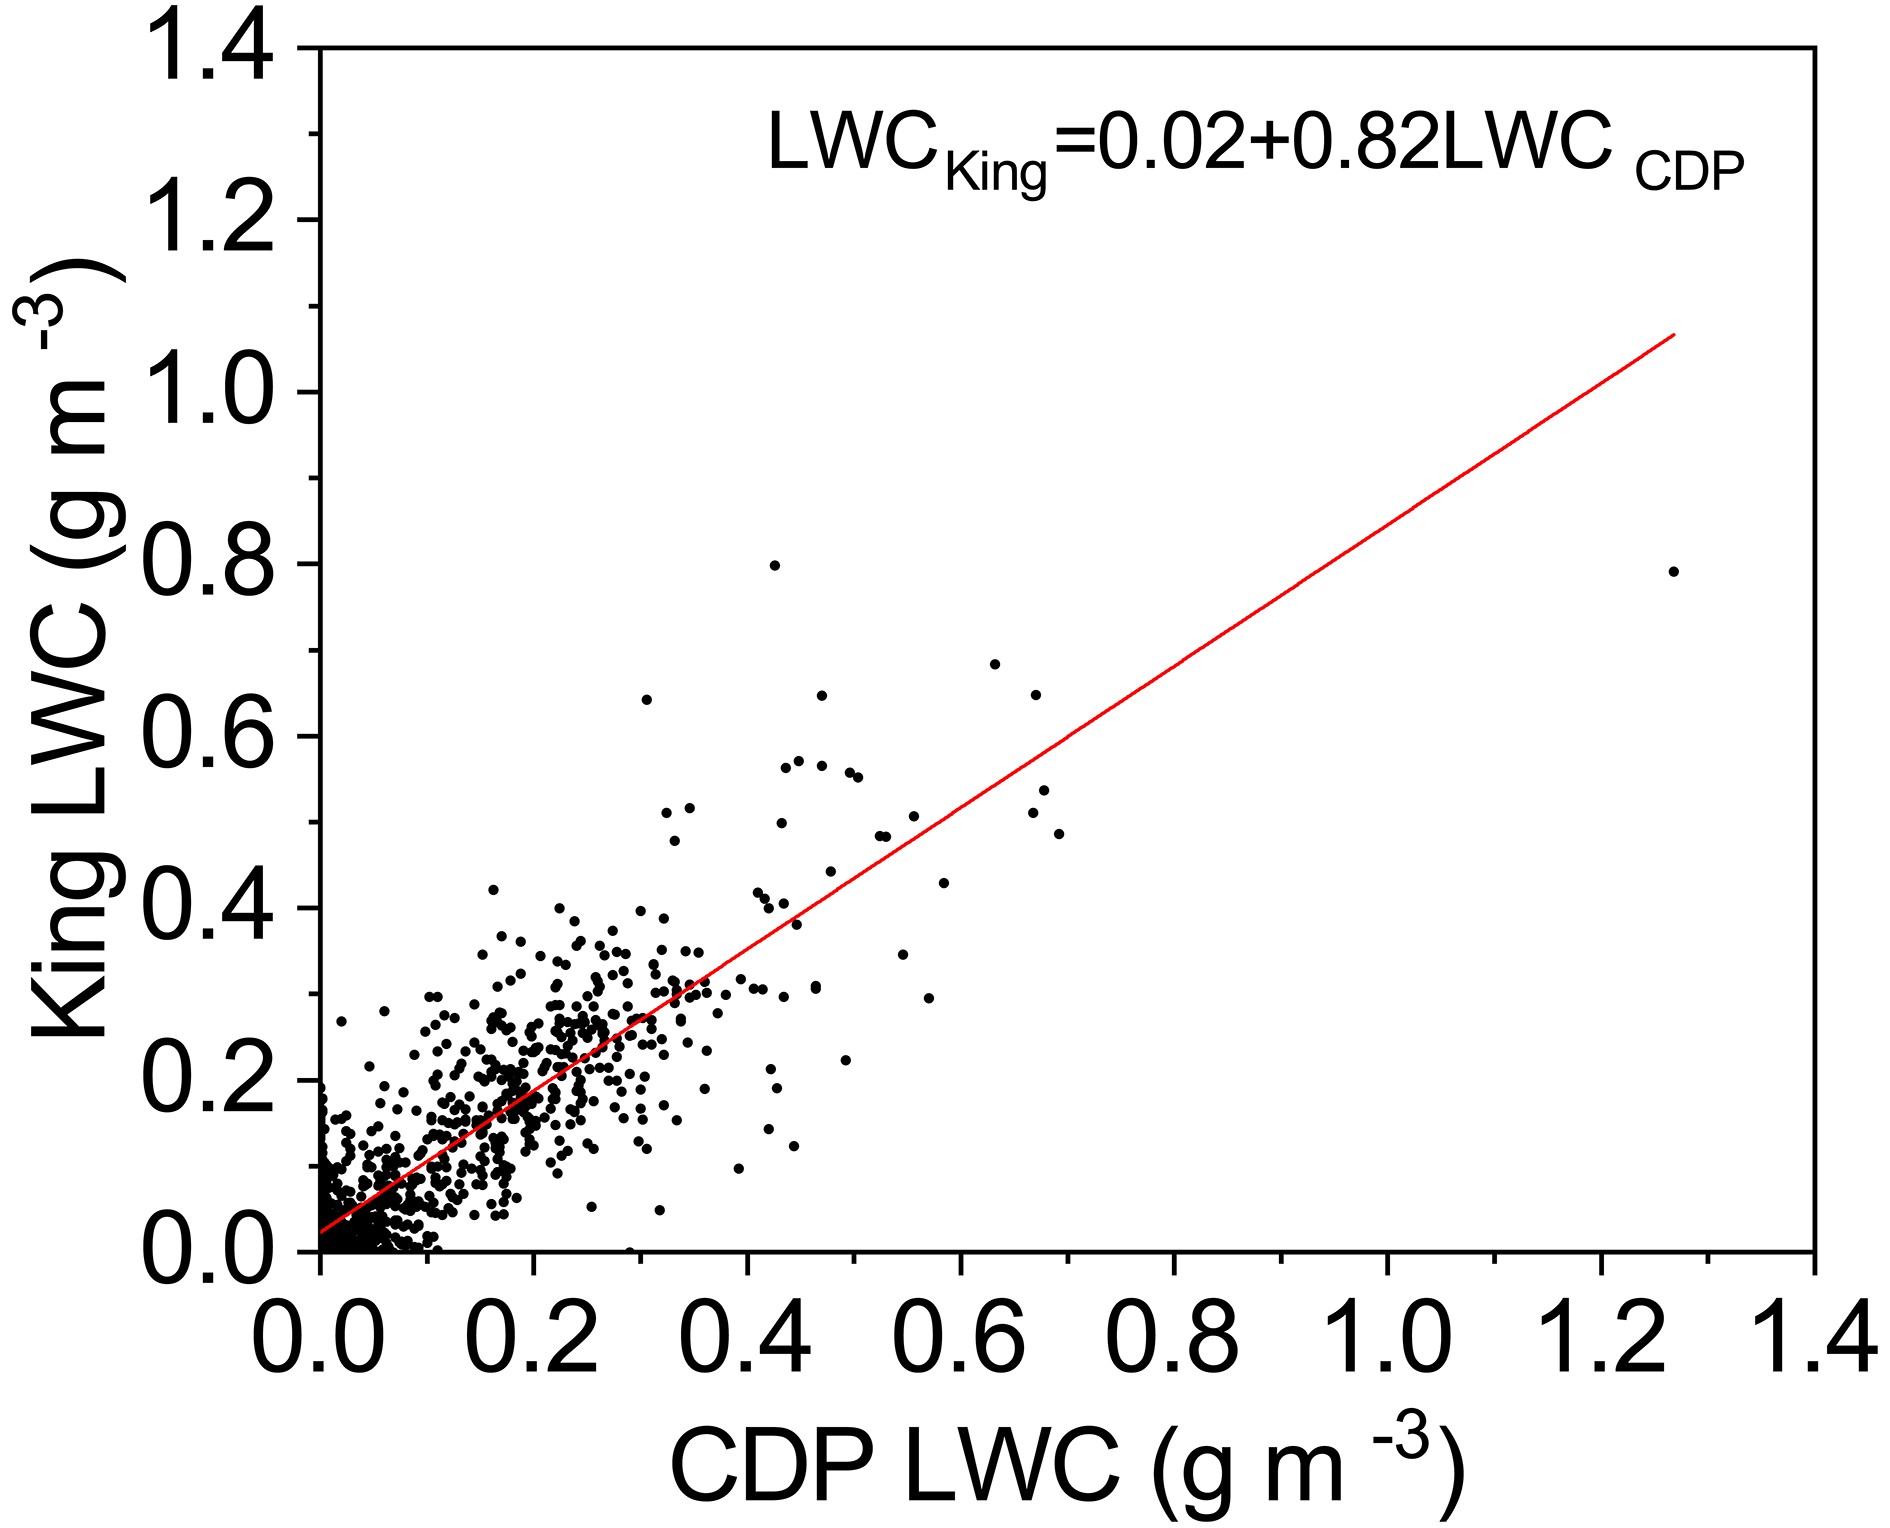 Figure1. Comparison of the King LWCs and CDP-estimated LWCs. Each data point represents a 5-s time average. The red line is the linear best fit line with a correlation coefficient of 0.87.
The CDP and King probe were used together in this study to identify the existence of supercooled liquid water for discriminating between mixed-phase and ice clouds. We only analyzed clouds colder than 0ЁуC in the study, not referring to liquid-only cloud regions. Ice particles were observed in all the flight legs listed in the study; therefore, the criteria to identify the mixed-phase and ice clouds did not include particle concentrations from the 2D-S. The criteria are listed in Table 2. The minimum CDP concentration of 10 cm?3 and the King LWC of 0.1 g m?3 were chosen to identify mixed-phase clouds following Lance et al. (2010). When one of the above two criteria was met, we referred to the cloud as a mixed-phase cloud. When the CDP concentration was between 1 and 10 cm?3 and the King-LWC was less than 0.1 g m?3, we could not state with confidence whether supercooled liquid water existed in the cloud. Although the CDP was equipped with anti-shattering tips, the probe could still be contaminated by shattering artifacts in the presence of ice. Ice particles may cause artificial counts of up to 1 cm?3 or higher in pure ice clouds. For strict exclusion of supercooled liquid water from ice clouds, clouds were only identified as an ice cloud region when the CDP concentration was less than 1 cm?3 and the King LWC was less than 0.1 g m?3. In this way, we attempted to eliminate the contamination of supercooled liquid water when calculating the ice water content (IWC) from the observed ice particle concentrations.
| Phase | Criteria |
| Mixed-phase | NCDPЁн10 cm?3 or LWCKingЁн0.1 g m?3 |
| Ice or mixed?phase | 1< NCDP<10 cm?3 and LWCKing<0.1 g m?3 |
| Ice | NCDPЁм1 cm?3 and LWCKing<0.1 g m?3 |
Table2. The criteria to identify mixed-phase and ice clouds.
2
2.2. IWC calculation
For IWC measurements, the aircraft in Hebei was equipped with a Nevzorov hotwire TWC/LWC probe. However, due to the problem of a baseline drift for the Nevzorov TWC, its accuracy still needs testing. Therefore, the Nevzorov probe was not used in this study. Instead, we calculated the IWC from the particle size distribution measurements.The particle mass is usually expressed in the form m = a Db, where D is taken to be a representation of the particle size and a and b are empirically derived terms. Different sets of parameters have been derived from previous studies (Locatelli and Hobbs, 1974; Mitchell et al., 1990; Brown and Francis, 1995; Baker and Lawson, 2006; Heymsfield et al., 2010; Wang et al., 2015). The relationship from Brown and Francis (1995) has been widely used in IWC calculations. However, their IWC estimates were based on observations primarily in the temperature range from ?20ЁуC to ?30ЁуC, with particle sizes between 200 and 800 ІЬm. The relationship from Baker and Lawson (2006) was developed based on the dataset from Mitchell et al. (1990). This dataset was collected at the surface and was not necessarily representative of the various ice particles inside the clouds. In comparison, the relationship from Heymsfield et al. (2010) was from the more recent observations of clouds with broader temperatures ranging from 0ЁуC to ?60ЁуC, and the particle sizes were between 100 and 2000 ІЬm. Therefore, we used the mass-dimensional relationship of Heymsfield et al. (2010) to calculate the ice water content. The relationship is of the form m(D) = 0.00528 D2.1, where m represents the mass of an ice particle in grams and D is the maximum particle dimension in centimeters, which is valid for both stratiform and convective clouds over a wide range of temperatures and particle sizes. Note that localized high ice particle concentrations may lead to deviations, and the coefficient a is higher by approximately a factor of 2 for convectively generated versus stratiform ice clouds.
The particle size distributions were derived from a combination of the CDP, 2D-S, and HVPS measurements. The combined particle size distribution was then used to derive the ice water content. Figure 2 shows example size distributions from the three instruments at three different temperatures. According to the figure, the overlap between 10 and 30 ІЬm in the examples allows for the combination of the CDP and 2D-S. For smoothing of the combined size distribution, the breakpoint between the CDP and 2D-S was chosen as 25 ІЬm. and the breakpoint between the 2D-S and HVPS was 1105 ІЬm. The combined particle size distribution included particles with maximum sizes between 2 and 24 ІЬm, 25 and 1105 ІЬm and 1125 and 2 cm, from the CDP, 2D-S, and HVPS, respectively. The concentration data from the CDP, 2D-S, and HVPS were averaged over 5-s intervals to reduce spurious variability.
 Figure2. Sample size distributions showing the overlap among the CDP, 2D-S, and HVPS at (a) 0742:21 UTC, (b) 0746:46 UTC, and (c) 0808:56 UTC.
 Figure3. Geopotential height (units: m) and winds (units: m s?1) for 500 hPa at 0000 UTC 22 May 2017 from the National Centers for Environmental Prediction reanalysis data. The red square indicates the study region.
Figure 4 presents the observed 4-h accumulated precipitation from 0300 to 1500 UTC (valid at 0700, 1100, and 1500 UTC 22 May 2017) from the rain gauges. Figure 4a shows a southwest-northeast oriented band of accumulated rainfall over the central and northern provinces, with the precipitation center to the southwest of Hebei Province. For the study region, light rainfall with a peak value of 52.7 mm was found in the northwestern part, indicating the initiation of precipitation. In comparison, more rainfall was observed during the process of southward movement between 0700 and 1100 UTC (Fig. 4b). Rainfall covered most of the study region, with a higher maximum value of 81.4 mm. By 1500 UTC (Fig. 4c), the precipitation center had already moved out of Hebei Province. The 4-h accumulated precipitation in the study region decreased to generally less than 25 mm. Therefore, a relatively higher precipitation center with 4-h rainfall values larger than 25 mm was primarily located in the southwestern part of the study region from 0700 to 1100 UTC.
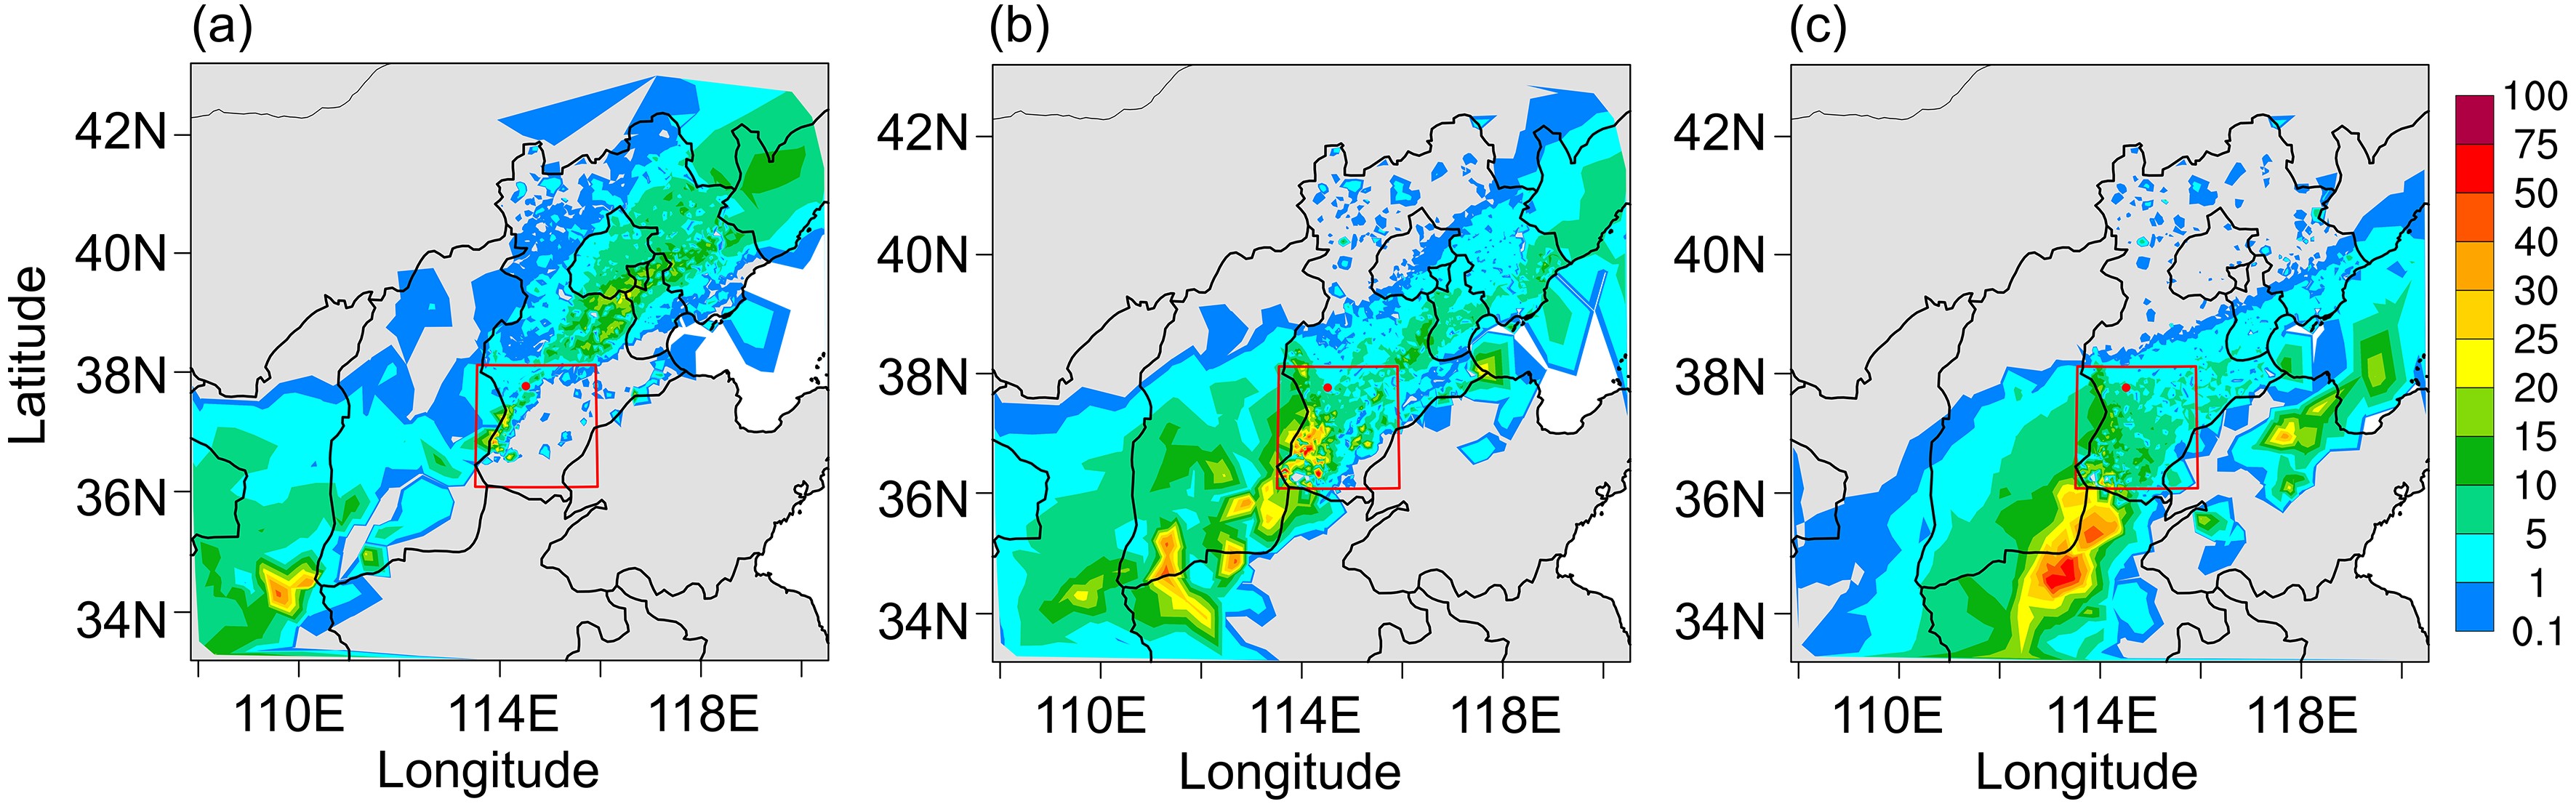 Figure4. Observed 4-h accumulated precipitation (units: mm) from (a) 0300 to 0700 UTC, (b) 0700 to 1100 UTC and (c) 1100 to 1500 UTC 22 May 2017. The red square indicates the study region, and the red dot represents the location of the radar site at Shijiazhuang.
Considering the synoptic setting and precipitation formation, aircraft measurements were conducted in the study region from 0703 to 1032 UTC. The flying height did not exceed 7.26 km due to the restrictions of the aircraft. By the time of aircraft measurement, the cloud-top height was approximately 8 km, and the 0ЁуC layer was at approximately 3.8 to 4.0 km. The aircraft departed from Zhengding airport, which was very close to the Shijiazhuang radar station (indicated with a red dot in Fig. 4, longitude: 114.7ЁуE; latitude: 38.3ЁуN; 134.8 m above MSL). Then, the aircraft flew to the southwest of the radar center, where evident precipitation was observed. Figure 5 shows the aircraft track between 0703 and 1022 UTC. The aircraft flight pattern first consisted of a gradual ascent from 2 km to 7.26 km between 0737 and 0753 UTC. After that, the aircraft continued to fly southwest toward the embedded convective cells at 7.26 km. The aircraft then descended to 2.1 km between 0808 and 0823 UTC and ascended from 2.1 to 7.26 km between 0831 and 0848 UTC. The aircraft then made another descent, ascent, and horizontal penetration at 7.26 km in the process of flying back to the airport. As the study focused on ice particle characteristics, the data at temperatures colder than 0ЁуC (at approximately 4 km) were divided into six flight legs with colored traces, as shown in Fig. 5. The flight leg features, including the beginning and end times, altitudes, and cloud temperatures are listed in Table 3. The flight paths in the present study included three upward spirals, two downward spirals, and one constant-altitude penetration at 7.26 km.
 Figure5. Aircraft track (black trace) starting from S between 0703 and 1022 UTC. The six flight legs shown in Table 2 are highlighted in colored traces.
| No | Time (UTC) | Altitude (km) | Temperature (ЁуC) |
| Leg 1 (ascent) | 0741:51ЈC0753:30 | 4.23ЈC7.26 | ?0.9ЈC ?15.5 |
| Leg 2 (descent) | 0808:31ЈC0818:00 | 7.26ЈC3.91 | ?15.7ЈC ?1.2 |
| Leg 3 (ascent) | 0836:01ЈC0848:00 | 4.27ЈC7.26 | ?1.7ЈC ?16.4 |
| Leg 4 (horizontal penetration) | 0848:01ЈC0908:35 | 7.26 | ?15.3ЈC ?16.1 |
| Leg 5 (descent) | 0927:01ЈC0934:50 | 7.26ЈC3.91 | ?16.9ЈC ?0.6 |
| Leg 6 (ascent) | 0952:40ЈC1004:30 | 3.82ЈC7.26 | ?0.2ЈC ?17 |
Table3. Flight leg features, including beginning and end times, altitudes, and cloud temperatures.
To clearly illustrate the cloud development and flight track, Figure 6 presents the reflectivity fields from the Shijiazhuang radar observations with an overlay of the flight track at the ending times of the four legs. At 0754 UTC (Fig. 6a), a southwest-northeast oriented cloud region with a general reflectivity of 20ЈC30 dBZ was observed. The scattered region to the southwest of the radar center had higher values of 35ЈC40 dBZ, indicating the existence of convection within the stratiform cloud system. The first spiral ascent (leg 1) from 4.2 to 7.2 km between 0741 and 0753 UTC was at the echo region of approximately 20ЈC30 dBZ. According to the rain gauge observations, precipitation started at 0700 UTC below the aircraft measurement region. The 1-h accumulated precipitation during 0700 and 0800 UTC below leg 1 was 7.6 mm.
 Figure6. PPI radar display of the radar reflectivity factor (Units: dBZ) from the Shijiazhuang radar 0.7Ёу elevation with an overlay of the flight track (red traces starting from S) between (a) 0703 and 0753 UTC, (b) 0703 and 0934 UTC, (c) 0703 and 0848 UTC, and (d) 0703 and 1004 UTC.
The cloud system then moved south. The most evident change was the gradual organization of the convective region in the southwestern part, from a few scattered small regions to one large echo region at 0848 (Fig. 6b) with reflectivity values between 30 and 40 dBZ. Therefore, the first spiral descent (leg 2) between 0808 and 0818 UTC was at one of the small convective regions, while the second spiral ascent (leg 3) between 0836 and 0848 UTC was conducted at the edge of the large convective region. The 1-h accumulated precipitation during 0800 and 0900 UTC, below legs 2 and 3, was 10.2 mm and 6.8 mm, respectively.
By 0930 UTC (Fig. 6c), the southwestern convective region had moved south and the region with values between 35 and 40 dBZ was much smaller, indicating a weakening trend. The horizontal penetration at 7.36 km between 0848 and 0908 UTC was in the region with values of approximately 30 dBZ.
As the aircraft flew back to the airport, the second spiral descent (leg 5) between 0927 and 0934 was in the more homogeneous stratiform region with reflectivity values of approximately 25 dBZ. Similarly, the third spiral ascent (leg 6) was also in the stratiform region with values of 20 dBZ (Fig. 6d). The 1-h accumulated precipitation during 0900 and 1000 UTC, below the legs 5 and 6, was 6.1 mm and 0.6 mm, respectively.
Therefore, the five spirals including legs 1, 5, and 6 were in the more homogeneous stratiform regions, while the spirals on legs 2 and 3 were in one embedded convective cell and at the edge of the convective region, respectively. The hourly precipitation rates below the convective region were higher, with values up to 10 mm h?1. In contrast, relatively lower precipitation rates were observed below the other cloud regions. The precipitation rates below leg 6 were the lowest, at less than 1 mm h?1. Thus, the cloud system was in an active state during the measurements.
Figure 7 shows the vertical distribution of the CDP-measured particle concentrations, the CDP LWCs, and the King LWCs on legs 1, 2, and 3. On flight leg 1 (Fig. 7a), the droplets were primarily measured at temperatures warmer than ?11ЁуC, with concentrations peaking at 116 cm?3. The droplets at this stage were relatively small since the concentrations of droplets larger than 24 ІЬm were less than 0.5 cm?3. Therefore, the derived CDP LWCs (Fig. 7b) were extremely low, at no more than 0.04 g m?3. Similarly, the King probe (Fig. 7c) also measured a very low LWC with a peak of 0.03 g m?3. Hence, the ice region was determined to be in the temperature regions colder than ?11.4ЁуC, where the CDP concentrations were less than 0.25 cm?3 and both the CDP and King LWCs were less than 0.01 g m?3.
 Figure7. Vertical distribution of the (a) CDP concentrations, (b) CDP LWC and (c) King LWC on leg 1; (d) CDP concentrations, (e) CDP LWC and (f) King LWC on leg 2; (g) CDP concentrations, (h) CDP LWC and (i) King LWC on leg 3. The red solid horizontal lines represent the transition to ice clouds. The regions between the dashed and solid lines represent the unidentified clouds.
Notably, at temperatures between ?6.6ЁуC and ?8.5ЁуC, the CDP-measured cloud particle concentrations were extremely low, at less than 0.5 cm?3. No supercooled liquid water was detected from either the CDP or the King probe. According to our criteria for measuring LWCs, that region also belonged to the ice region. The 2D-S observed ice crystal concentrations in that region varied from 8 to 20 L?1 with mean volume diameters from 476 to 1100 ІЬm, and the large particles were primarily dendritic and broad-branched crystals. That indicated vigorous growth of ice particles. The well-distinguished crystal branches suggested that vapor deposition was the dominant growth process. Generally, dendrites and sector plates grow under water-saturated conditions. Therefore, it should have been a mixed-phase region with extremely low liquid water contents at an earlier stage and the ice particle growth depleted cloud droplets.
On leg 2 (Fig. 7d), the CDP-measured total droplet concentration at temperatures warmer than ?6ЁуC was typically greater than 40 cm?3, peaking at 231 cm?3. Large droplets with diameters larger than 24 ІЬm had concentrations that varied from 1.4 to 14 cm?3 and were found within the temperatures ranging from ?4.4ЁуC to ?4.9ЁуC. A comparison of LWCs (Figs. 7e and 7f) from the CDP and King probes suggested that both probes detected evident supercooled cloud water at temperatures between ?4ЁуC and ?5ЁуC, with peaks of 0.45 and 0.57 g m?3 at the same temperature of ?4ЁуC. The two probes were consistent at temperatures warmer than ?5ЁуC. However, the CDP detected virtually no liquid water at temperatures colder than ?6ЁуC since small particle concentrations were less than 0.4 cm?3. In contrast, the King probe still measured LWCs varying from 0.05 to 0.2 g m?3, which was probably a baseline drift due to contamination from ice crystals. Previous research suggested that it is difficult for the King probe to accurately measure small LWCs in mixed-phase conditions. To minimize the errors caused by the baseline drift of the King probe, Cober et al. (1995) artificially zeroed the results from the King probe when the FSSP concentrations were less than 6 cm?3.
CPI images suggested the existence of rimed ice particles at temperatures between ?10ЁуC and ?1ЁуC (Fig. 8). Unfortunately, most of the CPI images taken between 0808:31 and 0812:20 UTC (?15.7ЁуC to ?9.9ЁуC) on leg 2 were out of focus. According to Fig. 8. moderately rimed particles were observed at ?9.7ЁуC and ?6ЁуC. Since broad-branched crystals were predominant, aggregates of the broad-branched crystals and plates or capped columns (Figs. 8a and 8b) were observed. The rimed particle observed at ?5.9ЁуC (0814:08 UTC, Fig. 8c) was an assemblage of a few plates.
 Figure8. Example CPI images of ice particles in the embedded convective region.
Large radiating plates without riming were found in both the embedded convective and stratiform regions. Since plates predominated at temperatures from 0ЁуC to ?4ЁуC and ?8ЁуC to ?22ЁуC, combined with the vertical motions, it was reasonable to see plate-like crystals and plate aggregates at temperatures between ?4ЁуC and ?6ЁуC. The complex plate-like assemblages (e.g., Fig. 8d) that originated at temperatures colder than ?8ЁуC experienced riming and aggregation during descent.
Another feature between ?4ЁуC and ?5ЁуC was the evident increase in needles and needle combinations. The needles coexisted with partially rimed particles during this stage. Riming on needles was not easy, as the onset of riming on columnar particles was dependent on the length along the minor axis (Ono, 1969). At widths between 50 and 90 ІЬm, the onset of riming was critical, and riming was unlikely to occur on columnar crystals with widths of less than 50 ІЬm. A few lightly rimed columns were also observed from the CPI. The column in Fig. 7i had a width of 87 ІЬm, indicating a transition from pristine to rimed columns. Moderately rimed columns (Figs. 8j and 8k) were also observed.
Heavily rimed particles with roundness values of 0.71 and 0.56 are shown in Figs. 8e and 8g. At temperatures between ?3ЁуC and ?6ЁуC, the ice particles were generally moderately to heavily rimed. This is understandable since the LWC increased to over 0.1 g m?3 at temperatures between 0ЁуC and ?5ЁуC.
Therefore, the rimed particles from CPI images suggested the existence of supercooled liquid water in the convective region from ?6ЁуC to ?10ЁуC. For the strict exclusion of mixed-phase regions, the ice region on leg 2 was determined to be associated temperatures colder than ?15ЁуC, where the CDP concentrations were less than 0.4 cm?3 and the King LWC was less than 0.1 g m?3.
On leg 3 (Fig. 7g), the cloud droplet concentrations peaked at 322 cm?3 at ?2.5ЁуC but decreased rapidly to less than 1 cm?3 at temperatures colder than ?6ЁуC. The supercooled water was primarily distributed at temperatures warmer than ?6ЁуC. A comparison of LWCs from the CDP and King probe suggested consistent results at levels lower than ?6ЁуC, with peak values of 0.67 and 0.56 cm?3, respectively. For the LWC at temperatures colder than ?6ЁуC, the King probe once again showed systematically higher values than the CDP due to its response to ice crystals. Therefore, temperatures between ?6ЁуC and ?14.3ЁуC were again classified as unidentified regions. According to the criteria of the CDP concentrations less than 1 cm?3 and King LWCs less than 0.1 g m?3, the ice region occurred at temperatures colder than ?14.3ЁуC.
Figure 9 shows the vertical distribution of the CDP-measured particle concentrations, the CDP LWCs, and the King LWCs on legs 5 and 6. During flight legs 5 and 6, the concentrations of the cloud particles decreased dramatically, with low values of 94 cm?3 at ?2.9ЁуC and 40 cm?3 at ?1.5ЁуC, respectively. Since most cloud particles were small at temperatures warmer than ?4ЁуC and the concentrations of particles between 24 and 50 ІЬm were predominantly less than 0.5 cm?3, the measured LWCs were less than 0.1 g m?3. Accordingly, the top of the supercooled liquid water for legs 5 and 6 was identified at lower levels of ?5ЁуC and ?3.6ЁуC.
 Figure9. Vertical distribution of the (a) CDP concentrations, (b) CDP LWC and (c) King LWC on leg 5; (d) CDP concentrations, (e) CDP LWC, and (f) King LWC on leg 6. The red horizontal lines represent the discrimination between the mixed-phase and ice clouds.
For the stratiform region, radiating plates and rimed plate aggregations were commonly observed at temperatures colder than ?4ЁуC, where ice particles grew predominantly via vapor deposition. By comparison, only a few moderately rimed particles were found at temperatures warmer than ?3.5ЁуC, and riming did not contribute significantly to particle growth. Aggregates of plates could also be seen in lower regions of the cloud.
Therefore, for the cloud region observed on leg 1, the top of the supercooled liquid water extended to ?11ЁуC. The occurrence of dendritic precipitation particles in the ice region at temperatures between ?6.6ЁуC and ?8.5ЁуC on leg 1 suggested that the growth of ice particles might have depleted the supercooled liquid water before the measurement. The supercooled liquid water in the embedded convective cells primarily occurred at temperatures warmer than ?10ЁуC with maxima of approximately 0.57 g m?3. For flight leg 1, the precipitation started during the period between 0700 and 0800 UTC, which coincided with the same time period as the aircraft measurements. In contrast, for legs 2 and 3, the aircraft measurements started 1-h later than the precipitation onset time. The particle growth associated with the precipitation falling at an earlier time might have removed cloud droplets at temperatures between ?10ЁуC and ?15ЁуC in the convective region.
5.1. Vertical variation in particle size distributions
Figure 10 shows the combined particle size distributions at approximately ?3ЁуC, ?5ЁуC, ?10ЁуC, and ?15ЁуC across the five spirals. The particle size distributions were from the 5-s averaged values. The particle size distributions for leg 1 (Fig. 10a) became generally broader from ?15ЁуC to ?3.2ЁуC, with the maximum dimensions increasing from almost 2000 ІЬm to 6000 ІЬm. Large particles with maximum dimensions greater than 1000 ІЬm increased with decreasing height, suggesting ice crystal growth from small to large sizes within the cloud. The concentrations of 300 ІЬm particles first peaked in the upper cloud at ?15ЁуC and then in the lower cloud at ?3.2ЁуC, while the concentrations were relatively lower in the middle cloud layer between ?5ЁуC and ?10ЁуC. The first peak could be explained by the initial ice nucleation which produced more small ice crystals in the upper part than in the lower part. The second peak at ?3.2ЁуC corresponded with a significant increase in particle (25 to 505 ІЬm) concentrations from 1 L?1 at ?5ЁуC to 70 L?1 at ?3.2ЁуC. An overview of 2D-S images suggested predominantly columns and needles at approximately ?3ЁуC. The high particle concentrations were assumed to be associated with secondary ice production processes. However, the cloud conditions did not fit into the Hallett-Mossop criteria due to the lack of large supercooled droplets. Knight (2012) suggested that another ice multiplication mechanism that does not involve riming occurs at temperatures of approximately ?5ЁуC. The thin needles could shatter on impact with other crystals and provide splinters similar to the Hallett-Mossop process. We will further evaluate the production mechanism of the needles within the mixed-phase stratiform clouds using more in situ observations. Figure10. Combined particle size distributions at various temperatures on (a) leg 1, (b) leg 2, (c) leg 3, (d) leg 5, and (e) leg 6.
For the convective region (leg 2, Fig. 10b), the increase in the concentration of particles larger than 500 ІЬm could be seen at ?10ЁуC and ?15ЁуC, and the particle size distributions at all the levels became even broader than those on leg 1. The significant increases in larger particles were associated with dendrites and broad-branched crystals. In comparison, for the stratiform regions (Figs. 10d and 10e), the sizes of the largest particles and concentrations of particles in the size range 200 to 1000 ІЬm decreased dramatically. Therefore, the convective region had broader particle size distributions than the stratiform region.
Table 4 lists the measurements for the selected temperature regions from legs 2 and 5. A comparison of the precipitation particle mean volume diameters from the HVPS is shown in the table. The particle mean volume diameter is primarily used in microphysics parametizations and related calculations. It can be expressed as
| Temperature | HVPS DMVDa (ІЬm) | HVPS Dmaxb (ІЬm) | N2D-S (25ЈC505 ІЬm) | N2D-S (505ЈC1105 ІЬm) |
| ?15 (Leg 2) | 1340 | 5925 | 10 | 1.94 |
| ?10 (Leg 2) | 3420 | 10950 | 7 | 0.5 |
| ?5 (Leg 2) | 2040 | 6225 | 357 | 0.9 |
| ?3 (Leg 2) | 2240 | 7950 | 108 | 0.5 |
| ?15 (Leg 5) | 996 | 2400 | 1.5 | 0.4 |
| ?10 (Leg 5) | 1160 | 5025 | 1.6 | 0.2 |
| ?5 (Leg 5) | 1380 | 4725 | 1.6 | 0.5 |
| ?3 (Leg 5) | 1500 | 5025 | 4.3 | 0.3 |
| a DMVD=mean volume diameter, bDmax=maximum dimension. | ||||
Table4. List of measurements for selected temperature regions from legs 2 and 5.
where


It suggested that precipitation particle sizes in the convective region (leg 2) were generally larger for each temperature than those in the stratiform region (leg 5). This difference corresponded with larger maximum particle dimensions and wider particle size distributions in the convective region. The most significant increases in the particle maximum sizes on leg 2 were from ?15ЁуC to ?10ЁуC, with values increasing from 5925 to 10 950 ІЬm. These differences were associated with particle habit variations from broad-branched crystals at ?15ЁуC to large dendrites and their aggregates at ?10ЁуC. In comparison, the maximum precipitation particle dimensions from ?15ЁуC to ?10ЁуC on leg 6 also increased, but lower values were observed from 2400 to 5025 ІЬm since the proportion of smaller plate-like crystals increased in the stratiform region. Therefore, a significant shift in the particle size distributions toward larger particles occurred in the convective region from ?15ЁуC to ?10ЁуC.
Another difference between the convective and stratiform regions was the particle concentrations with a size range of 25ЈC505 ІЬm at temperatures between ?3ЁуC and ?5ЁуC. High particle concentrations of 357 and 108 L?1 at ?3ЁуC and ?5ЁуC, respectively, were observed on leg 2, while the particle concentrations on leg 5 were only 1.6 and 4.3 L?1 at ?3ЁуC and ?5ЁуC, respectively. This finding indicated secondary ice particle processes in the convective cells. Many previous studies (Rangno and Hobbs, 2001; Heymsfield and Willis, 2014; Field et al., 2017) have discussed the occurrence of columns and needles since they were thought to be associated with secondary ice production. In situ observations of stratiform clouds suggested that needles occurred most frequently at temperatures between 0ЁуC and ?5ЁуC (Korolev et al., 2000). Woods et al. (2008) found that needle-like crystals increased suddenly at ?7ЁуC and that the rime-splintering process was likely responsible for new particle formation at temperatures warmer than ?10ЁуC. We observed a large number of columns and needles across leg 2 at temperatures between ?3ЁуC and ?6ЁуC. The combined presence of large droplets exceeding 24 ІЬm in diameter and the evident increase in needles within embedded convective cells suggested that the Hallett-Mossop process was responsible for the presence of columns and needles at approximately ?5ЁуC. In contrast, needles were rarely observed on leg 5, where the cloud conditions did not fit into the Hallett-Mossop criteria due to the lack of large supercooled droplets.
A comparison of column and needle occurrence across the five spirals suggested that evident columns and needles occurred on legs 1, 2, and 6, but not on legs 3 and 5, which indicated inhomogeneous cloud conditions. It would be interesting to study the transportation of cloud particles with the help of horizontal penetration at temperatures warmer than ?10ЁуC. Heymsfield and Willis (2014) found that needles were observed primarily in regions of low liquid water content (< 0.1 g m?3) and weak vertical motions (?1 to 1 m s?1). This result may not apply to the embedded convective regions since the supercooled liquid water content on leg 2 was higher, peaking at 0.57 g m?3.
2
5.2. Variation in particle size distributions at -16ЁуC
From 0848 to 0908 UTC, the aircraft performed five in situ circles at 7.26 km. Fig. 10 shows the observed radar reflectivity at 0848 UTC and the flight track. Radar observations at 0848 UTC (Fig. 11a) suggested that the clouds had a general reflectivity of 20ЈC30 dBZ. Embedded convective cells with maximum values of 37 dBZ were observed in the southern part. The sample region was at the edge of the embedded convective region. Each in situ cycle lasted for approximately four minutes (Fig. 11b). Measured reflectivity values in the sample region varied from 26 dBZ at 0848 UTC, 30 dBZ at 0854 UTC, 36 dBZ at 0900 UTC to 33 dBZ at 0906 UTC. The 1-h accumulated precipitation below the sample region increased from 6.8 mm from 0800 to 0900 UTC to a peak value of 8.8 mm from 0900 to 1000 UTC. Therefore, aircraft measurements during this period corresponded to steady and moderate surface precipitation. Figure11. (a) PPI radar display of the radar reflectivity factor (in dBZ) at 0848 UTC and (b) the flight track during 0848 and 0908 UTC. The flight track is also marked by red circles in (a).
The CDP-measured droplet concentrations at 7.26 km were mostly less than 0.4 cm?3, which was almost below the detectable limits. The King LWC at the same height was less than 0.1 g m?3. Hence, the sampled region at 7.26 km from both the spirals and the horizontal penetration belonged to the ice cloud region.
Figure 12 shows the mean combined particle size distributions at 7.26 km from the five circles. A general decrease in concentrations for ice particles in the size range of 25 to 1105 ІЬm could be seen. An overview of 2D-S concentrations suggested that concentrations of small particles in the size range of 25 to 505 ІЬm decreased from 2.91 L?1 on circle 1 to 0.45 L?1 on circle 5, and concentrations of larger particles in the size range of 505 to 1105 ІЬm also decreased, with values from 9.42 to 1.92 L?1. At the same time, the HVPS mean volume diameters generally increased from 941 ІЬm on circle 1 to 1022 ІЬm on circle 5. The growth of small ice crystals likely contributed to the increase in the sizes of larger particles. The 2D-S images suggested a mixture of particle habits varying from plates and broad-branched crystals to dendrites and irregulars. The well-distinguished branches suggested that most particles were pristine crystals growing predominantly via vapor deposition. Since plates and broad-branched crystals were the common crystal types at ?16ЁуC, aggregates of such particles could be seen.
 Figure12. Mean combined particle size distributions at 7.26 km from the horizontal penetration.
Figure 13 shows the time series of IWC during 0848 and 0908 UTC. According to Fig. 13, the estimated IWC fluctuated from the peak value of 0.8 g m?3 to relatively lower values of less than 0.2 g m?3. Relatively higher IWCs, including 0.8 g m?3 at 0856 UTC, 0.54 g m?3 at 0900 UTC, and 0.55 g m?3 at 0904 UTC, occurred in regions where there were many large radiating crystals (Fig. 14). The HVPS mean volume diameters in the three regions were over 1400 ІЬm, which were much higher than the mean values of approximately 1100 ІЬm. The large particle sizes indicated that the ice particles grew vigorously at that level. With the falling out of these large crystals, it was reasonable to see the general decrease in IWC from 0848 to 0908 UTC.
 Figure13. Time series of IWC during 0848 and 0908 UTC.
 Figure14. Example 2D-S images observed on flight leg 4 at 7.26 km.
Supercooled liquid water was found predominantly at temperatures warmer than ?6ЁуC and decreased substantially at colder temperatures. The top of the supercooled liquid water cloud region was observed to be at temperatures colder than ?11ЁуC and warmer than ?15ЁуC. Significant amounts of supercooled liquid water with maximum values of up to 0.57 g m?3 were observed from ?3ЁуC to ?6ЁуC in the embedded convective cells, while the peak LWC was generally less than 0.1 g m?3 in the stratiform regions.
For the convective region, moderately to heavily rimed ice particles were observed at temperatures warmer than -10ЁуC. The rimed particles grew predominantly from plates and broad-branched crystals, with few from columns. For the stratiform region, ice particles grow predominantly through vapor deposition, and only a few moderately rimed particles are found at temperatures warmer than ?3.5ЁуC. Thus, riming does not contribute significantly to particle growth in the stratiform regions.
There are two distinct differences in particle size distributions between convective and stratiform regions. One difference is that the convective region has generally broader particle size distributions than the stratiform region, especially at temperatures colder than ?10ЁуC. For the case in this study, a significant shift in particle size distributions toward larger particles occurs in the convective region from ?15ЁуC to ?10ЁуC, with the maximum particle dimensions increasing from less than 6000 ІЬm to over 1 cm. This change is due to habit variations from broad-branched crystals to large dendrites and their aggregates.
The other difference is that large concentrations of small particles (25ЈC205 ІЬm) are observed at temperatures between ?3ЁуC and ?5ЁуC in the convective region, where rimed ice particles and needles coexist. The cloud conditions within the convective region fit into the Hallett-Mossop criteria, and the associated rime splintering is assumed to be responsible for the observed high concentrations at those temperature ranges. In comparison, the cloud conditions within the stratiform regions do not fit into the Hallett-Mossop criteria due to the lack of large supercooled droplets, and the small particle concentrations are considerably lower.
The updraft data are useful to demonstrate the intensity of the embedded convection and the substantial changes in crystal habits due to vertical motions. As the accuracy of vertical wind measurements has not been well assessed, the updraft data were not analyzed in this study. Further aircraft measurements are required to analyze the spatial variability of cloud microstructure in stratiform clouds with embedded convection. Modeling work is required to test the impact of the riming process on particle size distributions and particle fall speeds.
Acknowledgements. This work was supported by the National Key Research and Development Program of China (Grant Nos. 2019YFC1510300 and 2018YFC1507900) and the National Natural Science Foundation of China (Grant Nos. 41575131).
