HTML
--> --> -->Terrain affects atmospheric circulations through both its thermal and dynamic influences, and significantly impacts the formation and development of precipitation systems (Wu et al., 2007; Boos and Kuang, 2010; Zhang et al., 2018). Precipitation enhancement often occurs on the windward slope of mountains; correspondingly, the precipitation on the leeward slope is significantly reduced (Miltenberger et al., 2016; Fu et al., 2018). A “seeder–feeder” mechanism is widely used to explain the phenomenon of increased precipitation over mountains, especially upon the windward slopes (Bergeron, 1935, 1965). The pre-existing, upper-level precipitating cloud (seeder) produces numerous small droplets, while the low-level cloud or fog (feeder) is formed due to orographic lift of moist flow. When small droplets fall to the feeder cloud, they quickly grow via collision, coalescence or accretion (Browning, 1980; Viale et al., 2013). Thus, the near-surface droplet number density depends on the seeder cloud, whereas its mass mainly comes from the feeder cloud. Another important microphysical mechanism related to orographic precipitation is the warm rain process. This process occurs when precipitation droplets form below the FzH, and quickly grow and fall to ground when the upslope flow is very humid (White et al., 2003; Neiman et al., 2005; Kingsmill et al., 2006). Compared to the “seeder–feeder” mechanism, the warm rain process produces smaller droplets. Using S-band radar to investigate the droplet size distribution of precipitation in the coastal mountains of California in 2003 and 2004, Martner et al. (2008) found that the warm rain process is mainly associated with convective precipitation (with no bright band in the profile), while the “seeder–feeder” mechanism mainly corresponds to stratiform precipitation (with a bright band).
Compared with either the “seeder–feeder” mechanism or the warm rain process, other microphysical mechanisms within orographic precipitation, including reflectivity maxima above the freezing level (RMAF), have received less attention. The existence of RMAF was first noted by Houze and Medina (2005) on the windward slopes of the Cascade Mountains of Oregon. Kingsmill et al. (2006) suggested that RMAF is only an inherent feature of baroclinic systems since they observed it in both hillsides and valleys in northern California. However, the occurrence of RMAF in valleys could be explained by their location downstream of the hillsides (Medina, 2007). In response to this debate, McMurdie et al. (2018) compared reflectivity properties between precipitation over the ocean surface and precipitation over the windward slopes near the Olympic Mountains. The authors found that RMAF was clearly evident over land whereas it was absent over the ocean, confirming the importance of orographic lifting for RMAF. They also suggested that RMAF is favored when deep, moist, neutrally-stratified, air flow is lifted by a mountain range. These previous studies also showed that the RMAF height usually appears at 1.5 to 2.5 km above FzH in stratiform precipitation (Medina et al., 2007; Zagrodnik et al., 2019). The existence of RMAF was suggested to inhibit near-surface rain rate over slopes, which counters the effect of the “seeder–feeder” and warm rain mechanisms (Medina et al., 2007; McMurdie et al., 2018). Therefore, detailed studies of RMAF can improve our physical knowledge of orographic precipitation as well as our ability to accurately simulate and predict this phenomenon.
So far, the underlying physics of RMAF is not entirely clear. Garvert et al. (2007) found that the RMAF coincided with the enhanced updraft associated with gravity wave activity. It was suggested that the terrain enhanced the middle-level updraft within stratiform precipitation and therefore affected RMAF. However, these previous studies have generally been based on several ground-based observation experiments, which were focused on the west coast of North America. Also, RMAF was previously thought to be related to the activities of baroclinic systems, due to the lack of observations at lower latitudes. Although McMurdie et al. (2018) pointed out that spaceborne radar can be used to study RMAF precipitation, there is currently no quantitative criteria for identifying RMAF. In this manuscript, using fifteen years of orbital precipitation data from the Tropical Rainfall Measuring Mission (TRMM) Precipitation Radar (PR), we first establish a quantitative identification method for the RMAF structure within radar echoes. We then reveal the global distribution of RMAF frequency and its relation to terrain elevation, and finally further investigate the differences in the vertical structure and microphysical processes between precipitation systems with and without RMAF.
2.1. TRMM 2A25 product
TRMM PR is the first space-borne Ku-band (13.8 GHz) meteorological radar, with a geographic coverage of 38°S to 38°N and 15 orbits per day. PR has a swath width of 220 km and a sensitivity of ~17 dBZ, which corresponds to a rain rate of 0.4?0.5 mm h?1 (Nuijens et al., 2009). We used the TRMM PR orbital product 2A25 Version 7 (V7) from 1998 to 2013, which provides three-dimensional precipitation information from 20 km down to the surface with a horizontal resolution of 4.3 km (5 km after an orbit boost in August 2001) and a vertical resolution of 250 m. We also used corrected reflectivity profiles, rain-rate profiles, rain type, and FzH from the 2A25 V7 product (Awaka et al., 1997). Specifically, the FzH was estimated from a climatological data set of sea level temperatures in TRMM PR Level-2 products (Awaka et al., 2009); noting that the actual FzH within convective clouds would be higher due to strong updrafts.Consistent with previous studies (e.g., Chen and Fu, 2018), the echo top height in TRMM PR pixels was defined as the highest height with three consecutive layers greater than 17 dBZ. Precipitating pixels were identified as those with a near-surface rain rate greater than 0.4 mm h?1.
The environmental information used in case studies was from the fifth-generation European Centre for Medium-Range Weather Forecasts (ECMWF) atmospheric reanalysis data set (ERA5). ERA5 data was provided on a horizontal resolution of 0.25×0.25 degrees and a vertical resolution of 37 pressure levels.
In addition, we also used Digital Elevation Model (DEM) data provided by the National Geophysical Data Center (NGDC), with a horizontal resolution of 1/30th of a degree in longitude/latitude (~3 km). The NGDC DEM data is available from the US Geological Survey (
2
2.2. RMAF identification
RMAF was previously known as the secondary reflectivity maximum aloft in the reflectivity profiles of stratiform precipitation, which usually occurs 1.5–2.5 km above FzH (Houze and Medina, 2005; McMurdie et al., 2018). However, the details of RMAF within convective precipitation are still unknown. Despite several reports confirming the existence of RMAF (Kingsmill et al., 2006; Zagrodnik et al., 2019), there is currently no quantitative identification criteria for RMAF. Therefore, the first step in this study was to develop an identification procedure based on radar echoes, as follows:1. This method is applied on reflectivity profiles of near-surface liquid precipitation with non-warm rain process.
2. RMAF occurs at a certain height between echo top height and FzH.
3. The echoes near the RMAF are all greater than 17 dBZ.
4. There are three consecutive layers with reflectivity (Z) at least 1 dBZ larger than the lower layer starting from the RMAF layer. Supposing RMAF layer is the i-th layer, then Z(i) > Z(i+1) + 1 dBZ; Z(i?1) > Z(i) + 1 dBZ; Z(i?2) > Z(i?1) + 1 dBZ, where i increases with decreasing height.
5. If there were consecutive multiple layers that meet the four criteria above, the lowest layer would be identified as RMAF. That means Z(i+1) ≤ Z(i+2) + 1 dBZ.
We applied this identification method to all precipitation profiles in the TRMM 2A25 dataset for 1998–2013. Those meeting the above criteria were recorded as RMAF precipitation events; other liquid, non-warm-rain precipitation events were recorded as NRMAF (non-RMAF) precipitation. In total, there were 2,736,225 RMAF events and 854,622,978 NRMAF events, respectively. Specifically, the 1 dBZ threshold in the fifth criteria did not significantly affect our results (see Fig. S1 and S2 in the supplementary file).
A contoured frequency by altitude diagram (CFAD) analysis of radar reflectivity provides a good representation of the structural properties of precipitation, and has been used in numerous studies (e.g., Yuter and Houze, 1995; Zhang et al., 2020). Figure 1 shows the CFAD distributions of Ku-band reflectivity for RMAF and NRMAF precipitation with an FzH between 4 ± 0.125 km independent of their locations. There were a total of ~ 47 million NRMAF pixels and 163 thousand RMAF pixels used in Fig. 1. Each CFAD was normalized by its overall maximum at a horizontal interval of 1 dBZ and a vertical interval of 0.25 km. Specifically these maximums are 3,330,827 and 19,994 for NRMAF and RMAF precipitation types, respectively. An outward protrusion at ~6 km can be clearly seen in the CFAD for RMAF precipitation, whereas it is absent for NRMAF precipitation, which helps validate our identification criteria. The different characteristics of RMAF and NRMAF precipitation are discussed further in the next section.
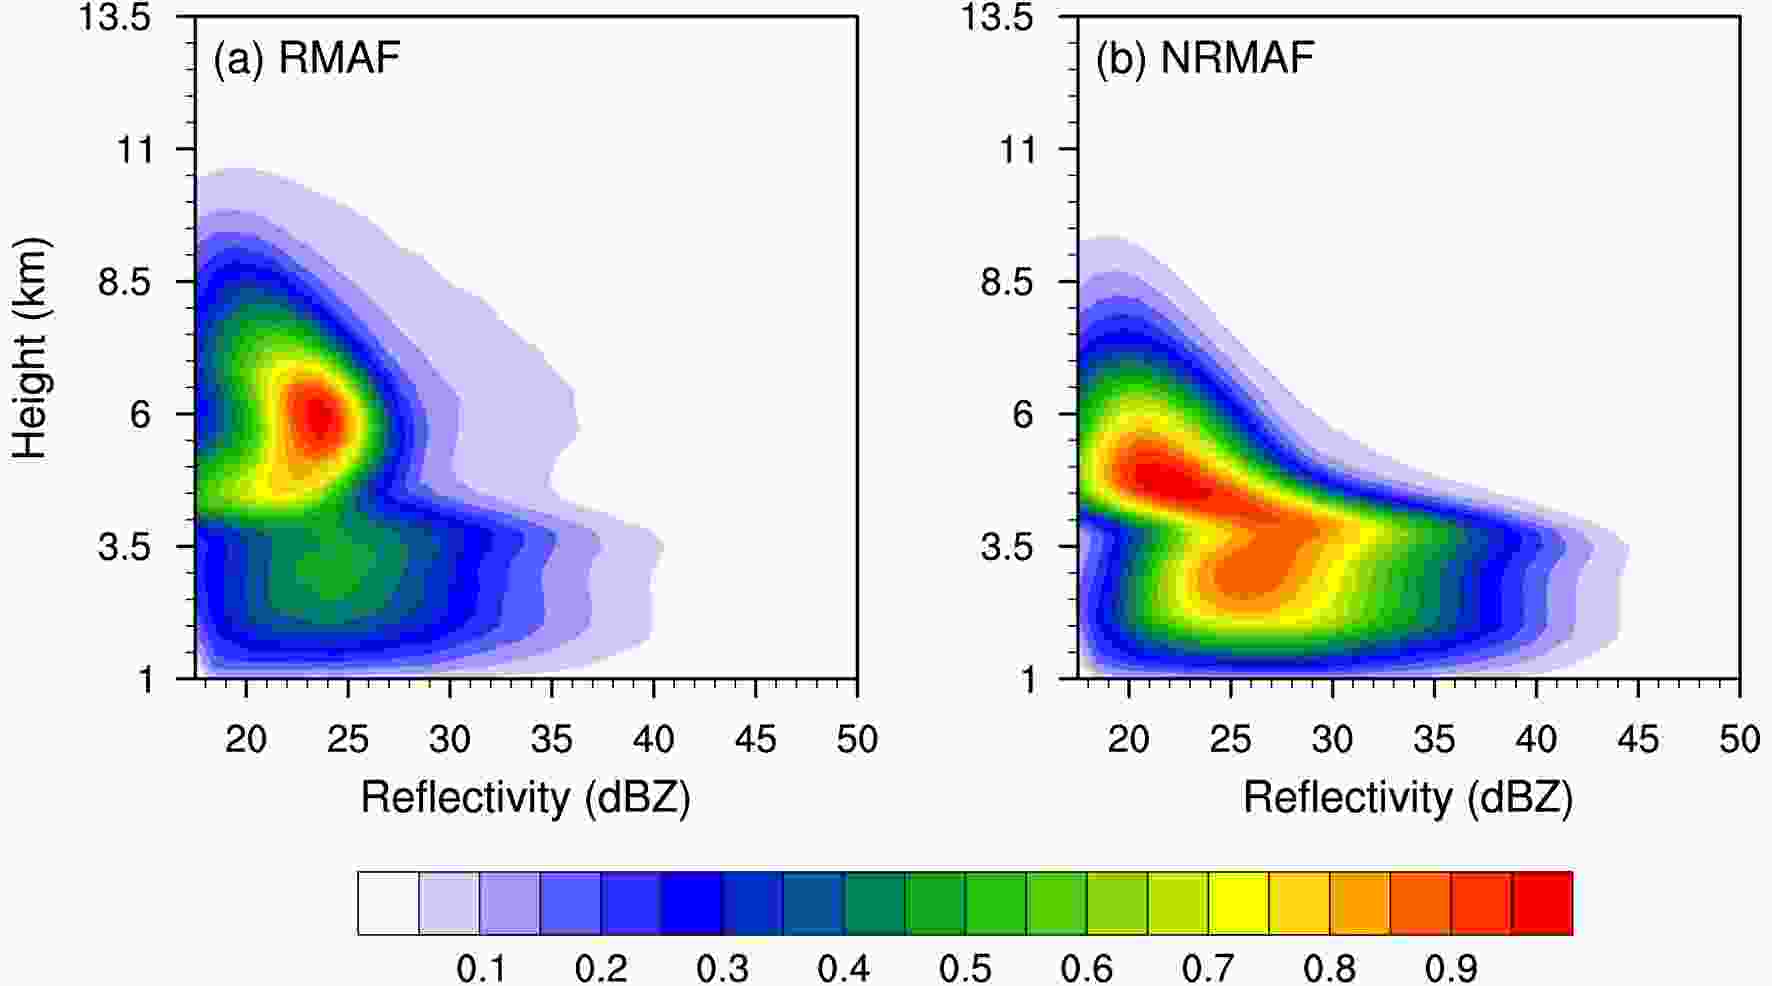 Figure1. Contoured frequency by altitude diagrams of Ku-band reflectivity for (a) RMAF and (b) NRMAF precipitation with FzH between 3.875 and 4.125 km, based on TRMM PR data for 1998–2013.
3.1. Case studies
The case studies can serve as a good foundation for further statistical studies. Since previous studies of RMAF precipitation focused on the stratiform variety, we also showed two differing demonstrations of stratiform events. For purposes of contrast and comparison, these include a NRMAF event and a RMAF event, both of which occurred in East China.For stratiform precipitation without RMAF structure, the vertical air motions in the lower and upper layers are downdrafts, while those that occur in the middle layers are updrafts; the peak of the updraft appears around the FzH (Houze et al., 1997). A typical NRMAF stratiform event was selected to characterize the above theory. It occurred on the North China Plain at 0105 UTC (0905 LST) 7 September 2000 and the underlying surface height was below 200 m (Fig. 2a). The precipitation pixels detected by TRMM PR were almost all classified as stratiform pixels without RMAF structure (Fig. 2b). Since the near-surface echo of TRMM PR is vulnerable to surface clutter, we present the vertical cross-section of Ku-band reflectivity from 2?10 km along the AB line in Fig. 2a. In this event, the FzH (0°C layer) was about 4 km high and there existed a significant echo peak near the FzH, which indicates the bright band; the reflectivity decreased significantly with increasing height above the bright band (Fig. 2c). Using ERA5 reanalysis data and data merging method (nearest point), we calculated the average vertical velocity profile of stratiform pixels within this event (Fig. 2d). The updraft existed between 3.5?7.5 km with a peak updraft velocity of 0.15 Pa s?1 at a height of 4?6 km, which was consistent with the stratiform precipitation structure proposed by Houze et al. (1997).
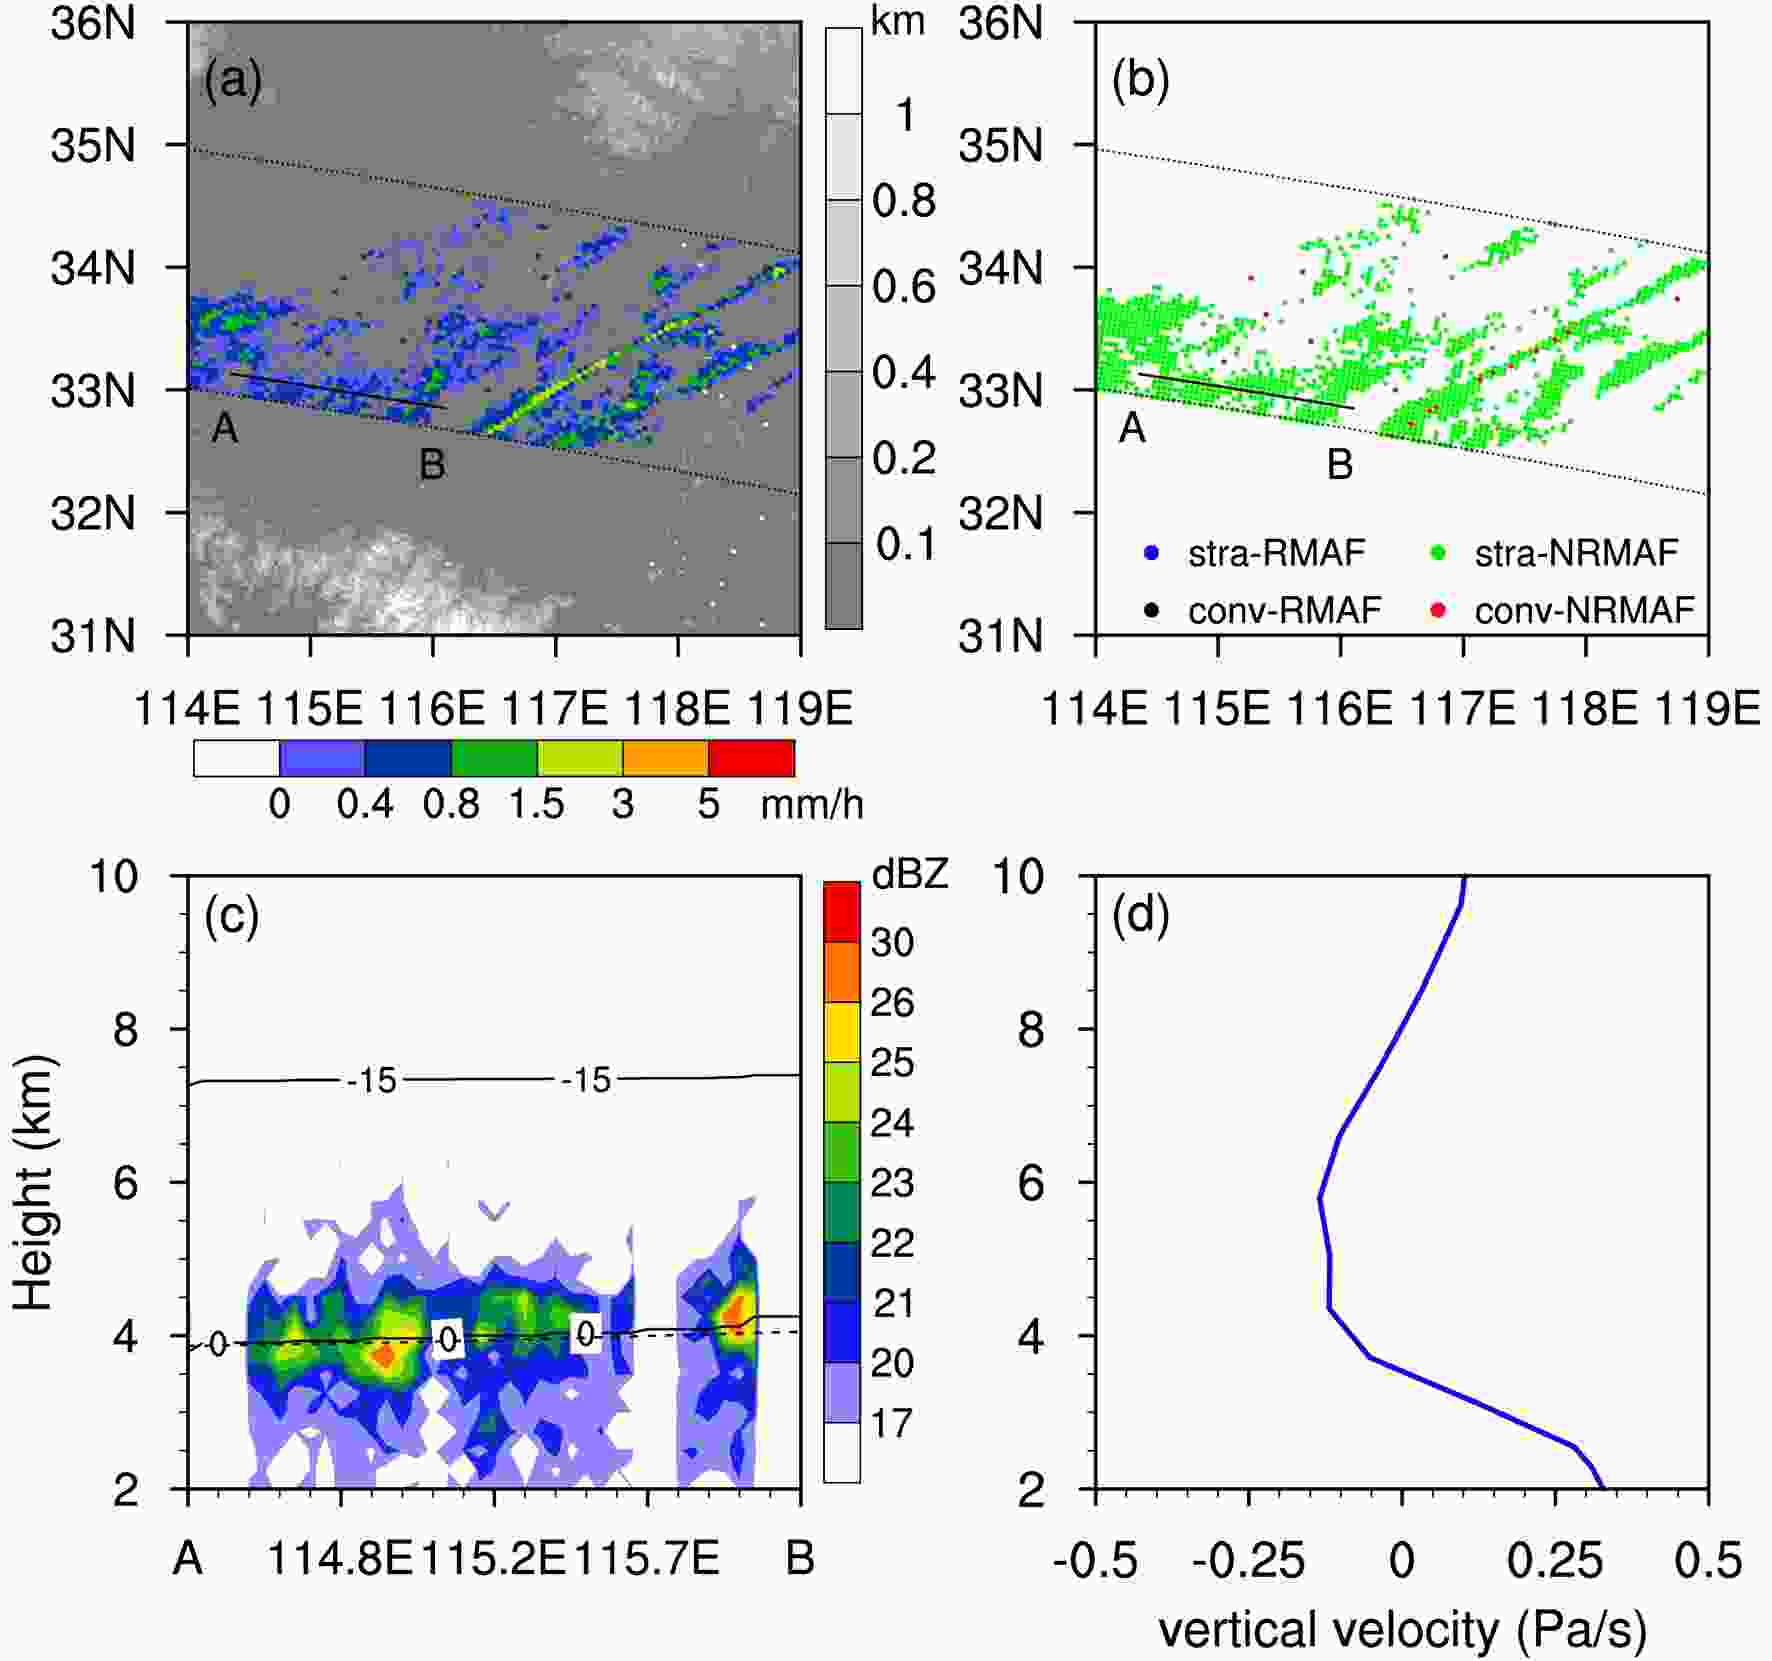 Figure2. Horizontal distributions of near-surface rain rate (a) and rain type (b), vertical cross section of Ku-band reflectivity along the AB line (c), and average vertical velocity of stratiform pixels (d) for a NRMAF case occurred at 0105 UTC (0905 LST) 7 September 2000. The dashed lines in Fig. 2c indicate the 0°C and ?15°C isotherms. The precipitation information was derived from TRMM PR, while the environmental information was derived from ERA5. The grayscale contours in Fig. 2a indicates the elevation. The dashed line in Fig. 2c indicates the FzH from TRMM 2A25.
The RMAF precipitation event occurred at 2204 UTC 7 June (0604 LST 8 June) 2000 near the junction of North China Plain and the Qinling Mountains where the underlying surface height was 0.2 to 1 km (Fig. 3a). The precipitation pixels detected by TRMM PR were almost all stratiform pixels, in which 37 pixels were associated with a significant RMAF structure (Fig. 3b). The vertical cross-section along the CD line showed that the FzH of this case also appeared around 4 km (Fig. 3c). There existed yet another reflectivity peak at 1.5?3 km above the bright band around FzH, indicating the existence of RMAF structure. The atmospheric temperature at the top of the RMAF layer was around ?15°C, corresponding to an area highly prone to aggregation processes (Houze and Medina, 2005). Compared with the NRMAF event, the low-level downdraft was weaker and the middle-level updraft was higher and stronger within this event (Fig. 3d). The peak of updraft was around 0.4 Pa s?1 at the height of 5.5 to 7.5 km, significantly higher than at the FzH level, which suggests that it was caused by the uplift of the underlying surface. The stronger and more elevated middle-level updraft holds a large number of aggregating ice particles around ?15°C, thus forming the RMAF structure.
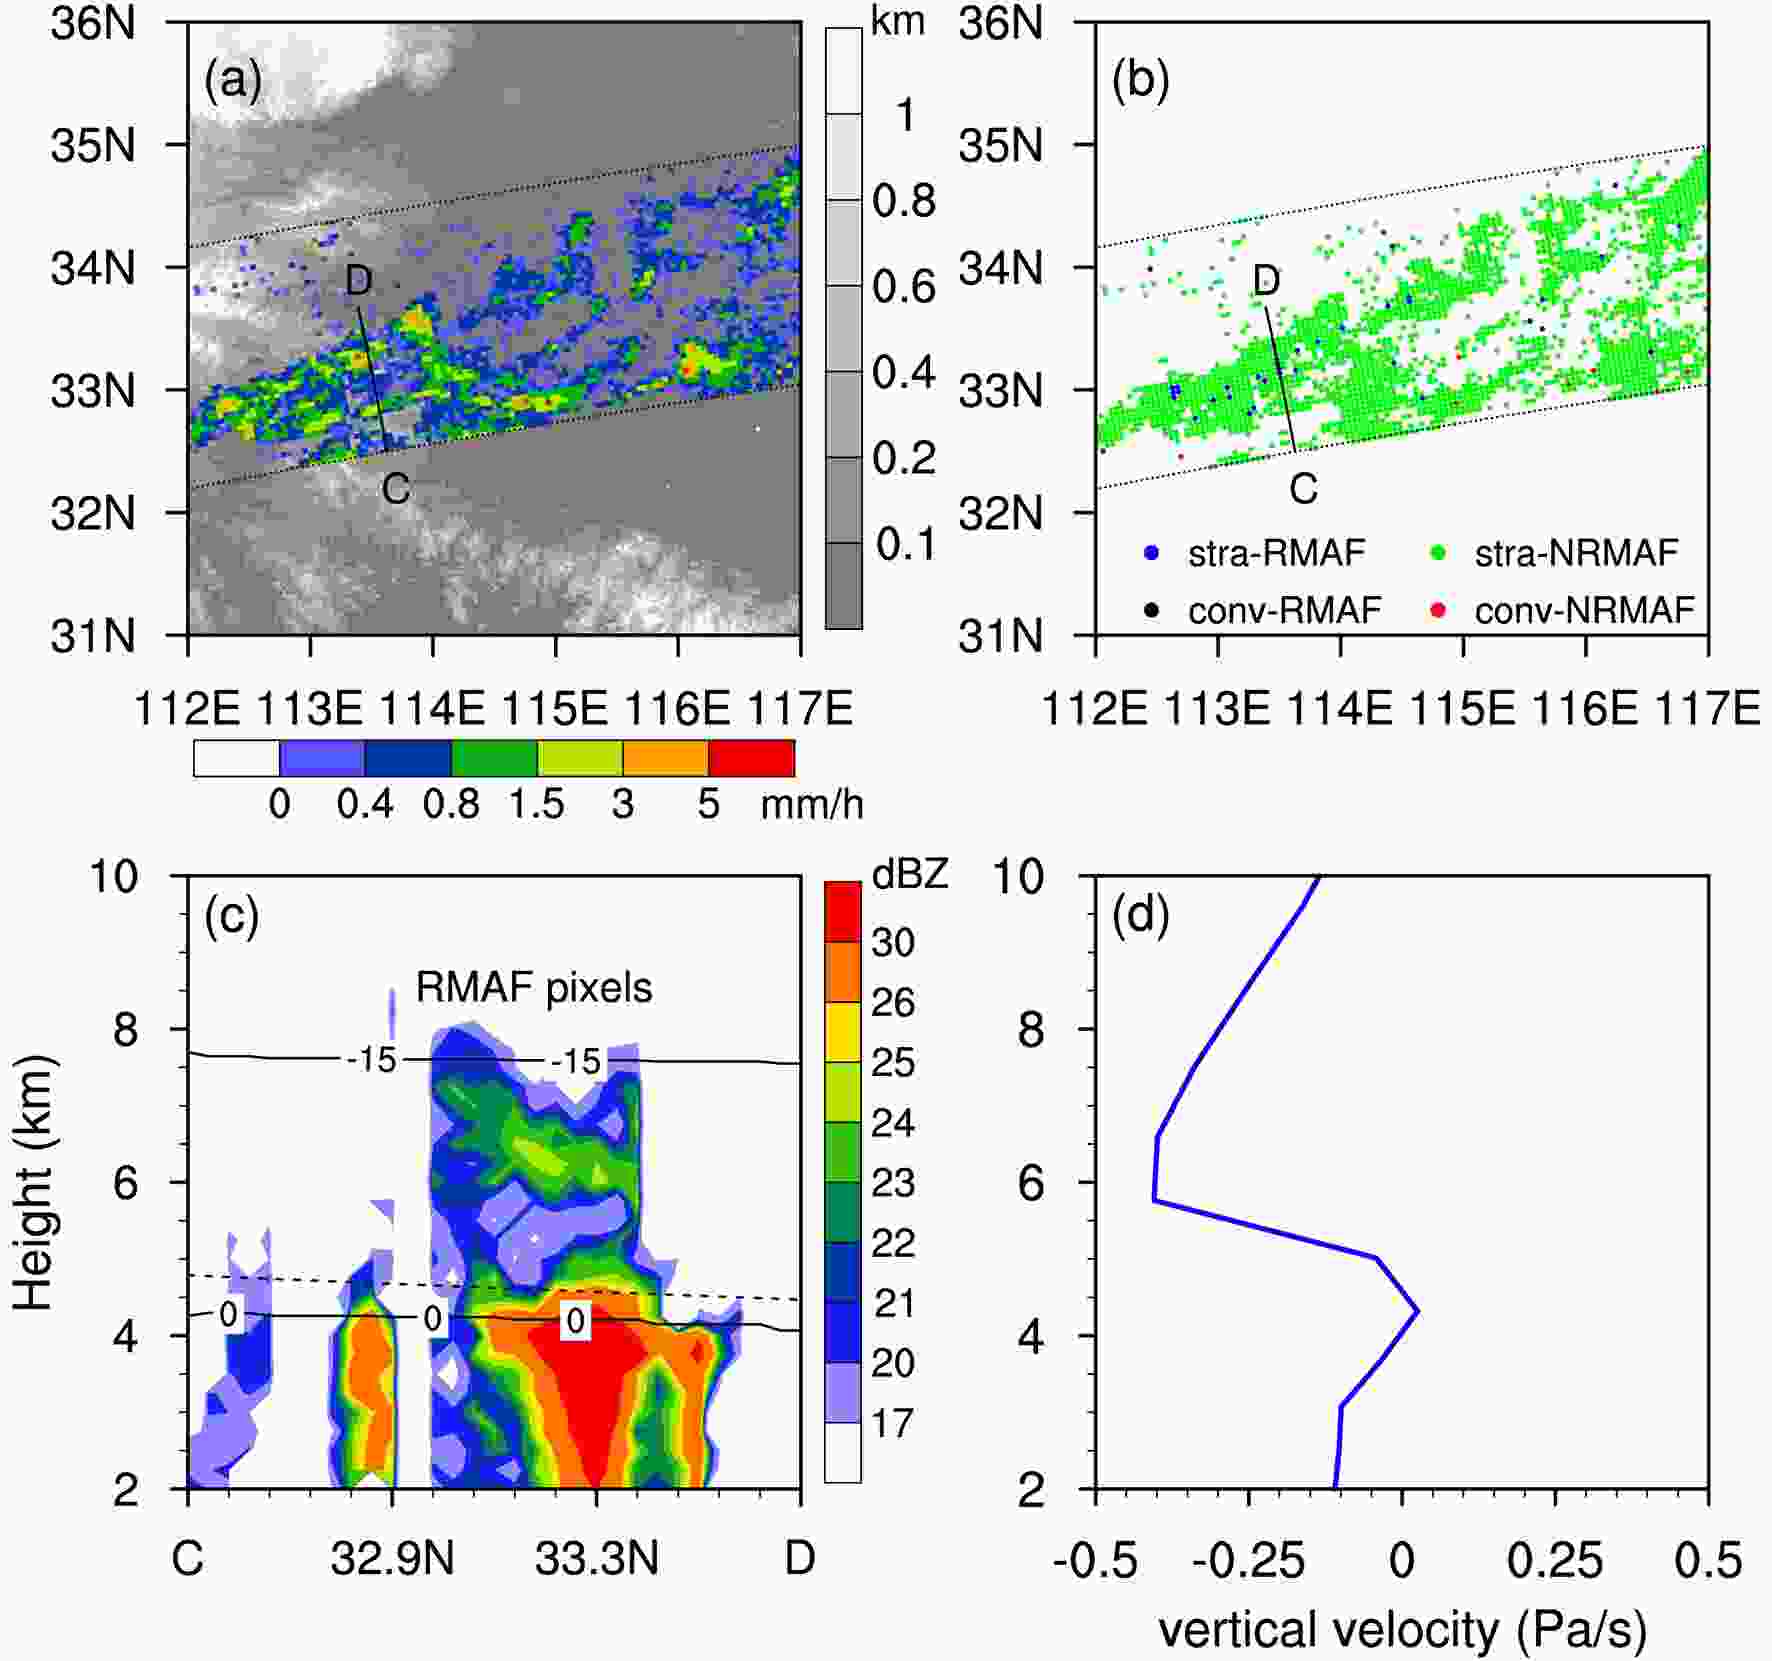 Figure3. The same as Fig.2, but for a RMAF case occurred at 2204 UTC 7 June (0604 LST 8 June) 2000. The blue line in Fig. 3d indicates the average vertical velocity of the RMAF pixels in Fig. 3c.
2
3.2. Orographic impact on RMAF frequency
Previous studies have pointed out the close relationship between RMAF and orographic lifting (McMurdie et al., 2018). However, quantitative statistics on this correlation are still lacking. Figure 4b-d shows the global distributions of RMAF frequency over the middle and lower latitudes on a 1° × 1° grid, based on the TRMM PR dataset for 1998–2013. The total number of samples for all precipitation cases, stratiform-only precipitation, and convective-only precipitation are around 855 million, 688 million, and 166 million, respectively. The total number of RMAF samples for all precipitation cases, stratiform-only, and convective-only precipitation are around 2.72 million, 2.10 million, and 605 thousand, respectively (the same in the following figures). The RMAF frequency is calculated as the percentage of RMAF samples compared to the total samples at each 1° × 1° grid. Figure4. Spatial distributions of elevation (a) and the RMAF frequency (%) for (b) all, (c) stratiform and (d) convective precipitation events in the TRMM PR dataset for 1998?2013.
The distribution characteristics of the RMAF frequency for all precipitation cases, stratiform-only, and convective-only precipitation are consistent, but do reveal two distinct features. The first and most prominent feature is that the RMAF frequency over land was higher than that over the ocean, and further more exhibited a direct relationship between altitude and RMAF frequency. In the Tibetan Plateau, Iranian Plateau and Andes region, RMAF precipitation can account for more than 2% of all precipitation cases, while the proportion of RMAF precipitation over the ocean generally accounts for less than 0.6%. This result supports the aforementioned relationship between RMAF and terrain elevation.
The second distinct feature is that the proportion of RMAF precipitation at high latitudes was found to be higher than that at lower latitudes. For example, in oceanic regions the RMAF frequency near the equator was around 0.2%, while at latitudes around 30°N or 30°S, RMAF occurred nearly twice as often at almost 0.4%. We suggest that this feature is linked to lower FzH in higher latitudes. Future r studies concerning the relationship between FzH and RMAF frequency are warranted.
In addition, the RMAF frequency of stratiform precipitation reaches 0.4% over the Central African region near the equator (Fig. 4b), indicating the RMAF is not necessarily related to baroclinic activity.
The causes of RMAF within stratiform and convective precipitation are dissimilar due to differences regarding their internal structure. As described by Houze (1997), the air motions in stratiform precipitation can be divided into three layers; the upper and lower layers, which are divergent, and the middle layer, which is convergent. This tends to explain the presence of weak updrafts in the middle layers of stratiform precipitation (above FzH), which was thought to be the trigger of RMAF in many studies (e. g., Medina et al., 2007). Therefore, RMAF usually appears above the middle-layer updraft where numerous ice-phase particles aggregate.
When ice particles fall to within about 2.5 km of the FzH, aggregation processes can occur and alter the precipitation particle spectrum towards fewer numbers of larger hydrometeors, which significantly increases the radar echo (Houze, 2014). However, the original updraft within stratiform precipitation is usually too weak to support enough aggregation and justify the existence of RMAF. Orographic lifting can enhance the middle-layer updraft, which is conducive to the aggregation process and therefore RMAF. The RMAF frequency of stratiform precipitation shows a clear increasing trend with increasing elevation (Fig. 5a). On the other hand, the increase in FzH inhibits the propagation of surface disturbances to the middle layer, so the RMAF frequency is reduced with increasing FzH (Fig. 5b).
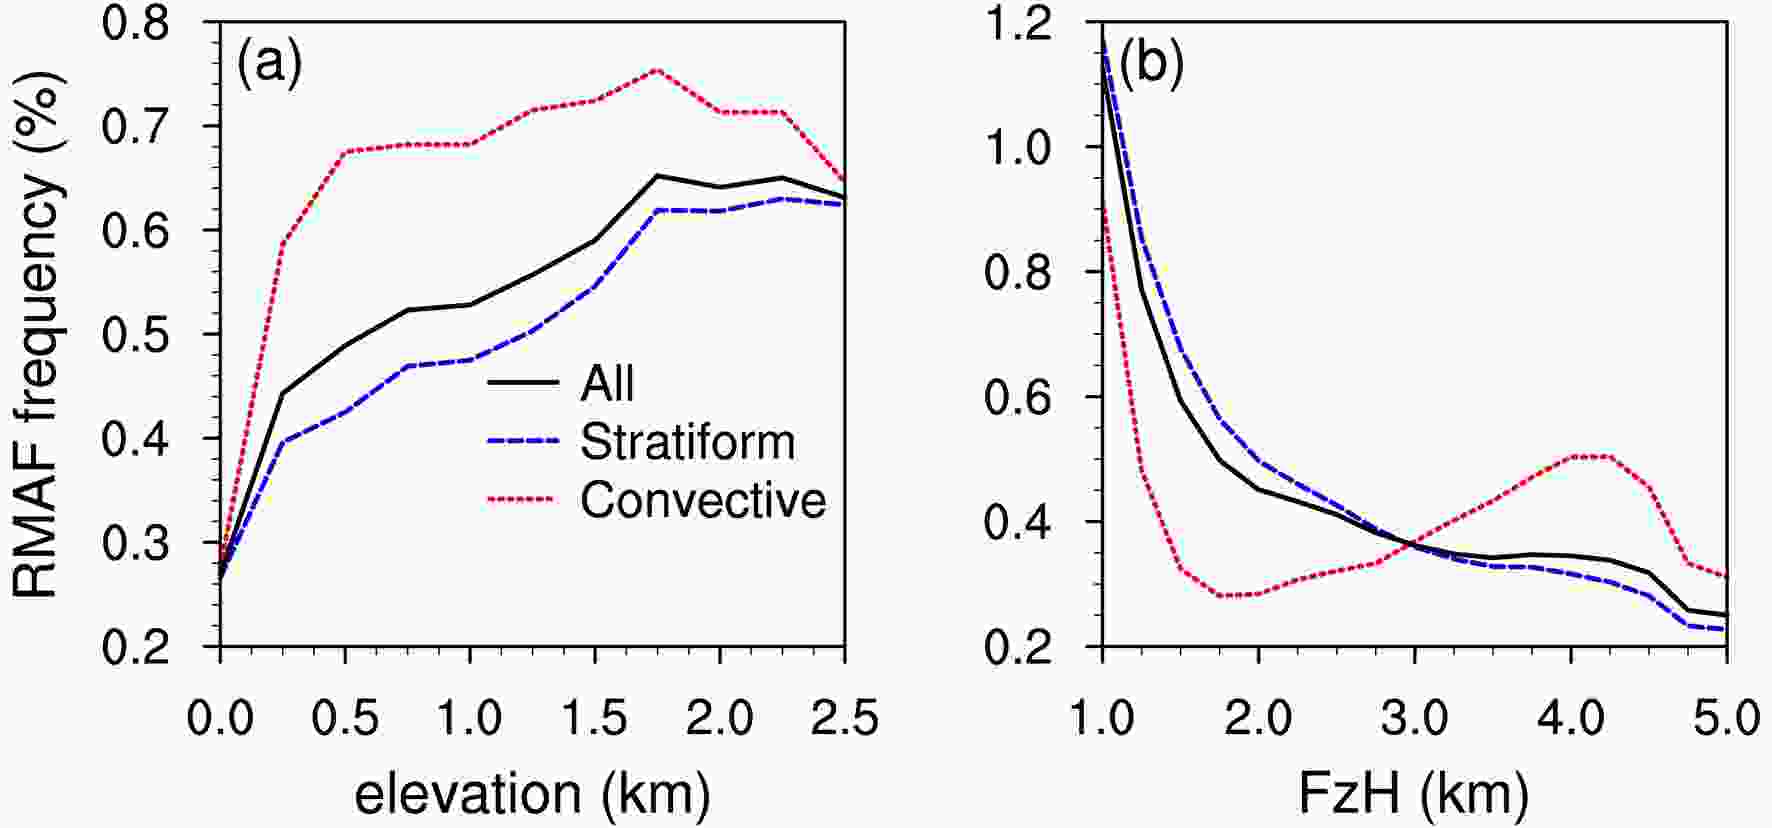 Figure5. Relationship between (a) RMAF frequency and terrain elevation, and (b) RMAF frequency and FzH for all (black line), stratiform (dashed blue line), and convective (dashed red line) precipitation events. The spacing of the x-axis is 0.25 km for both panels.
The vertical air motions in convective precipitation are divided into two layers: convergence in the lower-middle layers and divergence in the upper layer (Houze, 1997). Thus, there is a strong updraft in the lower-middle layers of convective precipitation. The ice particles within convective precipitation may also aggregate at a certain height and form RMAF under the influence of the updraft. For the same reason as stratiform precipitation, the RMAF frequency of convective precipitation increases with elevation but at a smaller rate (Fig. 5a).
In addition, the impact of FzH on the RMAF frequency within convective precipitation is different from that within a stratiform precipitation regime (Fig. 5b). The relationship between RMAF frequency and FzH for convective precipitation shows a bimodal structure. The RMAF frequency within convective precipitation reaches a local maximum when FzH is around 4.2 km. The reason for this phenomenon is still unknown, although it may be that insufficient surface heating under low-FzH conditions limits the strength of the updraft within convective precipitation.
2
3.3. RMAF height
Previous studies have shown that RMAF usually occurs 1.5–2.5 km above FzH in stratiform precipitation (Houze and Medina, 2005; Medina et al., 2007; Zagrodnik et al., 2019). In light of the strong dependence of RMAF height on FzH, we analyzed the probability distribution function (PDF) of FzH (Fig. 6a–c). The PDFs of FzH are unimodal, with a peak at about 4.9 km, and are characterized by negative skewness; less than 5% of precipitation cases correspond to an FzH higher than 5.4 km. The FzH of convective precipitation was higher than that of stratiform precipitation (Fig. 6b-c), which is related to the higher proportion of convective precipitation occurring at low latitudes than at mid–high latitudes. The FzH of stratiform precipitation with RMAF was slightly lower than that without RMAF (Fig. 6b), consistent with a decrease in RMAF frequency with increasing FzH (Fig. 5b).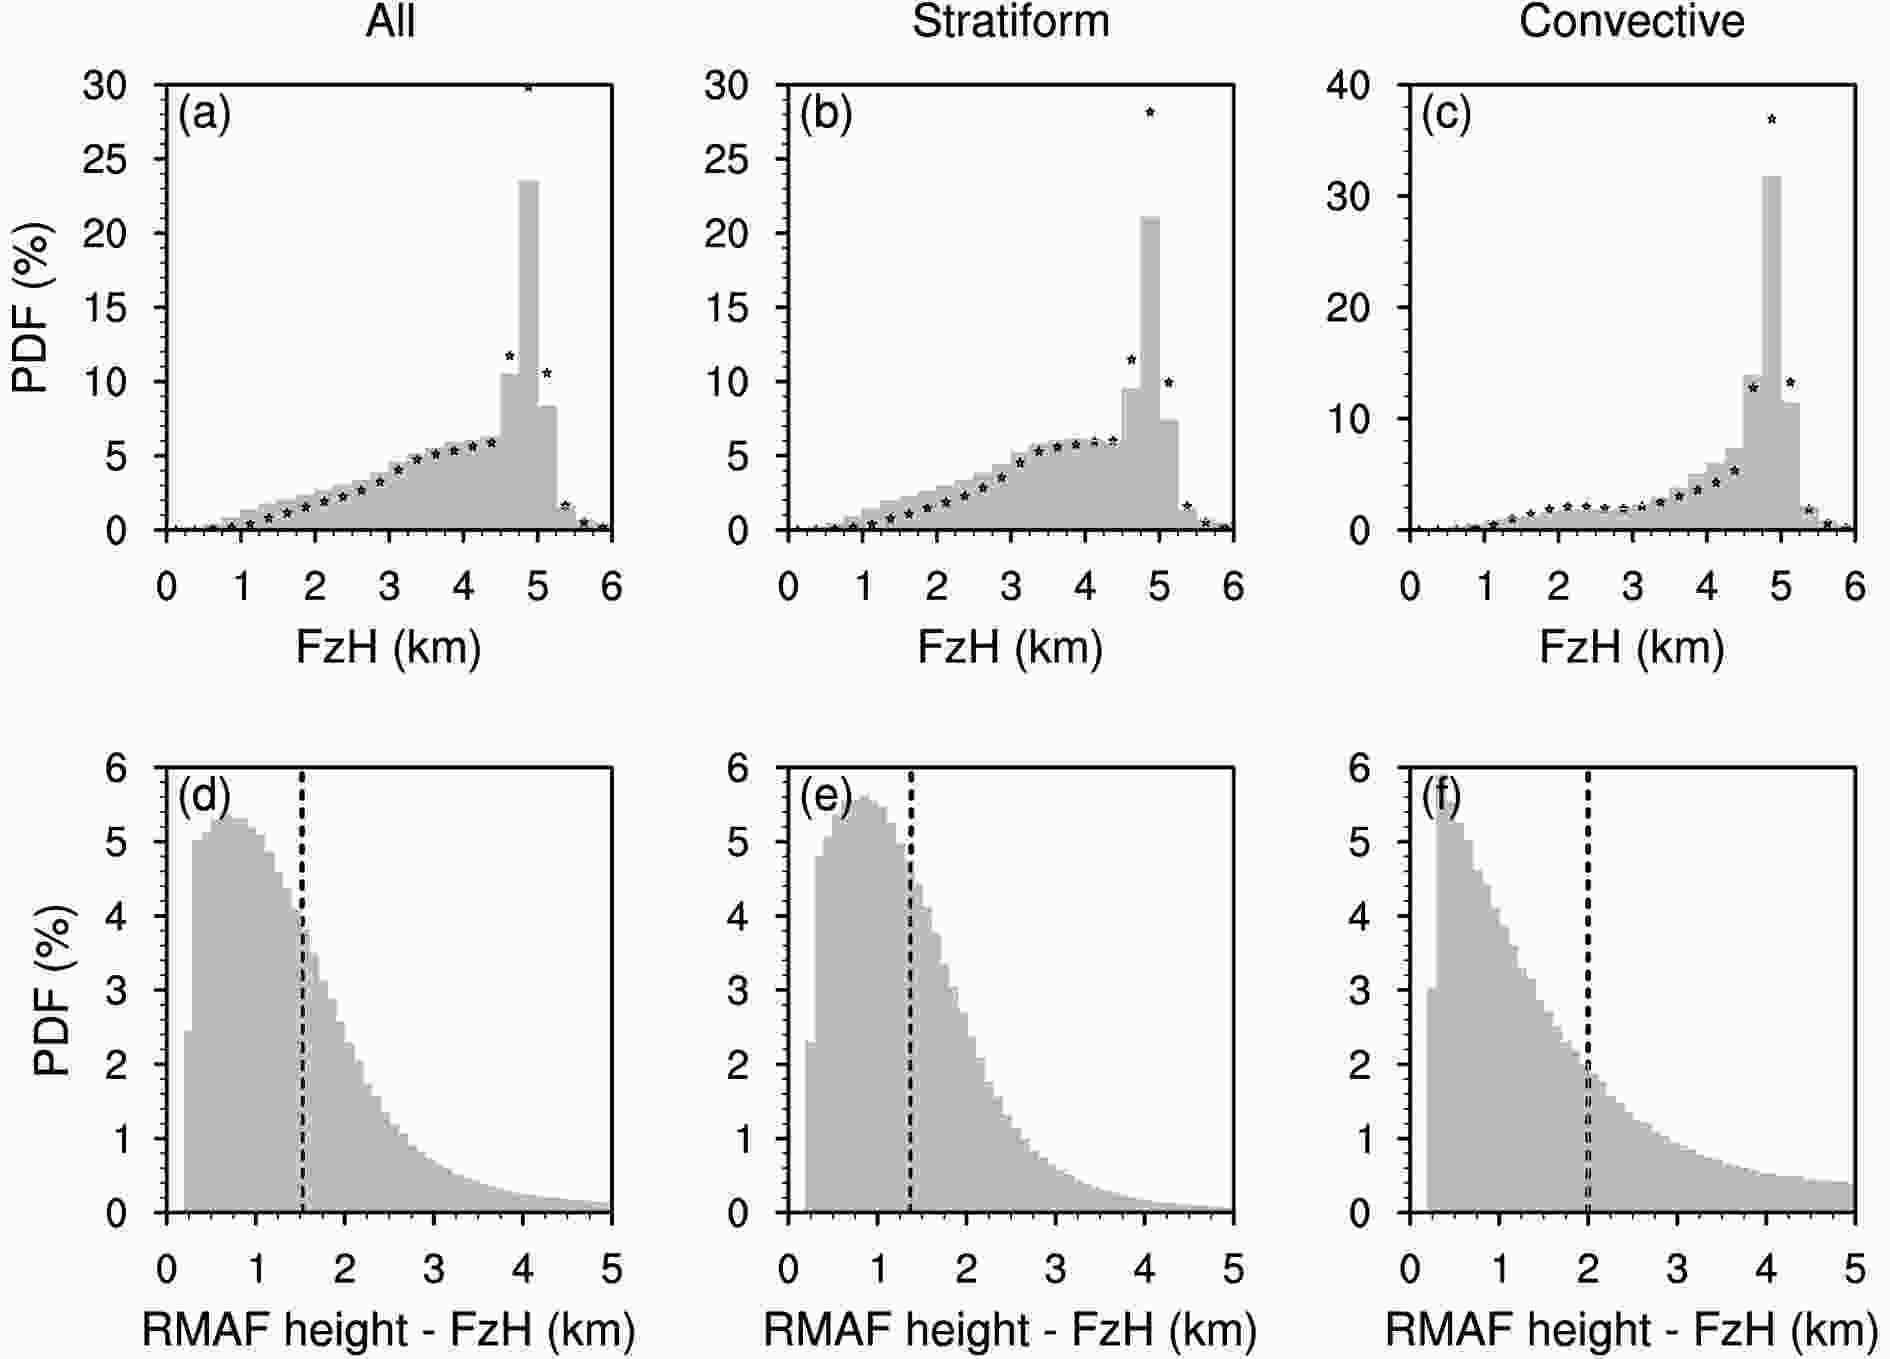 Figure6. PDFs of (a–c) FzH and (d–f) RMAF height ? FzH for RMAF precipitation in all cases (left panels), for stratiform precipitation (middle panels), and for convective precipitation (right panels) derived from the TRMM PR dataset for 1998–2013. The black dots in (a–c) indicate the FzH PDFs for NRMAF precipitation. The dashed lines in (d–f) indicate the distribution mean. The spacings of the x-axis are 0.25 km and 0.1 km for panels a?c and d?f, respectively.
The PDFs of RMAF height - FzH are shown in Fig. 6d-f. The RMAF height is mostly distributed in the range 0.25 to 3 km above FzH (Fig. 6d). The average RMAF height was 1.52, 1.35, and 2.01 km above FzH for all, stratiform, and convective precipitation, respectively (Fig. 6d–f). These values, based on multi-year satellite observations, are lower than the RMAF height suggested by Houze and Medina (2005). Empirical evidence indicates that aggregation occurs at ambient temperatures of 0°C to ~ ?15°C (Hobbs, 1974), which corresponds to the height of 0 km to ~ 3.5 km above FzH. Thus, it is suggested that the main microphysical process of RMAF should be the aggregation process.
We also analyzed the relationships between RMAF height and ice layer depth (echo top height - FzH), and between RMAF height and elevation (Fig. 7). There was a clear positive correlation between RMAF height and ice layer depth which was independent of the precipitation type (Fig. 7a-c). With an increase of ice layer depth from 1 km to 9 km, the median RMAF height increases significantly from 0.5 km to 3.5 km above FzH (Fig. 7a-c), which corresponds to the main distribution interval of RMAF height (Fig. 6d). The small fluctuations in Figure 7a-c may be a consequence of the small ice layer depth intervals that were used.
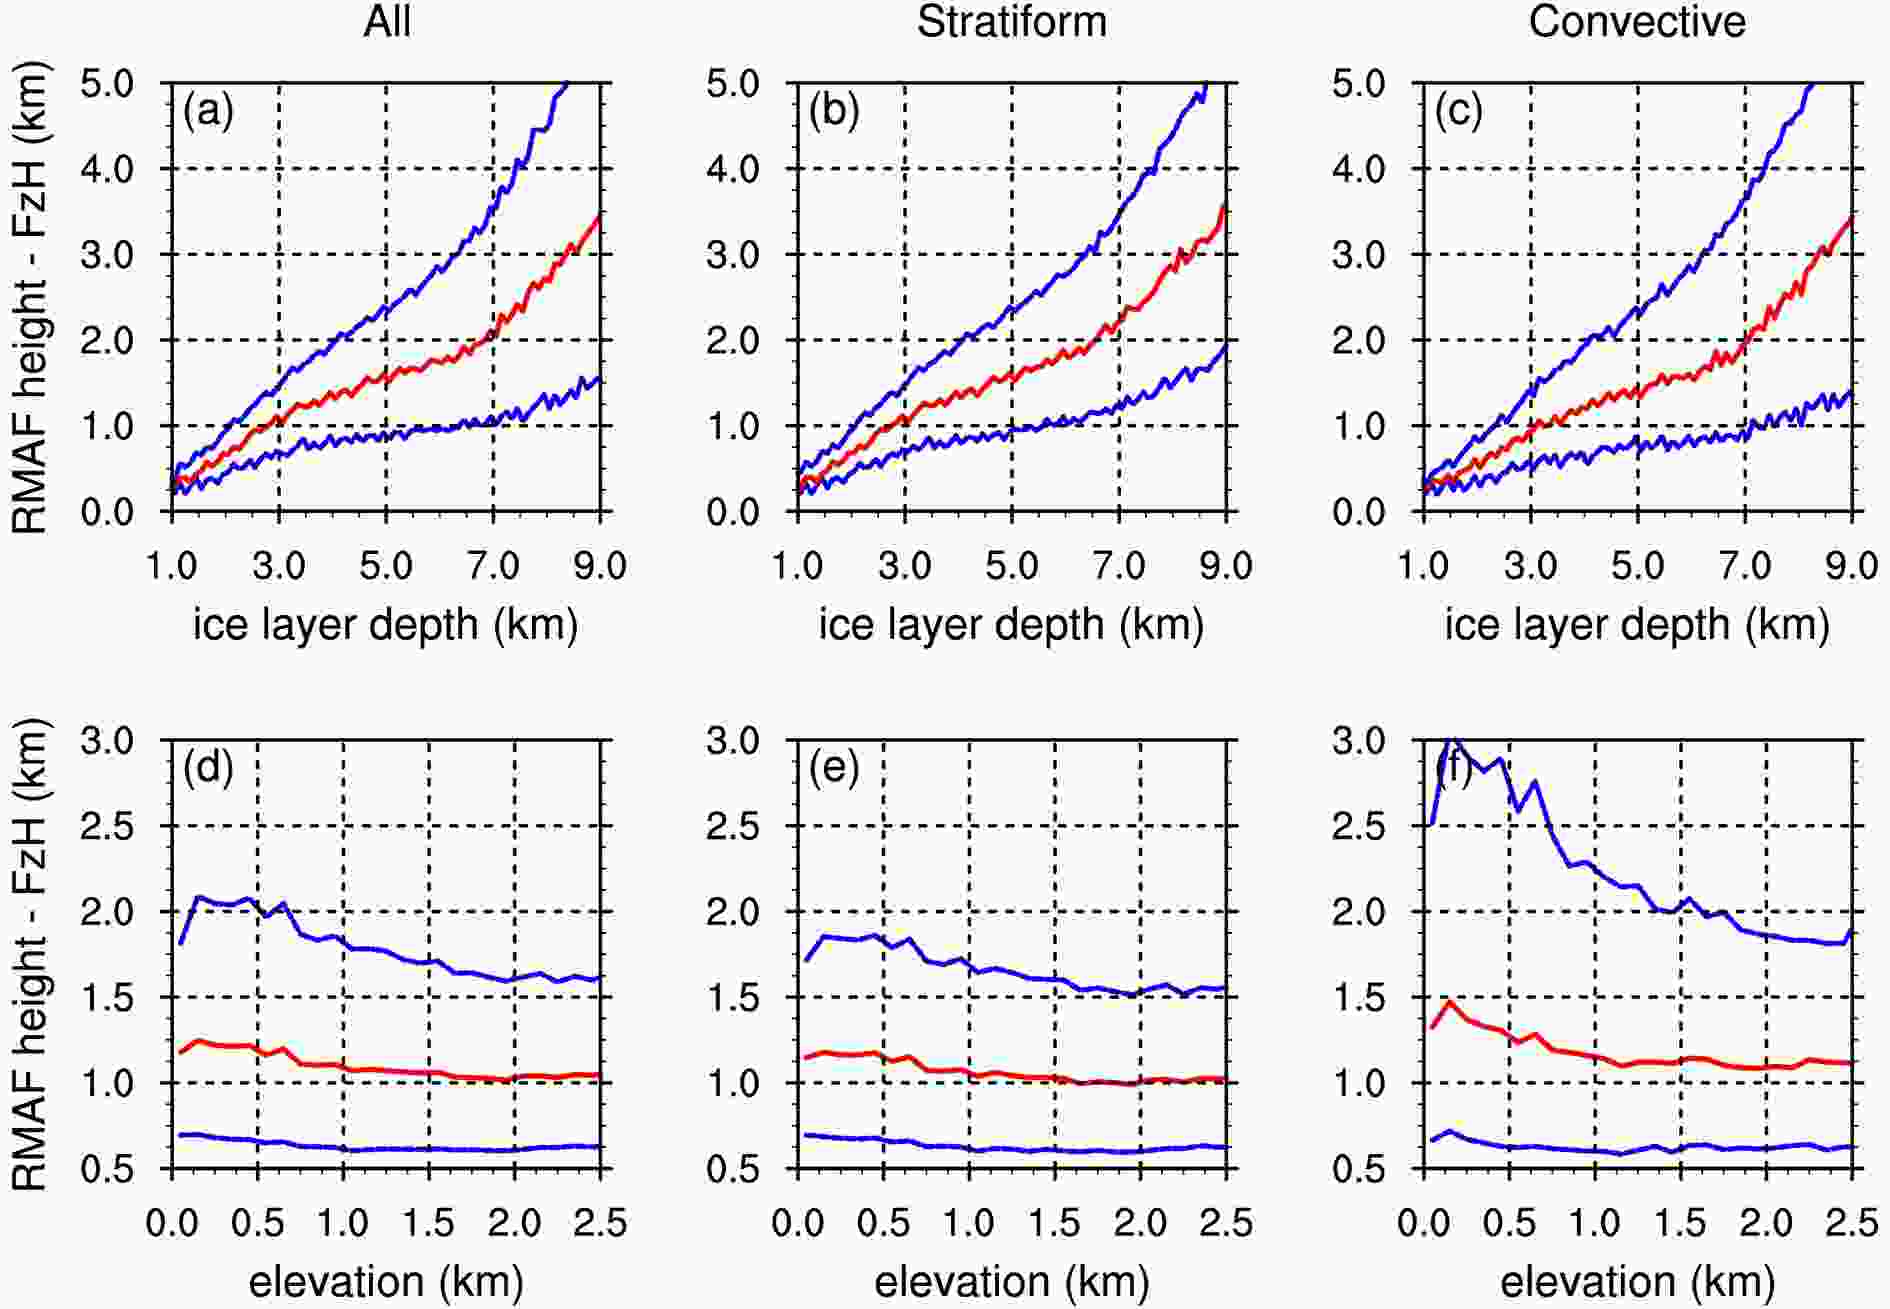 Figure7. Relationships between (a–c) RMAF height ? FzH and ice layer depth, and (d–f) RMAF height ? FzH and elevation within all, stratiform and convective precipitations. In each panel, the red line indicates the median and the blue lines indicate the 25th and 75th percentiles, respectively.
In contrast, upon increasing the elevation from 0 to 2.5 km, the median RMAF height gradually decreases from 1.25 km to 1.0 km above FzH (Fig. 7d). This may be related to the tendency for terrain to “squeeze” the moisture out and reduce the precipitation depth, as precipitation which occurs over the plains tends to be deeper than over the adjacent slope regions (Fu et al., 2018). Such orographic squeezing is more profound in convective precipitation (Fig. 7f) than in stratiform precipitation (Fig. 7e).
2
3.4. Precipitation structures
The vertical structure of precipitation reflects both the dynamic and microphysical processes of precipitation droplets (Zipser and Lutz, 1994; Li et al., 2019). The existence of RMAF is a newly discovered and less conventional characteristic describing the vertical structure of precipitation. In this section, we focus on its impact upon several common precipitation parameters in order to better understand RMAF precipitation.The PDFs of near-surface rain rate for RMAF and NRMAF precipitation are shown in Fig. 8a-c. Considering the sensitivity of TRMM PR (0.4?0.5 mm h?1; Nuijens et al., 2009), only precipitation events having a near-surface rain rate exceeding 0.4 mm h?1 were included in our analysis. For all precipitation events (Fig. 8a), the PDF of RMAF decreases with increasing near-surface rain rate; the peak value at 0.4 mm h?1 is ~5.3%. In contrast, the PDF of NRMAF has a unimodal distribution peaking at 1.05 mm h?1 with a value of ~3.6%. This evidence suggests that the mean near-surface rain rate for RMAF precipitation is less than that for NRMAF precipitation.
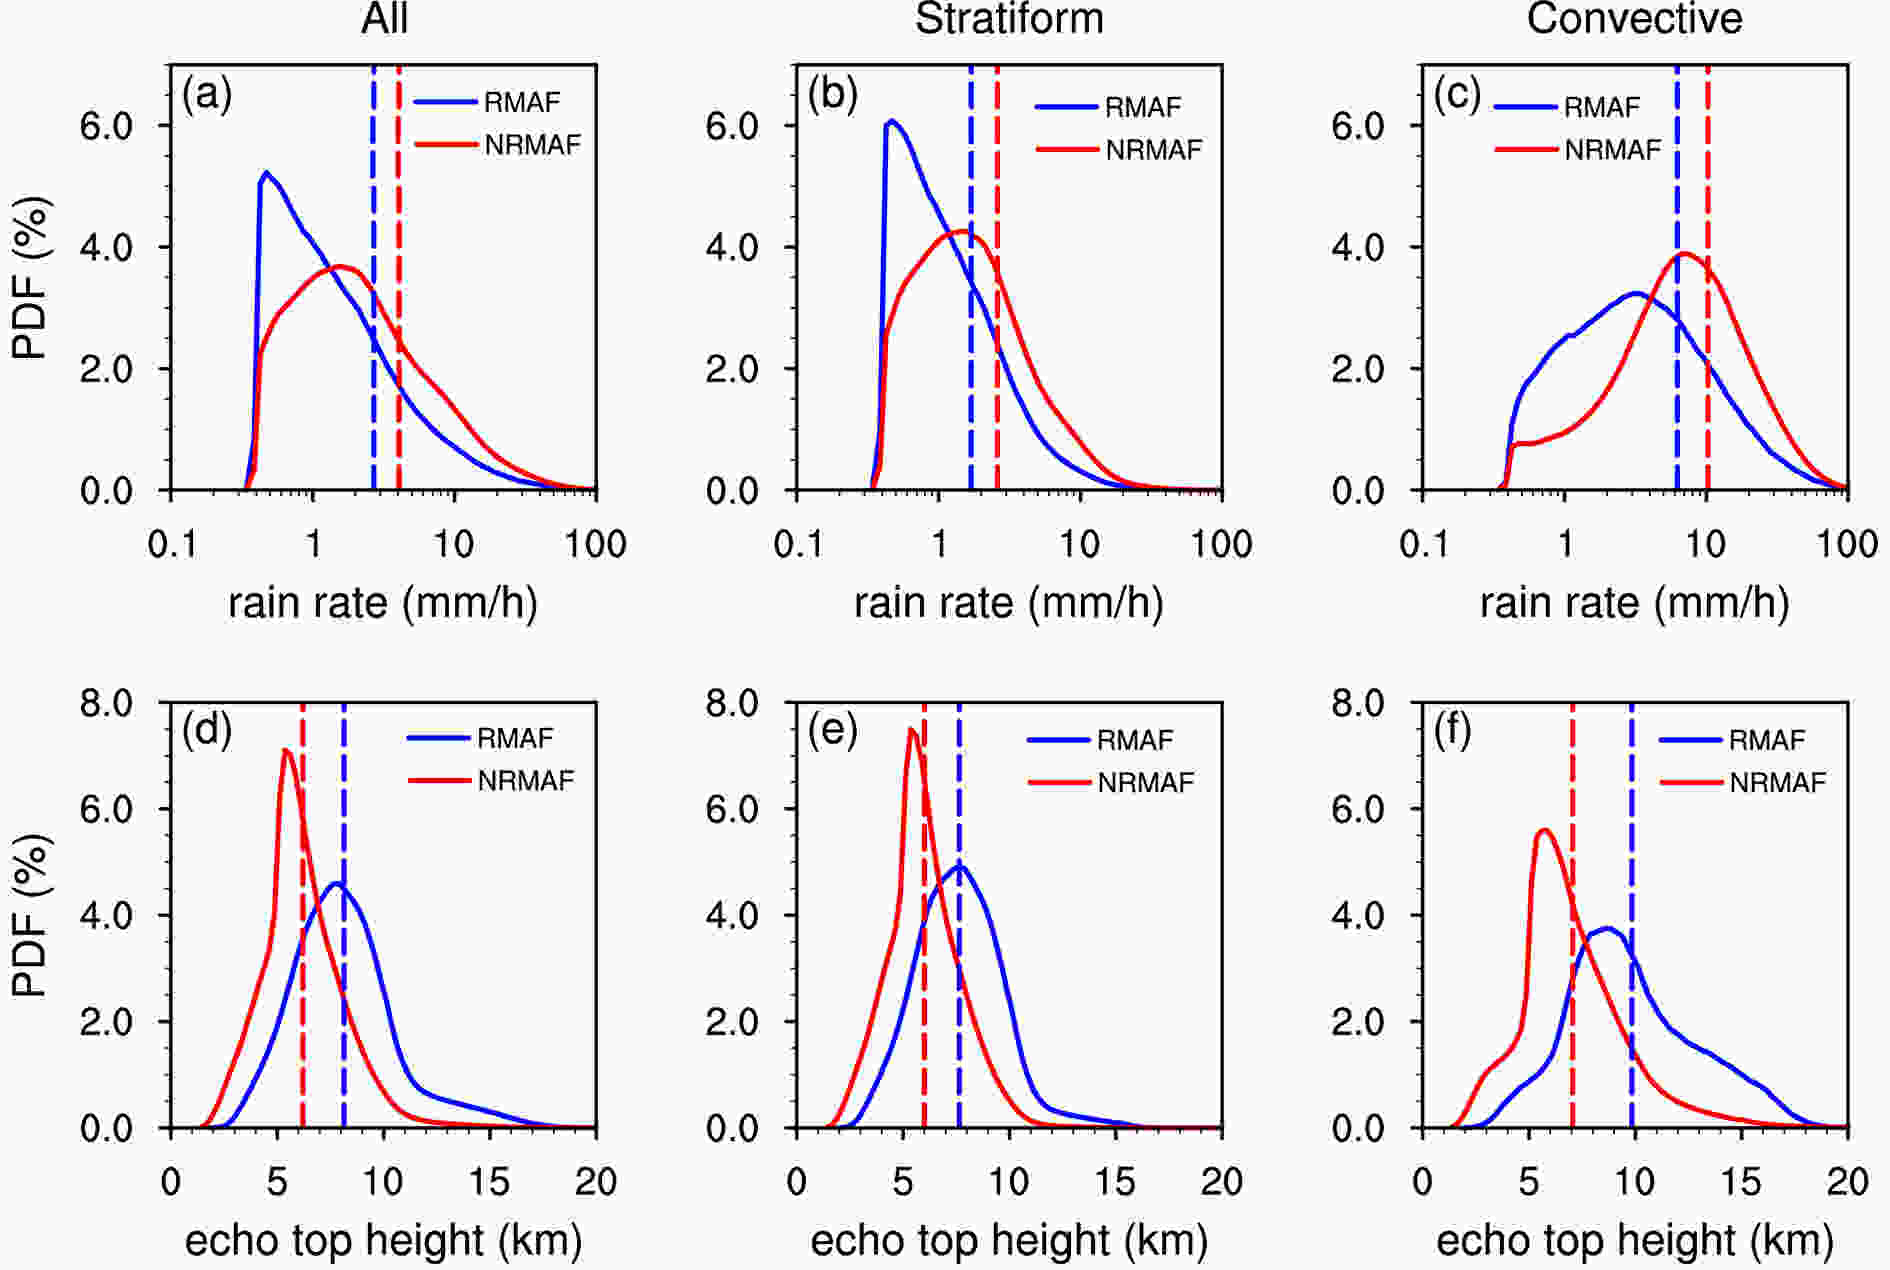 Figure8. PDFs of (a–c) near-surface rain rate and (d–f) echo top height in RMAF (blue curves) and NRMAF (red curves) precipitation, derived from TRMM PR for 1998–2013. The dashed lines indicate the mean values of rain rate and echo top height. The spacing of the x-axis for panels a?c is constant in Log coordinate [
The PDFs of the near-surface rain rate for stratiform precipitation (Fig. 8b) are similar to those for all precipitation cases in both their distribution modes and peak rain rates. The peak values are ~6.1% and ~4.3% for RMAF and NRMAF precipitation, respectively. For convective precipitation (Fig. 8c), the PDFs are unimodal for both RMAF and NRMAF precipitation. The PDF of RMAF precipitation peaks at 3.2 mm h?1 with a value of 3.2%, whereas that of NRMAF precipitation peaks at 7 mm h?1 with a value of 3.9%.
The PDFs of echo top height are similarly presented in Fig. 8d-f. The PDFs for both RMAF and NRMAF precipitation show a quasi-normal distribution. For all RMAF precipitation cases, the peaks are at 7.5 km having a value of around 4.5%, whereas that peaks at 5.5 km have a value of 7% for all NRMAF precipitation (Fig. 8d). It follows that the echo top height of convective precipitation is on average higher than that of stratiform precipitation (Fig. 8e, f), while the differences between the PDFs of RMAF and NRMAF precipitation seems to be less affected by rain type.
In conclusion, the results shown in Fig. 8 indicate that the near-surface rain rate was suppressed by the existence of RMAF whereas the echo top height was promoted.
For detailed knowledge of the impact of the RMAF structure on precipitation microphysical processes, we carried out CFAD analysis on the Ku-band reflectivity profiles of RMAF and NRMAF precipitation. Each CFAD was normalized by its overall maximum at a horizontal interval of 1 dBZ and a vertical interval of 0.25 km. Specifically, the maximums are around 277 thousand, 53.8 million, 46.6 thousand, and 8.57 million for Fig. 9a-d, respectively. As RMAF height is directly related to FzH, the zero point on the y-axis indicates the FzH. Precipitation droplets above FzH are mainly ice, whereas they are mainly liquid below FzH.
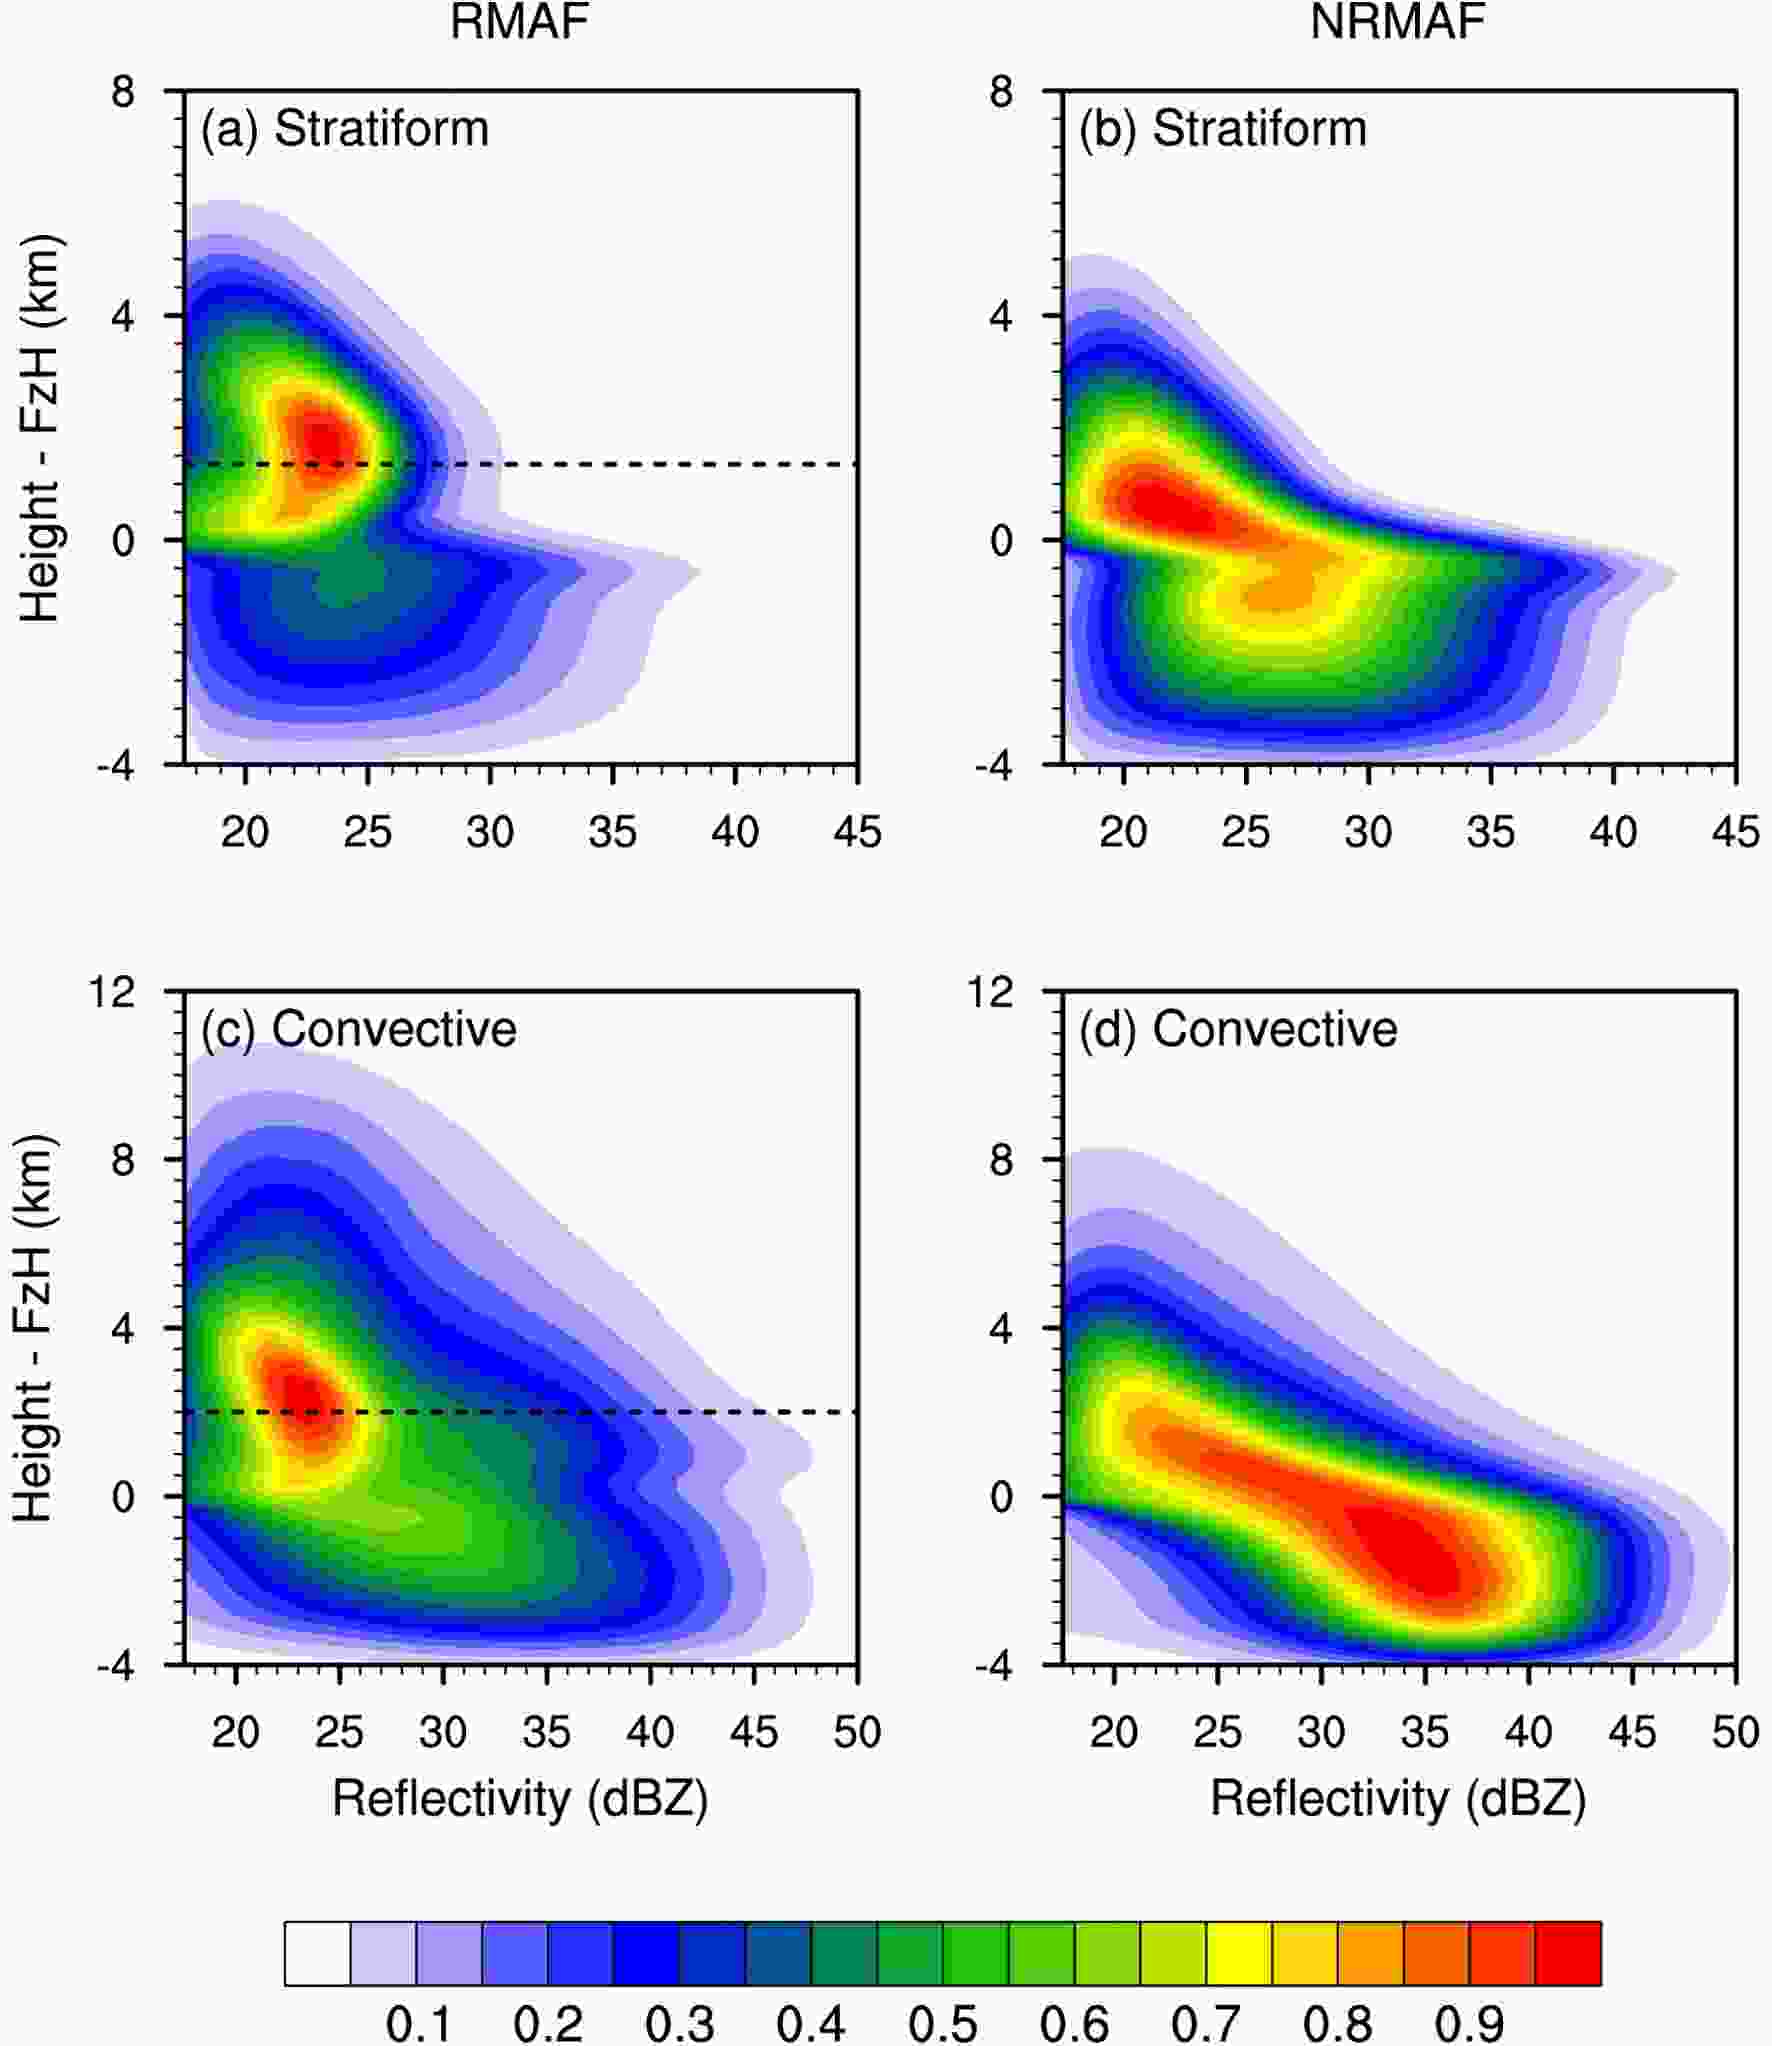 Figure9. CFADs of Ku-band reflectivity normalized by FzH for (a–b) stratiform and (c–d) convective precipitation, derived from TRMM PR for 1998–2013. FzH is indicated by the zero point on y-axis. The dashed lines indicate the average RMAF height.
The characteristics of near-surface droplets in stratiform precipitation mainly depend on the ice processes, therefore the reflectivity remains constant or slightly decreases (due to evaporation) with decreasing height below FzH (Fig. 9a, b). There is a distinct outward protrusion above FzH in the CFAD for stratiform precipitation with RMAF, which indicates the average RMAF height (Fig. 9a). Compared with NRMAF precipitation (Fig. 9b), the CFAD for stratiform precipitation with RMAF is more concentrated in the area above FzH, and the reflectivity is weaker below FzH (Fig. 9a), indicating the RMAF structure is not conducive to the downward propagation of ice particles.
For convective precipitation (Fig. 9c, d), the reflectivity increases significantly with decreasing height due to the collision–coalescence process below FzH. This makes sense since there is usually a strong updraft and plentiful water vapor in the lower layers. By no means does this imply that ice processes are not important in convective precipitation. On the contrary, RMAF within the ice layer can also limit the downward propagation of particles in convective precipitation, resulting in weaker reflectivity below FzH than in NRMAF precipitation. Due to the accumulation of ice droplets above the RMAF height, the reflectivity is large and the echo top is high.
A notable phenomenon is that the outward protrusion in the outer regions of the convective RMAF precipitation is clearly lower than the average RMAF height (Fig. 9c). We think the protrusion here is more likely to be the result of the melting process, which is likely attributed to the lifting of FzH by intense updrafts within the convective cloud, rather than the aggregation of ice droplets, and therefore should not be identified as RMAF. Taking this into consideration, the actual RMAF frequency of convective precipitation would be lower than our results.
Figure 10 shows the two-dimensional probability distributions of near-surface rain rate for precipitation with and without RMAF. To better analyze the impact of echo top height on rain rate, these distributions were normalized by the column maximums. With an increased echo top height, the mode of rain rate for RMAF precipitation is maintained at around 0.4 mm h?1, equivalent to the minimum effective value of rain rate (Fig. 10a). In contrast, the mode of NRMAF precipitation increases from 1 mm h?1 to 10 mm h?1 with an increase in echo top height from 3 km to 12 km (Fig. 10d). Compared with stratiform precipitation (Fig. 10b, e), the rate of increase of rain rate with echo top height was greater for convective precipitation (Fig. 10c, f). In addition, the rate of increase was significantly smaller for convective precipitation with RMAF (Fig. 10c) than that without RMAF (Fig. 8f). As Hamada et al. (2015) pointed out, the tallest storms do not necessarily produce the largest rainfall rates; the existence of the RMAF structure is one important reason why this may be the case.
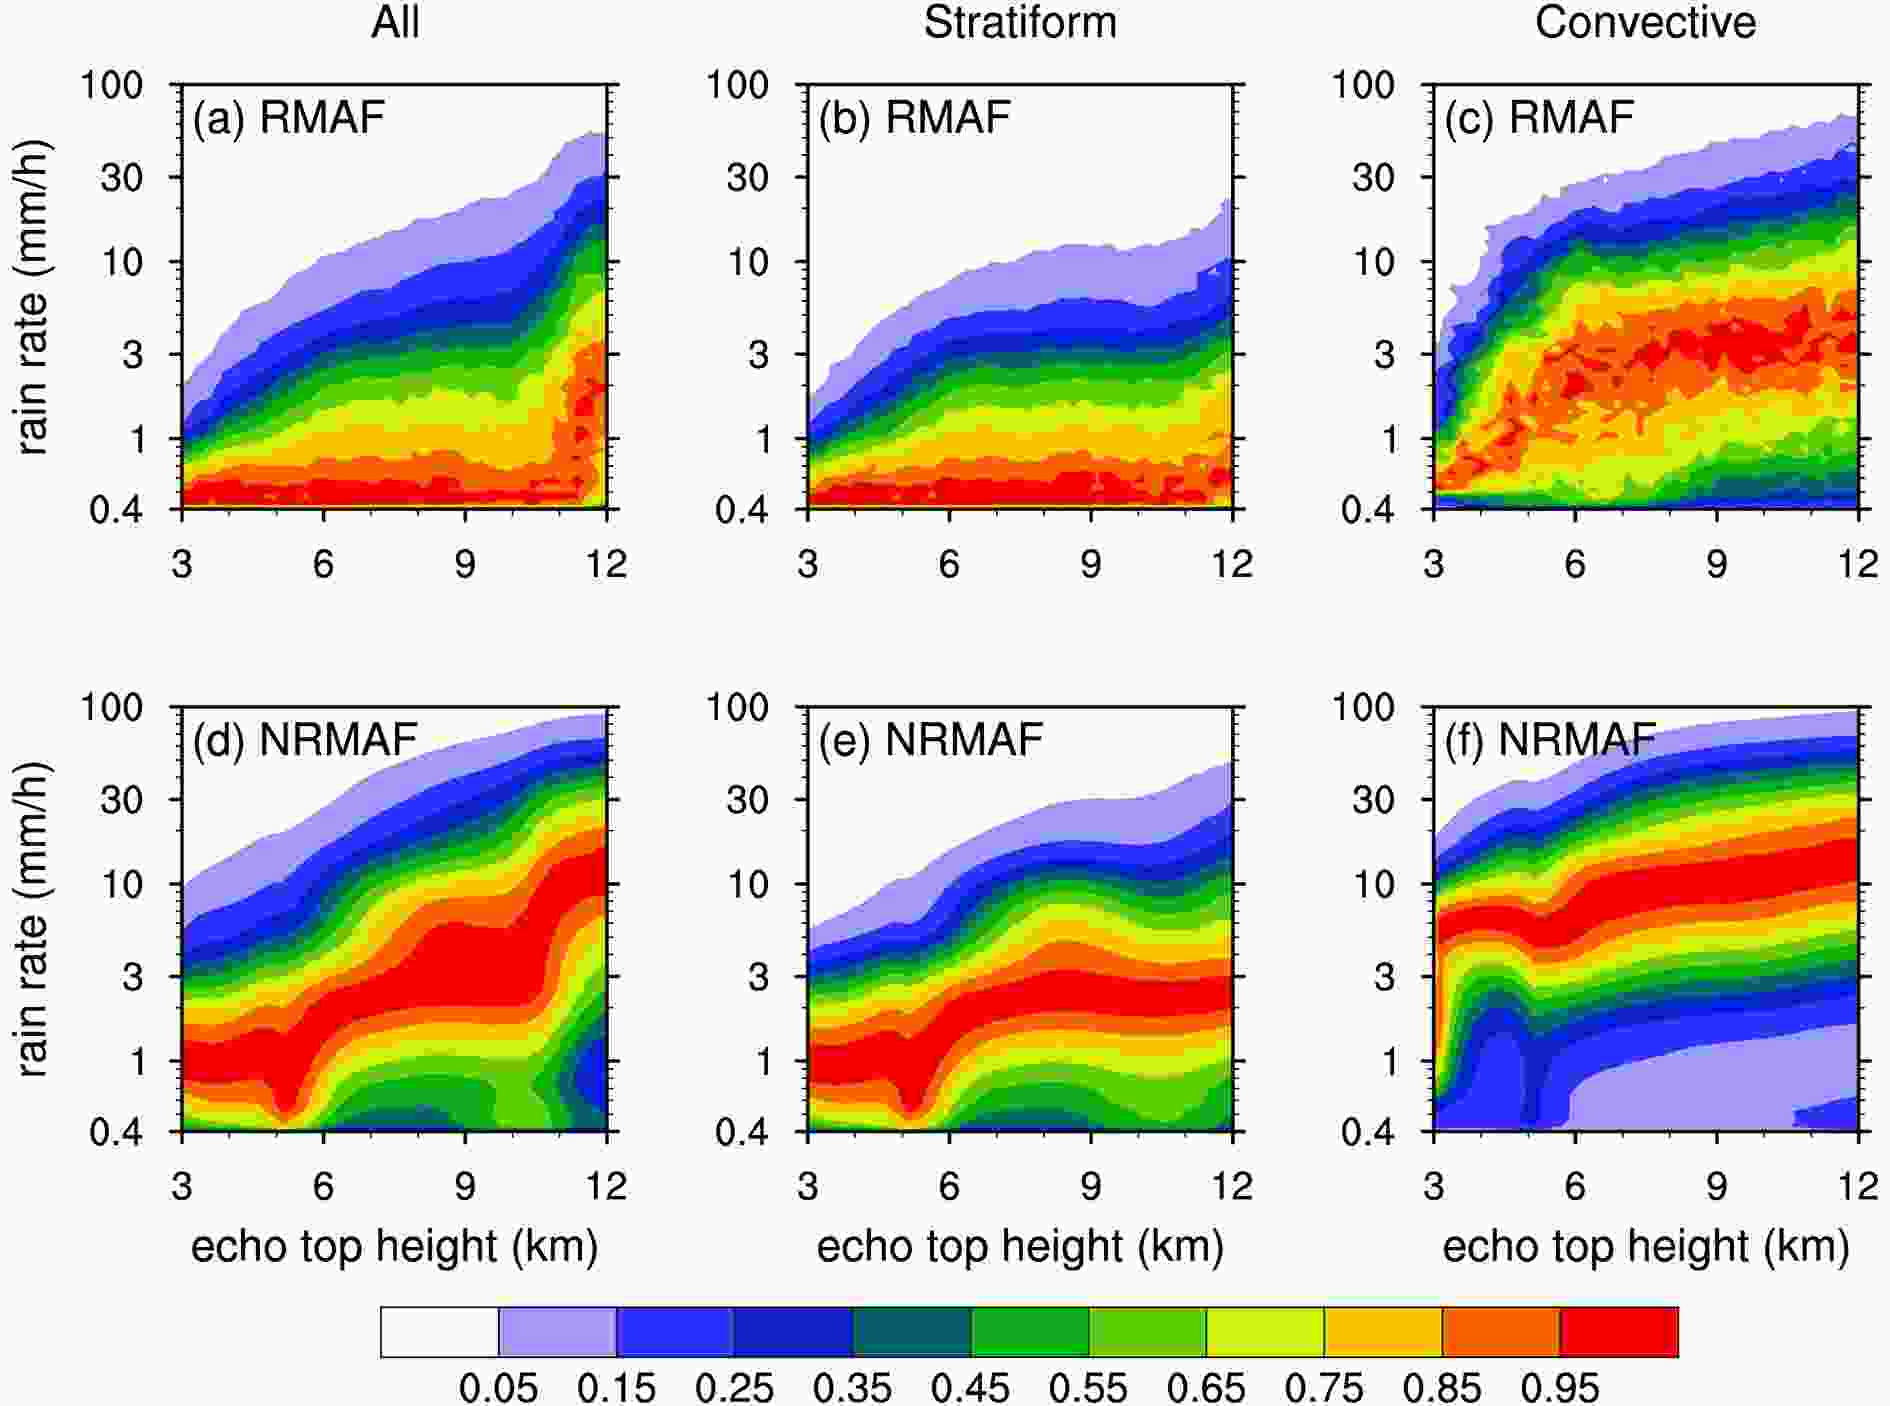 Figure10. Two-dimensional probability distributions of near-surface rain rate and echo top height for RMAF (a?c) and NRMAF (d?f) precipitation, derived from TRMM PR for 1998–2013. The spacing of the x-axis is 0.25 km, while the spacing of the y-axis is constant in Log coordinate [
The RMAF structure in reflectivity profiles can be effectively identified using our method. RMAF exists in both stratiform precipitation and convective precipitation regimes. Global distribution patterns show that RMAF frequency is not strongly affected by rain type. For the period of study, the RMAF frequency over land was higher than it was over the ocean. It is further noted that over land, the higher the elevation the higher the RMAF frequency. RMAF is not necessarily related to the activities of baroclinic systems since RMAF precipitation can occur in equatorial regions. Further analysis suggests that orographic lifting can enhance the middle-layer updraft in stratiform precipitation or the mid–lower layer updraft in convective precipitation, which is conducive to aggregation process and the occurrence of RMAF. RMAF frequency was lower in the lower latitudes than in the mid-latitudes due to the higher FzH, which inhibits the propagation of surface disturbances to the middle layer.
RMAF height was found to bein the range of 0.25?3 km above FzH. The average RMAF height within stratiform precipitation was around 1.35 km above FzH and lower than the previous observations of 1.5?2.5 km (Houze and Medina, 2005), which may be due to the fact that previous observations were carried out over the western Mountains of North America. The average RMAF height within convective precipitation was around 2.01 km above FzH. In addition, RMAF height and ice layer depth exhibited a strong positive correlation. The RMAF height decreased with increasing elevation, which is consistent with the notion that elevated terrain tends to “squeeze” out the moisture and reduce the precipitation depth.
We found that the existence of RMAF increases echo top height, whereas it suppresses the near-surface rain rate regardless of the precipitation type. The PDFs of near-surface rain rate for precipitation with and without RMAF peaked at 0.4 mm h?1 and 1.05 mm h?1 respectively, while that of echo top height peaked at 7.5 km and 5.5 km. Further CFAD analysis showed that the RMAF structure enhanced the storm top height and precipitation processes above RMAF height, whereas it suppressed the downward propagation of ice particles and the near-surface rain rate. The existence of the RMAF structure could, at least, partially explain the weak linkage between the heaviest rainfall and tallest storms (Hamada et al., 2015).
The uncertainties and limitations of this study are as follows. Since the analyses performed in this study are mainly based on pixel-level values, the RMAF structure was shownto suppress the local near-surface rain rate. However, it may actually serve to increase the surrounding precipitation when analyzed from the perspective of precipitating systems, This possibility needs to be addressed in future research.. The RMAF structure in intense convective precipitation could be induced by the melting process rather than aggregation of ice particles.. This phenomenon would lead to an overestimation of RMAF frequency and an underestimation of RMAF height for convective precipitation. Future studies should optimize the identification criteria for RMAF in convective precipitation. Lastly, most of our results were based on the analysis of multi-year satellite observations. In future work, we will further investigate the triggering mechanism of the RMAF structure over mountainous regions like the Himalayas, by combining radar observations and reanalysis data.
Acknowledgements. This work was supported by the Special Program for Key Research and Development of Guangdong Province (Grant Number 2019B111101002), the Fundamental Research Funds for the Guangzhou Science and Technology Plan project (Grant Number 201903010036), National Natural Science Foundation of China (Grant Numbers 41675043, 41775094, and 42005062), and the Fundamental Research Funds for the Central Universities (Grant Number 20lgpy27).
