HTML
--> --> -->In recent years, it has been determined from NCCV research that the NCCV processes along different activity paths may have significantly different impacts on NEC climate factors during the early summer months. However, the current research data regarding the NCCV system’s overall intensity and frequency cannot meet the urgent demand for fine research on the NCCV. Therefore, it has become necessary to reexamine the classifications of the NCCV system. Previously, researchers have carried out investigations regarding accurate classifications of the NCCV system. For example, Sun et al. (1994) put forward the concept of a “north vortex, middle vortex, and south vortex” according to the occurrence locations of the NCCV. In another related study, Xie and Bueh (2012, 2015) used a rotating EOF analysis method to calculate the circulation fields on the peak value days of the NCCV system, and subsequently divided the NCCV into the following four types: Yenisei River type, Lake Baikal type, Ural?Yakutsk type, and Okhotsk Sea?Arctic Ocean type. The aforementioned classification process focused on the different atmospheric circulation types corresponding to the NCCV. Lian et al. (2016) reviewed the formation mechanisms of the different types of NCCV and divided the NCCV formation mechanisms into two types: the influences of land, sea, and topography, and the influences of atmospheric thermodynamic effects. In addition, Zhang et al. (2008) compared and analyzed the climate characteristics of the NCCV system in both large and small regions.
It was concluded in this study that there was no current research data available regarding the classifications of the NCCV system according to its activity path characteristics. However, some research achievements had previously been made in the activity path classifications of other weather systems. For example, Liu and Zhao (2020) classified the low vortex of the Sichuan Basin into five types according to its movement directions. For example, eastward movement type, northeast movement type, southeast movement type, west movement type, and less movement type. In the field of classifications of typhoon activity paths, some researchers have adopted more objective clustering analysis methods to carry out their examinations. For example, Zheng et al. (2013) and Peng et al. (2019) adopted k-means clustering methods to classify the tropical cyclone paths in the Northwest Pacific Ocean according to such characteristic parameters as typhoon locations, intensities, path lengths, and path directions, based on the research conducted by Nakamura et al. (2009). Wang et al. (2019) also used k-means clustering to objectively classify the propagation paths of the MJO. Therefore, in the present study, based on an objective identification method of the NCCV system, a machine learning method (k-means clustering) was adopted for the purpose of classifying the NCCV activity paths. The method comprehensively considered the generation origins, movement directions, movement velocities, etc. of the NCCV, and then verified the rationality of the classification results from two aspects: the atmospheric circulation configurations of the NCCV on each path, and its impact on the climate conditions of the NEC region. The goal of this study was to provide a new scientific basis for specific predictions of the early summer climate conditions in NEC. In addition, the objective classification of cold vortex activity paths by using the machine learning (k-means) method can comprehensively classify multiple characteristics of the cold vortex (such as the generation source, movement direction and movement distance), which cannot be achieved by subjective classification methods.
2.1. Data
The data used in this study included the daily precipitation observation data of 208 stations in the NEC region from June 1979 to June 2018, which were provided by the National Meteorological Information Center. In addition, the atmospheric circulation field data of the ERA-Interim (resolution: 1° × 1°), which were reanalyzed by ECMWF every six hours between 1979 and 2018, were utilized in this study. Figure 1 shows the spatial distribution of the aforementioned 208 meteorological stations in the NEC region.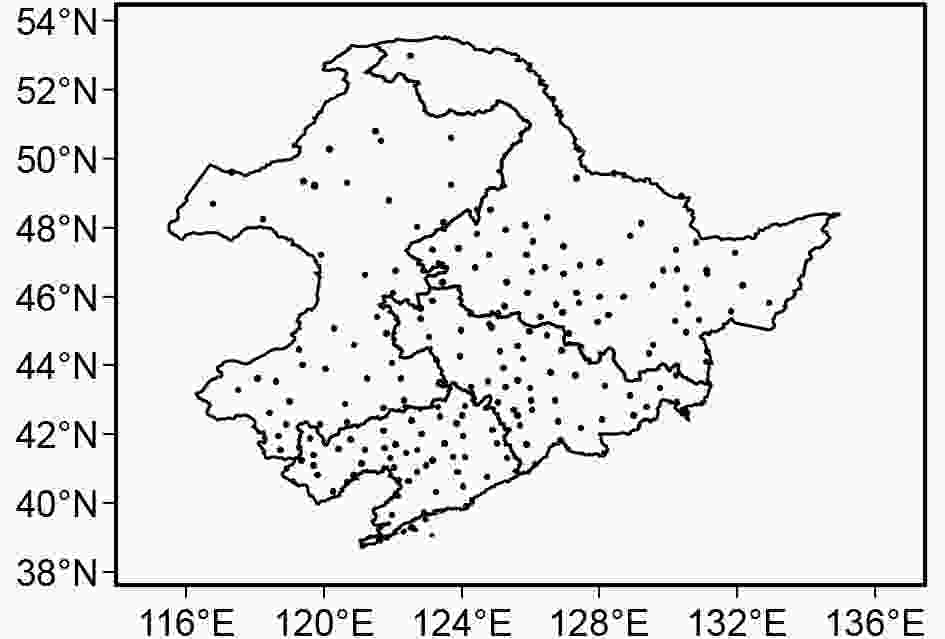 Figure1. Distribution of the 208 stations in the NEC region.
2
2.2. Research methods
This study mainly used a machine learning method (k-means clustering method) and a synthesis analysis method to analyze the research data content.3
2.2.1. Objective identification method for the NCCV system
Step 1. Tracing the equipotential height line: The equipotential height line was traced in the range of 500 to 600 dgpm on the 500 hPa isobaric surface, with an interval of 4 dgpm, using the ECMWF ERA-Interim data every six hours during the period ranging from June 1979 to June 2018, and the longitude and latitude values were output.Step 2. Screening the equipotential height line: Using the results obtained in Step 1, the closed equipotential height line in the range of 30°N to 80°N and 85°E to 150°E was screened out.
Step 3. Identification of the center of the NCCV system: The center of the innermost circle of the isopotential height line of the same system was defined as the NCCV center, and the average value of all the longitudes and latitudes of the innermost circle of the isopotential height line was identified as the center longitude and center latitude value. Only the NCCV systems with a center in the range of 30°N to 60°N and 95°E to 140°E were examined in this study. If there was a low-pressure center on the 500 hPa isobaric surface, the center corresponding to the low-pressure center with a temperature less than 0°C was selected as the NCCV center. Next, the time, latitude and longitude values of the NCCV center were output.
Step 4. Identification of the NCCV durations: This study determined that if two adjacent time levels had NCCV centers, and the distance between the two NCCV centers was less than 800 km, it could be regarded as the same NCCV system. The durations of the NCCV centers screened in Step 3 were counted, and the NCCV systems with duration greater than or equal to 72 hours were screened out. Then, the NCCV processes and the related variables were output.
Step 5. Rationality verification of the objective identification results: At this point, the obtained results were checked in order to determine whether or not the identified NCCV processes matched the NEC precipitation process times and geographical locations.
3
2.2.2. NCCV activity path classification based on a k-means method
32.2.2.1. Selection of the characteristic parameters of the NCCV activity paths
The parameters used in this study’s clustering process were determined according to the information that represented the characteristics of the NCCV activity paths. This included the generation origins, movement directions, and movement velocities. The longitude and latitude information of the starting points were selected, as well as the longitude information of ending points of the NCCV processes, in order to represent the generation origins and movement directions of the NCCV system. The average values of the latitudes and longitudes of the NCCV processes were calculated for the purpose of identifying the center positions of the NCCV processes. In addition, the variance diagonal(VOD) was calculated by using the formulawhere


The reason for the latitude information of the end points not being selected was that the longitude and latitude information of both the start points and the end points may have caused confusion in the clustering process. The analysis of all of the NCCV path laws showed that the processes of the NCCV mainly moved in an east?west direction. Therefore, the longitude differences between the starting point positions and the ending point positions were obvious. These data had been completely retained, while the latitude differences between the starting points and the ending points were relatively small. Therefore, the latitude information of the ending points was removed from the parameter selection. The latitudes of the ending points were indirectly represented by the latitudes of the starting points and the average value of the latitude.
3
2.2.2.2. Z-score transformation method
Due to the fact that there were two dimensions in the characteristic parameters, a data normalization process was required to have been performed before the clustering process commenced, in order to avoid the research results being influenced due to too many data differences. In this study, a Z-score standardization method was adopted. It was found that after processing, the data had conformed to the standard normal distribution. The average value of the entire data was 0, and the standard deviation was 1. The conversion function could be written as follows:where Z is the value after the Z-score transformation;

3
2.2.2.3. Brief introduction to the k-means clustering method and determination of the clustering numbers
k-means clustering originated from the field of signal processing and belongs to the category of unsupervised clustering in machine learning clustering analysis methods. The Euclidean distance is used to measure the similarity between samples, and data clustering is performed according to the degree of similarity. These methods are widely used in many fields due to their intuitive and fast characteristics.As the k-means clustering methods cannot determine the number of classifications independently, this study set the number of clusters as integers between 2 and 9, and then compared the silhouette coefficients of the different clustering results. The silhouette coefficient is calculated by the dissimilarity degree between the inside and outside of the cluster, and its value is between ?1 and 1. The closer the value is to 1, the better the classification result will be. Due to the fact that it can show the cohesion and separation of clustering results, the silhouette coefficients are important parameters used to measure the clustering effects. The larger the silhouette coefficient is, the better the classification effects will be (Wang et al., 2018). Figure 2 indicates that the silhouette coefficients were the largest when the number of clusters was four. Therefore, the number of clusters of the NCCV system was set as four in this study.
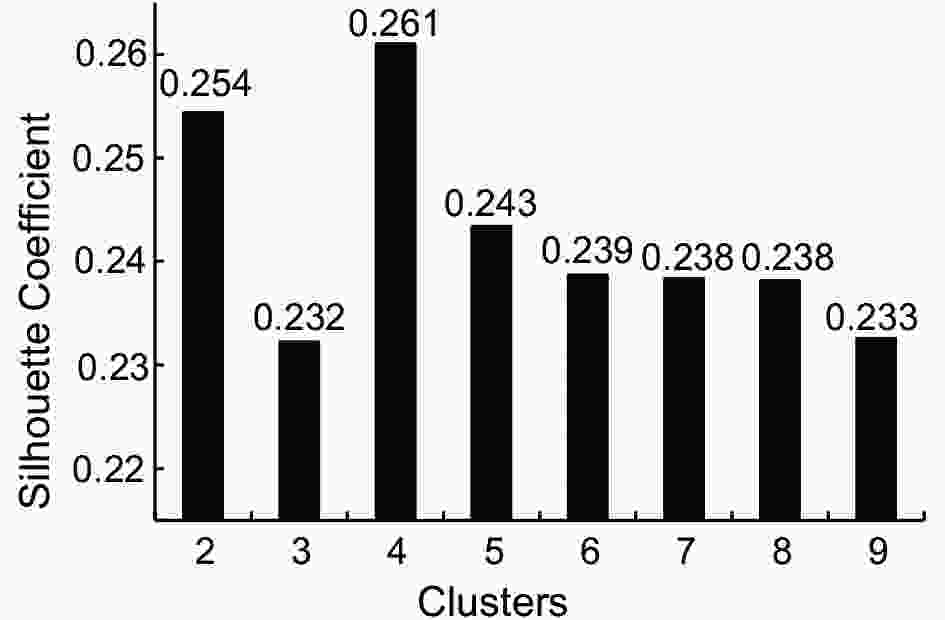 Figure2. k-means clustering numbers and the corresponding silhouette coefficient.
Figures 3a to d detail the process paths, positions of generation time levels, positions of peak time levels, and positions of the end time levels of the NCCV systems during the early summer months of 1979 to 2018. It can be seen in Fig. 3a that all of the NCCV process trajectories were roughly between 100°E to 140°E and 40°N to 60°N. The majority of the NCCV processes moved from west to east. However, the directions of movements were relatively disordered, and there was no obvious rule observed regarding whether the NCCV activity paths passed through the geographical scope of the northeastern region. It can be seen in Fig. 3b that the initial time (generation origin) positions of the NCCV processes were mainly in the ranges of 100°E to 125°E and 40°N to 60°N. The spatial distributions were relatively scattered, with the majority falling in the western section of the NEC region. As can be seen in Fig. 3c, the peak times of the NCCV (lowest time levels of the NCCV center potential height field) mainly ranged between 105°E to 135°E and 40°N to 60°N, which was in an eastward direction from the generation origins. The spatial distributions were also relatively scattered. However, the majority were located in the northeast and nearby areas. As detailed in Fig. 3d, the ultimate time positions of the NCCV were between 115°E to 140°E and 40°N to 60°N, which was further eastward than the peak positions. The spatial distributions were also relatively scattered, but were observed to be more compact relative to the generation origins and peak time positions. The ultimate time positions were mainly in the northeastern and eastern areas. In addition, parts of the NCCV processes died off as they entered the Sea of Japan. Generally speaking, it was difficult to summarize the common characteristics of the NCCV systems from the four aspects of activity paths, generation time positions, peak time positions, and end time positions. Therefore, this study carried out further classifications of the NCCV activity paths.
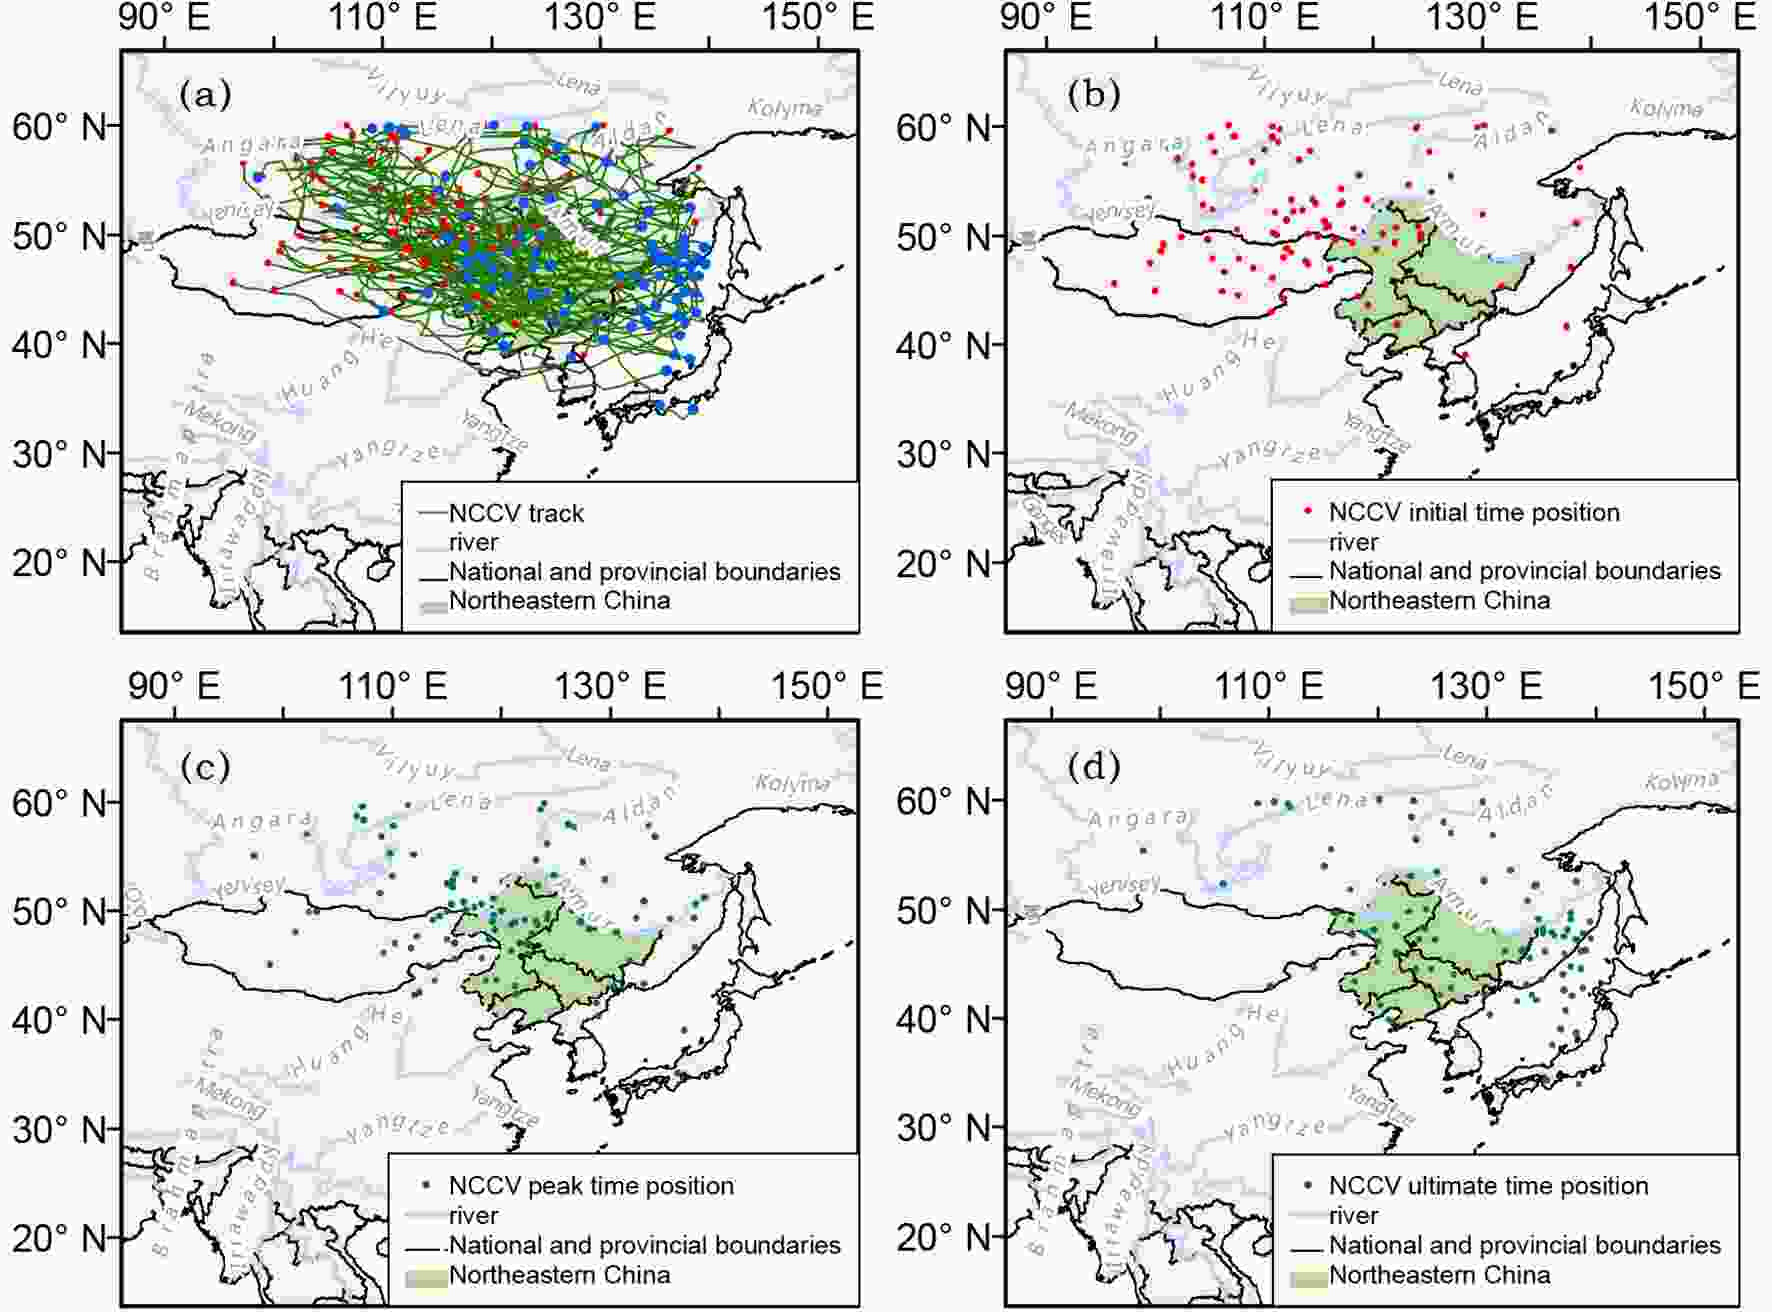 Figure3. NCCV processes from the early summer of 1979 to the early summer of 2018: (a) active paths (red dots indicate generation time, blue dots indicate ultimate time); (b) generation time positions; (c) peak time positions; and (d) ultimate time positions.
The dataset used in this study had six characteristics. Following the dimension reductions, the clustering results were displayed in the form of a two-dimensional scatter diagram. As seen in Fig. 4, the k-means method had made clear divisions in the characteristic data of the NCCV systems. The internal data of the four clusters were relatively concentrated, and there were clear distinctions between the clusters. There were small amounts of position crossings observed in the center of Fig. 4. These may have been caused by the fact that the data characteristics of those parts were similar, and some of the information may have been lost during the dimension reduction process, resulting in small deviations in the mapping results.
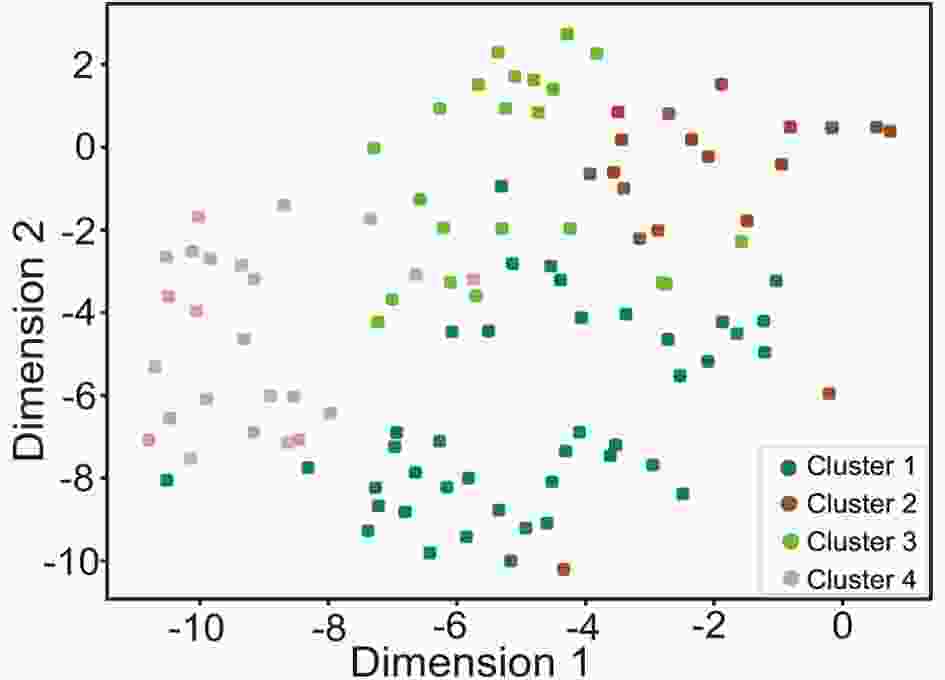 Figure4. Distributions of the NCCV clustering results after dimension reduction.
In the present study, after comprehensively considering the characteristics of the NCCV systems, such as the generation origins, movement directions, and movement velocities (distances), the activity paths of the NCCV were divided into four types. Figures 5a-5d show the distributions of the activity paths of the four types of NCCV systems. It can be seen that the generation origins of the first type of NCCV were mainly located in the eastern section of the Mongolian Plateau and southeast of Lake Baikal, moving in an eastward direction. The majority had passed through the NEC region, and some of the NCCV processes had moved eastward into the sea. Therefore, the first type of NCCV was referred to as the generation-eastward movement type (type A) of the Mongolian Plateau. The generation origins of the second type of NCCV systems were observed to be mainly located in the upper reaches of the Lena River and its vicinity, located to the north of Lake Baikal, and had moved in a southeastward direction. It was found that the majority had passed through the northwestern section of the NEC region. However, a few had also passed through the central and northern areas of the NEC region, and individual NCCV processes had moved southeast over the sea. The second type of NCCV is referred to in this study as the generation-southeast long-distance movement type (type B) of the upper reaches of the Lena River. The generation origins of the third type of NCCV system were mainly located near Lake Baikal and then moved eastward over short distances. It was found that only a small part of the NCCV had passed through the north areas of the NEC region. Therefore, the third type of NCCV is referred to as the generation-eastward less movement type near Lake Baikal (type C). Finally, the generation origins of the fourth type of NCCV system were mainly located in eastern Siberia and the northern areas of the NEC region, and had moved southward over small distances, with only a few of the NCCVs passing through the northern areas of the NEC region. In the present study, the fourth type of NCCV is referred to as the generation-southward less-movement type of eastern Siberia (type D).
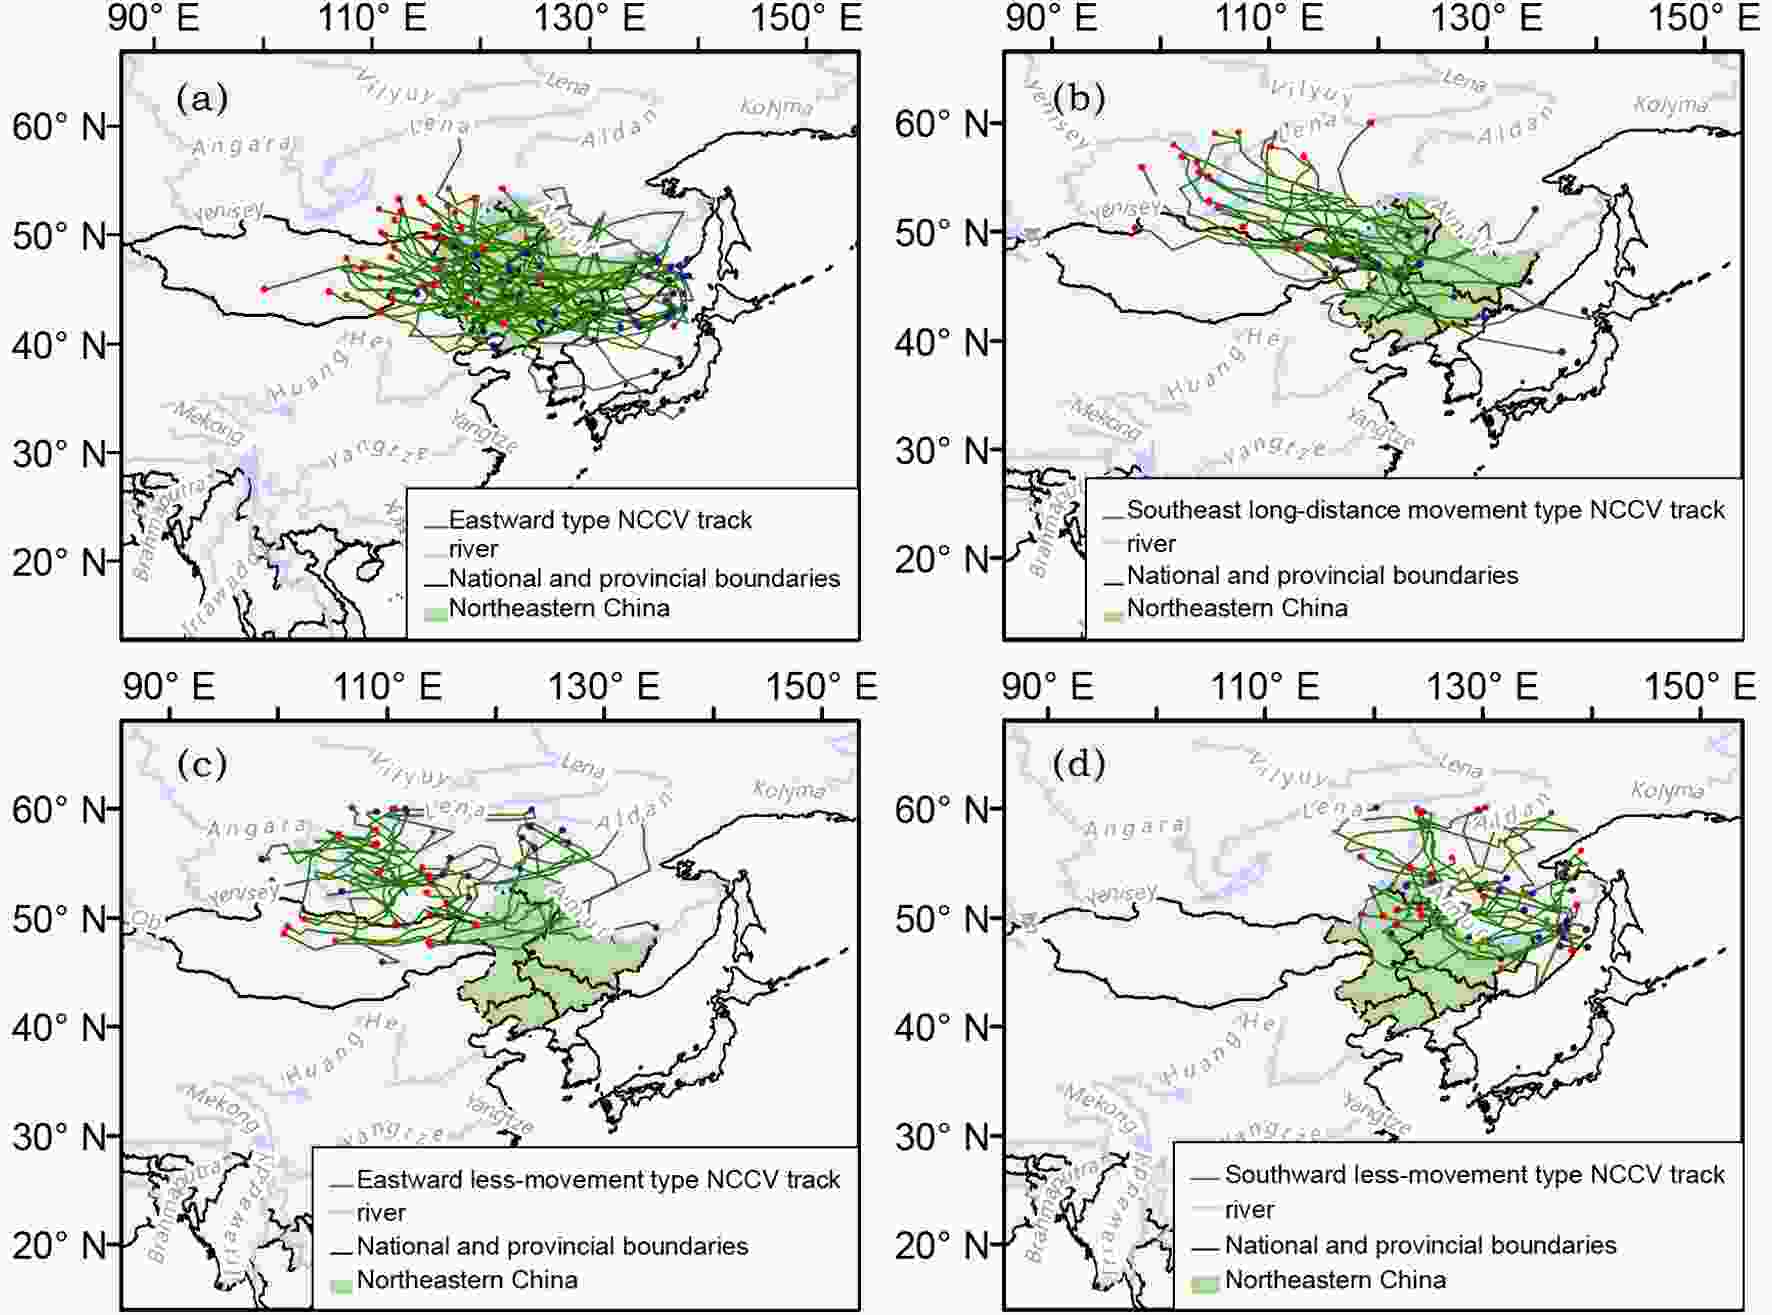 Figure5. Classification results of the NCCV activity paths: (a) type A; (b) type B; (c) type C; (d) type D. The red dots indicate the locations of the NCCV generation; the blue dots indicate the locations of the NCCV extinctions; and the green lines indicate the paths of the vortex movements.
In addition, according to the geographical NEC range of the NCCV activity paths, type A of the NCCV system may impact all areas of the NEC region. The activity paths of type B of the NCCV system mainly pass through the central and northern areas of the NEC region, among which the majority of the routes pass through the northwestern section. Type C and type D of the NCCV were observed to have less impact, and had only influenced part of the northern areas of the NEC region. Therefore, in this examination of the influences of the NCCV systems on the climate conditions of the NEC region, the focus was placed on the analyses of the eastward movement type and the southeast long-distance NCCV movement processes.
2
5.1. Atmospheric circulation backgrounds on the first days of the NCCV processes
As illustrated in Fig. 6, in order to define the atmospheric circulation backgrounds of each NCCV system on the generation days (representing the generation origin information), a composite graph of the 500 hPa geopotential height fields and 850 hPa wind fields on the first days of all the NCCV processes under each path type was generated in this study. According to the figure, it can be seen that the origin locations of type A NCCV systems (eastern part of the Mongolian Plateau) were controlled by the negative height anomalies that appeared in combination with the Okhotsk Sea blocking height in the northeast. The role of the Okhotsk Sea blocking height was to maintain and strengthen the negative anomaly centers. In addition, there was a relatively weak positive height anomaly center located to the west of Lake Baikal, in the upper reaches of the NCCV generation origin area, which was also conducive to the enhancement of the vortex over this type of NCCV system’s origin. Since the Okhotsk Sea blockage action in the lower reaches was stronger than the positive height anomaly in the upper reaches, the atmospheric circulation configurations of the eastward movement NCVV are referred to as an “east blocking type”. The origin locations of type B of the NCCV systems (upper reaches of the Lena River) were controlled by the negative height anomalies that extended southeast to the Sea of Japan through the NEC region, and corresponded to the activity paths of the southeast long-distance movement NCCV system type. The center of the negative height anomaly of the origin region occurred in conjunction with the Yenisei River blockage action in the northwest, and the East Siberian high-pressure in the northeast. Due to the strong Yenisei River blockage actions in the upper reaches, the atmospheric circulation configurations corresponding to the southeast long-distance movement NCCV are referred to as the “west blocking pattern” in this study. The origin locations of type C of the NCCV systems (near Lake Baikal) were controlled by a negative height anomaly. This negative height anomaly appeared in combination with the upstream Obi River blockage action and the downstream Okhotsk Sea?Japan Sea blocking actions. Although this distribution pattern was similar to the “west blocking type” on the whole, the distribution pattern was found to have a stronger eastern blocking and a larger scope, leading to the blockage of the eastward activities of the NCCV (short movement distance). Therefore, it corresponded to the eastward less-movement paths. The atmospheric circulation configurations corresponding to the eastward less-movement NCCV are referred to as the “double blocking type”. The origin locations of type D of the NCCV (south of East Siberia) were found to be controlled by negative height anomalies and extended southward slightly. Also, the corresponding NCCV systems were observed to move in a slightly southward direction. These negative height anomalies appeared in combination with the blocking actions from central Siberia to East Siberia on the northern side, and the atmospheric circulation configurations corresponding to the southward less-movement NCCV are referred to in this study as the “north blocking type”. Figure6. Composite graph for the atmospheric circulation fields on the first day of (a) type A, (b) type B, (c) type C, and (d) type D of the NCCV system processes. The isoline indicates a 500 hPa equipotential height line (units: gpm), and the arrows denote the 850 hPa vector wind field.
The 850 hPa wind fields corresponding to each type of NCCV system showed cyclonic rotations near the low-value centers of the height fields. With the exception of the southward less-movement type, the centers of the other three types of cyclones were located east of the low-value centers of the height fields. The wind field results confirmed that the northeast cold vortexes were deep systems, and displayed the baroclinic characteristics of tilting in a westward direction with height.
From the above-mentioned analysis results, it was determined that the atmospheric circulation patterns corresponding to the first days of the four types of NCCV processes were obviously different. In addition, they were consistent with the NCCV activity paths, which indicated that the achieved classification results were reasonable.
2
5.2. Atmospheric circulation backgrounds of all the occurrence days of the NCCV processes
For the purpose of clarifying the overall atmospheric circulation backgrounds of all the NCCV process types, composite graphs were constructed in this study for the atmospheric circulation fields of all the NCCV occurrence days under each type of path, as shown in Fig. 7. It can be seen in the figure that the low-value centers’ positions in the height fields were different in the composite graphs for the four NCCV processes during all the occurrence days. The low-value centers of type A of the NCCVs’ height fields were just over the NEC region, which may have had major impacts on the climate conditions of the area. The areas north of the low-value centers displayed positive height anomalies, and the low-value center height fields of type B of the NCCV were located in the eastern sections of the Mongolian Plateau to the northwest of the NEC region. Furthermore, the high-value centers were located northwest of Lake Baikal. It can also be observed that the low-value centers of height fields of type C of the NCCV systems were located near Lake Baikal. The northwestern and eastern sides displayed height anomalies. The eastern side contained positive anomalies that shortened the moving distance of that type of cold vortex to the east. Moreover, the low-value centers of height fields of type D of the NCCV systems were located near Sakhalin Island, and the northwestern and northern sides displayed positive height anomalies. It should be noted that the negative height anomaly centers of the first two types were relatively far from the generation origins, which was consistent with the characteristics of the relatively large movement distances of those two types of NCCV systems. The latter two types were observed to be very close to the generation origins, which was consistent with the characteristics of the small movement distances (less movement) of those two types of NCCV systems.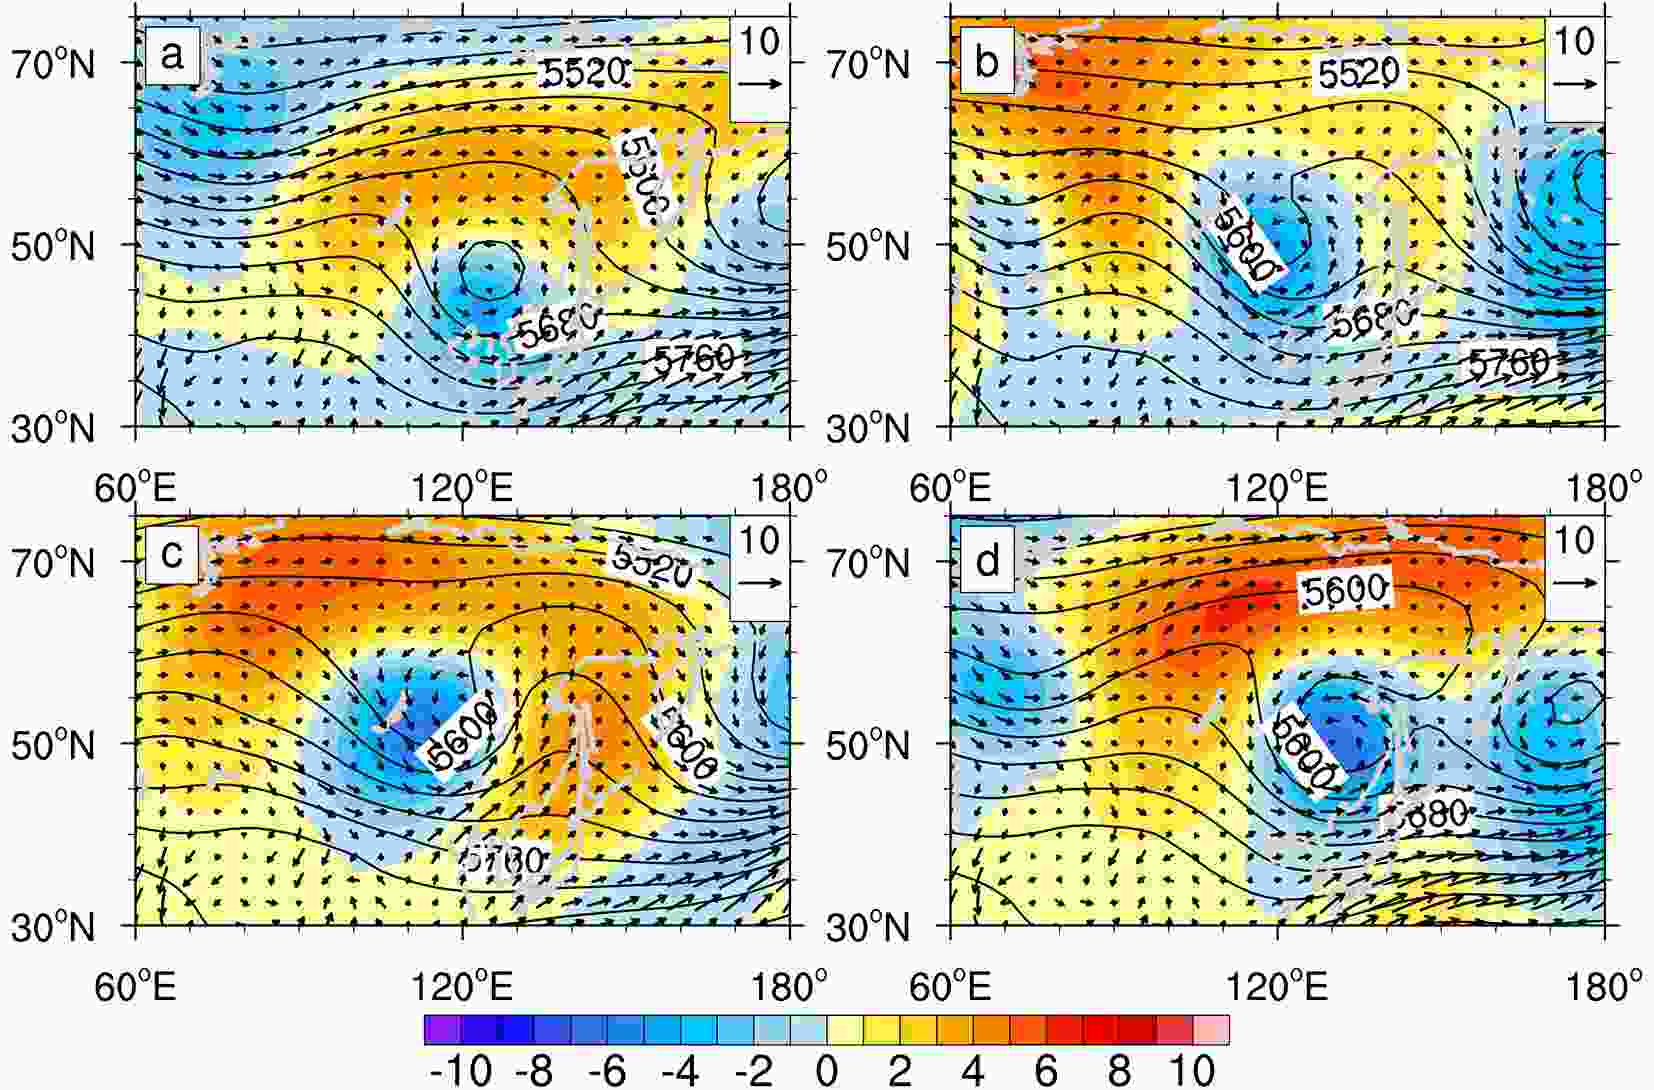 Figure7. As in Fig. 6 but for the atmospheric circulation fields on all of the NCCV occurrence days.
The 850 hPa wind fields corresponding to each type of NCCV system displayed cyclonic rotations near the low-value centers of the height fields. With the exception of type D of the NCCV, the centers of the other three types of cyclones were located east of the low-value centers of the height fields, which indicated the baroclinic characteristics of tilting westward with height.
2
5.3. Atmospheric circulation backgrounds on the peak days of the NCCV processes
In the current investigation, in order to clarify the atmospheric circulation backgrounds of all the types of NCCV systems on peak occurrence days, Fig. 8 shows this study’s composite graphs for the atmospheric circulation fields of the days with the lowest central geopotential heights of all the NCCV processes. It can be seen in the graphs that the type A and type B’s negative anomaly centers were near the NEC region. This indicated that the strongest days of the cold vortex were located near the geographical scope of the NEC region, which may have had major impacts on the climate conditions of the area. However, the negative anomaly centers of type C and type D were located relatively far away from the NEC region. For example, they were observed to be located in the northwestern and northeastern sections of the NEC region, respectively. Therefore, these NCCV processes had mainly affected the climate conditions in the northern parts of the NEC region. It was found in this study that the 850 hPa wind field characteristics corresponding to each NCCV type were consistent with those of the first day occurrences, as well as the overall occurrence days. Figure8. As in Fig. 6 but for the atmospheric circulation fields on the days with the lowest central potential heights of the NCCV processes.
2
6.1. Influences on the air temperature values
Figure 9 shows the composite graphs of the NEC region’s temperature anomalies that corresponded to the dates when all of the NCCV systems’ centers were within the NEC geographic range (38°?53°N, 116°?135°E). It can be seen from the graphs that when type A NCCV systems occurred, the air temperatures in the majority of the areas of the NEC region were low, and the low-temperature centers were located in the middle sections of the NEC region. However, the air temperatures in the entire NEC region were low in the case of occurrence of type B NCCVs, and the low-temperature centers were located in the northwestern sections, which was consistent with the conclusions that the southeast long-distance movement NCCV process type trajectories were mainly in the northwestern sections of the NEC region. When a type C NCCV system happened, the air temperatures in the northern section of the NEC region were low. However, since that type of NCCV was characterized by less movement, the low-temperature centers were located in the northwestern sections of the NEC region. In addition, the air temperatures in the north and the middle sections of the NEC region were low in the case of type D NCCVs, and the low-temperature centers were located in the northeastern sections. It can be seen from the above analysis results that the four types of NCCV processes had led to the abnormalities in the low-temperature values in different areas of the NEC region. Furthermore, there were good corresponding relationships observed between the locations of low-temperature values and the activity trajectories of the four types of NCCV systems.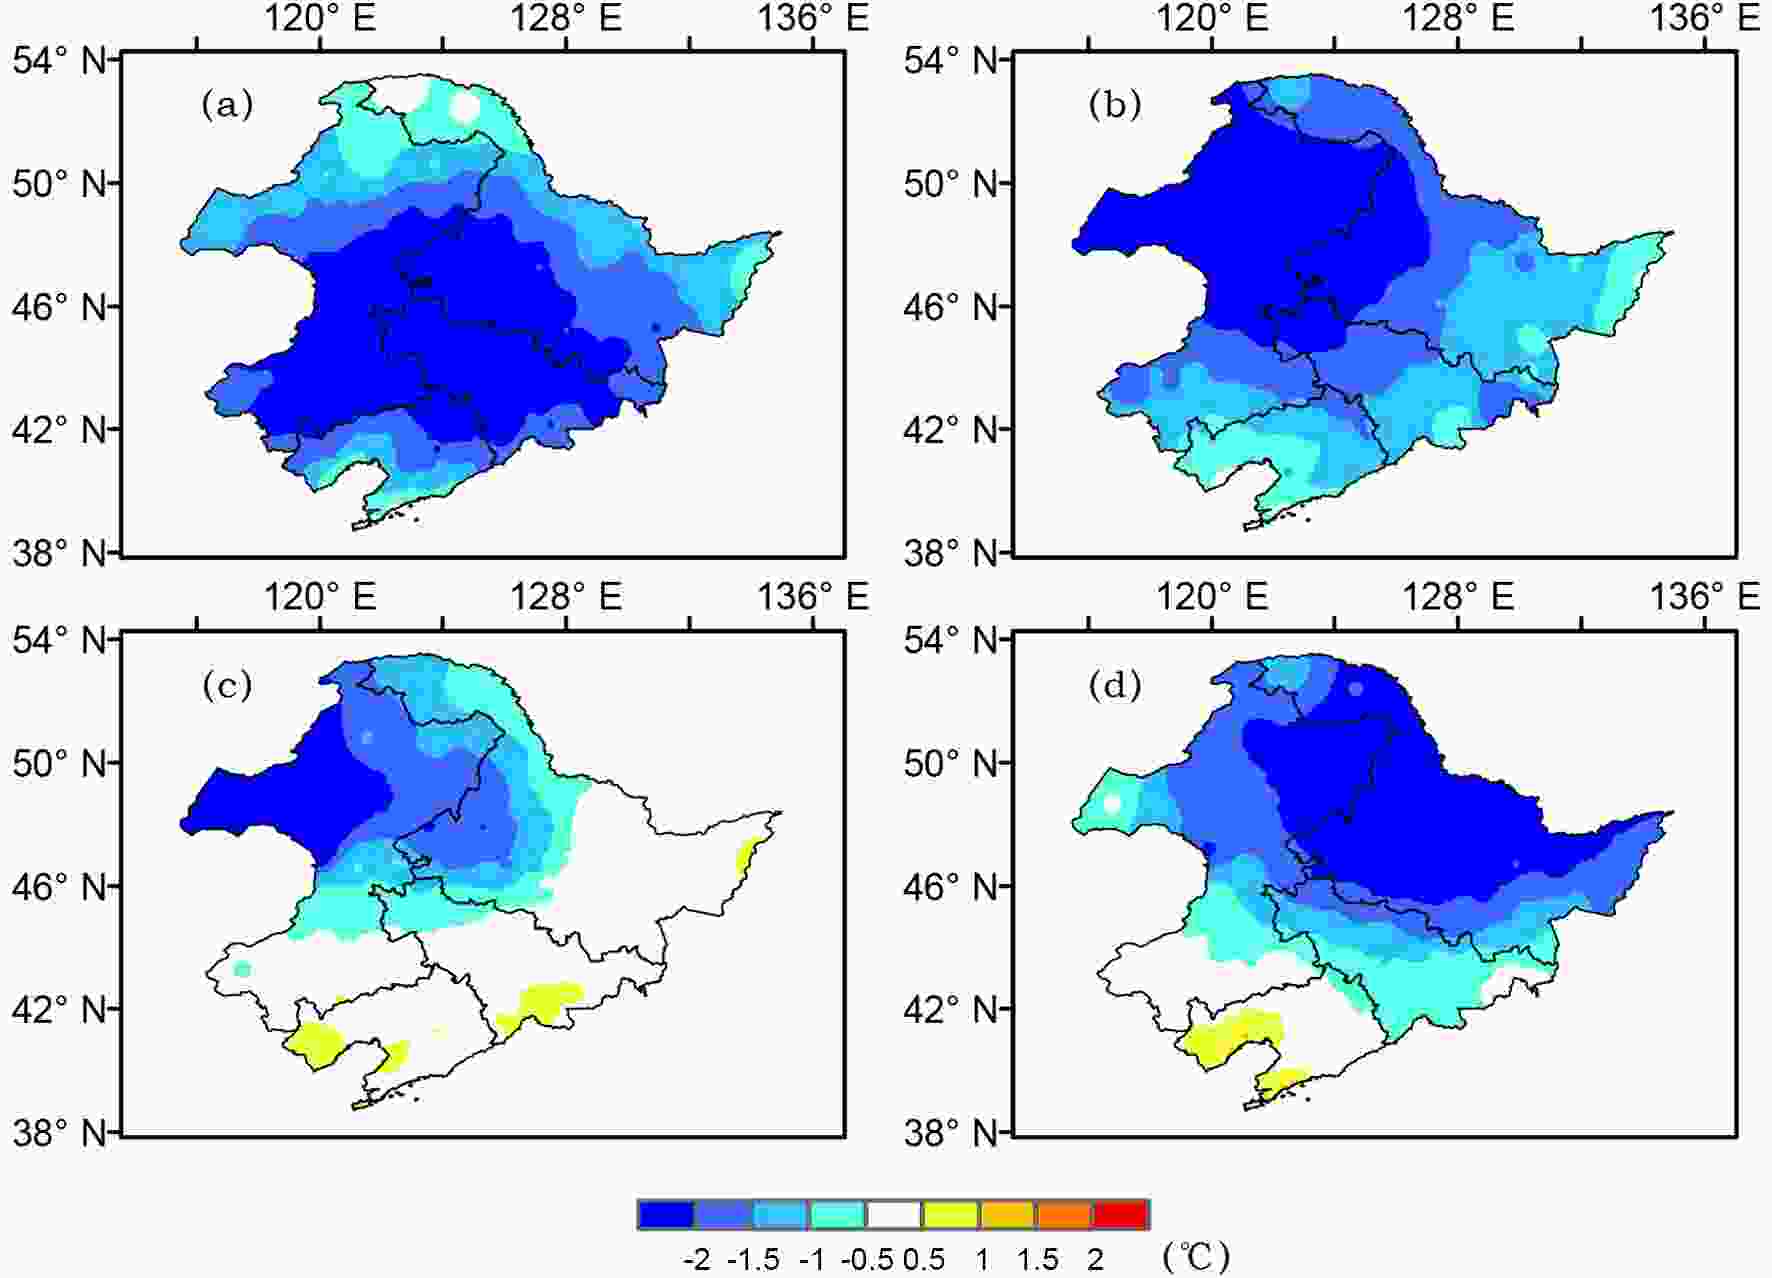 Figure9. Composite graphs of the air temperature anomalies in the NEC region corresponding to the dates when the center locations of (a) type A, (b) type B, (c) type C, and (d) type D NCCVs occurred within the NEC geographical area (units: °C).
2
6.2. Influences on the precipitation values
Similar to the aforementioned influences on the air temperatures, the influences of the various paths of the NCCV systems on precipitation levels in the NEC region were investigated in this study using a composite analysis method. Figure 10 shows the composite graphs of the percentages of NEC precipitation anomalies that corresponded to the dates when the centers of the NCCV systems were within the geographical range of the NEC region. It can be seen in the graphs that that when type A of the NCCV happened, the majority of the NEC region experienced unusually higher precipitation, and the highest rain centers were located in the middle and eastern sections of the NEC region. It can also be seen that when type B of the NCCV type occurred, the precipitation levels in the majority of the region were high, and the highest rain centers were located to the north and south of the central section of the NEC region. Also, the amount of rain in some regions had reached more than double the average. Moreover, the range of rainy areas was larger than that of type A of the NCCV systems. It is worth noting that, although the trajectories of type B of the NCCV systems were less than those of type A of the NCCV systems, the anomaly magnitudes and range of precipitation were larger than those of type A of the NCCV systems. When type C of the NCCV systems appeared, abnormally higher levels of precipitation had occurred in the northern and eastern sections of the NEC region. Also, the high rain centers were located in the northern part of the region, and the area that experienced more than double the average of precipitation was larger. Among those sections, the largest precipitation increases occurred in the southern part of the NEC region, which may have been due to other influencing factors. It was observed that when type D NCCV systems developed, the precipitation levels in the northeast parts of the NEC region increased. Therefore, from the above-mentioned observations, it was determined that the four types of NCCV processes had led to abnormal precipitation in different areas of the NEC region, and the positions of the high rain areas had displayed good corresponding relationships with the activity trajectories of the four types of NCCV systems. Figure10. As in Fig. 9 but with the precipitation anomaly percentages added.
Based on this study’s analyses of the influencing impacts of the four types of NCCV processes on the air temperature and precipitation levels in the NEC region, it was concluded that the sections in which all the types of NCCV paths passed through had corresponded well with the regions where the climate elements of the NEC region were observed to be abnormal. These findings further explain the rationality of the classification process of the NCCV activity paths proposed in this study.
(1) This study took into consideration the characteristics of the generation origins, movement directions, and movement velocities of the NCCV systems. The activity paths of the NCCV systems were divided into four types, as follows: (1) Generation-eastward movement type in the eastern section of the Mongolia Plateau (eastward movement type or type A); generation-southeast long-distance movement type in the upstream area of the Lena River (southeast long-distance movement type or type B); generation-eastward less-movement type near Lake Baikal (eastward less-movement type or type C); and the generation-southward less-movement type of East Siberia (southward less-movement type or type D).
(2) It was determined in this study that if the NCCV systems were considered from the point of view of their generation origins, there were obvious differences in the atmospheric circulation configurations of NCCVs in the four types of paths. These findings corresponded to the following types: (1) the interaction type between the Okhotsk Sea blockage and the eastern low vortex of the Mongolian Plateau (east blocking type); the interaction type between the Yenisei River blockage and the low vortex of the upper reaches of the Lena River (west blocking type); the interaction type between the Obi River blockage and Okhotsk Sea?Japan Sea blockage and the low vortex of Lake Baikal (double blocking type); and the interaction type between the Central Siberia?East Siberia blockage and southern low vortex in East Siberia (north blocking type).
(3) From the perspective of the low-value center positions of the atmospheric circulation flow fields on all of the cold vortex days during the NCCV processes, it was observed that they were consistent with the characteristics of the NCCV systems, including the movement directions and movement distances of the systems. In addition, it was found that according to the atmospheric circulation fields corresponding to the peak value days, the negative anomaly centers of type A and type B of the NCCV types were all located near the NEC region. Meanwhile, the negative anomaly centers of the type C and type D of the NCCV types were found to be located relatively far away from the NEC region.
(4) The influencing effects of NCCV processes on the temperature and precipitation levels in the NEC region were observed to differ among the four types of paths. Generally speaking, the areas in which the NCCV paths passed through had displayed abnormal characteristics of low temperature and excessive precipitation levels.
(5) Finally, from the point of view of the configurations of atmospheric circulations and the impacts on the climate conditions in the NEC region, there were observed to be obvious differences among the four types of NCCV processes. Those differences were found to be consistent with the characteristics of the activity paths, such as the generation origins, movement directions, and movement distances. These results indicated that this study’s classification results of the NCCV paths were reasonable.
Acknowledgements. This research was jointly supported by the National Natural Science Foundation of China (Grant No. 42005037), the Liaoning Provincial Natural Science Foundation Project (PhD Start-up Research Fund 2019-BS-214), the Special Scienti?c Research Project for the Forecaster (Grant No. CMAYBY2018-018); a Key Technical Project of Liaoning Meteorological Bureau (Grant No. LNGJ201903); the National Key Research and Development Project (Grant No. 2018YFC1505601); and the Open Foundation Project of the Institute of Atmospheric Environment, China Meteorological Administration (Grant Nos. 2020SYIAE08 and 2020SYIAEZD5).
