HTML
--> --> -->ETpan can be measured at a meteorological station, and the measurement is obtained using an evaporation pan with enough water supplies at an open site. AET can also be measured by a lysimeter, the eddy covariance technique, or Bowen ratio method (Wang et al., 2012a). However, unlike routine meteorological observations, in-situ measurements of AET are not available in many regions worldwide. In practice, AET is usually calculated by empirical methods (Gao et al., 2007). EPET cannot be directly observed and is usually estimated by empirical methods (referred to as EPET models) using meteorological parameters as inputs.
According to the types of input variables, EPET models can be classified as temperature-based, radiation-based, and combination models in which multiple meteorological parameters are used as the model inputs (Bormann, 2011). For instance, to estimate reference crop evapotranspiration (ETref), the Penman?Monteith (PM) method recommended by the Food and Agriculture Organization (FAO) is one of the combination models and is widely used to estimate EPET. This model requires temperature, radiation and wind speed as inputs (Allen et al., 1998). Using station-observed meteorological data as inputs, EPET computed with the FAO56 model indicates an overall downward trend in most parts of China (Gao et al., 2006; Yin et al., 2010a). Although the PM method is regarded as the most representative formula for estimating EPET and has been widely used in many studies (Gao et al., 2006; Zhang et al., 2007; Zuo et al., 2012), this model requires multiple surface meteorological quantities and several empirical coefficients, which are usually not easily obtainable. Therefore, other EPET models that require fewer inputs have been developed and used commonly in research. For instance, Samani and Pessarakli (1986) concluded that the temperature-based Hargreaves model can reasonably estimate EPET in regions with Arizonian climatic conditions. The traditional Priestley?Taylor model uses only air temperature and net radiation as inputs to compute EPET and has been adopted in various studies (Priestley and Taylor, 1972). Ding et al. (2013) incorporated the leaf area index, soil moisture and mulching fraction into the original Priestley?Taylor model and found that the modified model improved EPET estimates in cold and arid areas. In general, the performances of different EPET models are region dependent, and a specific model may not be suitable for all regions in China. Therefore, to obtain the most representative EPET model in each Chinese river basin, it is necessary to perform comprehensive evaluations of their performances.
Many studies have compared or evaluated EPET models over the past few decades (Jacobs et al., 2004; Lu et al., 2005; Douglas et al., 2009; Donohue et al., 2010; Bormann et al., 2011; Li et al., 2016; Paparrizos et al., 2017). The conclusions of these studies are quite different, and the “best” EPET models vary across different climate regimes. In contrast to EPET, the evaporation pan exchanges heat and moisture with the surrounding environment, which affects the water evaporation rate in the pan (ETpan) (Zuo et al., 2016). Although ETpan and EPET have different physical meanings and are derived from different approaches, many studies still regard ETpan as a surrogate for EPET (Liu et al., 2004; Yin et al., 2010b; Han et al., 2012). In China, meteorological stations routinely measure ETpan, which has been used to evaluate, or are regarded as, EPET models (Zhou et al., 2006; and Weiβ and Menzel, 2008). However, most previous studies have evaluated the performances of EPET models at only a few stations for a short time period (Xu et al., 2002; Li et al., 2016; Paparrizos et al., 2017), and the results may not be representative in large areas for a long time period. China has a vast land domain, and its climate condition varies regionally. It is necessary to investigate the applicability of different EPET models in different climate regimes.
In the current study, ETpan observations at 2267 stations for the period 1961?2013 are used to evaluate the performances of ten EPET models in ten Chinese river basins. Various statistical quantities are computed and inter-compared, and subsequently, the best-performing EPET model is obtained for each river basin. Finally, based on the best EPET model for each river basin, sensitivity analyses are also conducted for the EPET to the input meteorological variables.
2.1. Meteorological data
High-quality daily observations at 2425 meteorological stations were obtained from the National Meteorological Information Center of the China Meteorological Administration (As EPET is an important land surface hydrological element, and divisions of drainage basins are often used in hydrology research, China is divided into ten drainage basins (Fig. 1), including seven river basins [the Songhua River (143 stations), Liaohe River (89 stations), Haihe River (252 stations), Yellow River (307 stations), Huaihe River (211 stations), Yangtze River (661 stations), Pearl River (236 stations) basins] and three other drainage basins[Southeast China (SE, 110 stations), Southwest China (SW, 92 stations) and Northwest China (NW, 166 stations)]. Below, the analyses will be performed for those basins.
 Figure1. Distribution of ten drainage basins and the locations of 2267 meteorological stations in China. The station number in each basin is indicated in brackets.
2
2.2. EPET models
By reviewing the literature, a set of 10 different EPET models are adopted in our study (Table 1), and these models are widely used in various studies. They include four temperature-based models [Hargreaves (Hargreaves and Samani, 1985), Romanenko (Oudin et al., 2005), Hamon version1 (Lu et al., 2005) and Hamon version2 (Oudin et al., 2005)], four radiation-based models [Priestley?Taylor (Priestley and Taylor, 1972), Abtew (Oudin et al., 2005), Jensen?Haise (Jensen and Haise, 1963) and Makkink (Makkin, 1957)], and two combination models [Penman (Oudin et al., 2005) and FAO56 (Allen et al., 1998)]. Among those EPET models, radiation-based models require solar radiation (Rs) and net radiation (Rn) as inputs, which are usually not available from in-situ measurements. Empirical formulae with available meteorological variables can be used to derive radiation datasets (Allen et al., 1998; Yang et al., 2006). For example, Yang et al.(2006) proposed a hybrid method in which surface radiation was a function of the sunshine duration. Then, the researchers used this method to calculate Rs in China, the USA and Saudi Arabia and found that the modeled Rs values were the most consistent with the observations when compared to those from other methods. Here, we adopted the method of Yang et al. (2006) to compute Rs:| EPET models | References |
| $ {\mathrm{P}\mathrm{E}\mathrm{T}}_{\mathrm{H}\mathrm{a}\mathrm{r}}=0.0023{R}_{\mathrm{a}}{\left({T}_{\max}-{T}_{\mathrm{m}\mathrm{i}\mathrm{n}}\right)}^{0.5}({T}_{\mathrm{a}}+17.8) $ | (Hargraves et al., 1985) |
| ${\mathrm{P}\mathrm{E}\mathrm{T} }_{\mathrm{R}\mathrm{o}\mathrm{m} }=4.5{\left(1+\dfrac{ {T}_{\mathrm{a} } }{25}\right)}^{2}\left(1-\dfrac{ {e}_{\mathrm{a} } }{ {e}_{\mathrm{s} } }\right)$ | (Oudin et al., 2005) |
| ${\mathrm{P}\mathrm{E}\mathrm{T} }_{\mathrm{H}\mathrm{a}\mathrm{m}1}=0.1651\times \dfrac{\mathrm{S}\mathrm{D} }{12}\times \dfrac{216.7\times 6.108 {\mathrm{e} }^{\dfrac{17.26939 {T}_{\mathrm{a} } }{ {T}_{\mathrm{a} }+237.3} } }{ {T}_{\mathrm{a} }+273.3}\times 1.2$ | (Lu et al., 2005) |
| ${\mathrm{P}\mathrm{E}\mathrm{T} }_{\mathrm{H}\mathrm{a}\mathrm{m}2}={\left(\dfrac{\mathrm{S}\mathrm{D} }{12}\right)}^{2}{\mathrm{e} }^{\left(\frac{ {T}_{\mathrm{a} } }{16}\right)}$ | (Oudin et al., 2005) |
| ${\mathrm{P}\mathrm{E}\mathrm{T} }_{\mathrm{P}\mathrm{T} }=\alpha \dfrac{\Delta }{\Delta +\mathrm{\gamma } }\dfrac{ {R}_{\mathrm{n} } }{\lambda }$ | (Priestley and Taylor, 1972) |
| ${\mathrm{P}\mathrm{E}\mathrm{T} }_{\mathrm{A}\mathrm{b}\mathrm{t} }=0.53\dfrac{ {R}_{\mathrm{s} } }{\lambda }(1-\alpha)$ | (Oudin et al., 2005) |
| $ {\mathrm{P}\mathrm{E}\mathrm{T}}_{\mathrm{J}\mathrm{e}\mathrm{n}}=0.408[0.014\left({1.8T}_{\mathrm{a}}+32\right)-0.37]{R}_{\mathrm{s}} $ | (Jensen and Haise, 1963) |
| ${\mathrm{P}\mathrm{E}\mathrm{T} }_{\mathrm{m}\mathrm{a}\mathrm{k} }=0.61\left(\dfrac{ {\Delta } }{ {\Delta }+\mathrm{\gamma } }\right)\dfrac{ {R}_{\mathrm{s} } }{\mathrm{\lambda } }-0.12$ | (Makkink, 1957) |
| ${\mathrm{P}\mathrm{E}\mathrm{T} }_{\mathrm{P}\mathrm{e}\mathrm{n}\mathrm{m}\mathrm{a}\mathrm{n} }=\dfrac{ {\Delta }{R}_{\mathrm{n} }+2.6\mathrm{\gamma }\left({e}_{\mathrm{s} }-{e}_{\mathrm{a} }\right)(1+0.536{U}_{2})}{\lambda \mathrm{\rho }({\Delta }+\mathrm{\gamma })}$ | (Oudin et al., 2005) |
| ${\mathrm{P}\mathrm{E}\mathrm{T} }_{\mathrm{F}\mathrm{A}\mathrm{O}56}=\dfrac{0.408{\Delta }{R}_{\mathrm{n} }+\mathrm{\gamma }\dfrac{900}{\mathrm{T}+273}{U}_{2}\left({e}_{\mathrm{s} }-{e}_{\mathrm{a} }\right)}{ {\Delta }+\mathrm{\gamma }(1+0.34{U}_{2})}$ | (Allen et al., 1998) |
Table1. The EPET models used in the study. The input variables of these formulae include: Ta = mean air temperature (°C), Tmax = maximum temperature (°C), Tmin = minimum temperature (°C), SD = sunshine duration (h), γ = psychrometric constant (kPa °C?1), Δ = slope of the vapor pressure curve (kPa °C?1), λ= latent heat of vaporization (MJ kg?1), α = surface albedo, es = saturation vapor pressure (kPa), ea = actual vapor pressure (kPa), U2 = wind speed at 2 m height (m s?1), Rs = global solar radiation (MJ m?2), Ra = extraterrestrial radiation (MJ m?2), and Rn = net radiation (MJ m?2).
where Rs is the solar radiation; Rc is the solar radiation under clear-sky conditions, which is calculated by meteorological observations, ozone absorption and turbidity coefficients; n is the measured sunshine duration; N is the maximum possible sunshine duration; and a0, a1 and a2 are regression coefficients. Equation (1) has been widely applied in many studies (Yang et al., 2010; Tang et al., 2011; Wang et al., 2012b; He et al., 2018). In addition, we also adopted the coefficients of Wang et al. (2012b), in which a0 is 0.33, a1 is 0.70, and a2 is ?0.02 in Eq. (1), which were derived from meteorological station variables.
According to the principle of the conservation of energy, Rn is the difference between incoming net shortwave radiation (Rns) and the outgoing net longwave radiation[Rnl, Eq. (2)]. The FAO has also provided equations to calculate these variables (Allen et al., 1998). Moreover, Yin et al.(2008) used radiation measurements in China to calibrate the Rnl models and found that the Penman method (1948), in Eq. (4), was more accurate than the FAO24 and FAO56-PM models:
where α= 0.23 is the albedo for the reference crop,

In the Penman and FAO models, the 2-m wind speed is needed (Table 1). Thus, we converted the 10-m wind speed to 2-m wind speed using the wind profile formula (Allen et al., 1998):
where U2 is the wind speed at 2 m above the ground surface (m s?1) and Uz is the measured wind speed at z m above the ground surface (m s?1), which is 10 m in this study.
In the Hargreaves and Jensen?Haise models, the EPET is a function of Ta and Rs. From these models (Table 1), when Ta is lower than ?17.8°C for the Hargreaves model and ?3.1°C for the Jensen?Haise model, the EPET would be negative. These are not correct in reality. Similarly, the Priestley?Taylor method requires Ta and Rn as inputs. However, Rs occurs only in the daytime, but the Rnl is available for both daytime and nighttime. During the cold season in high latitudinal regions, the relatively short daytime SD would also reduce the Rs, leading to Rnl values greater than Rns. Under the above two circumstances, Rn will be less than zero, and then, the EPET from the Priestley?Taylor model would also be negative. As an important factor of agriculture, EPET is more prominent during the crop growing seasons than in other seasons, and EPET should be very small or even negligible in the cold seasons. To avoid appearance of a negative EPET value due to the meteorological inputs in some EPET models, our analyses are confined to the growing season of March to October during each year. After the above procedure, EPET is set as the missing value if it is still less than zero.
2
2.3. Sensitivity analysis
To estimate the effects of changes in various meteorological factors on modeled EPET, sensitivity analyses are also conducted for each EPET model. Because different EPET models have different structures and input requirements and these input variables have diverse magnitude ranges, it is difficult to directly conduct the EPET sensitivity analysis with different input variables (Gong et al., 2006). In this study, we adopt a dimensionless relative sensitivity coefficient (SC), which has been widely used in ET studies (McCuen, 1974; Gong et al., 2006; Yin et al., 2010a; Zuo et al., 2012):where SC is the sensitivity coefficient, and X is one of the model input variables. SC represents the relative change in EPET induced by the relative change in the meteorological factor X. In other words, the relative change in X multiplied by SC equals the relative change in EPET. For example, SC=0.1 indicates that 10% of X change would cause 1% of EPET change. A positive (negative) SC represents that changes in EPET are consistent (inconsistent) with those in X. The higher SC is, the stronger the X effect imposed on EPET will be. However, SC cannot fully reflect the impact of each meteorological factor on the EPET changes. A literature review of previous studies revealed that EPET was the most sensitive to RH in the Yangtze River basin (Gong et al., 2006) and the Weihe River basin (Zuo et al., 2012) in China. However, Yin et al. (2010b) reported that RH was only a highly sensitive but not a dominant factor of EPET, and its insignificant trend during 1971?2008 could only induce a small change in EPET. To further address this issue, we combined the relative change (RC) in each input variable and its SC for EPET attribution analysis. The RC (units: %) is described as follows (Yin et al., 2010a):
where TX is the linear trend in the annual time series for any variable X, and |X| is its absolute mean during the past 53 years. RC represents the mean percentage change in the variable X during the study period. Based on Eqs. (6) and (7), we also conducted attribution analyses below. At each station, we recalculated the EPET with individual input meteorological variables changing from ?10% to 10% by assuming that other factors remained unchanged (Yin et al., 2010b). Then, we calculated SC using Eq. (6) and RC using Eq. (7). The product of SC and RC denotes the relative contribution (RCT) of the target meteorological variable to the EPET change. Inter comparisons of RCTs for different meteorological factors can represent the relative importance of each metrological variable for the EPET change.
2
2.4. Ranking scheme
To quantify the differences between modeled EPET and ETpan, we compute three statistical quantities, including the ratio of EPET standard deviations to that of ETpan, the correlation coefficient, and the ratio of EPET trends to ETpan trends. Moreover, to evaluate the performance of EPET models in terms of those statistical quantities in each basin, a ranking scheme is utilized. Wang et al. (2012c) applied this approach to rank four statistical quantities between reanalysis products and observations in the Tibetan Plateau to evaluate the performances of each reanalysis product. In the present study, based on each statistical quantity, the mean ranking scores from 1 to 10 are given to each EPET model. The ranking score is computed as follows: Among all 10 EPET models, the highest correlation coefficient is given a ranking score of 1, and the lowest one is given a score of 10. Regarding the ratio of standard deviations and the ratio of trends, 1 is given to the model with the ratio closest to 1, and 10 indicates the ratio farthest away from 1. Then, we average all ranking scores of three quantities in each basin, and the mean magnitude from the lowest to the highest represents the closest to the least close relationships between EPET models and ETpan.3.1. Spatial distribution and magnitude of the modeled EPET
Figure 2 shows the spatial distribution of the multiple growing seasonal mean EPET and ETpan from 1961 to 2013. This figure shows the apparent spatial variations in EPET. At the majority of stations, the mean ETpan is above 4 mm d?1. The stations with relatively low ETpan are mainly located in the Yangtze River basin and Liaohe River basin, while large values appear in the Yellow River basin and Northwest China, where the magnitude of ETpan is generally larger than 8 mm d?1 at most stations. In terms of magnitudes, PETRom is more consistent with ETpan than other models, with a mean EPET above 3 mm d?1 at 85% of stations in China and even larger than 8 mm d?1 in Northwest China. For the distribution pattern, PETRom is also the closest to ETpan, and the spatial correlation coefficient is up to 0.86. PETFAO and PETAbt also correlate well with ETpan, while the spatial correlation coefficients are 0.72 and 0.74, respectively. Compared to other models and ETpan, the EPET values from both PETHam1 and PETHam2 are relatively low, especially for PETHam2, with values of less than 2 mm d?1 at 93% of stations. In addition, for the radiation-based models, the PETJen produces the largest value with a magnitude larger than 4 mm d?1 in eastern China.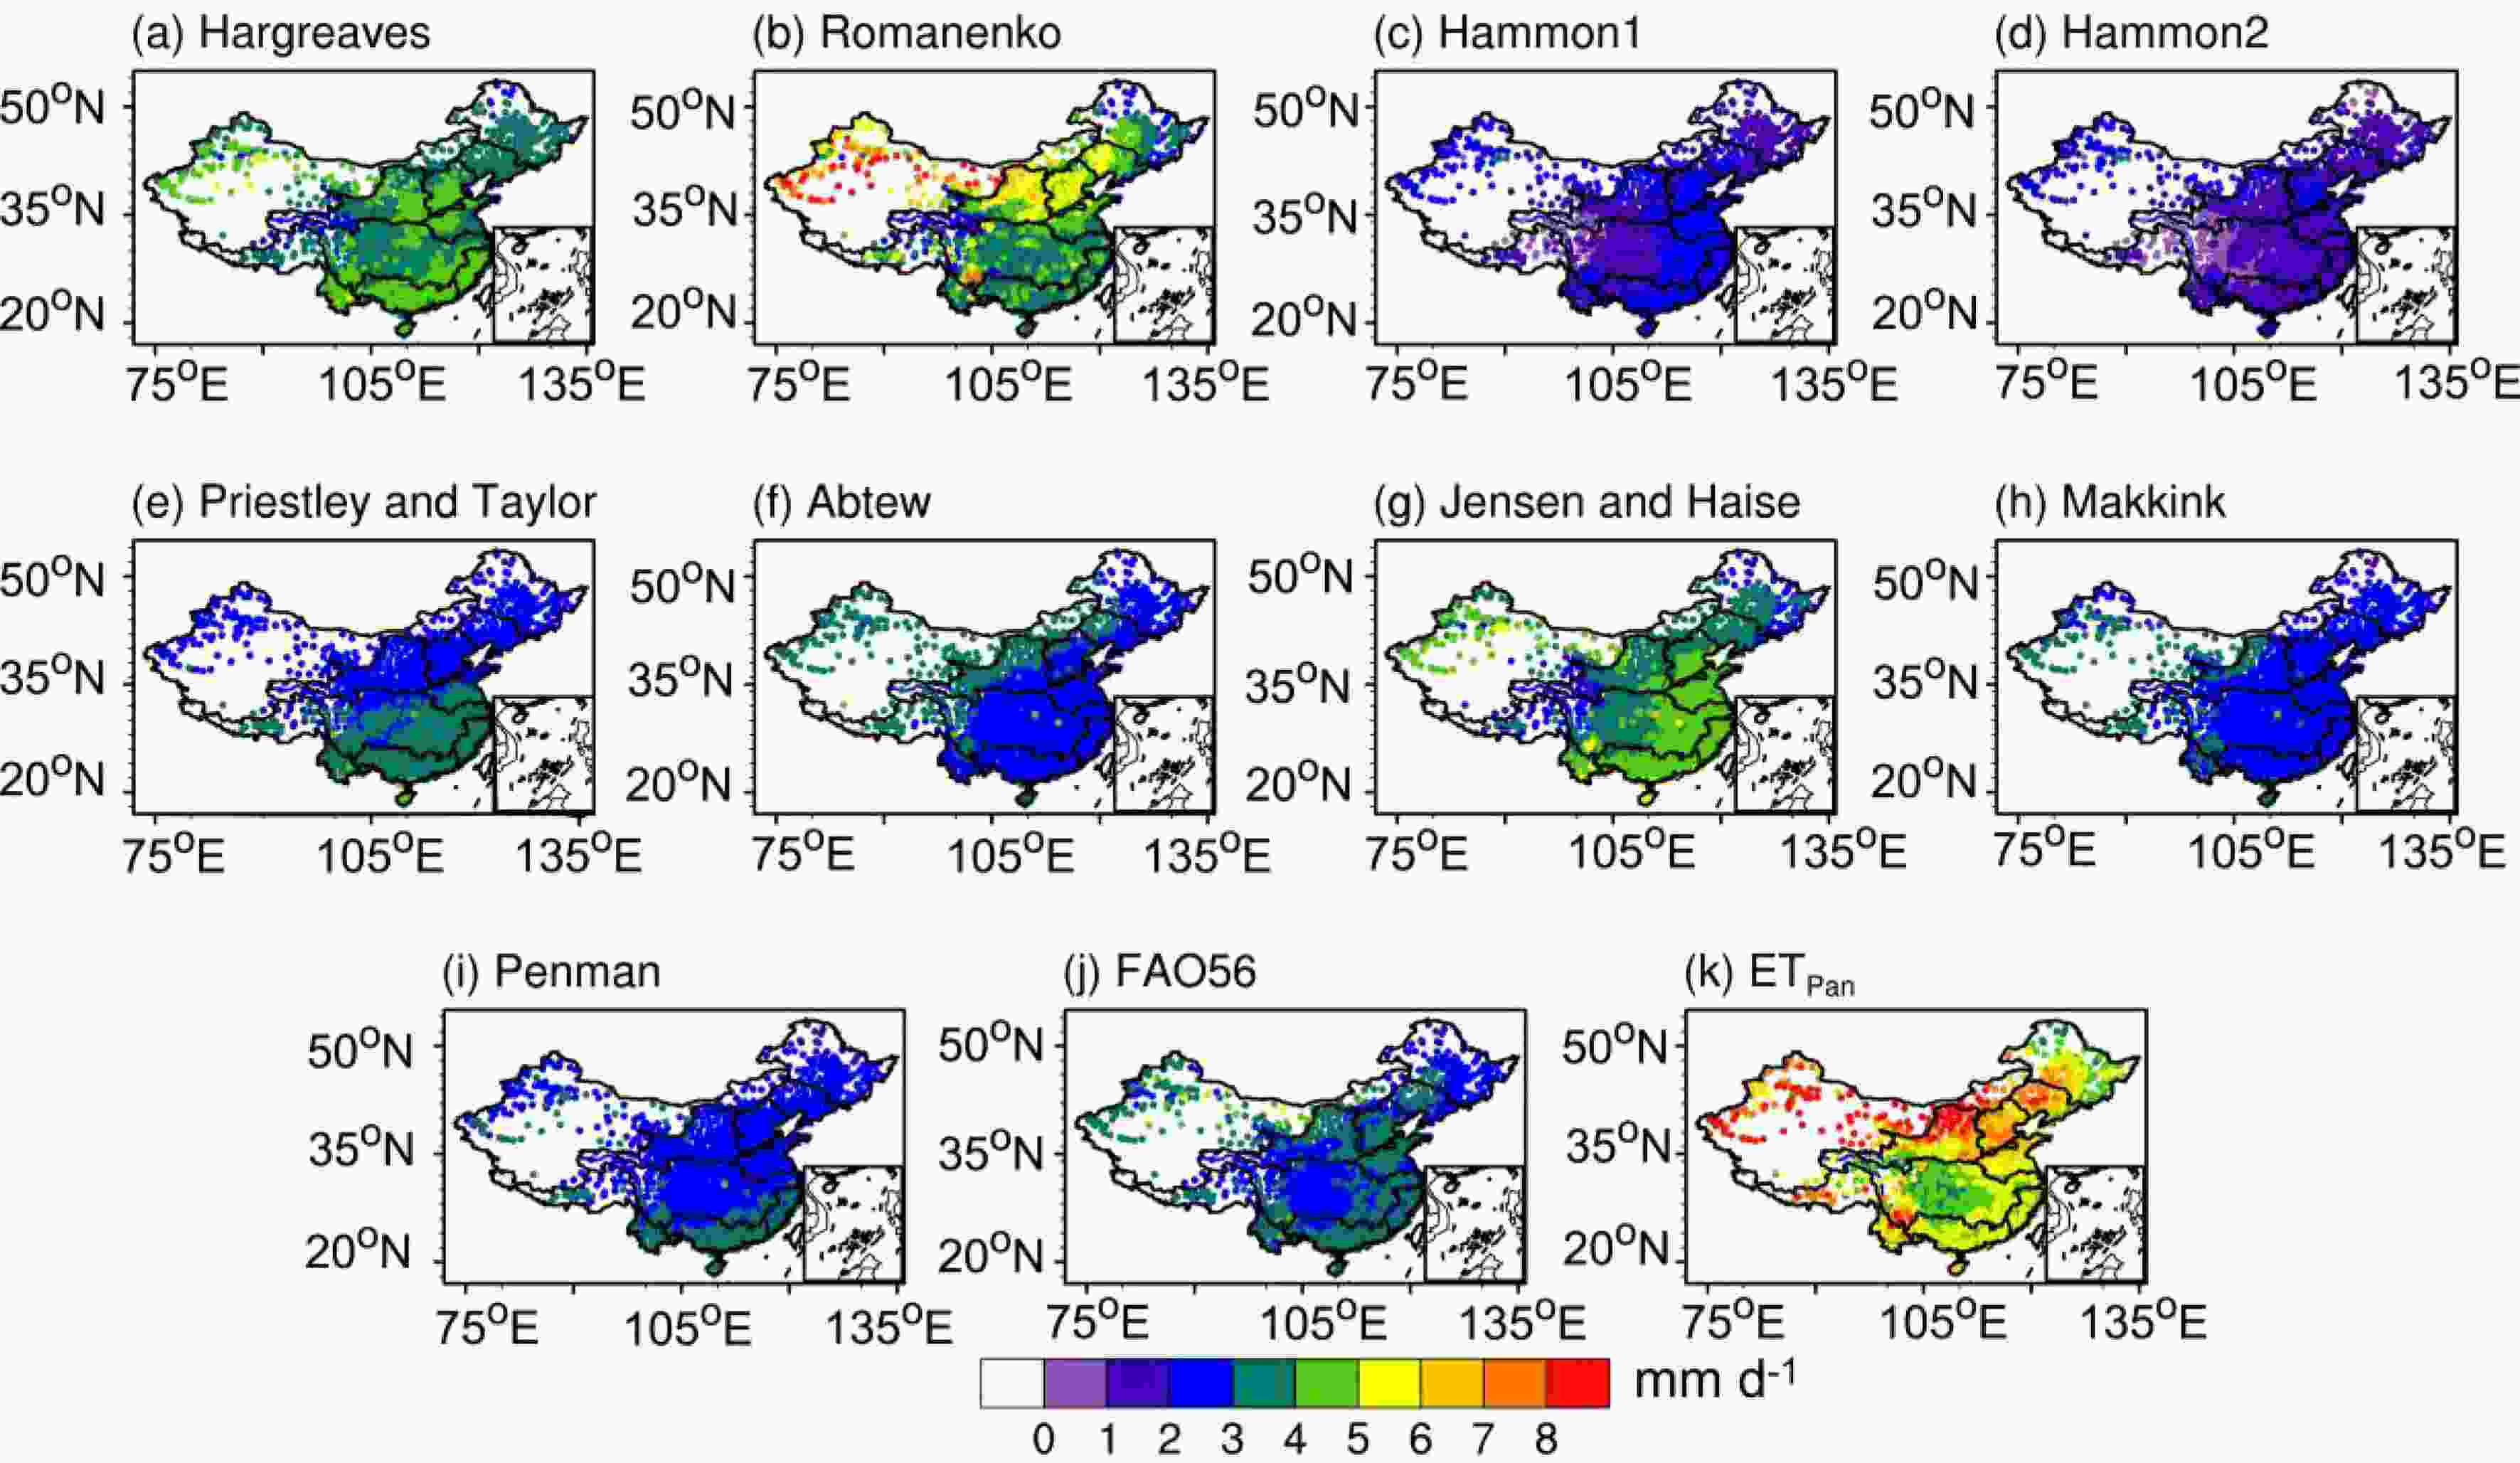 Figure2. Spatial distribution of the annual meangrowth season (Mar?Oct) pan evaporation and EPET calculated by different models: (a) Hargreaves, (b) Romanenko, (c) Hamon version 1, (d) Hamon version 2, (e) Priestley and Taylor, (f) Abtew, (g) Jensen and Haise, (h) Makkink, (i) Penman, (j) FAO56 and (k) ETpan.
Figure 3 shows the ranges of ETpan and EPET from different models from three basins: the Yangtze River basin (Fig. 3a), Yellow River basin (Fig. 3b), and Northwest China (Fig. 3c). The three basins represent the humid, semiarid and arid regions in China, respectively. By comparison, the modeled EPET is relatively close to ETpan in the humid Yangtze River basin; however, in arid Northwest China, they show obvious differences. This finding implies that ETpan and EPET are closer to each other in the humid region than in the arid region. This may be caused by the larger non-uniformity of climate conditions between the water body in the pan and the surrounding environment in the arid regions, and the non-uniformity is related to differences in surface temperature, moisture and albedo, which are also larger in arid regions (Zuo et al., 2016). Furthermore, in all three basins, no model can capture the peak values of ETpan, and the modeled EPET amplitudes are smaller than those of ETpan, and the biases of their maximum values are particularly large. Except for PETJen, the radiation-based models show relatively small differences between the upper and lower quartile than those of the temperature-based models, which somehow indicates that the temporal and spatial variabilities in the radiation-based models (PETPT, PETAbt, and PETMak) should also be smaller than those of the temperature-based models (PETRom, PETHam1, PETHam2). Additionally, PETFAO is closer in magnitude to ETpan than PETPM. Although both PETFAO and PETPM have similar structures and input requirements, PETPM displays a narrower magnitude range than that from PETFAO due to its lower maximum value.
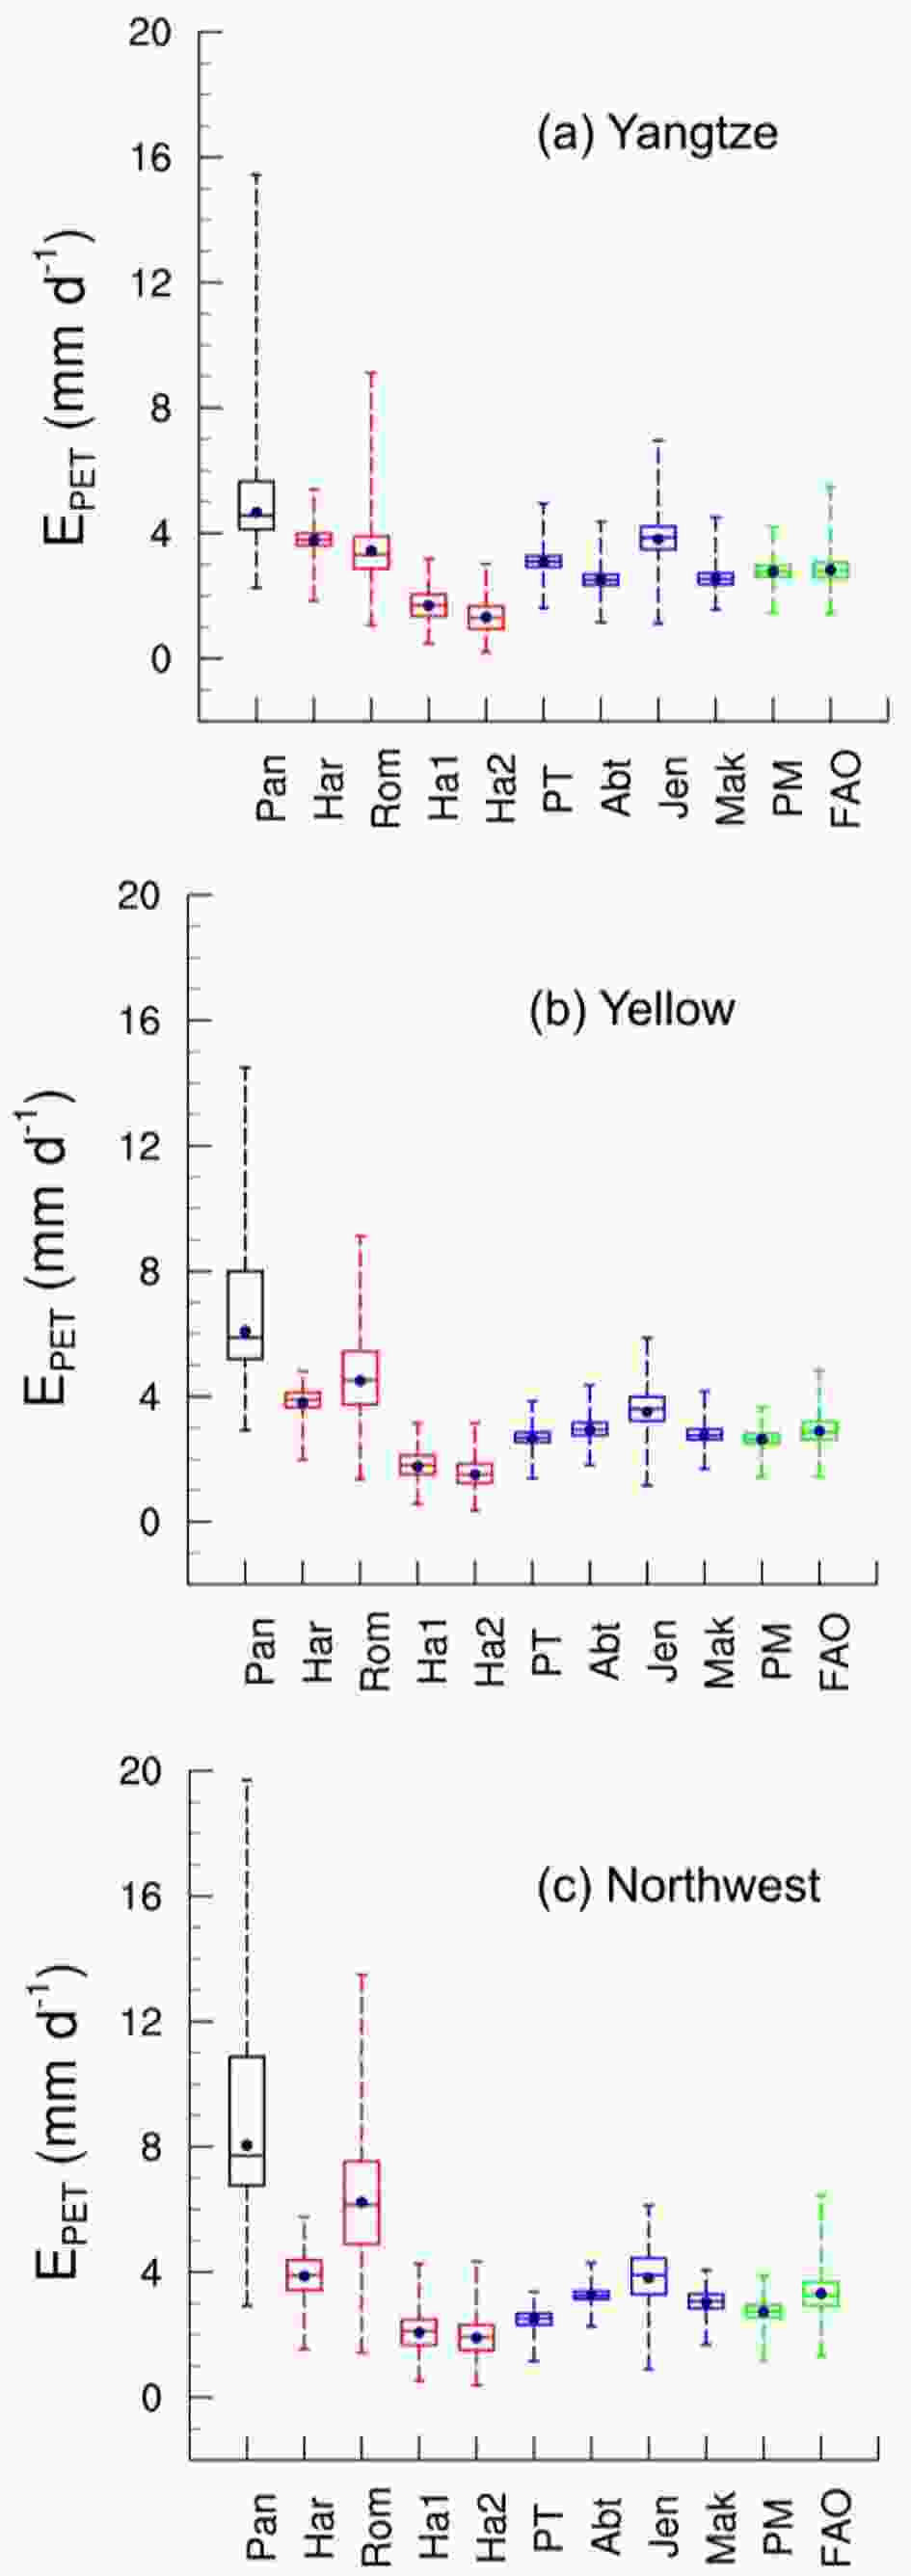 Figure3. Boxplots of annual mean growth season (Mar?Oct) ETpan and EPET calculated from different models in three selected basins: (a) Yangtze River basin, (b) Yellow River basin, and (c) Northwest China.
2
3.2. Trends and variability
Figure 4 shows the linear trends in the EPET models and ETpan during 1961?2013. There are apparent differences, and opposing trend signs occur in some cases. ETpan has an upward trend in Southeast and Southwest China, while it has a downward trend in other basins. The downward trend in ETpan ranges from ?0.01 mm d?1 yr?1 to ?0.03 mm d?1 yr?1, while the decreasing EPET trends are always less than ?0.01 mm d?1 yr?1. In the Songhua River and Liaohe River basin, and Southeast and Northwest China, the trends in PETFAO and ETpan are the most similar, and in Northwest China, PETFAO is the only model that can successfully capture the decreasing ETpan trend. In Southwest China, the trend in PETMak is consistent with that of ETpan, and PETHam2 can best capture the trend in ETpan in the remaining basins. In addition, PETRom is proportional to Ta (Table 1) and its temporal variabilities are consistent with that of Ta, showing an increasing trend in all basins.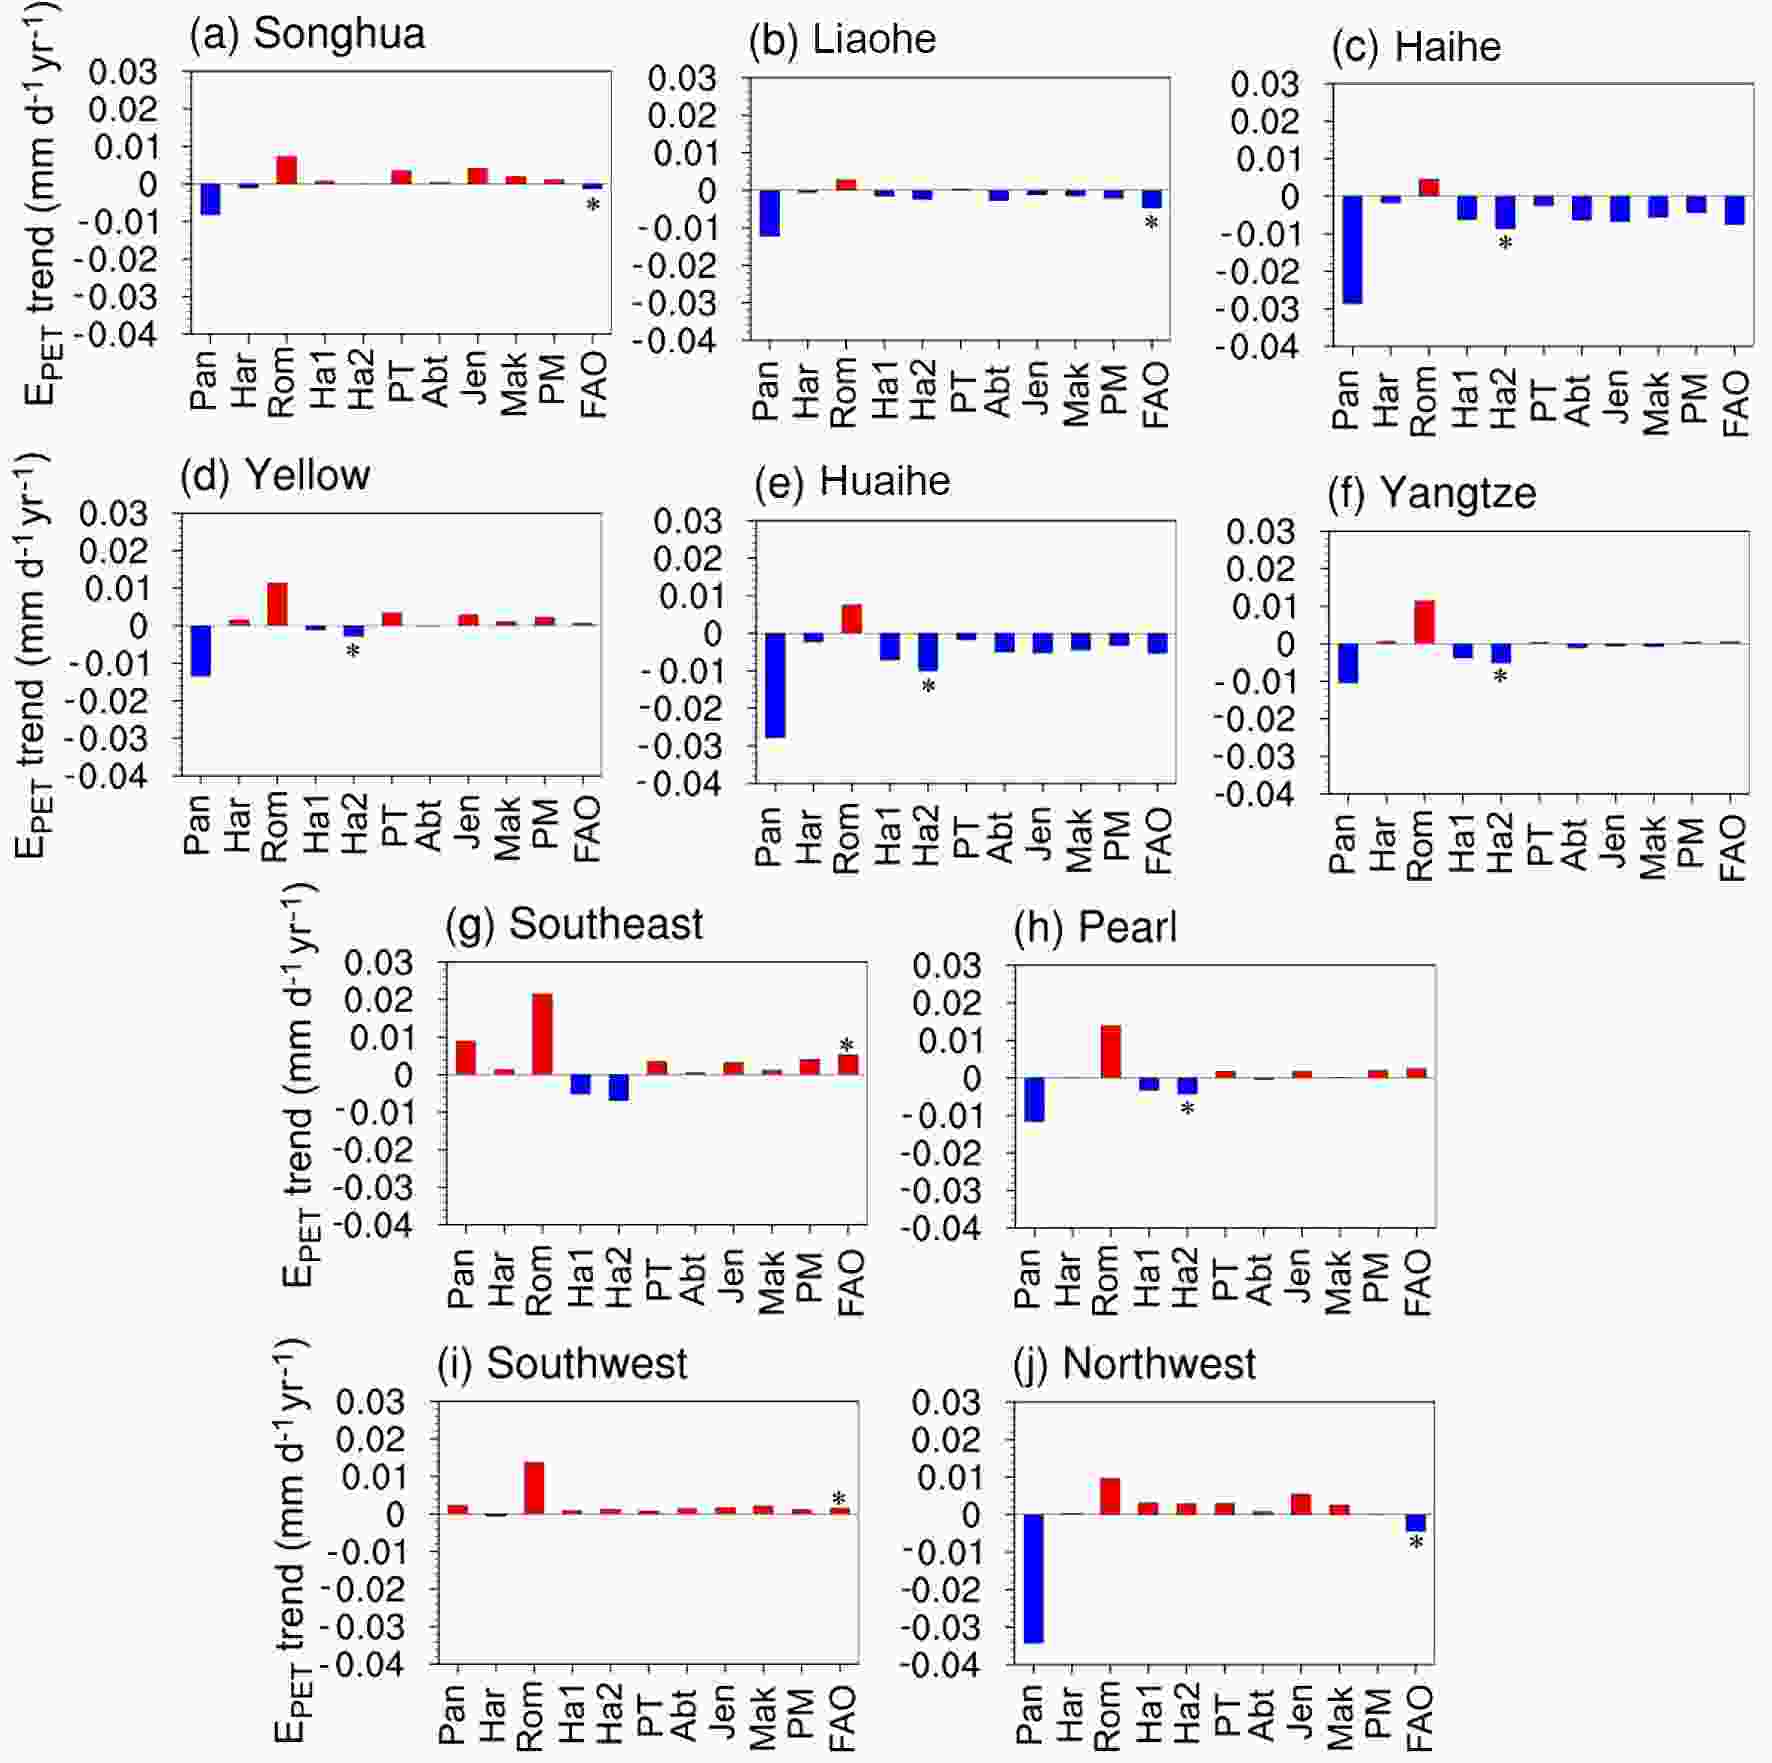 Figure4. Trends in annual growing season mean ETpan and EPET from 1961 to 2013 in (a) Songhua River basin, (b) Liaohe River basin, (c) Haihe River basin, (d) Yellow River basin, (e) Huaihe River basin, (f) Yangtze River basin, (g) Southeast China, (h) Pearl River basin, (i) Southwest China, and (j) Northwest China. The EPET model with the closest trend to that in ETpan is marked with a star (*).
We further assess the inter annual variability in the modeled EPET and ETpan. Figure 5 shows the growing seasonal mean anomalies of EPET and ETpan from 1961 to 2013 in three different drainage basins, and the corresponding anomalies of Ta and SD are also exhibited. In the Yangtze River basin (Fig. 5b), Ta shows an apparently upward trend since the 1990s, and SD shows an abrupt decline around the early 1980s. ETpan also displays a significant downward trend, and its anomalies change from positive to negative in 1981. For most models except for PETRom, the inter annual variability is relatively small, and their standard deviations are no more than 0.2 mm d?1. In terms of the temperature-based equations, PETRom is the most consistent with Ta and has been significantly increasing since the 1990s (Fig. 5a). Although the trend of Rs in the Yellow River basin and Northwest China is not obvious (Figs. 5d and f), the warming trend since the 1990s is still significant (p=99%). The ETpan shows obviously decreasing trends in the Yellow River basin and Northwest China (Figs. 5c and e), and the downward trend is dramatic in Northwest China (T=?0.034 mm d?1 yr?1). Additionally, except for PETRom, the inter annual variability in the EPET models is still small, and the standard deviations are also less than 0.2 mm d?1 in these two basins.
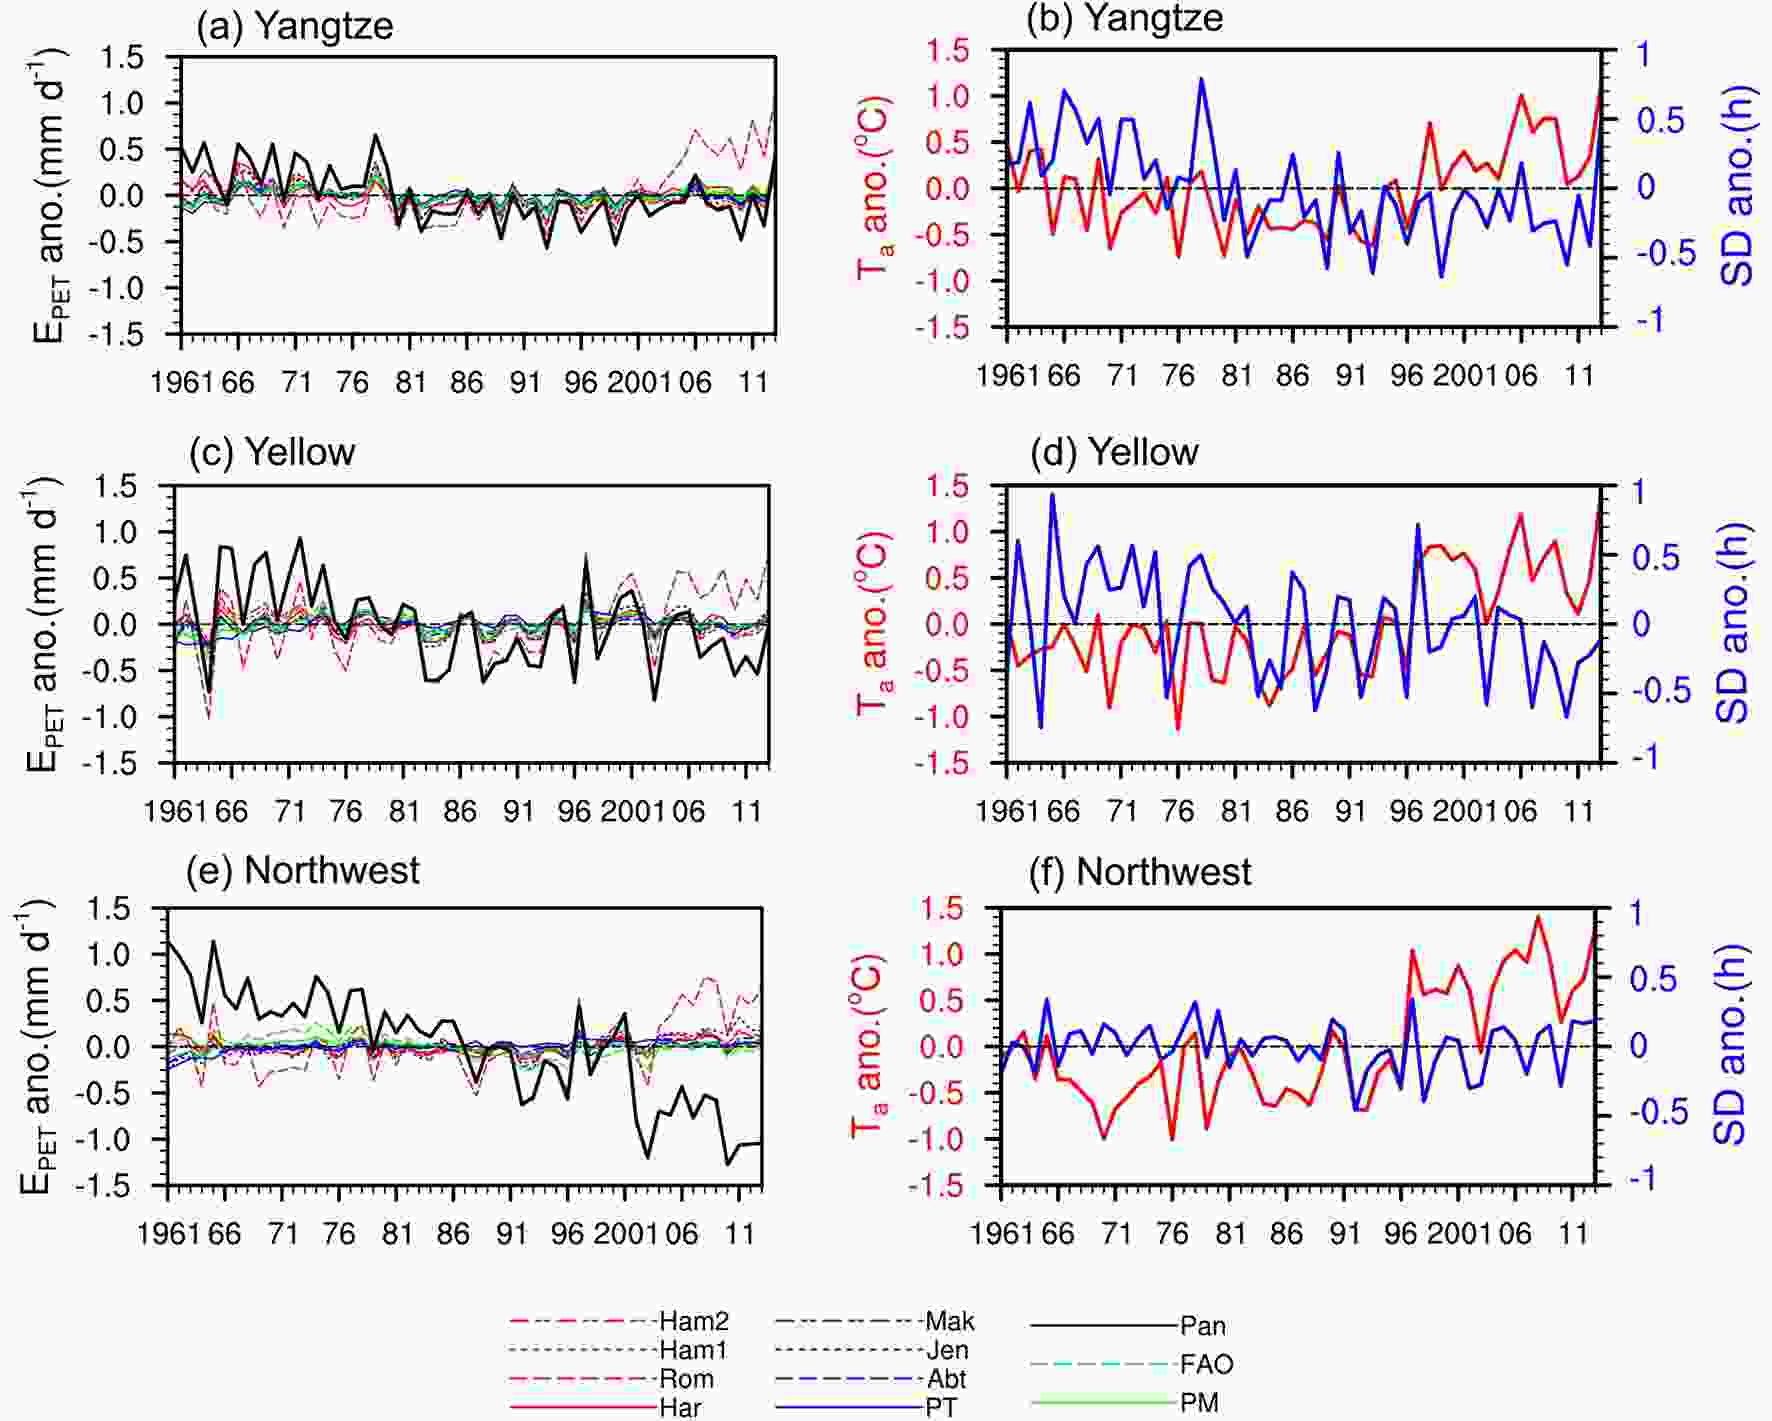 Figure5. Mean EPET anomaly in (a) the Yangtze River basin, (c) the Yellow River basin, and (e) Northwest China, and the anomalies in temperature and sunshine duration (b, d, f) averaged over the growing seasons (Mar?Oct) from 1961 to 2013. The red curve indicates the temperature anomaly (left axis), and the blue curve is the sunshine duration anomaly (right axis).
Because both ETpan and EPET have obvious seasonal variations, so seasonality changes of modeled EPET are also investigated. Figure 6 exhibits the monthly trends in the EPET models and ETpan. ETpan shows a decreasing trend during all months in the three basins, and the largest declining rates occur in May and June. In contrast, PETRom has an apparent upward trend in all months due to its highly consistent variability with that of temperature. Except for PETRom, the PET trends in all EPET models in all months are synchronous in the Yangtze River basin and show downward trends from June to September (Fig.6a). Among them, the trend in PETHam2 is the closest to that of ETpan. Additionally, the monthly trend of PETHam2 is closer to that of ETpan than other models in the Yellow River basin (Fig.6b). However, in Northwest China (Fig.6c), the monthly trends in all models are greatly different from ETpan. Although the declining trend in PETFAO is consistent with that of ETpan, the trend magnitudes of the two are very different. This is likely due to the differences in the physical processes of EPET and ETpan in this region, and we will discuss this further in section 4. Overall, compared to humid regions, the differences between the ETpan and EPET monthly trends are much greater in arid regions.
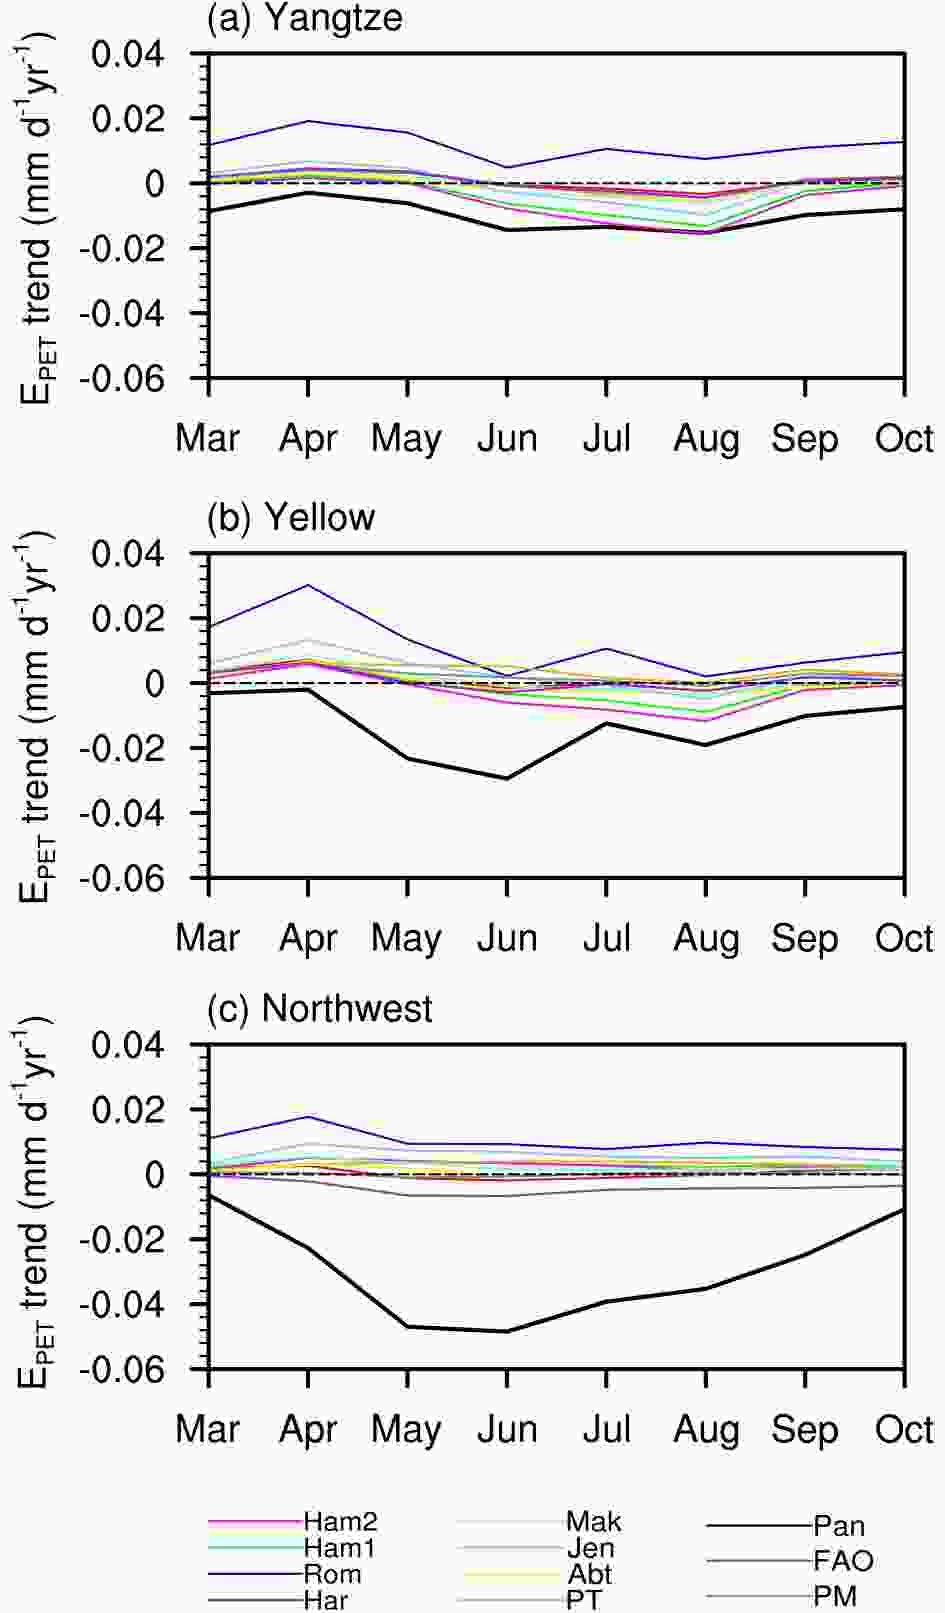 Figure6. Annual trends in ETpan and EPET during each month in three selected basins: (a) Yangtze River basin, (b) Yellow River basin, and (c) Northwest China.
2
3.3. Ranking scores
The ranking scores of the three statistical quantities are shown in Fig. 7. For the ratio of standard deviations (Fig. 7a), PETRom has the best performance, maintaining a value of 1 in all basins, followed by PETJen. The ranking scores of PETJen are less than 3 in most basins except for Southwest China, but the other radiation-based models do not perform well. In addition, PETPM also has relatively high ranking scores in all basins. The above results indicate that the variabilities in ETpan and modeled EPET are quite different. In terms of the correlation coefficient, the PETRom has high scores in the Haihe River, Huaihe River, Yangtze River and Pearl River basins (Fig. 7b), and PETPT also has poor scores in all basins. PETFAO shows good performance in most basins except for the Yangtze River and Pearl River basins, where PETHam1 has the lowest score. There are nine basins with correlation coefficients greater than 0.5 between ETpan and PETFAO, except for the Pearl River basin, and between ETpan and PETHam1/PETHam2, except for Northwest China. Notably, in Northwest China, several modeled EPET are negatively correlated with ETpan, except for PETFAO (0.65), PETPM (0.21) and PETHar (0.27). This further illustrates that EPET is very different from ETpan, especially in the arid region. Regarding the ratio of trends (Fig. 7c), PETRom has positive trends and the worst scores in most basins where ETpan shows negative trends. In summary, PETHam2 and PETFAO show the best performances based on the ranking scores in all basins. In Northwest China, the ratios of trends are greater than zero only in PETFAO and PETPM, which are the only models that produce a negative trend as in ETpan. Finally, we average the ranking scores of all three statistical quantities in each basin, and the model with the lowest score is selected and regarded as the best model for this basin (Fig. 8). For example, PETHam2 performs best in the Yellow River, Huaihe River and Yangtze River basins, while PETHam1 is outperformed in the Pearl River basin. For the remainder of the basins, PETFAO is the best model.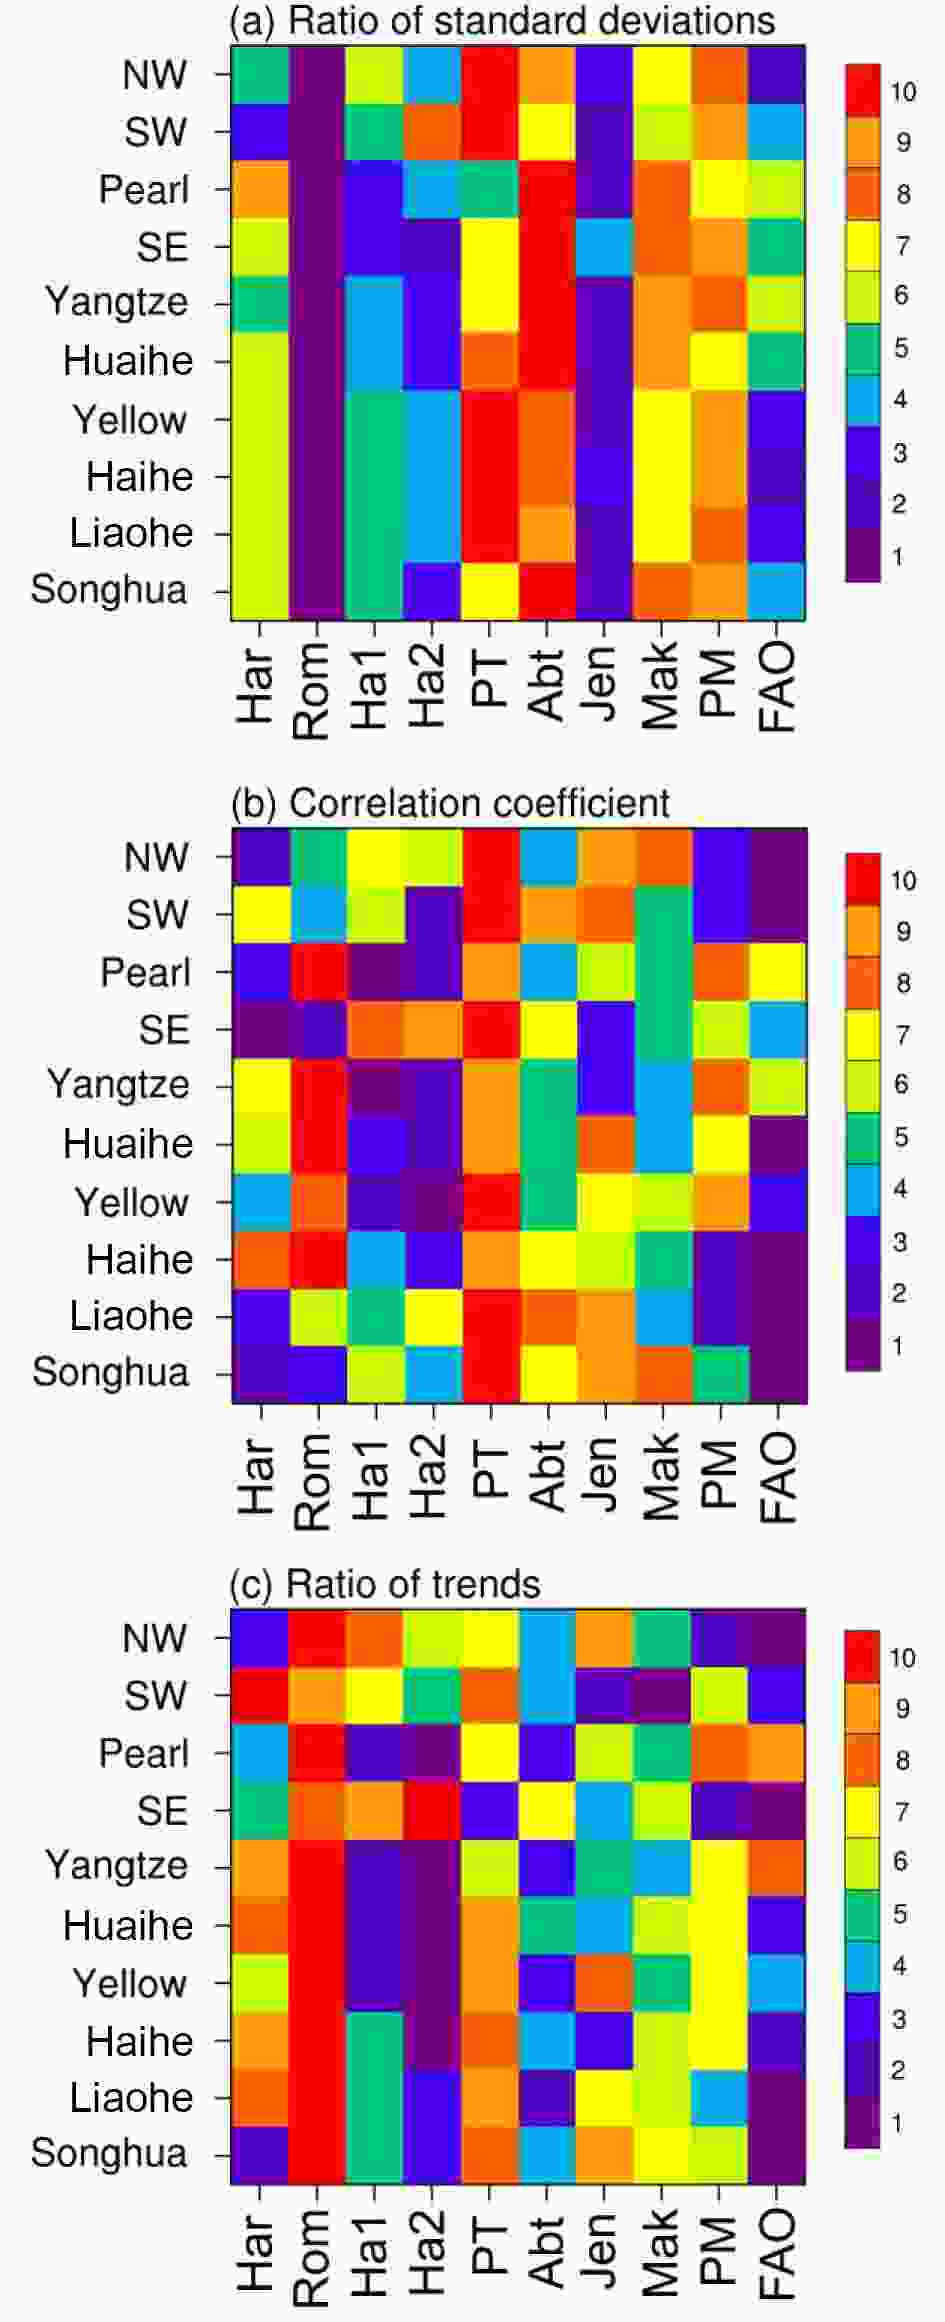 Figure7. Ranking scores of (a) the ratio of standard deviations, (b) the correlation coefficient, and (c) the ratio of trends, in different basins. The label of 1 (10) represents the best (worst) score of a modeled EPET compared to ETpan.
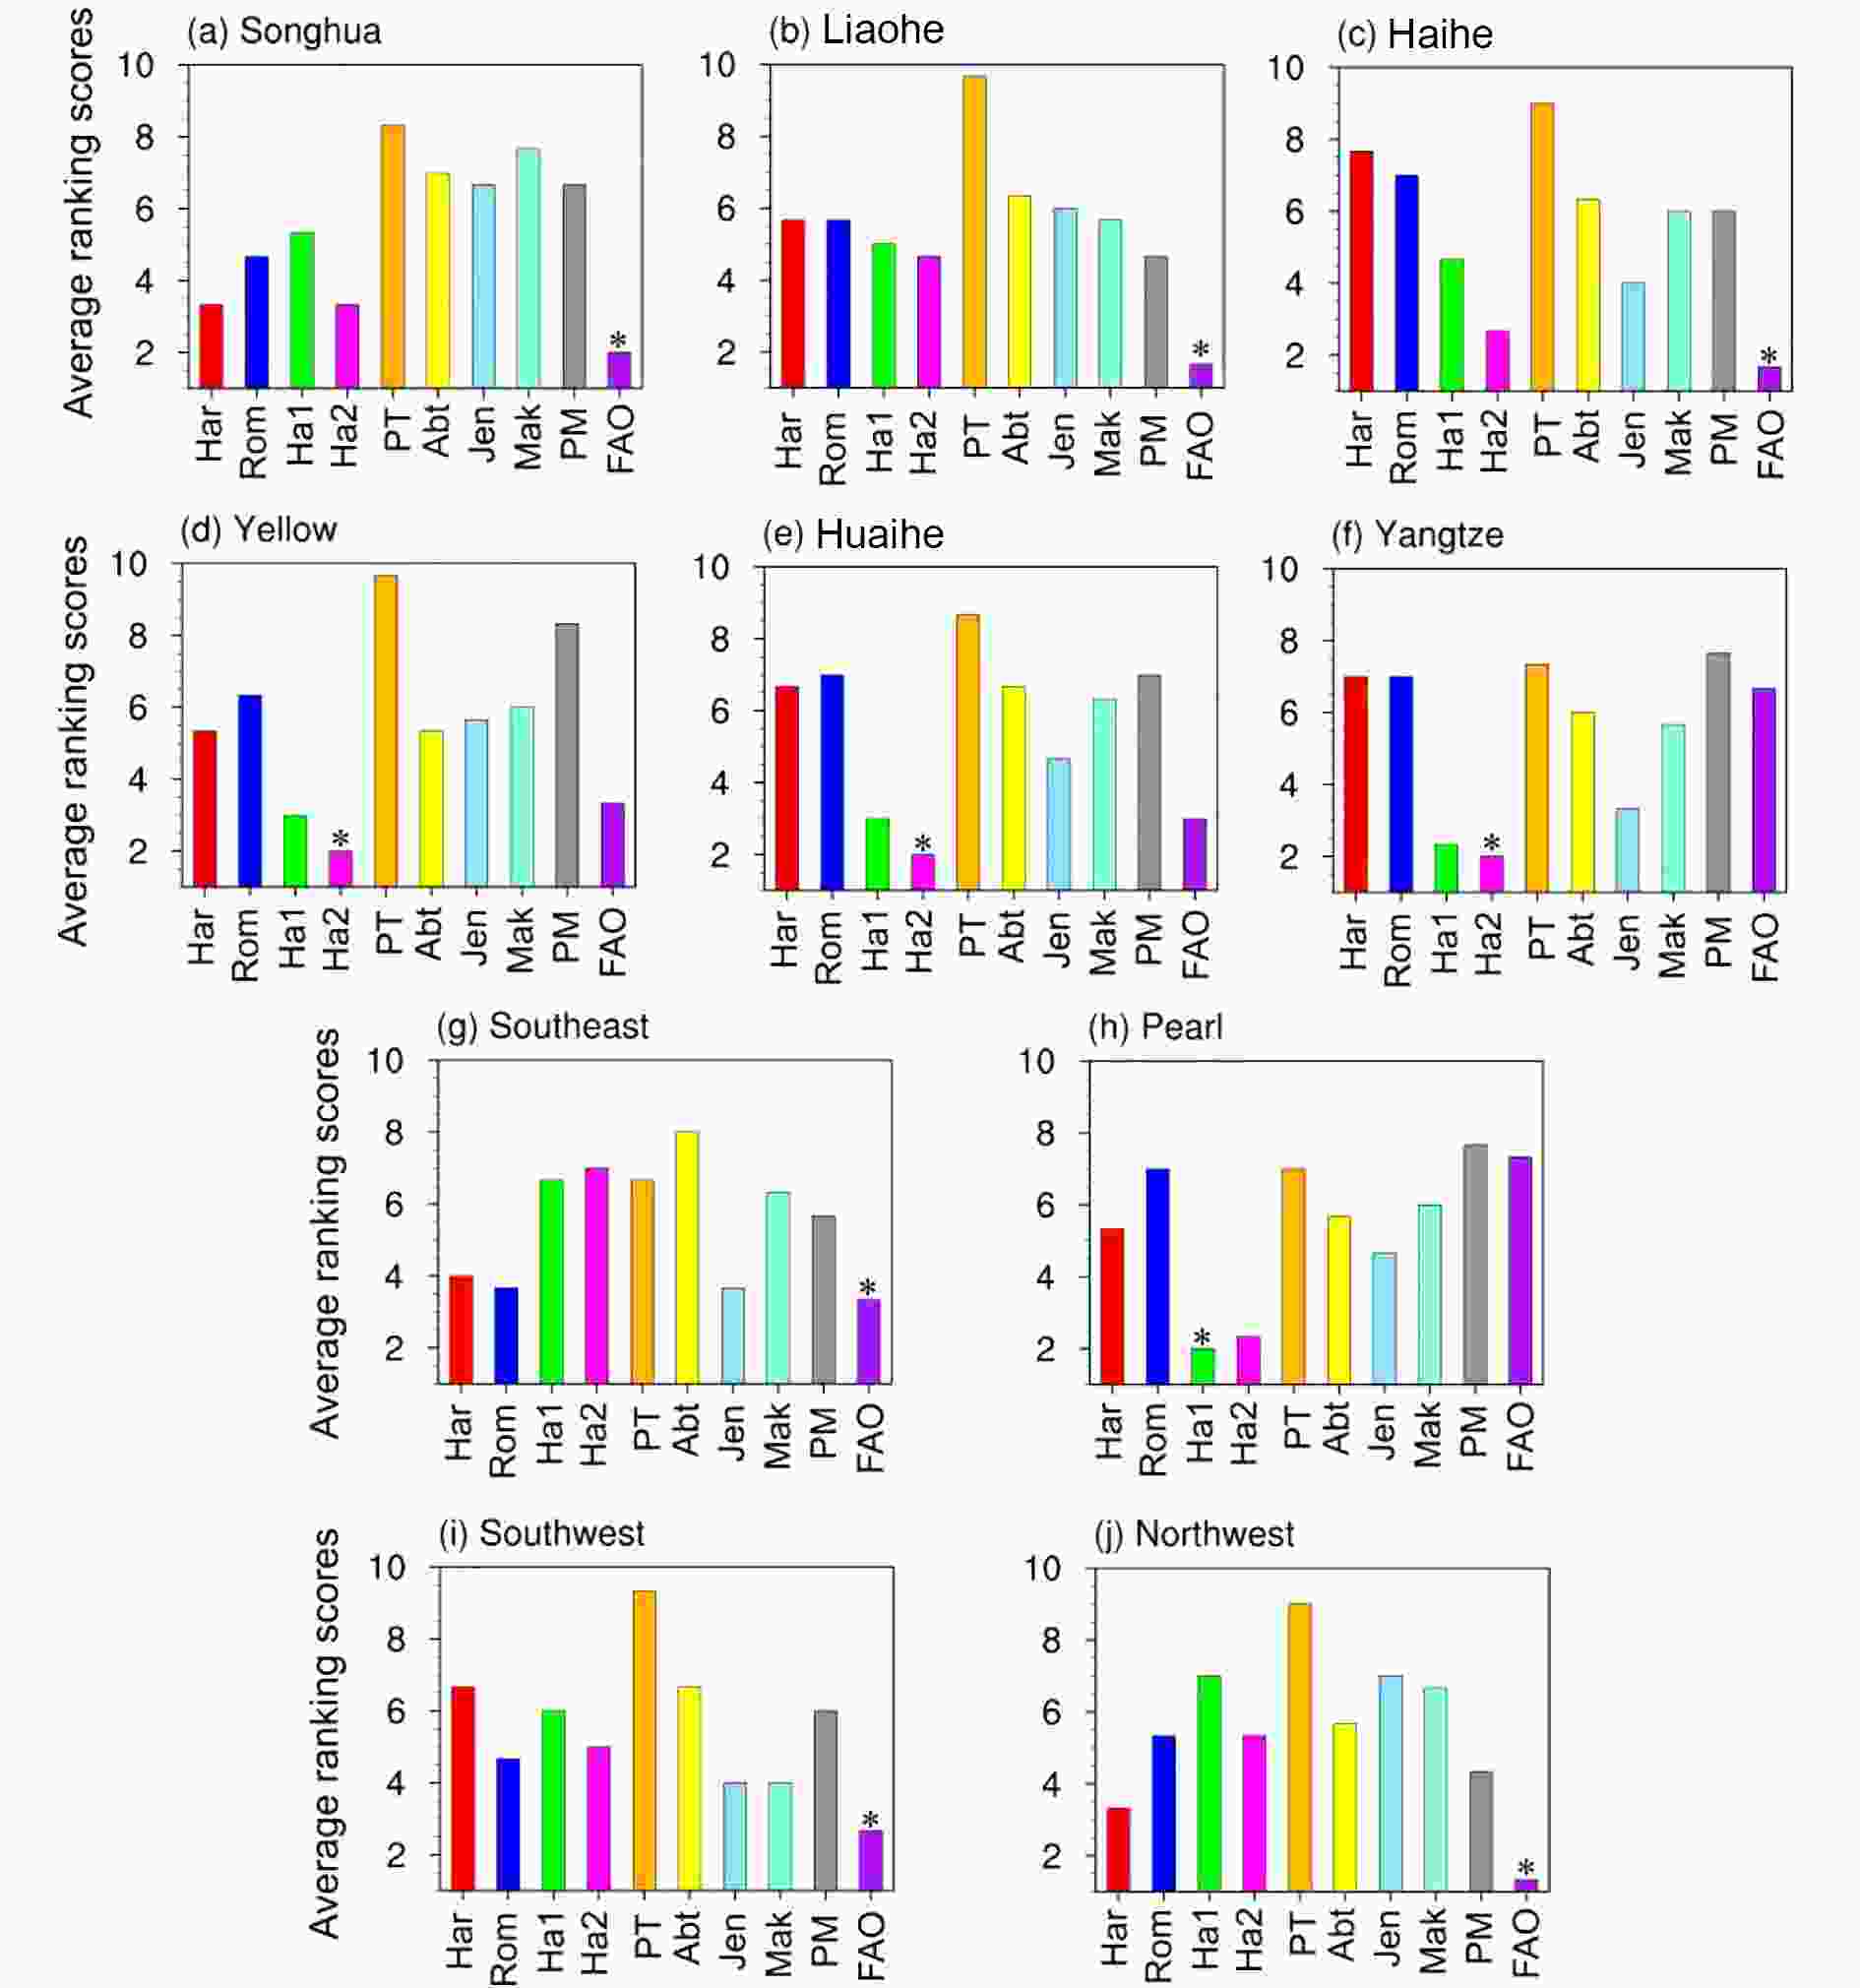 Figure8. Average ranking scores of three statistical quantities in (a) Songhua River basin, (b) Liaohe River basin, (c) Haihe River basin, (d) Yellow River basin, (e) Huaihe River basin, (f) Yangtze River basin, (g) Southeast China, (h) Pearl River basin, (i) Southwest China, and (j) Northwest China. The lowest (highest) value indicates the best (worst) performance of the EPET models,and the best model is marked with a star (*).
2
3.4. Sensitivity analyses
Among the selected best models in each basin, PETFAO considers temperature, relative humidity, wind speed and net radiation, and it is also the most commonly used EPET model in climate research (Gao et al., 2006; Gong et al., 2006; Yin et al., 2010a; Zuo et al., 2012). Both PETHam1 and PETHam2 belong to a temperature-based model and are derived from air temperature and sunshine duration. All the best models that were selected are affected by multiple meteorological factors. To determine the RCT of each meteorological variable to EPET changes, we apply a sensitivity analysis to the best-performing model in each basin. Because the best-performing EPET models are not troubled by a negative value, the sensitivity analyses are conducted for the whole year instead of only the growing seasons as in the previous sections.Table 2 shows the SC for RH is always less than zero, implying opposing variations in RH and EPET. RH is a factor that is highly sensitive to EPET, and the minimum of SC can reach ?1.32. However, due to the insignificant trend in RH during the study period, the RC of RH is less than 8% in the basins where the best model is PETFAO. Thus, RH is not a determining factor of EPET changes, and the corresponding RCTs of RH to EPET changes are less than 2%, except for Southeast China. However, in Southeast China, RH decreases by 7.32%, which induces EPET increases of 5.73%, and RH is the primary contributor to increasing EPET in this basin (Table 3). In other basins where PETFAO is selected, the wind speed at 2 m (U2) is the most responsible factor for EPET reductions, although it is not the most sensitive factor. The SC is greater than 0.5 in the Songhua River, Liaohe River and Haihe River basins and Northwest China. Furthermore, the reduction in U2 in these basins is more than 40%, which leads to a more than 20% reduction in EPET. In Southwest China, the RC of U2 is ?27.25%, which drives EPET reduction by 5.35%, and the RCT of U2 to EPET change is far less than that in other basins. Thus, the change in EPET is affected by multiple factors in this basin, with the overall RCT of the meteorological variables to an EPET change of 2.86% and the actual relative change in EPET of 0.71%. The two values are very close, which further illustrates that sensitivity analyses can be used to attribute the changes in EPET in Southwest China (Yin et al., 2010b). Tmax has little effect on EPET, which would lead to a 6.77% enhancement in EPET in Northwest China and less than 4% in other regions. For Tmin, low sensitivity appears in nearly all basins; the lowest SC (?0.01) appears in Northwest China, and the highest SC (0.21) is in Southeast China. However, it has great RC in some basins, especially in the Songhua River and Liaohe River basin, where the RC reaches 608.27% and 277.55%. This is due to the average Tmin being close to zero in these basins, where a slight change in absolute value would cause a large percentage change in Tmin. The RCTs of Tmin to EPET are quite different in different basins, and the value is 24.16% and 14.85% in the Songhua River and Liaohe River basin, respectively, but less than 4% in other basins. Therefore, Tmin is a vitally important variable for EPET changes in the Songhua and Liao River basins. For basins with PETFAO as the selected best model, the SC of EPET to SD ranges from ?0.26 (Songhua River basin) to 0.14 (Southwest China), with negative values in the Songhua River, Liaohe River and Haihe River basins and Northwest China and positive values in other basins, while the RCTs of SD to EPET change are less than 5% in all basins. This result indicates that SD is not the primary factor for EPET change in these basins.
| Basin | Model | Ta | Tmax | Tmin | RH | U2 | SD |
| Songhua River | FAO | ? | 0.08 | 0.04 | ?1.32 | 0.57 | ?0.26 |
| Liaohe River | FAO | ? | 0.23 | 0.05 | ?1 | 0.54 | ?0.21 |
| Haihe River | FAO | ? | 0.51 | 0.08 | ?0.83 | 0.5 | ?0.17 |
| Yellow River | Ham2 | 0.61 | ? | ? | ? | ? | 2 |
| Huaihe River | Ham2 | 0.93 | ? | ? | ? | ? | 2 |
| Yangtze River | Ham2 | 1.11 | ? | ? | ? | ? | 2 |
| SE | FAO | ? | 0.54 | 0.21 | ?0.77 | 0.15 | 0.12 |
| Pearl River | Ham1 | 1.25 | ? | ? | ? | ? | 1 |
| SW | FAO | ? | 0.45 | 0.12 | ?0.30 | 0.15 | 0.14 |
| NW | FAO | ? | 0.47 | ?0.01 | ?0.68 | 0.54 | ?0.24 |
Table2. Sensitivity coefficient (SC) of the best-performing EPET models in each basin during 1961?2013. The abbreviation of each variable name is shown in Table 1. The SC is computed from Eq. (6) in the text.
| RCT (%) | Ta | Tmax | Tmin | RH | U2 | SD |
| Songhua River | ? | 0.43 | 24.16 | 0.51 | ?26.43 | 2.03 |
| Liaohe River | ? | 0.75 | 14.85 | ?2.1 | ?22.65 | 1.68 |
| Haihe River | ? | 2.93 | 3.05 | 1.87 | ?24.53 | 3.09 |
| Yellow River | 9.8 | ? | ? | ? | ? | ?17.55 |
| Huaihe River | 7.51 | ? | ? | ? | ? | ?42.02 |
| Yangtze River | 6.57 | ? | ? | ? | ? | ?21.51 |
| SE | ? | 3.12 | 1.92 | 5.73 | ?4.69 | ?1.39 |
| Pearl River | 4.78 | ? | ? | ? | ? | ?12.91 |
| SW | ? | 3.15 | 3.57 | 1.33 | ?5.35 | 0.16 |
| NW | ? | 6.77 | ?2.63 | 0.37 | ?22.12 | 0.6 |
Table3. The relative contributions (RCT = SC × RC) of each meteorological variable to EPET changed in ten drainage basins. The meteorological variables are the required inputs of the best-performing model in each basin. The abbreviation of each variable name is shown in Table 1. SC and RC are derived from Eqs. (6) and (7), respectively.
For the basins with PETHam1 and PETHam2 as the best models, both Ta and SD are the inputs of the models. In terms of PETHam2, SD is more sensitive than Ta, and the SC for SD is 2 in those basins. For PETHam1, the SC for Ta (1.25) is higher than that of SD (1). In addition, the minimum RC for SD can reach ?21.01% in the Huaihe River basin. As a result, SD is the primary contributor to EPET change in those basins. The RCTs to EPET change range from ?12.91% (Pearl River basin) to ?42.02% (Huaihe River basin). Although the percentage changes in EPET are large, the actual EPET trend does not exceed ?0.01 mm d?1 yr?1. This is because the EPET magnitudes calculated by PETHam1 and PETHam2 are too small (Fig. 2). In general, the summation of RCT from individual meteorological variables is a close approximation to the actual EPET changes in eight basins (except for Southeast and Northwest China), where the differences are less than 5%. In both Southeast and Northwest China, the large differences in RCTs and actual EPET change may be due to the other variables in the radiation calculation formulas, such as ozone absorption and turbidity coefficients.
2
3.5. Relationship between ETpan and EPET
ETpan and EPET can be linked by regression equations, i.e., EPET = KpanETpan, where Kpan is the regression coefficient (Chiew and McMahon, 1992; Linacre, 1994; McMahon et al., 2013). Linacre (1994) provided a Kpan with a value of 0.7 by analyzing the data from a dozen places around the world, and this value was adopted in some studies (Weiβ and Menzel, 2008). However, many studies have reported that Kpan is dependent on the local climate conditions and should not be globally unified (McVicar et al., 2007; Zheng et al., 2009). To further understand the relationship between ETpan and EPET, we also calculated Kpan based on our selected EPET model in each basin (Fig. 9). The Yangtze River basin (Fig. 9f) has the largest Kpan, with a value of 0.38, and the minimum value of Kpan (0.13) appears in Northwest China (Fig. 9j). Moreover, the determination coefficient (R2) is below 0.5 in Northwest China, further indicating that ETpan may not be used as a EPET proxy in the arid region.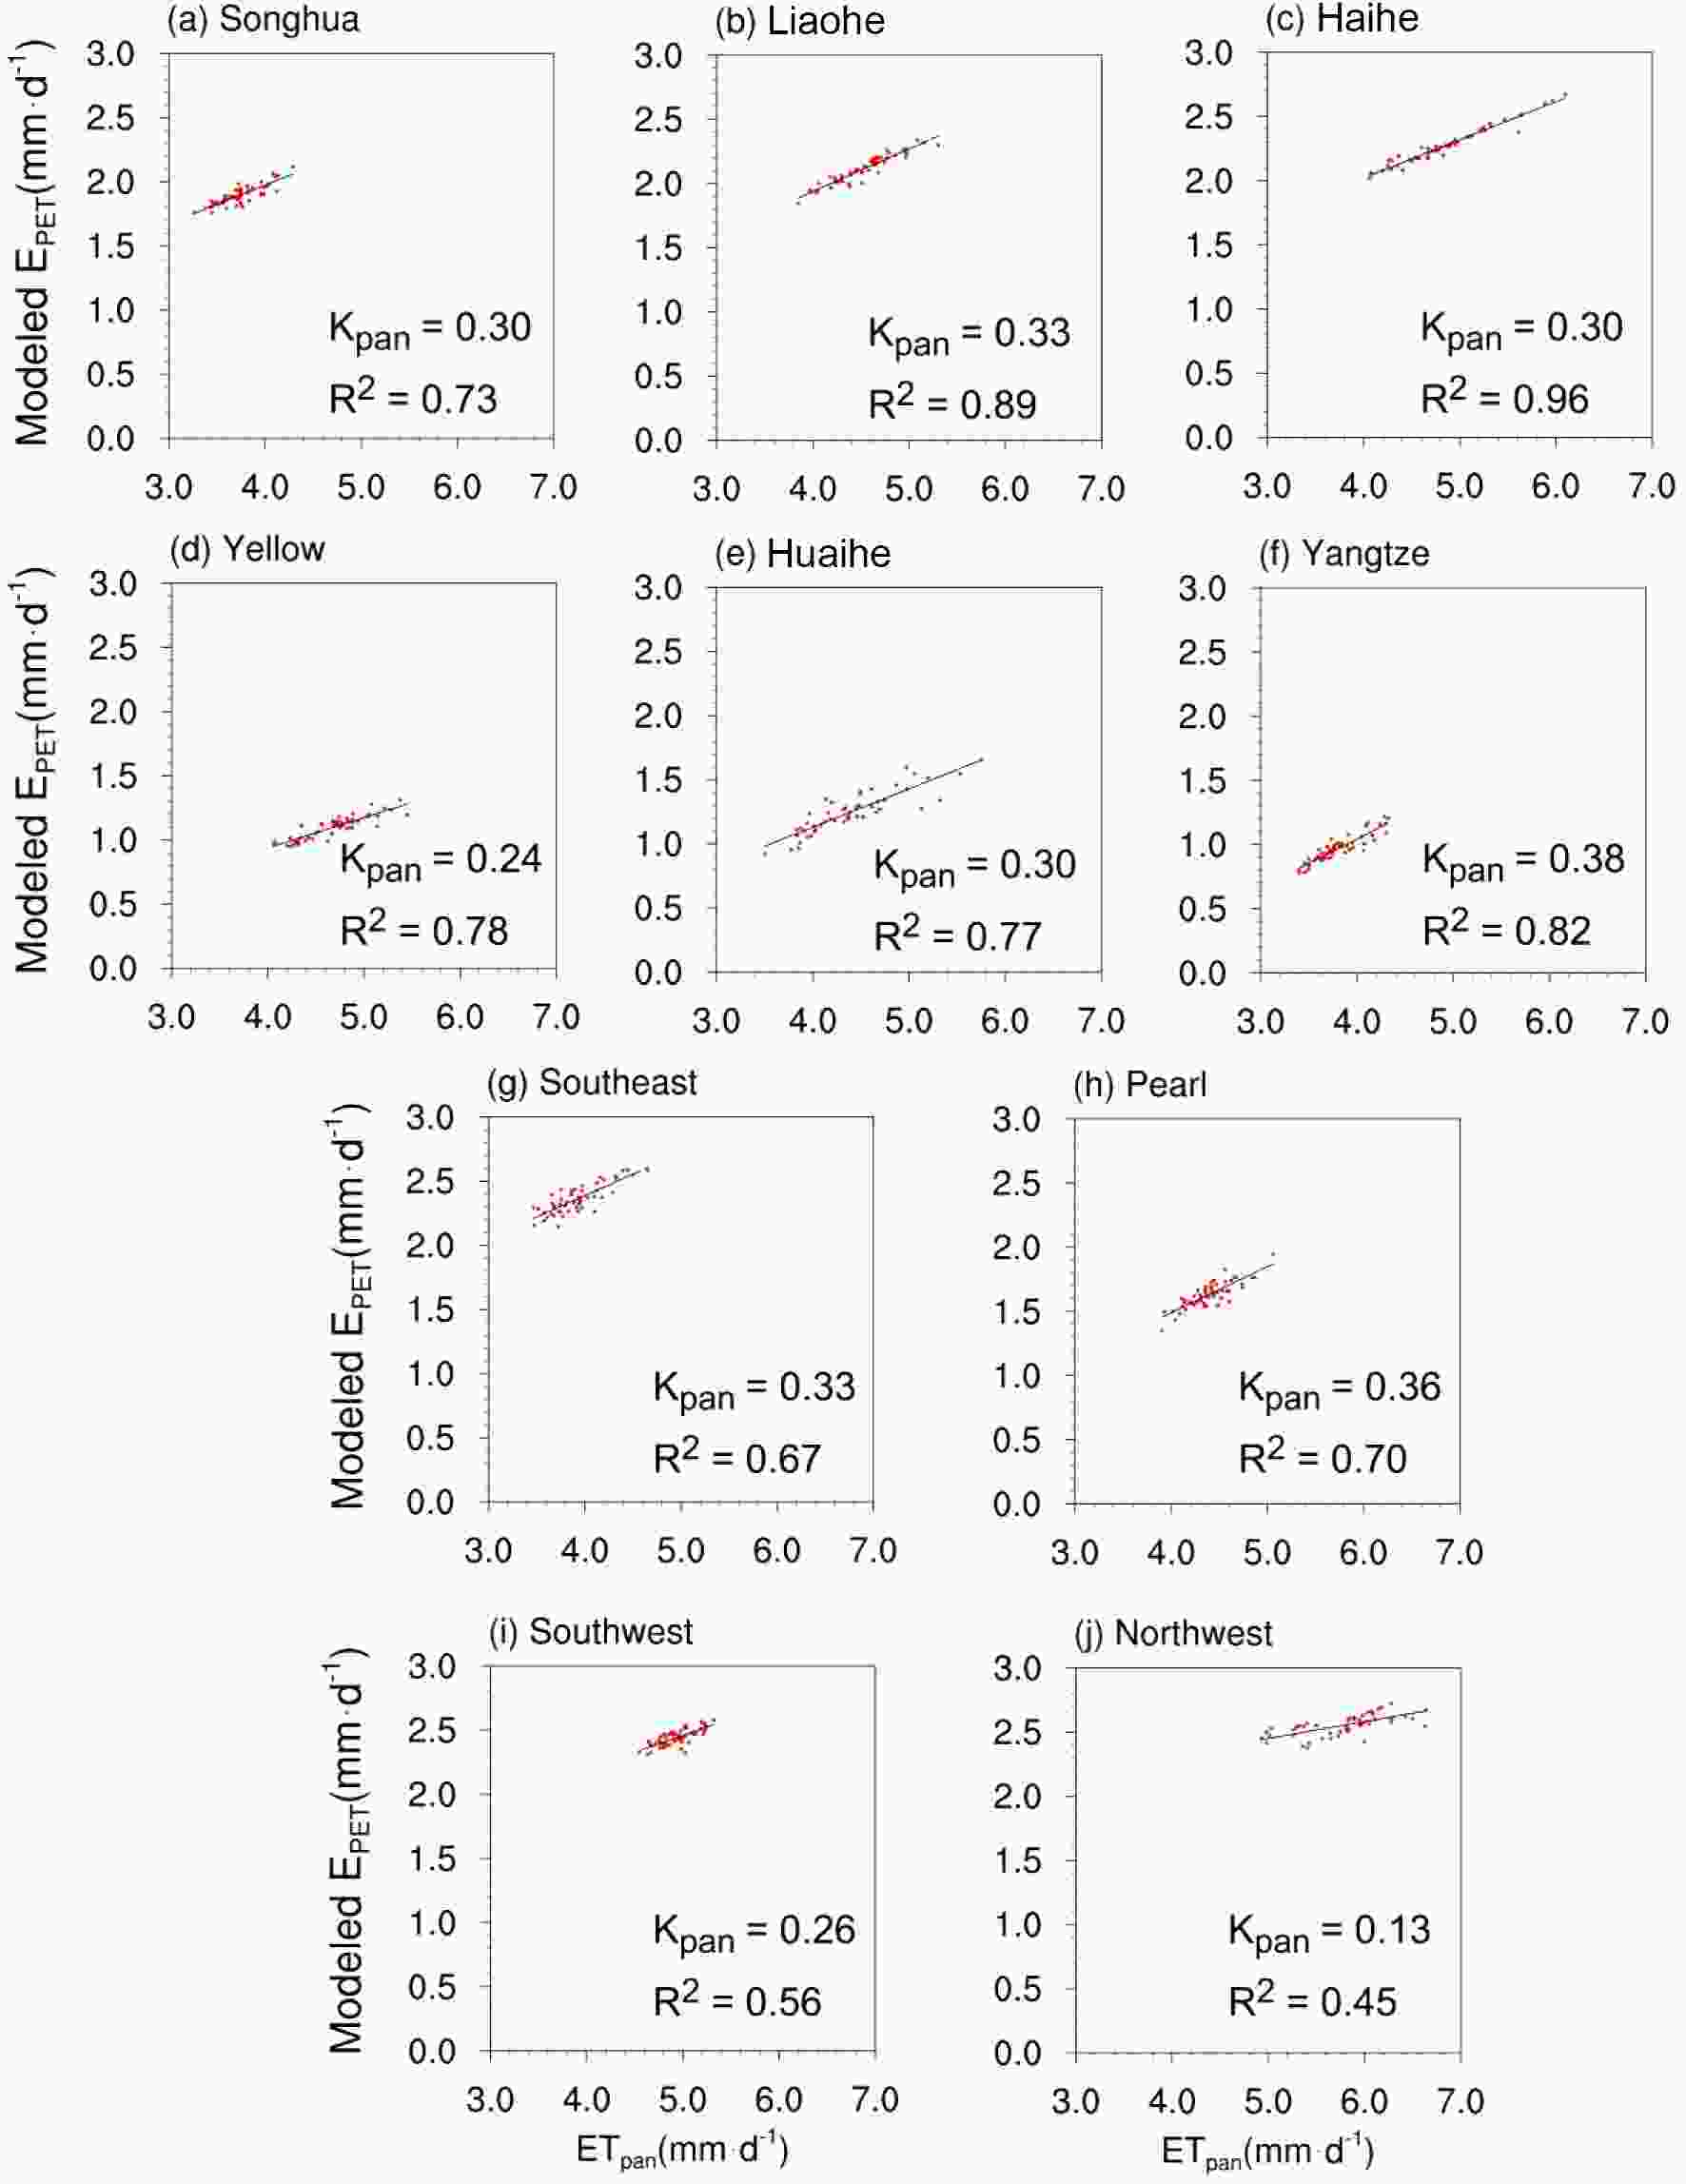 Figure9. Relationship between annual ETpan and EPET calculated by the best-performing model for each basin:(a) Songhua River basin, (b) Liaohe River basin, (c) Haihe River basin, (d) Yellow River basin, (e) Huaihe River basin, (f) Yangtze River basin, (g) Southeast China, (h) Pearl River basin, (i) Southwest China, and (j) Northwest China. The slope (Kpan, EPET = KpanETpan) and determinant coefficients (R2) are also indicated.
It should be noted that Rs is greatly impacted by aerosol and it usually reduces the solar irradiance arriving at the surface (Hu et al., 2017). In recent years, air pollution in China has become a serious issue, which also brings large amounts of aerosol. Current research does not consider the above effects, and thus the computed Rs based on sunshine duration only might be overestimated and affect the accuracy of EPET results. The weight setting of the ranking scores is also worthy of further attention. We put equal weight for each of the three statistical metrics in this research. As we mentioned previously, the trend in ETpan agrees with that of modeled EPET in most regions, and thus it might be reasonable to give larger weight to the ratio of trends in these regions. However, it is difficult to determine weight values for each metric at the current stage. It is necessary to explore this in future research by using different weights in ranking schemes.
Despite the magnitude differences between ETpan and EPET in some basins, there is also a close relationship between them. Previous studies have revealed that the magnitude of ETpan is generally greater than ETref (Jensen et al., 1990; Weiβ and Menzel, 2008), while ETpan and EPET (or ETref) are usually linked by the regression coefficient Kpan (Fig.9). In addition, there are different types of evaporation pan in practice. For instance, Class-A pans are used in most countries, such as the USA and Australia, while 20-cm micro-pans are popular in China. With different types of pans, the magnitudes of Kpan are also different. The pan coefficients for the Class-A pan are higher than the Chinese micro-pan coefficients, but the seasonal ranges of Kpan values for the two different pans are similar (McVicar et al., 2007; McMahon et al., 2013).
Although we characterize EPET changes through sensitivity analyses, and conclude that wind speed and sunshine duration are the major factors affecting EPET changes, EPET is not affected by only these two factors. For total ET, transpiration is a very important component that is controlled by the leaf area index (LAI), surface roughness, and vegetation root distributions (Arora, 2002). Furthermore, because of the increasing CO2 fertilization effects, climate change, and land use-land cover change, global-scale LAI shows a significant upward trend (Zhu et al., 2016), which would cause changes in transpiration. According to Zeng et al.(2018), a greening Earth would induce a significant increase in terrestrial ET. Therefore, similar to ET, EPET is also affected by the CO2, vegetation and land use-land cover change. ETpan is the evaporation of the open water surface without considering the effects of transpiration or interception.
Then, a scheme was applied to rank the three statistical quantities of ETpan and EPET in different basins, including the ratio of standard deviations, the correlation coefficient, and the ratio of trends. The results show that PETHam1 is the best model for the Pearl River basin, while PETHam2 is outperformed in the Huaihe River, Yangtze River and Yellow River basins. In terms of the remaining basins, PETFAO is the best-performing model. The sensitivity analyses of the best-performing EPET model in each basin reveal that U2 and SD are the two factors contributing to the overall decrease in EPET. The contributions of SD to EPET change are always greater than 10% in the basins with selected PETHam1/PETHam2, and the contributions of U2 are larger than 20% in the Haihe River, Songhua River and Liaohe River basins and Northwest China. In addition, in the Songhua River and Liaohe River basins, Tmin also contributes considerably to the EPET changes, and the RCT can reach 24.16% and 14.85% respectively. In Southeast China, the upward trend in EPET is primarily controlled by the decreasing RH. Furthermore, the Kpan varies from 0.13 (Northwest China) to 0.38 (Yangtze River basin), and is larger in the humid regions than in the arid regions.
Understanding the characteristics of EPET and its impacting factors can help us to gain insight into the hydrological process and, in particular, water resource management in an arid region. Through the current study, we have identified the best-performing EPET models in each Chinese basin and derived long-term, high-quality daily EPET datasets in China, which can be used as a benchmark for EPET research in the future. Moreover, the selected model in each basin also reduces the input requirements, which is particularly practical in regions with limited availability of meteorological variables.
Acknowledgments. This paper was financially supported by the National Natural Science Foundation of China (Grant No. 41875106) and the National Key R&D Program of China (Grant No. 2016YFA0602401). We also thank the two anonymous reviewers for their constructive comments.
