HTML
--> --> -->Regional earth system modeling or regional coupled modeling is one of the frontiers of regional climate modeling (Gutowski et al., 2016). Coupling of the ocean component in RCMs was an important step towards the development of regional earth system models (RESMs) (Giorgi and Gao, 2018). The Earth System Regional Climate Model, which includes the Massachusetts Institute of Technology ocean general circulation model, has been tested for many regions (Central America, South Atlantic, and the tropics) and has shown realistic simulations of coupled air–sea processes and interactions (Sitz et al., 2017). The Model of the Regional Coupled Earth system, whose ocean model is NEMO, has been tested for the Mediterranean and Indian Ocean domains and has shown reasonable performance in simulations of key elements (Drobinski et al., 2012).
Intercomparison of regional earth system models/regional ocean–atmosphere–land coupled models has not been well coordinated. The Coordinated Regional Downscaling Experiment (CORDEX), an ongoing model intercomparison project within the regional climate modeling community, mainly focuses on traditional uncoupled RCMs (Giorgi et al., 2009; Jones et al., 2011; Gutowski et al., 2016). Two flagship pilot studies on regional ocean–atmosphere–land interactions have been endorsed by CORDEX, which focused on western-southern Africa and the Mediterranean region (
The Institute of Atmospheric Physics (IAP) of the Chinese Academy of Sciences (CAS) has put considerable effort into global ocean–atmosphere coupled model development [see Zhou et al. (2007, 2018) for a review]. One of the IAP’s global models is named the Flexible Global Ocean–Atmosphere–Land System Model (FGOALS) and has contributed to phases 3 and 5 of the Coupled Model Intercomparison Project (CMIP), and is contributing to the ongoing sixth phase (Zhou et al., 2020). The horizontal resolution of FGOALS is relatively coarse (approximately 100–200 km), so the Flexible Regional Ocean–Atmosphere–Land System Model (FROALS), which has a resolution of approximately 50 km, was therefore developed (Zou and Zhou, 2013). FROALS consists of an RCM, version 3 of the Regional Climate Model (RegCM3), with some modifications in convection parameterizations (Zou and Zhou, 2011; Zou et al., 2014), and a global ocean model, LASG/IAP Climate Ocean Model (LICOM), which is the same as in FGOALS. FROALS has been used to dynamically downscale the climate changes made by FGOALS and has shown the importance of regional air–sea coupling in the simulation and projection of the regional climate over the East Asian–WNP region (Zou et al., 2016; Zou and Zhou, 2016, 2017). The deficiencies of FROALS are the relatively low computational efficiency and some significant biases, i.e., cold biases of the sea surface temperature over the WNP and dry biases over the monsoon trough (Zou and Zhou, 2013).
Another deficiency of FROALS is the ~50 km horizontal resolution, which is currently coarse for both regional atmospheric and oceanic components. Recent studies have indicated that for atmospheric models, a horizontal resolution of 10–20 km is essential to sufficiently represent the topographic effects on climate change (Giorgi et al., 2016) and has been shown to provide substantial added value for a variety of climate variables (Torma et al., 2015). Furthermore, a high resolution regional ocean–atmosphere coupled model study indicated that the interaction between ocean mesoscale eddies and the atmosphere plays a crucial role in controlling western boundary currents (Ma et al., 2016). Therefore, regional ocean–atmosphere coupled models with horizontal resolution ranging from approximately 10–20 km must be developed for climate studies.
Given the deficiency of FROALS and the future direction of coupled RCMs, we aim to upgrade FROALS. We coupled the community Regional Climate Model, version 4 (RegCM4) (Giorgi et al., 2012), with the high-resolution regional version of LICOM and investigated the sensitivity of the regional coupled model, RegCM4_LICOM, to the cumulus parameterizations over the WNP (Zou et al., 2019). The Weather Research and Forecasting (WRF) model, which is another community RCM, has been widely used for regional climate studies over Asia (i.e., Liang et al., 2019). In this study, we coupled the newly released WRF4.0 model with the high-resolution regional version of LICOM and compared the performance of WRF4_LICOM with that of RegCM4_LICOM over the WNP. The objectives of this study were as follows: (1) to introduce the regional coupled model WRF4_LICOM and evaluate both the strengths and weaknesses of the model in simulating the WNP summer monsoon rainfall; and (2) to conduct an intercomparison of regional coupled simulations over this region. The metrics employed in this study can serve as a reference for the future development of regional coupled models over this region. The intercomparison of different regional atmospheric model components will provide a basis for the development of the next generation of IAP/CAS regional earth system models.
The rest of the paper is organized as follows: The developed regional coupled model, WRF4-LICOM, the experimental design, and the observational datasets are described in section 2. Section 3 describes the evaluation of the performance of the regional coupled model in simulations of SST, rainfall, circulations, tropical cyclones (TCs), and the diurnal cycle of rainfall. The impacts of different regional atmospheric models are also discussed. Section 4 summarizes the major results.
2.1. Regional ocean–atmosphere coupled model
32.1.1. Regional atmospheric models
The WRF model (Skamarock et al., 2008) we used is the recently released WRF4.0. It has a nonhydrostatic dynamical core and a terrain-following sigma coordinate in the vertical direction. The vertical layers in WRF4 are set to 35, and the buffer zone of the WRF4 model is set to 20 grid layers. The following model physics are employed: the Noah multiphysics land surface model (Niu et al., 2011), the WRF Single-Moment 6-class (WSM6) microphysics scheme (Hong and Lim, 2006), the Rapid Radiative Transfer Model for GCMs for longwave and shortwave radiation parameterizations (Iacono et al., 2008), the Yonsei University (YSU) planetary boundary layer scheme (Hong et al., 2006), the COARE ocean–atmosphere flux algorithm (Fairall et al., 2003), and the cloud scheme proposed by Xu and Randall (1996). For the cumulus parameterization, we employed the Tiedtke scheme (Tiedtke, 1989; Nordeng, 1994).Since our aim was to compare the performance of WRF4-LICOM and RegCM4-LICOM, the RegCM4 model and the physics configuration we used are briefly introduced here. RegCM4 (Giorgi et al., 2012) version 4.6, which is a limited area model, was developed at the Abdus Salam International Centre for Theoretical Physics. The model has 23 levels in the vertical direction, with a terrain-following sigma vertical coordinate. The selected physics configuration is listed below. The land surface model was the Community Land Model (CLM), version 3.5 (Oleson et al., 2008). The grid-scale precipitation was parameterized using the subgrid explicit moisture scheme (Pal et al., 2000). The radiation package from the National Center for Atmospheric Research Community Climate Model, version 3 (Kiehl et al., 1996), was employed. The planetary boundary layer scheme was based on the nonlocal vertical diffusion scheme of Holtslag et al. (1990), with some modifications (Giorgi et al., 2012). The sea surface turbulence heat fluxes were calculated using the Zeng ocean–atmosphere flux algorithm (Zeng et al., 1998). Note that, as in WRF4, the Tiedtke scheme was used to parameterize the convection. The physics configuration of RegCM4 was the same as that in Zou et al. (2019). The physical configurations of the two models are summarized in Table 1.
| Physics | RegCM4 | WRF4 |
| Dyn Core | Hydrostatic MM5 | Nonhydrostatic WRF |
| Horizontal res. | 15 km | 15 km |
| Vertical res. | 23L | 35L |
| PBL | Holtslag (Holtslag, 1990; Giorgi et al., 2012) | YSU (Hong et al., 2006) |
| Rad | CCM3 (Kiehl et al., 1996) | RRTM (Iacono et al., 2008) |
| Cloud | CCM3 (Kiehl et al., 1996) | Xu and Randall (Xu and Randall, 1996) |
| Cumulus | Tiedtke (Tiedtke, 1989; Nordeng, 1994) | Tiedtke (Tiedtke, 1989; Nordeng, 1994) |
| Microphysics | SUBEX (Pal et al., 2000) | WSM6 (Hong and Lim, 2006) |
| LSM | CLM3.5 (Oleson et al., 2008) | Noah-MP (Niu et al., 2011) |
Table1. Summary of the physics configurations in RegCM4 and WRF4.
3
2.1.2. Oceanic model component
A North Pacific Ocean model was employed as the oceanic model component. The regional ocean model was developed from a quasi-global eddy-resolving OGCM (Yu et al., 2012; Liu et al., 2014), which was based on the LASG/IAP climate ocean model, version 2 (LICOM2) (Liu et al., 2012). Compared to LICOM2, the updates and improvements of the eddy-resolving OGCM include (Yu et al., 2012): (1) increased horizontal and vertical resolutions; (2) deactivation of mesoscale eddy parameterizations and improved barotropic and baroclinic split methods; and (3) the inclusion of a two-dimensional message passing interface, both zonal- and meridional-split. The North Pacific Ocean model employs a horizontal longitude–latitude grid of uniform 0.1° squares and vertical
LICOM_np covers the North Pacific (colored region of Fig. 1). In this kind of model configuration, only the southern boundary is open. During the simulation, the simulated ocean temperature and salinity in the southern boundary were relaxed to the Levitus climatological monthly data (Levitus et al., 2006), and the solid wall condition was used for the velocity. The spin-up process of LICOM_np has been described in Zou et al. (2019). First, with the initial conditions from World Ocean Atlas 2005 (Antonov et al., 2006; Locarnini et al., 2006), the LICOM_np model was driven for 10 years with the climatological daily atmospheric forcing from the Coordinated Ocean-Ice Reference Experiment (CORE) (Griffies et al., 2012). Then, the model was driven with the daily atmospheric forcing from CORE phase II (CORE II) from 1990–2007. The CORE dataset was used since it has been widely used to perform global ocean–sea ice coupled simulations (i.e., Liu et al., 2012). The spin-up process has been shown to be reasonable in RegCM4_LICOM (Zou et al., 2019).
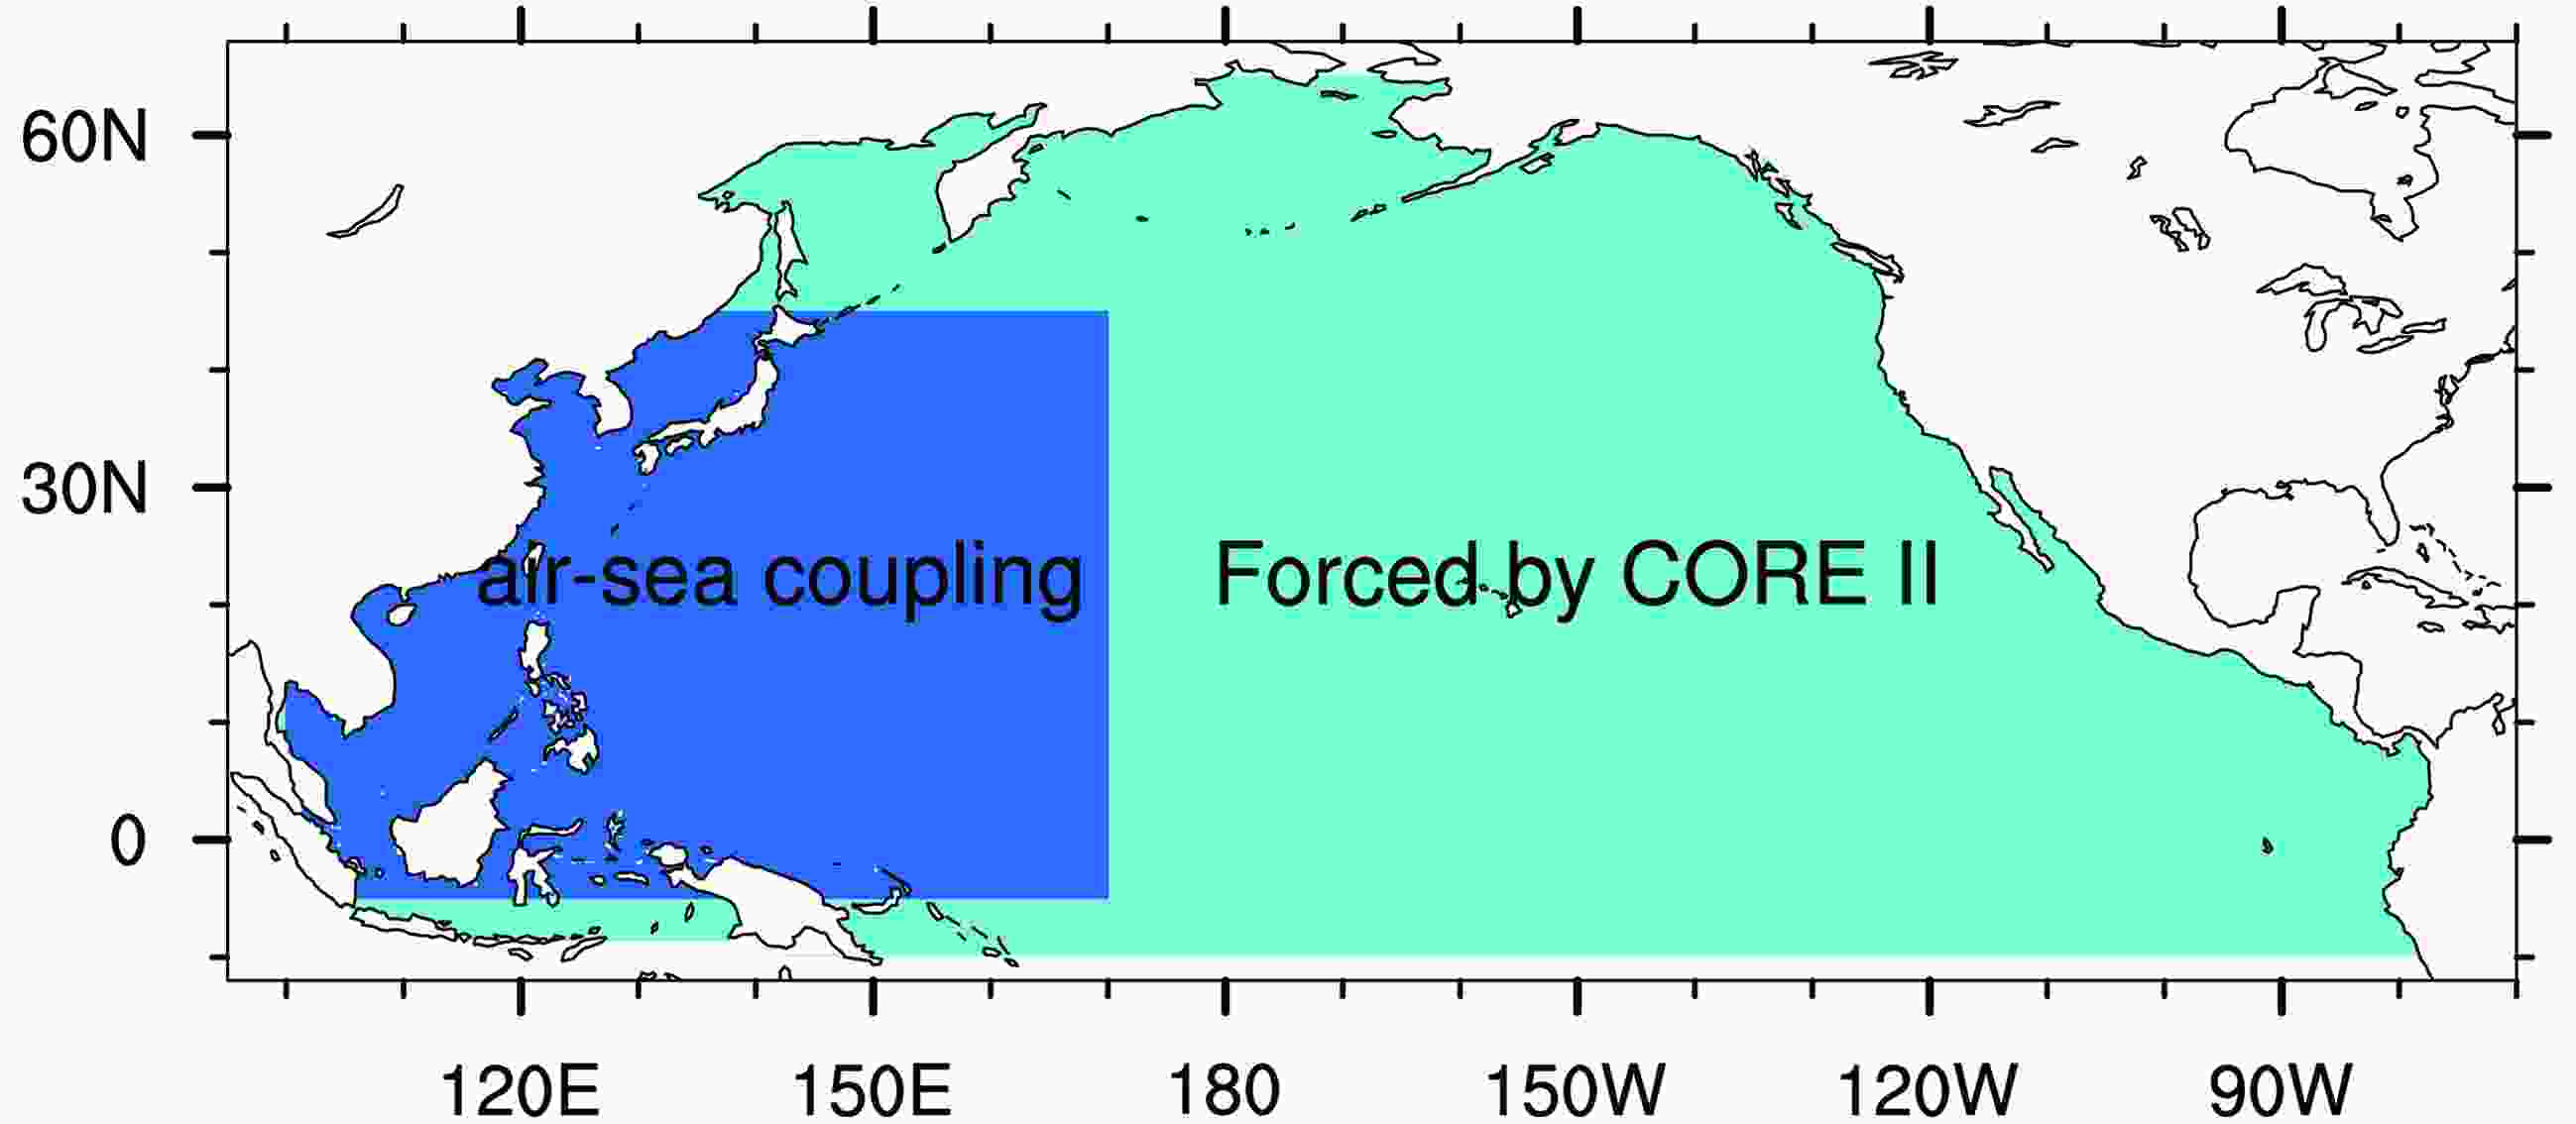 Figure1. Experimental design. The ocean model and regional atmospheric model are fully coupled over the WNP (dark blue region), while the ocean model is driven by the CORE-II data outside the WNP (light blue region).
3
2.1.3. Ocean–atmosphere coupling
The Ocean Atmosphere Sea Ice Soil coupler, version 3 (Valcke, 2006), was used to couple WRF4 with LICOM_np. During the coupling process, the heat flux (including solar and non-solar) and surface wind stress at the sea surface were transferred from WRF4 to the ocean model, while the ocean model provided the SST and ocean surface currents to WRF4. When calculating the sea surface sensible heat flux, latent heat flux and wind stresses, the relative motion of the atmospheric wind at the lowest level and the ocean surface current were taken into account.2
2.2. Experimental design
To fairly compare the model performances, the experimental design for WRF4_LICOM was identical to that for RegCM4_LICOM (Zou et al., 2019). We briefly describe the experimental design here. The model domain of WRF4 covered the WNP (dark blue region in Fig. 1) with a horizontal resolution of 15 km. The European Centre for Medium-Range Weather Forecasts (ECMWF) interim reanalysis (ERA-Interim) dataset (Dee et al., 2011), which has a horizontal resolution of 0.75°×0.75°, was employed to drive the regional atmospheric model as the initial and lateral boundary conditions, which were laterally updated every 6 h.The regional coupling started on 1 November 2004. WRF4 and the ocean model were coupled over the WNP. The coupling interval was 1 h. Outside the WNP region, the ocean model was driven by the CORE II daily atmospheric forcing. Note that in this study, LICOM_np outside of the WNP was forced by CORE II data but not ERA-Interim since the stand-alone LICOM_np model was tuned with the forcing from CORE-II. The regionally coupled simulation was conducted for one year, from 1 November 2004 through 30 November 2005. The year 2005 was selected because it was a normal WNP summer monsoon year. The simulation using RegCM4_LICOM with the Tiedtke scheme, which has been described in Zou et al. (2019), was used to compare to the results from WRF4_LICOM. To facilitate the discussion, the regionally coupled simulations using RegCM4 and WRF4 are referred to as RegCM4_LICOM and WRF4_LICOM, respectively.
2
2.3. Observational datasets
The following datasets were used to validate the model performance: (1) the satellite-retrieved precipitation dataset of the Tropical Rainfall Measuring Mission (TRMM) 3B42 product with a resolution of 0.25° (Huffman et al., 2007); (2) the convective and stratiform rainfall derived from TRMM 3A12 (Kummerow et al., 2001); (3) the daily rainfall gridded dataset for the land area over Asia with a 0.25 × 0.25° grid derived from the Asian Precipitation–Highly Resolved Observational Data Integration toward the Evaluation of Water Resources (APHRO) project (Yatagai et al., 2012); (4) the daily mean circulation field derived from ERA-Interim with a 0.75° × 0.75° grid; (5) the daily Optimal Interpolation Sea Surface Temperature data with a resolution of 0.25° from the National Oceanic and Atmospheric Administration (Reynolds et al., 2007); and (6) the observational dataset of TCs derived from the International Best Track Archive for Climate Stewardship (IBTrACS) best-track datasets (Knapp et al., 2010). To facilitate the following discussion, the satellite-retrieved precipitation and the reanalysis dataset are referred to as the “observation”.3.1. SST simulation
Figure 2 shows the simulated SST biases averaged from June to August of 2005 over the WNP region derived from the WRF4_LICOM simulations. The corresponding biases of the RegCM4_LICOM simulation are already shown in Fig. 3c in Zou et al. (2019). Both RegCM4_LICOM and WRF4_LICOM significantly reduced the cold biases of the simulated SST over the central WNP, as shown in the previous version of FROALS (RegCM3_LICOM) [Fig. 2c in Zou and Zhou (2013)]. These improvements can be ascribed to two factors. The first factor is the ocean mesoscale eddy-resolving resolution of LICOM, which improved simulations of the ocean current and the associated heat transport (Yu et al., 2012). The second factor is the Tiedtke cumulus parameterization scheme. A study using RegCM4_LICOM (Zou et al., 2019) showed that the simulated SST over the WNP is sensitive to the choice of cumulus parameterization scheme.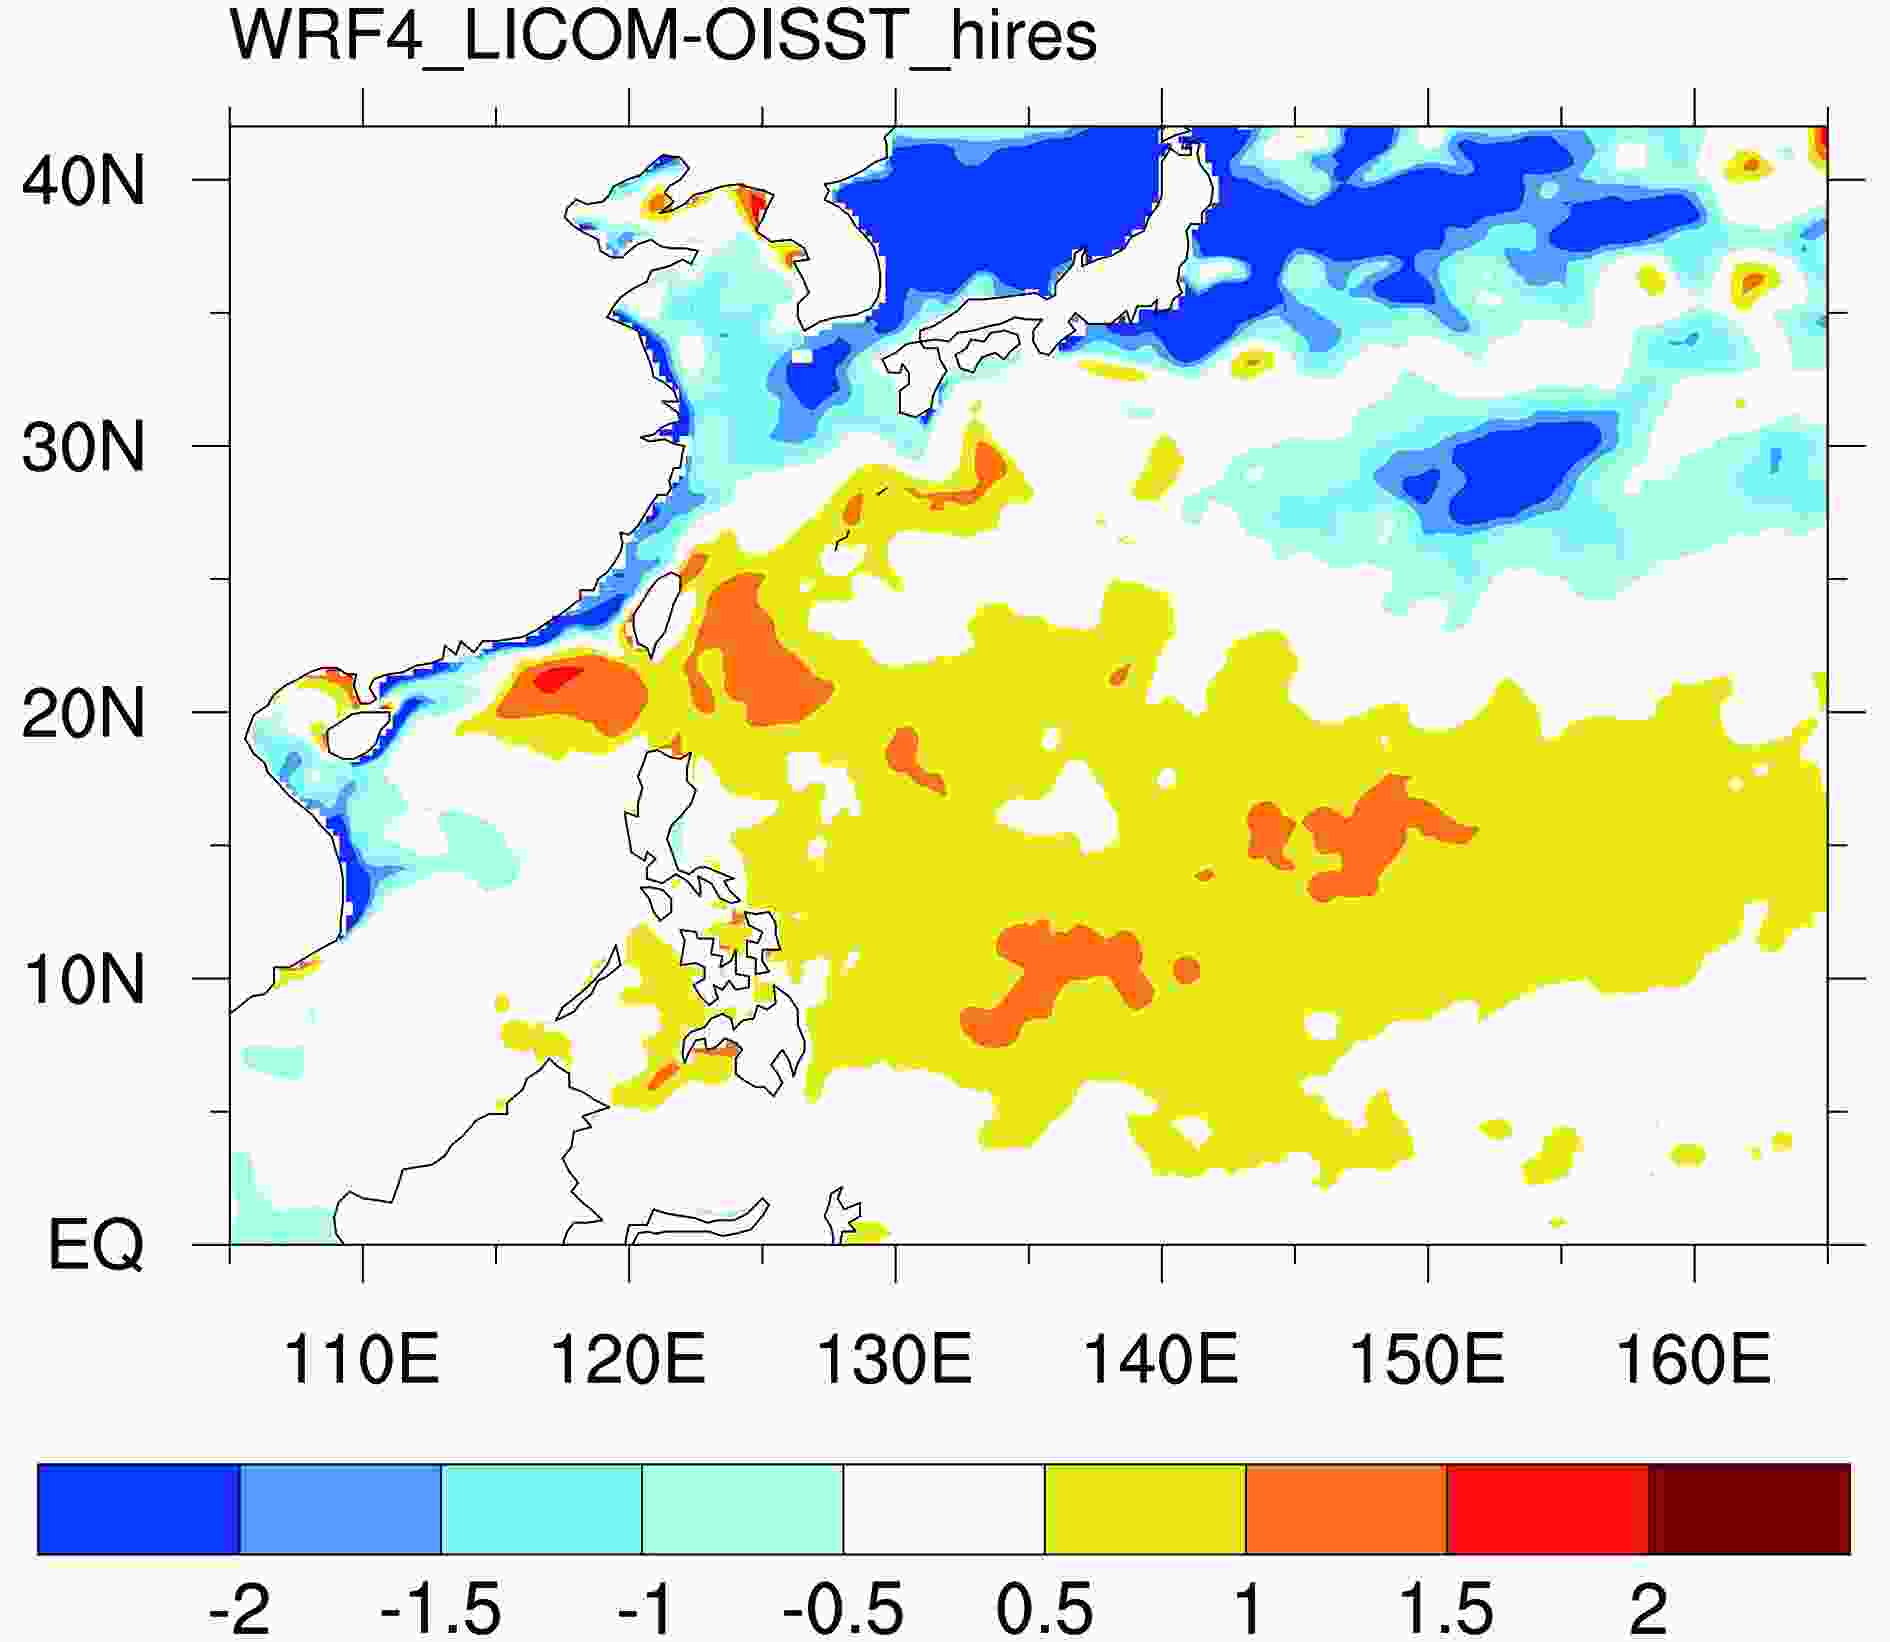 Figure2. Spatial pattern of the simulated biases of 2005 JJA mean SST (°C) over the WNP from WRF4_LICOM.
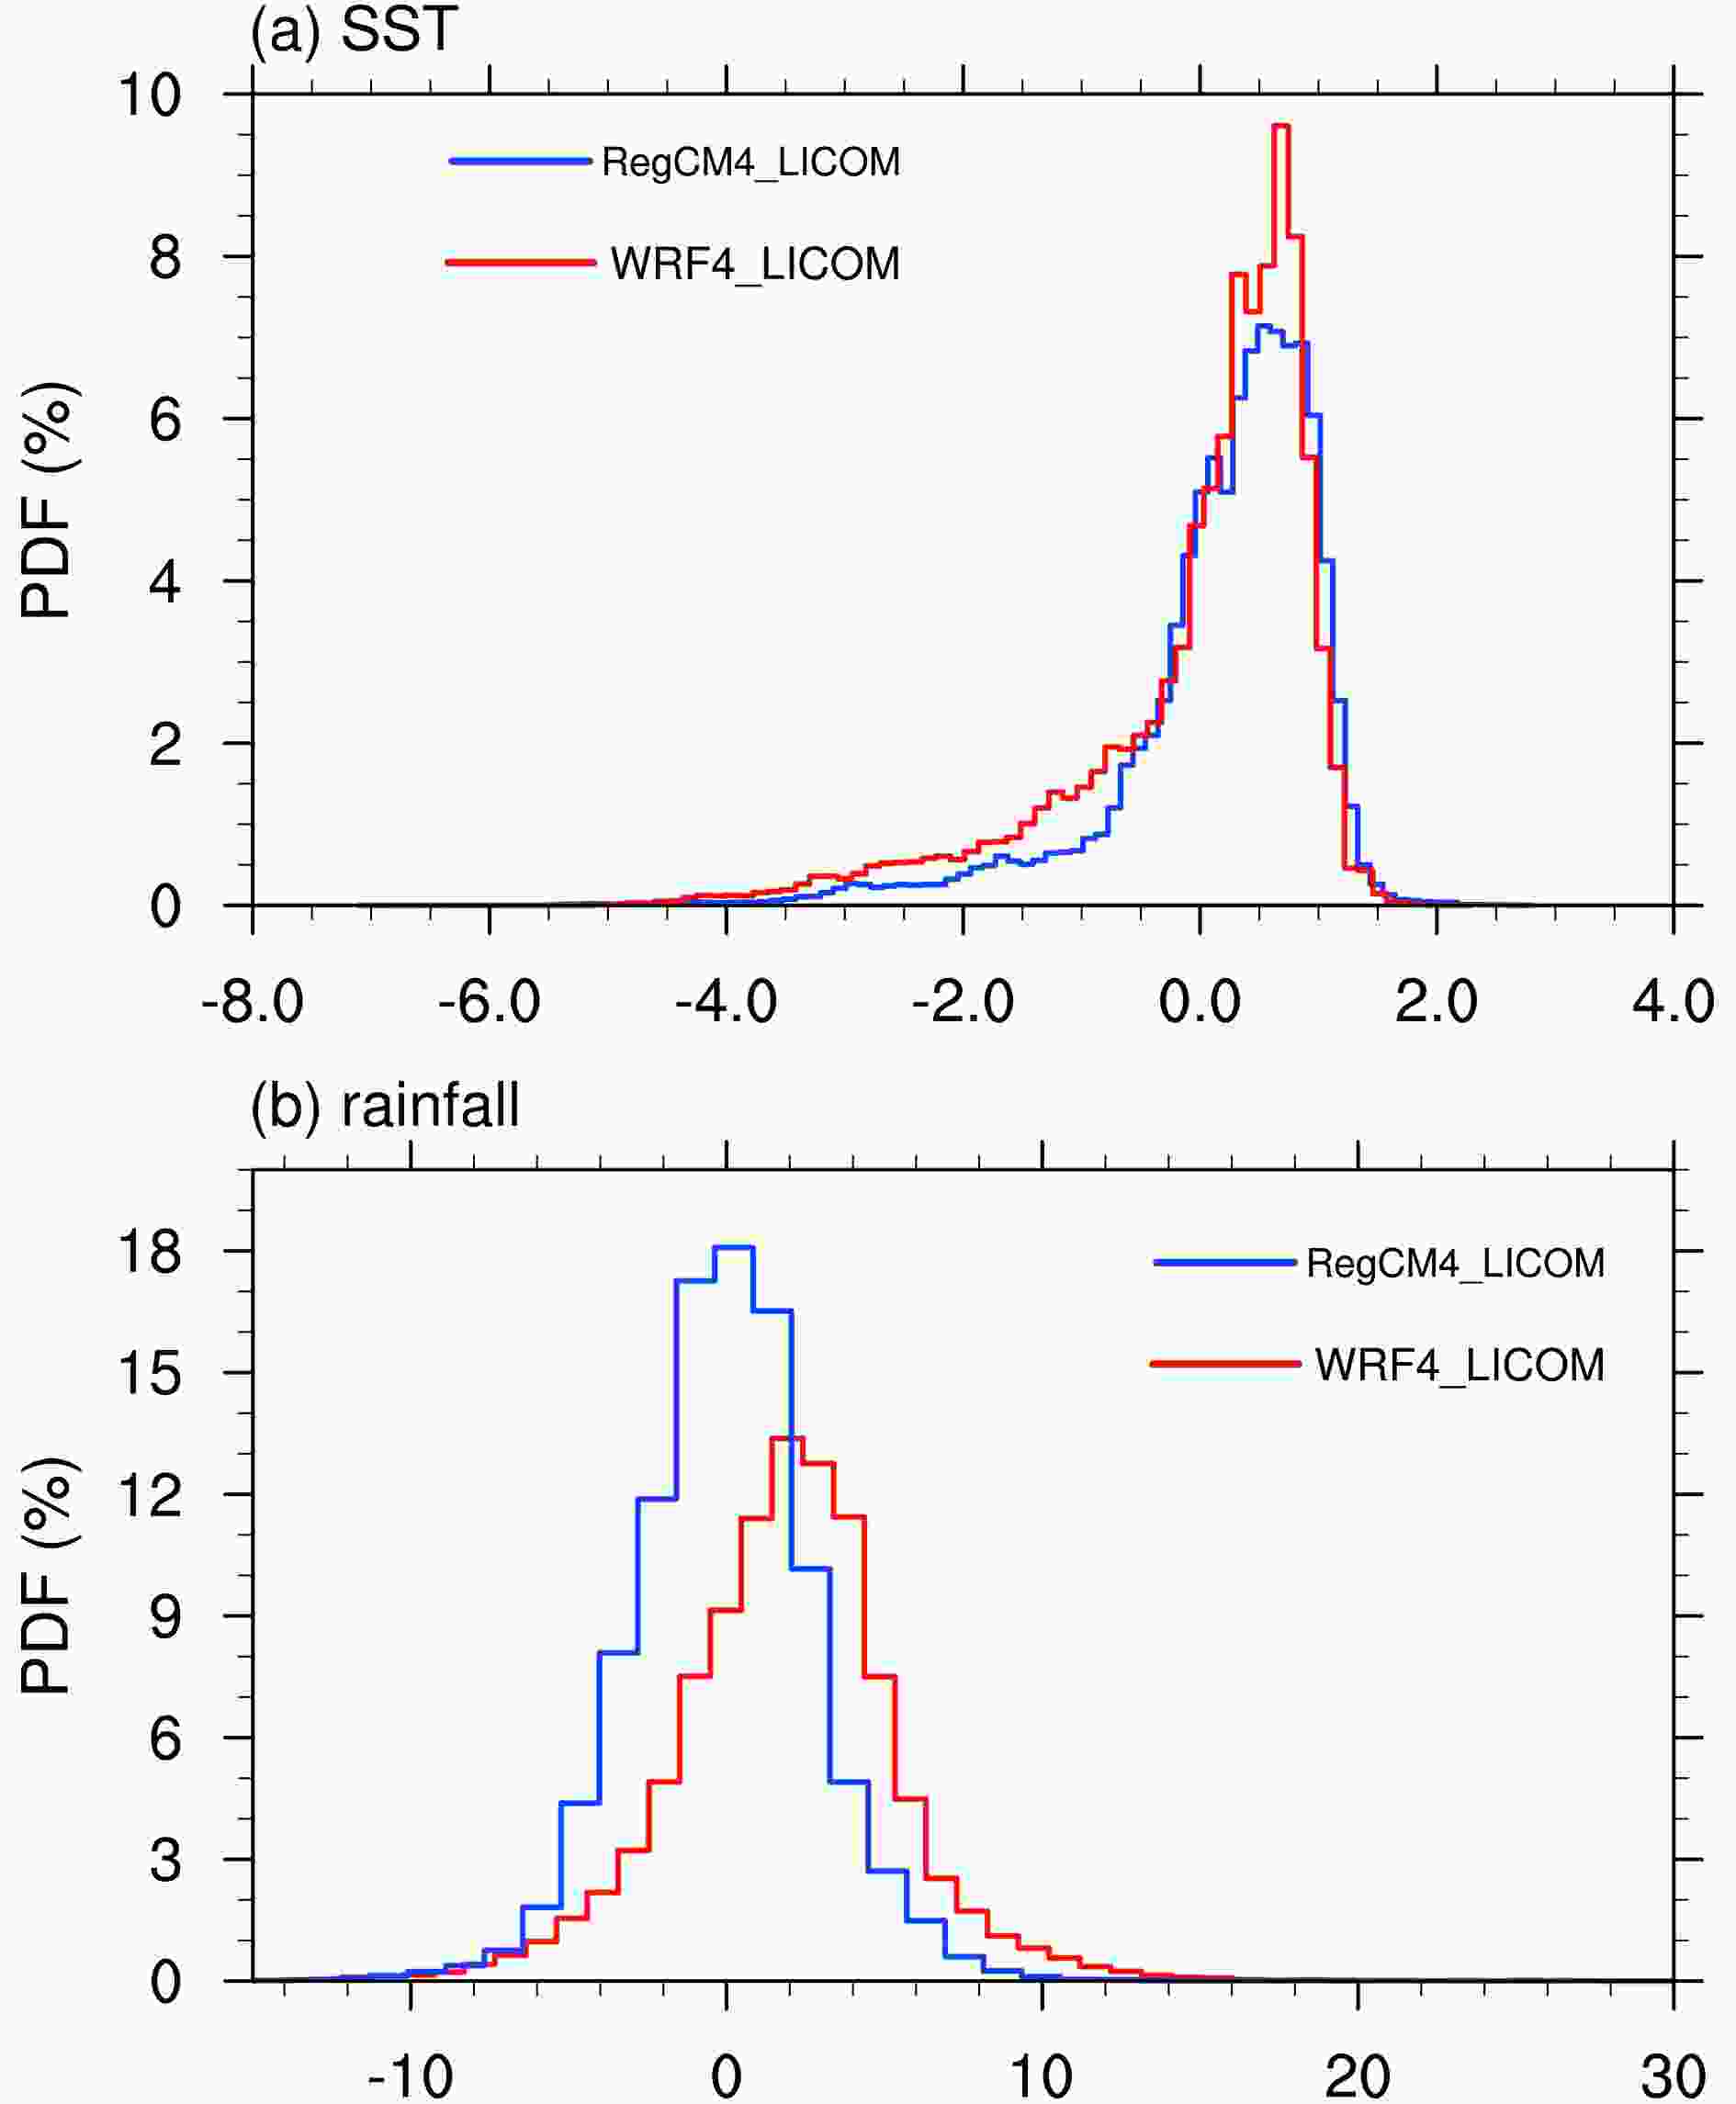 Figure3. The PDF distributions of the simulated biases of the 2005 JJA mean (a) SST (°C) and (b) rainfall (mm d?1) over the WNP from RegCM4_LICOM and WRF4_LICOM.
Compared to that in RegCM4_LICOM, the simulated SST was colder in WRF4_LICOM. The average SST bias was 0.01°C (?0.21°C) in RegCM4_LICOM (WRF4_LICOM). Spatially, the cold biases north of 35°N in LICOM_np (Fig. 2 in Zou et al. 2019) have been inherited in the regionally coupled simulations, with a larger (weaker) magnitude in WRF4_LICOM (RegCM4_LICOM). The warm (cold) biases were evident along the coastline of Vietnam and mainland China in RegCM4_LICOM (WRF4_LICOM). The RMSE of the simulated SST was 0.89°C in RegCM4_LICOM, while it was slightly larger in WRF4_LICOM (1.05°C).
Figure 3a shows the probability density function (PDF) distribution of the SST biases over the WNP derived from both RegCM4-LICOM and WRF4-LICOM. An overall normal-mode type of distribution was found in the coupled simulations, with a peak around 0.5°C. The frequencies of biases colder than ?0.75°C were larger in WRF4_LICOM. Quantitatively, 48.3% (38.9%) of the model grids had biases within ±0.5°C in RegCM4_LICOM (WRF4_LICOM). These results indicate that RegCM4_LICOM performs slightly better than WRF4_LICOM in the simulation of SST over the WNP in the boreal summer of 2005.
2
3.2. Summer mean rainfall
Rainfall is a rigorous test for RCMs. In the observations, four major rainbands, as indicated by the four boxes in Fig. 4a, were found over the east of the Philippines (monsoon trough), over the northern South China Sea, over the region extending northeast from South China to the east of Japan, and over the mei-yu front region. Both regionally coupled simulations exhibited comparable performances, with an SCC of 0.62 (0.56) for RegCM4_LICOM (WRF4_LICOM). The spatial distribution of the 2005 summer mean rainfall derived from APHRO (contours in Fig. 4a) was similar to that from the satellite-retrieved rainfall from TRMM 3B42 over the land area, with a spatial pattern correlation coefficient of 0.80. Since our aim was to provide an overview of the model performance of WRF4-LICOM over both land and ocean, the evaluation is mainly based on the TRMM data. The dry biases in RegCM3_LICOM over the monsoon trough [Fig. 5c in Zou and Zhou (2013)] have been significantly reduced in both RegCM4_LICOM and WRF4_LICOM. Figure4. Spatial distributions of the 2005 JJA mean precipitation (mm d?1) over the WNP derived from (a) observations [TRMM (shading) and APHRO (contours)], and (b) WRF4_LICOM. The numbers 1–4 in (a) represent the locations of the observed major rainbands/centers. The simulated biases from RegCM4_LICOM and WRF4_LICOM with respect to TRMM data (shading) and APHRO data (contours) are shown in (c) and (d), respectively.
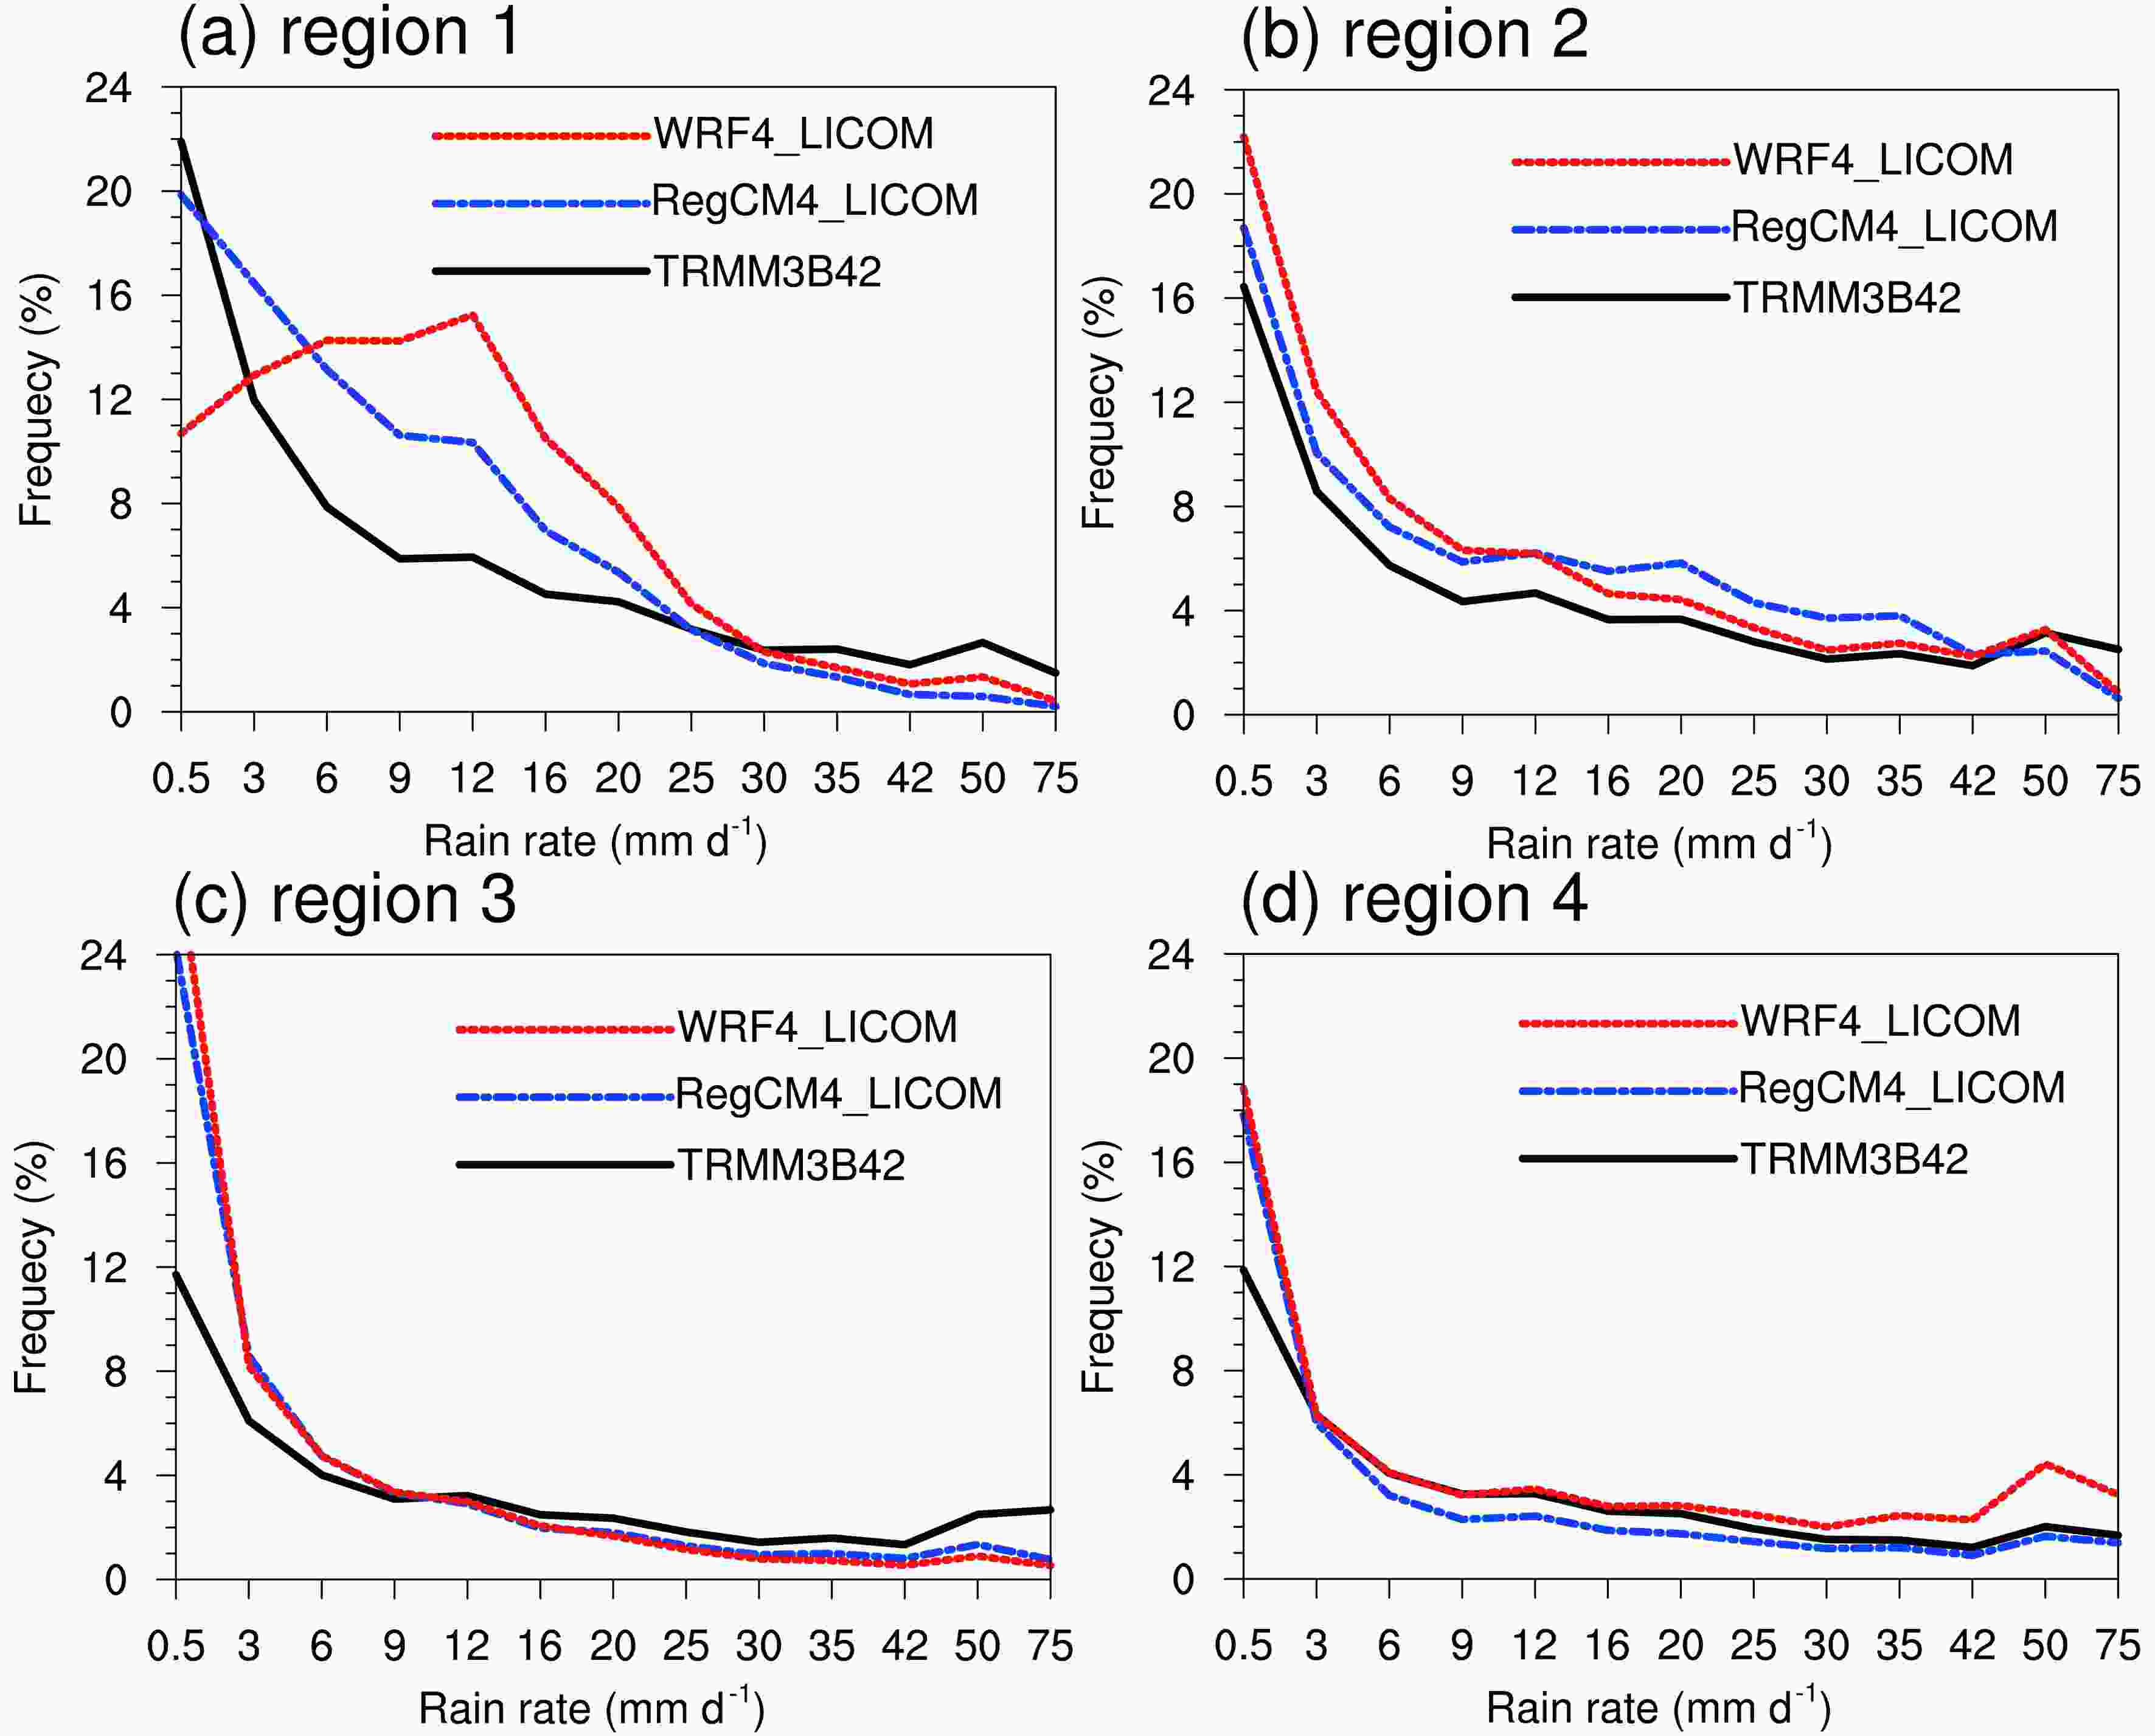 Figure5. The PDF distributions of the daily rain rate over the selected four regions shown in Fig. 4a from June to August of 2005.
Regionally, WRF4_LICOM tended to overestimate (underestimate) the rainfall amount over the monsoon trough and the mei-yu front region (over southern China) (Fig. 4d), while RegCM4_LICOM tended to underestimate the rainfall over the major rainy centers (Fig. 4c). The absolute biases and RMSEs of the rainfall simulated by WRF4_LICOM were larger than those simulated by RegCM4_LICOM, except for the absolute biases over the northern South China Sea (Table 2).
| RegCM4_LICOM | WRF4_LICOM | ||||
| Bias | RMSE | Bias | RMSE | ||
| Region 1 | ?1.28 | 2.97 | 2.80 | 3.79 | |
| Region 2 | 0.46 | 3.38 | ?0.16 | 3.94 | |
| Region 3 | ?3.40 | 4.92 | ?3.93 | 5.73 | |
| Region 4 | ?1.51 | 3.40 | 4.79 | 5.31 | |
Table2. JJA mean statistics of simulated precipitation (mm d?1) over the four selected regions (shown in Fig. 4a). Bias (mm d?1) is the regional averaged model bias, and RMSE (mm d?1) is root-mean-square error.
As the SST biases, the corresponding PDFs of the rainfall biases are shown in Fig. 3b. Normal mode-type distributions of the biases were found for the two simulations, with a peak of ?0.39 (1.44) mm d?1 for RegCM4_LICOM (WRF4_LICOM). The percentages of the model grids with positive rainfall biases in WRF4_LICOM were higher than those in RegCM4_LICOM. Quantitatively, 51.9% (41.4%) of the model grids had rainfall biases within ±2 mm d?1 in RegCM4_LICOM (WRF4_LICOM). These results suggest that the performance of RegCM4_LICOM is better overall than that of WRF4_LICOM in the simulation of the June–July–August (JJA) mean rainfall of 2005 over the WNP, while the major deficiency of RegCM4_LICOM is that the model tends to underestimate the rainfall amount. The results shown in Fig. 3 indicate that the rainfall biases and SST biases are physically consistent. The larger positive rainfall biases in WRF4_LICOM favor less solar radiation reaching the sea surface, thus leading to larger cold SST biases.
To further understand the mean summer rainfall biases, Fig. 5 shows the PDF distribution of the daily rainfall rates derived from observations and the two regionally coupled simulations over four selected regions (shown in Fig. 4a) during JJA of 2005. Over the monsoon trough (Fig. 5a), both models tended to overestimate the frequencies of rain rates between 3 mm d?1 and 25 mm d?1, with much higher frequencies in WRF4_LICOM, contributing to the overly wet biases in this region. Both models tended to overestimate (underestimate) the frequencies of rain rates lower than (greater than) 42 mm d?1 over the northern South China Sea (Fig. 5b), indicating that reasonable estimation of the rainfall amount (Table 2) compensates for model errors. Underestimation of the frequencies of rain rates greater than 12 mm d?1 over southern China (Fig. 5c) contributed to the dry biases in both models. The overestimated rainfall over the mei-yu-front region in WRF4_LICOM could mainly be attributed to the overestimated frequencies of rain rates greater than 30 mm d?1 (Fig. 5d).
2
3.3. Large-scale circulation associated with the rainfall
The interplay between rainfall and monsoon circulations is important over the WNP. Figure 6 compares the performances of the two models in a simulation of geopotential height at 500 hPa and mid-level wind at 500 hPa averaged from June to August of 2005. In the observation (Fig. 6a), the western North Pacific subtropical high (WNPSH) is a dominant system over the WNP. The mid-level westerly wind from the Indian summer monsoon, the southerly flow across the Maritime Continent, and the mid-level easterly wind associated with the WNPSH converge over the northern South China Sea and east of the Philippines, producing a large amount of rainfall in these regions. Then, the southwesterly wind related to the Indian summer monsoon and the southeasterly wind in the southern flank of the WNPSH further converge over southern China, while the rainfall over the mei-yu front region corresponds well with the warm horizontal temperature advection at 500 hPa. The warm horizontal temperature advection by the mid-level westerly jet has been regarded as a crucial environmental forcing for the mei-yu rainband (Sampe and Xie, 2010). The general distributions of the WNPSH and the associated wind field were reasonably captured by each simulation, with SCCs larger than 0.95. However, some differences and biases existed. The simulated WNPSH by RegCM4_LICOM was weaker and shifted eastwards compared to the observation (Fig. 6b), which led to weaker moisture flux convergences over southern China and weaker mid-level warm horizontal temperature advection over the mei-yu front region, resulting in dry biases over East China (Fig. 5b). In contrast, the WNPSH simulated by WRF4_LICOM was too strong and shifted westwards (Fig. 6c), also favoring weaker convergences over southern China but stronger mid-level warm horizontal temperature advection over the mei-yu front region. Subsequently, dry (wet) biases were found over southern China (the mei-yu front region) (Fig. 4c).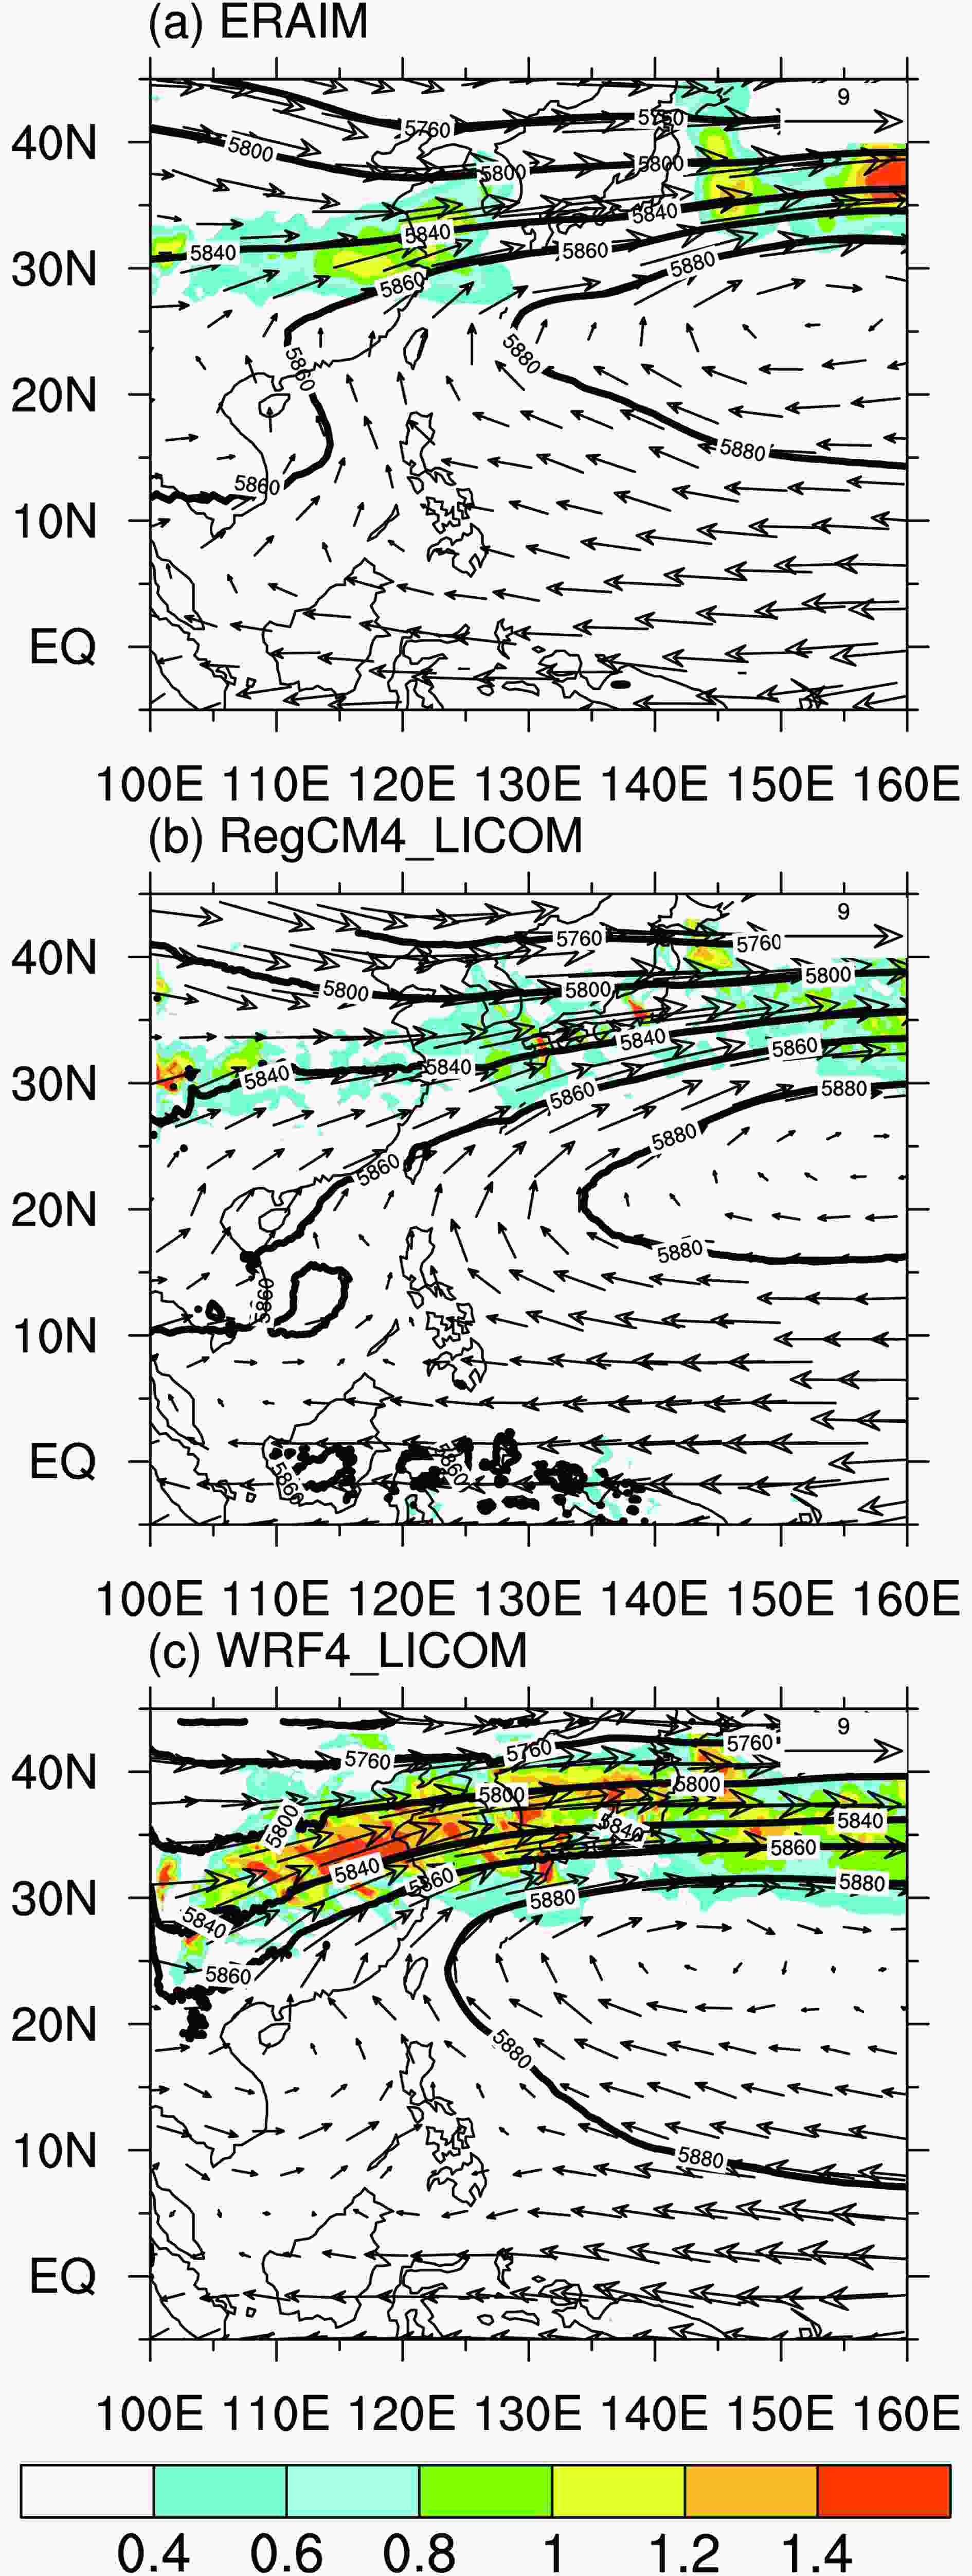 Figure6. Spatial distributions of the 2005 JJA mean geopotential height at 500 hPa (contours, gpm), the wind fields at 500 hPa (vectors, m s?1) and the 500-hPa horizontal advection of temperature (shading, K d?1) over the WNP derived from (a) observation, (b) RegCM4_LICOM, and (c) WRF4_LICOM.
But why do the two regional coupled models exhibit opposite biases in their simulations of the WNPSH despite both being driven by ERA-Interim reanalysis data? Figure 7 shows cross sections of the simulated biases of the 2005 JJA mean meridional overturning circulation averaged over 110°–160°E. Similar biases (ascending anomalies throughout the troposphere) were evident over the area north of 30°N and south of 10°N in both models, while almost opposite biases were found in between; that is, anomalous ascending (descending) motions in the middle to upper troposphere simulated by RegCM4_LICOM (WRF4_LICOM) within 25°–30°N, which were indicative of a weakened (enhanced) WNPSH, were accompanied by descending (ascending) anomalies over the region around the Philippines (12°–16°N).
 Figure7. Latitude–height cross sections of the biases of the simulated 2005 JJA mean vertical p velocity (ω, shading, ?100 hPa s?1) and the meridional overturning circulation (v and ?ω × 100) averaged over 110°–160°E derived from (a) RegCM4_LICOM and (b) WRF4_LICOM.
The biases of the simulated WNPSH may have been induced by those of the simulated diabatic heating around the Philippines. The mechanism is very similar to that of the Pacific–Japan pattern in the observations, which suggests that the strong convective activities around the Philippines favor an enhanced and westward-shifted WNPSH through the Rossby wave response (e.g., Nitta, 1987; Huang and Sun, 1992). Figure 8a shows the vertical profile of the summer mean total heating, which is expressed as the apparent heat source, averaged over the region around the Philippines (12°–16°N, 110°–160°E). A peak of heating is located between 400 and 500 hPa in the reanalysis, but the peak was underestimated (overestimated) in RegCM4_LICOM (WRF4_LICOM).
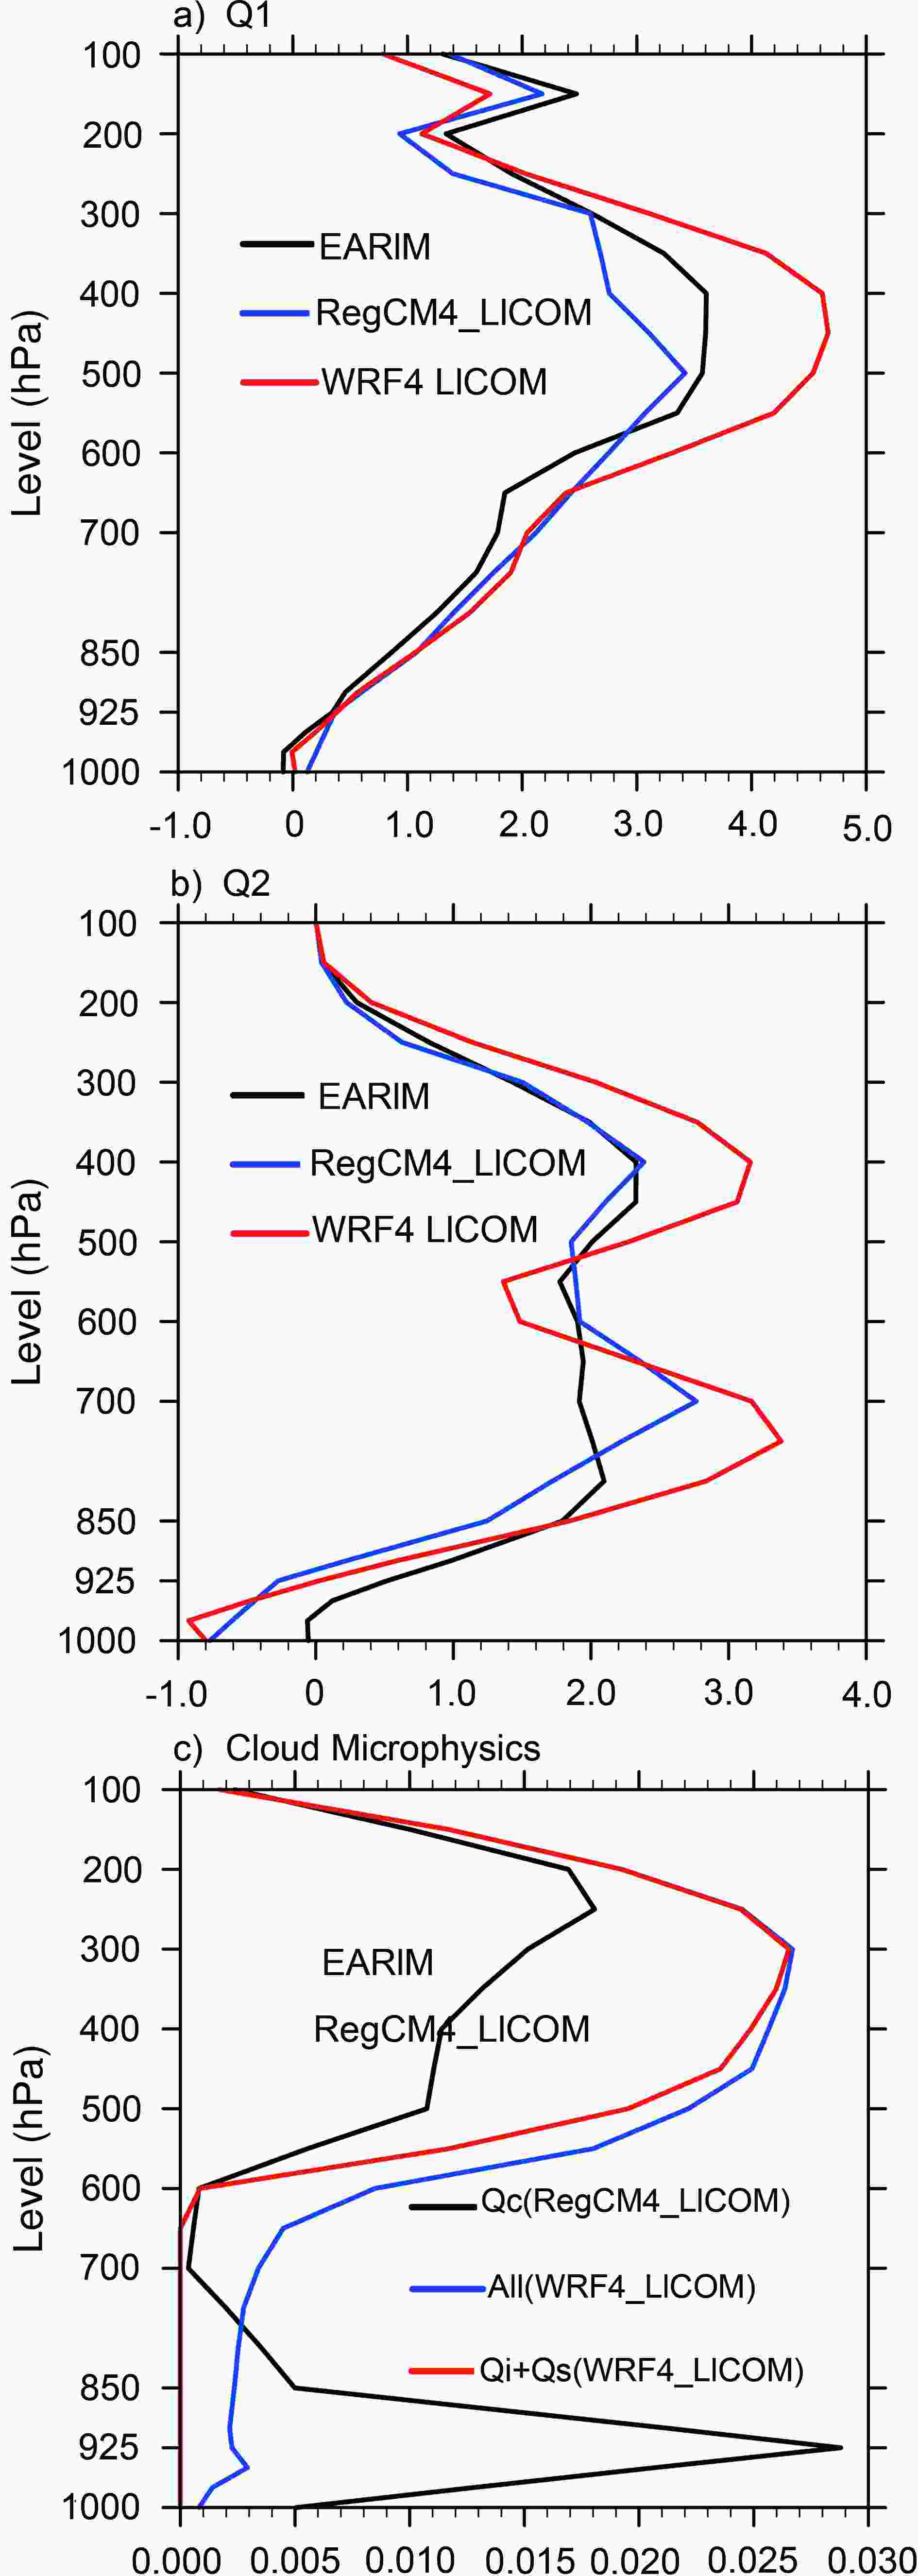 Figure8. Vertical profiles of the 2005 JJA mean (a) apparent heat source (Q1/Cp, K d?1) and (b) the moisture sink (Q2/Cp, K d?1) averaged over (12°–16°N, 110°–160°E) derived from observation, RegCM4_LICOM and WRF4_LICOM. (c) Vertical profiles of the 2005 JJA mean simulated cloud condensates (cloud water in RegCM4_LICOM, but the total amount of five species along with the sum of cloud ice and cloud snow from WRF4_LICOM) averaged over (12°–16°N, 110°–160°E).
To further investigate the processes that contributes to the biases of simulated heating, the vertical profile of the regional averaged condensation heating, which is roughly expressed as the apparent moisture sink, and the cloud condensates over (12°–16°N, 110°–160°E) are also shown in Fig. 8. Clearly, the enhanced diabatic heating in WRF4_LICOM (Fig. 8a) is mainly derived from the stronger condensation heating (Fig. 8b). However, the weakened diabatic heating between 400 and 500 hPa in RegCM4_LICOM may be more due to the reduced longwave radiative warming associated with fewer high clouds (Fig. 8c). Note that compared to WRF4_LICOM, more low-level clouds were simulated in RegCM4_LICOM, which tended to stabilize the low-level troposphere and inhibit deep convection; as a result, less moisture was transported to be condensed in the upper troposphere.
2
3.4. TC activities
The regionally coupled continuous simulations were initialized on 1 November 2004; thus, the models are not expected to represent specific TCs during the summer of 2005 because the initial condition of the atmosphere would be long forgotten by then, even when applying the observed atmospheric lateral boundary conditions, since the domain was not very small. Therefore, we assess the models’ abilities to simulate the TC statistics during the warm season of 2005.In this study, the TC track detection method (Murakami and Sugi, 2010) was applied, which has been effective for detecting TC tracks in reanalysis data and high-resolution climate models (Murakami et al., 2012; Murakami, 2014; etc.). The criteria for TC track detection include: (1) the maximum relative vorticity at 850 hPa exceeds 1.5 × 10?4 s?1; (2) the sum of the temperature deviations at 850, 500, and 300 hPa exceeds 1.0 K over a 10° × 10° grid box (identification of the TC warm core aloft); (3) the wind speed at 850 hPa is greater than the wind speed at 300 hPa above the detected TC center (to eliminate extratropical cyclones); and (4) the duration of each detected TC center must last longer than 48 h. The criteria threshold is like that in Murakami et al. (2012) but with larger relative vorticity criteria, so that the detected TC number during April to October of 2005 was 19 (18) in RegCM4_LICOM (WRF4_LICOM), which was close to the 18 in the observation.
Figure 9 shows the observed and simulated TC frequencies (TCFs) from April to October of 2005. The TCF is defined as the number of TCs passing at each 2.5° × 2.5° grid box. In the observation (Fig. 9a), TCs mainly generated over the central WNP and then moved westwards (northwards) to mainland China (Japan). The observed pattern was partly reproduced in RegCM4_LICOM, with an SCC of 0.25, but the genesis locations of the simulated TCs shifted southwards by approximately 5° (Fig. 9b). In WRF4_LICOM (Fig. 9c), the genesis locations of simulated TCs shifted too far westwards, probably due to the overly strong and westward-shifted WNPSH (Fig. 6c). The SCC of WRF4_LICOM was 0.13.
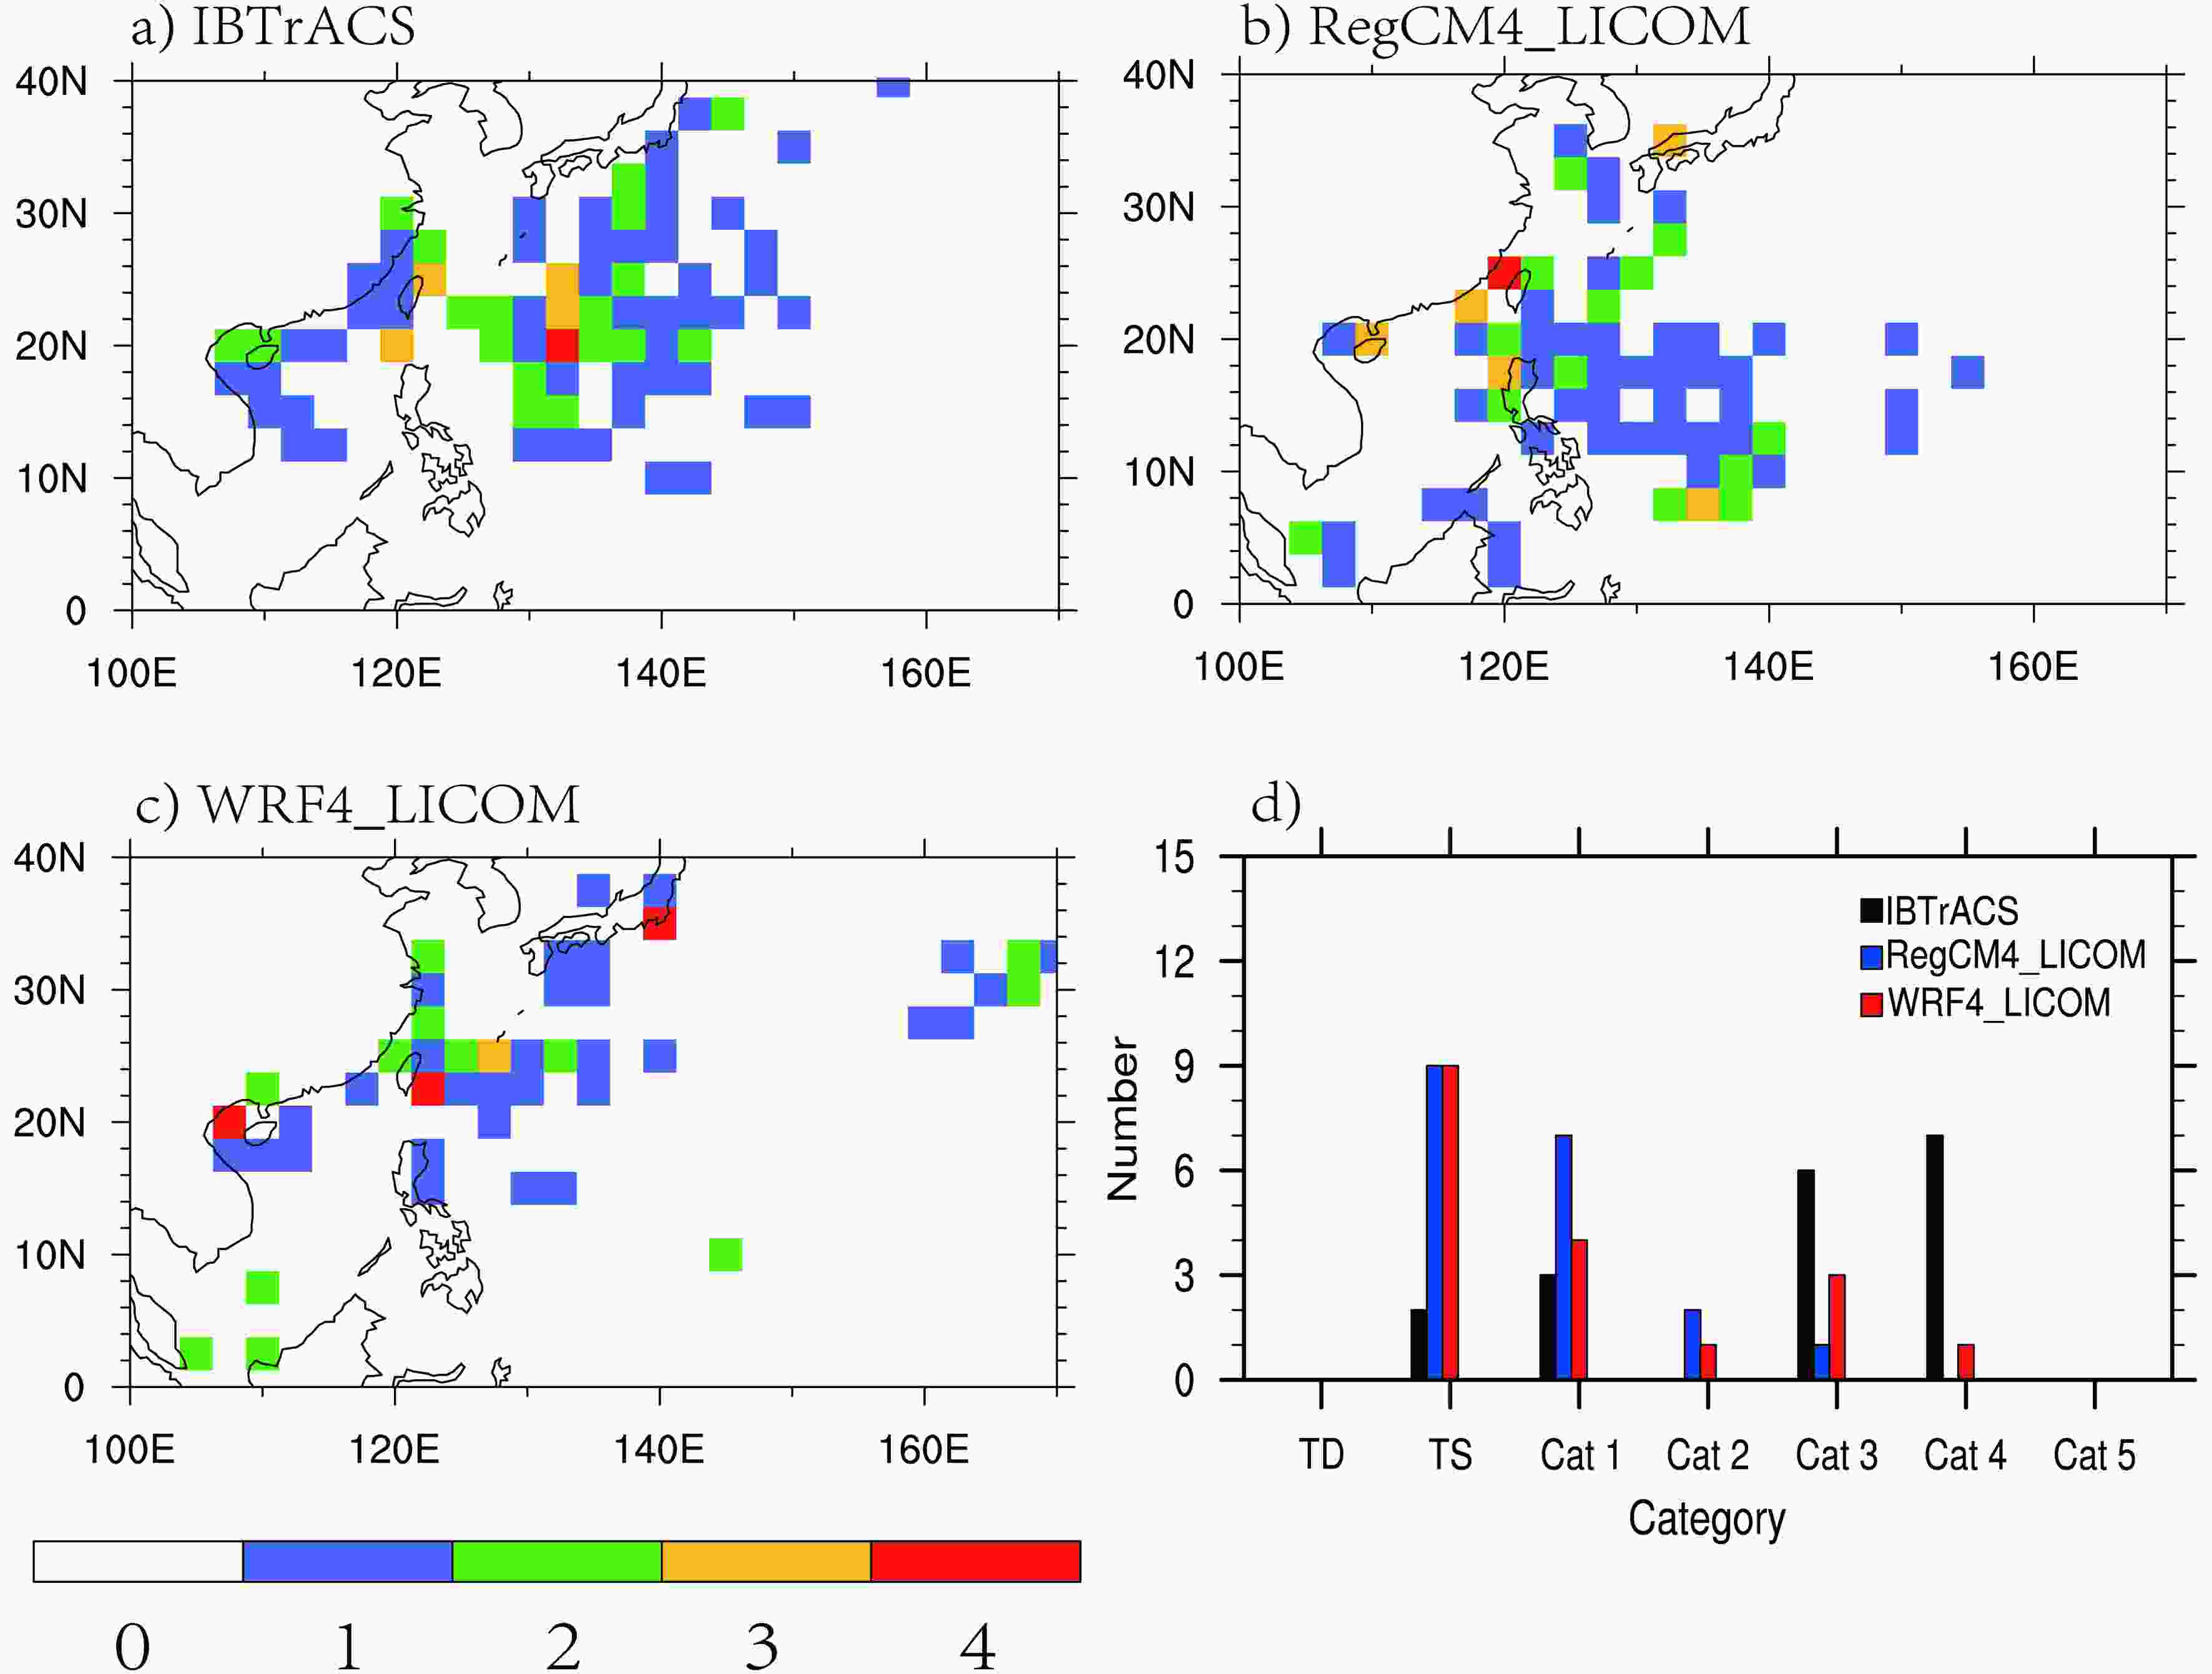 Figure9. Spatial distributions of the TCF (tropical cyclone frequency) during April to October of 2005 derived from (a) IBTrACS, (b) RegCM4_LICOM, and (c) WRF4_LICOM. The TCF is defined as the number of TCs passing at each 2.5° × 2.5° grid box. (d) Intensity distributions of TCs categorized based on the Saffir–Simpson hurricane wind scale.
The observed and simulated TCs were further categorized into seven types [tropical depressions (TDs), tropical storms (TSs), and categories 1?5 (Cat 1–Cat 5)] based on the Saffir–Simpson hurricane wind scale (Fig. 9d). Clearly, both models tended to underestimate the observed TC intensity, i.e., they produced more TSs and fewer Cat 4 TCs. Compared to RegCM4_LICOM, WRF4_LICOM showed fewer TCs with Cat 1 intensity but more TCs with Cat 3 and Cat 4 intensity, thus exhibiting improved performance.
The rainfall induced by a TC was defined as the rainfall within a 5° × 5° grid box around the TC center. Figure 10 shows the percentage contributions from the rainfall induced by TCs to the total rainfall amount. In the observation, TC-induced rainfall contributes more than 40% of the total rainfall over the northern South China Sea, the central WNP, the coastal region of mainland China, and east of Japan (Fig. 10a). Clearly, RegCM4_LICOM underestimated the contributions from TC-induced rainfall (Fig. 10b), with an SCC of 0.40. However, WRF4_LICOM reasonably captured the contributions from TC-induced rainfall over the northern South China Sea, the coastal region of mainland China, and east of Taiwan Island, but underestimated these contributions over the central WNP and east of Japan (Fig. 10c), with a higher SCC of 0.52.
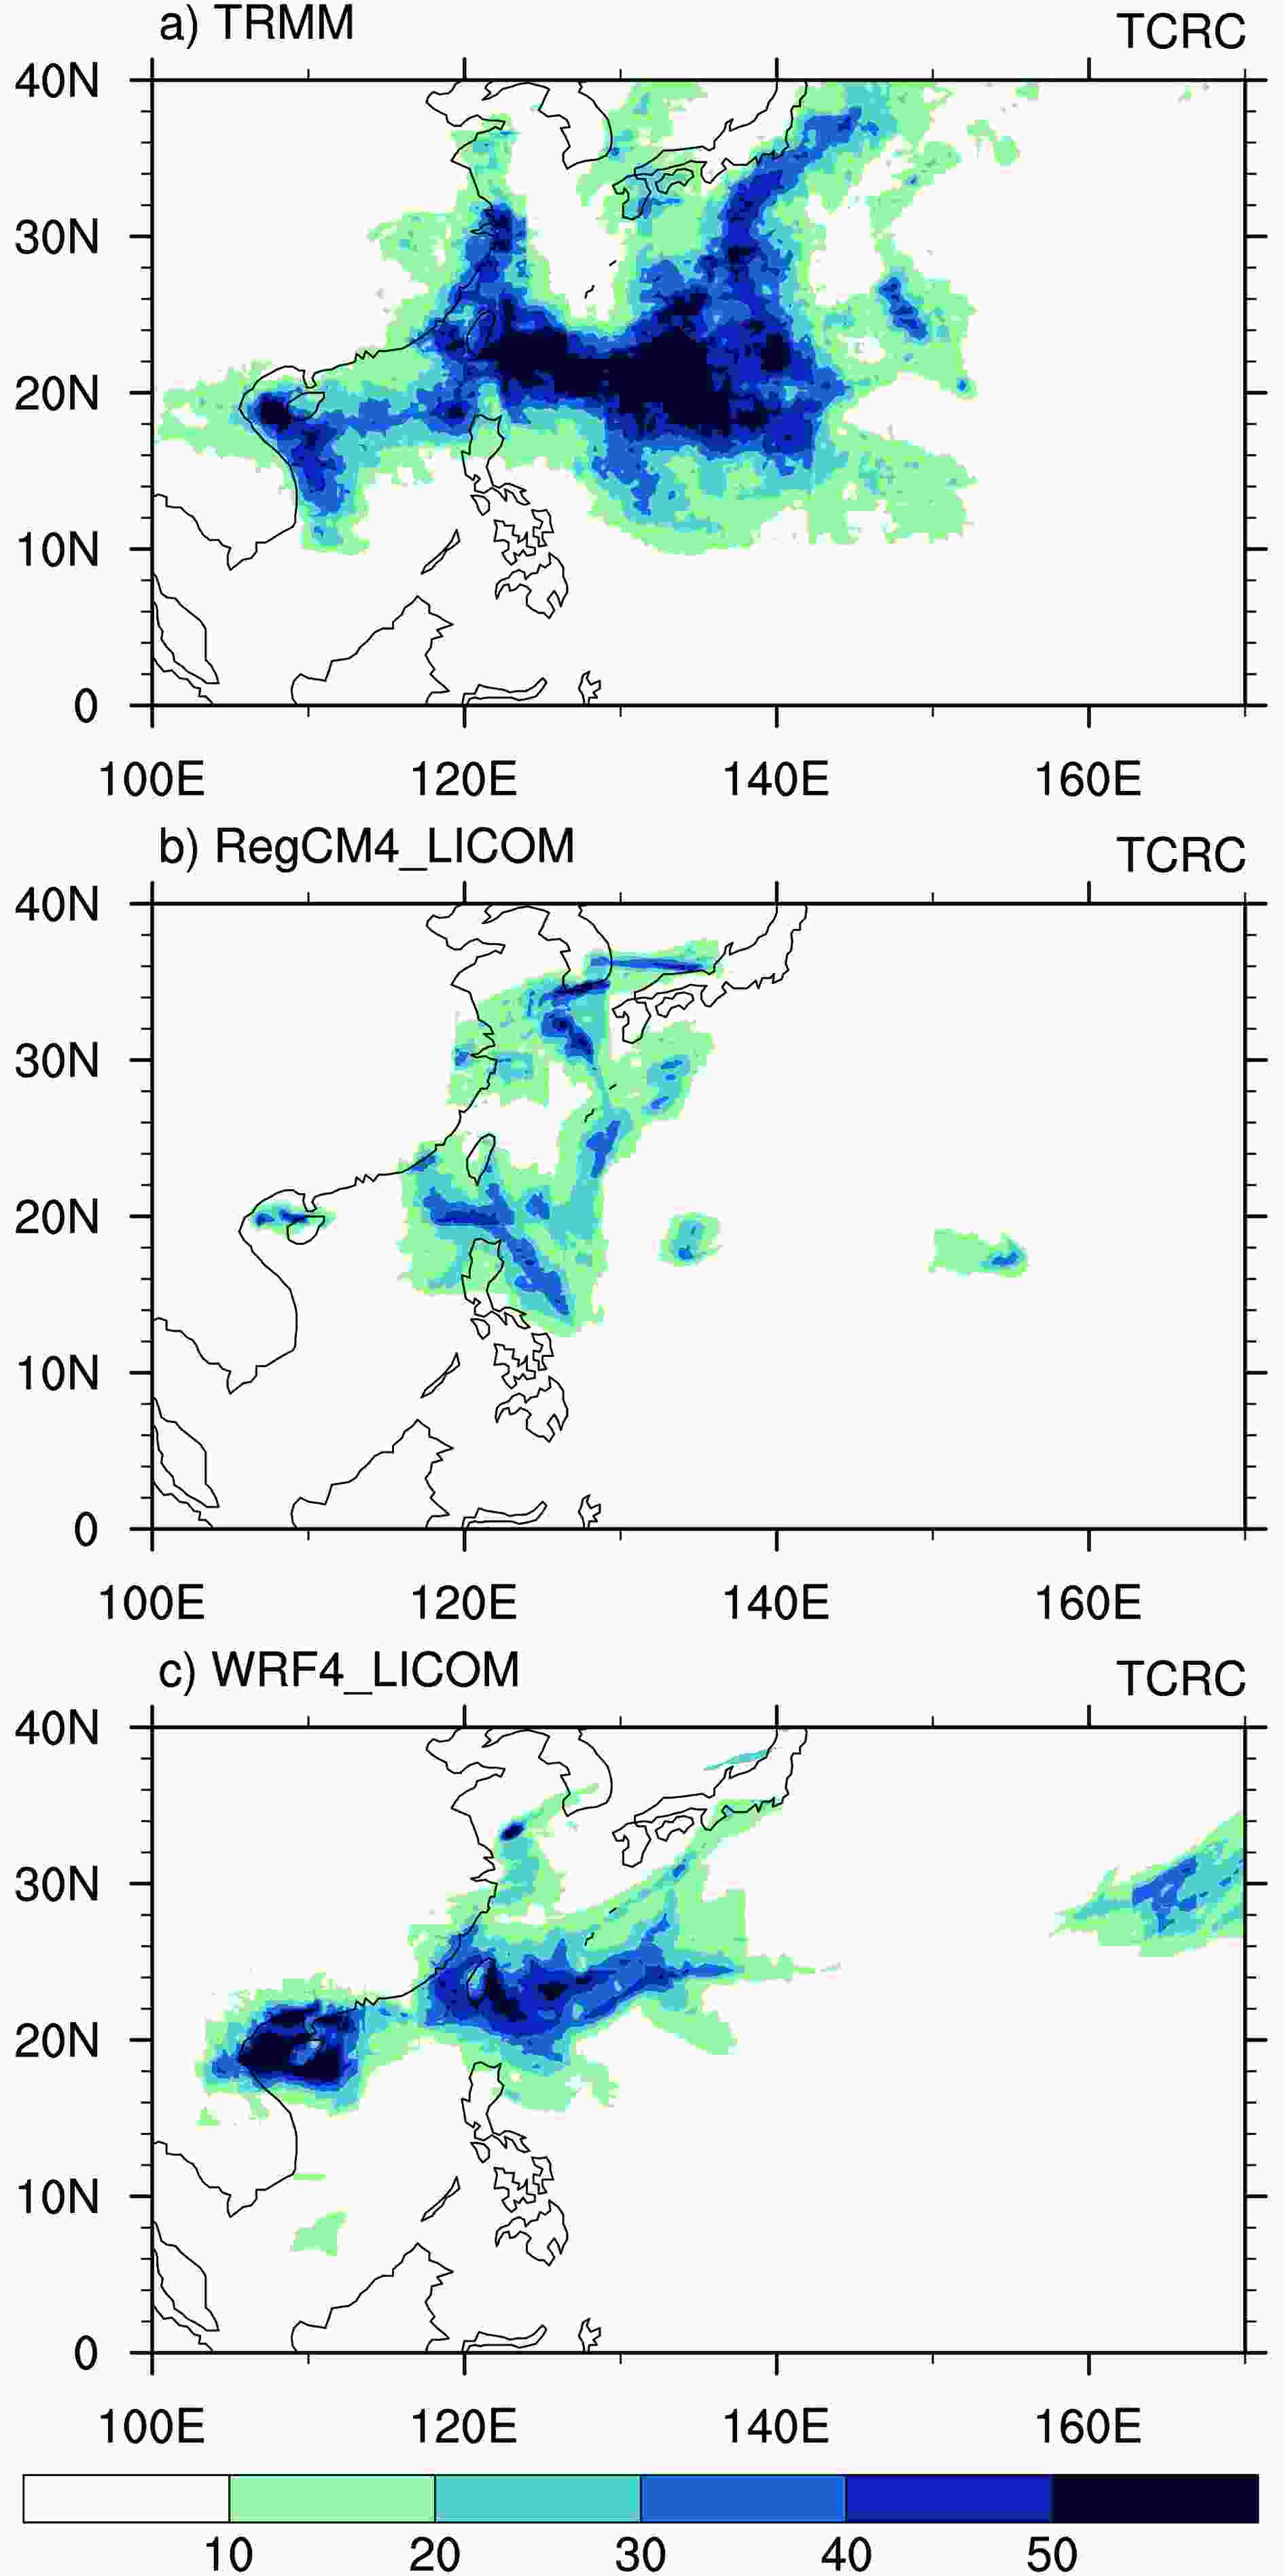 Figure10. Spatial distributions of the percentage contributions (%) from the rainfall induced by TCs to the total rainfall during May to October of 2005 derived from (a) TRMM, (b) RegCM4_LICOM, and (c) WRF4_LICOM. The rainfall induced by a TC is defined as the rainfall within the 5° × 5° grid box around the TC center.
2
3.5. Diurnal cycle of rainfall
The diurnal cycle of rainfall is a good test bed for weather and climate models (Dai and Trenberth, 2004). The TRMM3B42 data were used to assess the models’ performances in the simulation of diurnal cycle of rainfall. Previous studies have indicated that the diurnal cycle of rainfall from TRMM data is comparable to those seen in rain gauge data over East China (Zhou et al., 2008) and South Korea (Koo et al., 2009). The regionally coupled simulations with 15-km resolution were averaged onto 0.25° grids of TRMM3B42 data. Figure 11 shows the local solar time (LST) of the maximum in the composite diurnal cycle of rainfall amount, frequency, and intensity derived from the observation and regionally coupled simulations. In the observation, the land area is dominated by an afternoon peak in the rainfall amount, except for the regions between the Yangtze and Yellow rivers (Borneo Island), which also see an early morning peak (nocturnal peak) in the rainfall amount (Fig. 11a). An early morning peak dominates over the monsoon trough, while the ocean area controlled by the WNPSH shows both an early morning peak and an afternoon peak in the rainfall amount (Fig. 11a). The observed features over the land area were partly reproduced in both models, while both models tended to produce a premature early morning peak in the rainfall amount over the ocean area (Figs. 11d and g). Compared to RegCM4_LICOM, WRF4_LICOM exhibited better performance, especially over the land area, as evidenced by a higher SCC (Fig. 12a). The weakness of RegCM4_LICOM was an earlier peak time of approximately three hours for the afternoon rainfall amount over the land area. Figure11. Spatial distributions of the local solar time of the maximum (LST) in the composite diurnal cycle of the rainfall amount (left panel), frequency (middle panel) and intensity (right panel) during June to August of 2005 derived from (a, b, c) TRMM, (d, e, f) RegCM4_LICOM, and (g, h, i) WRF4_LICOM.
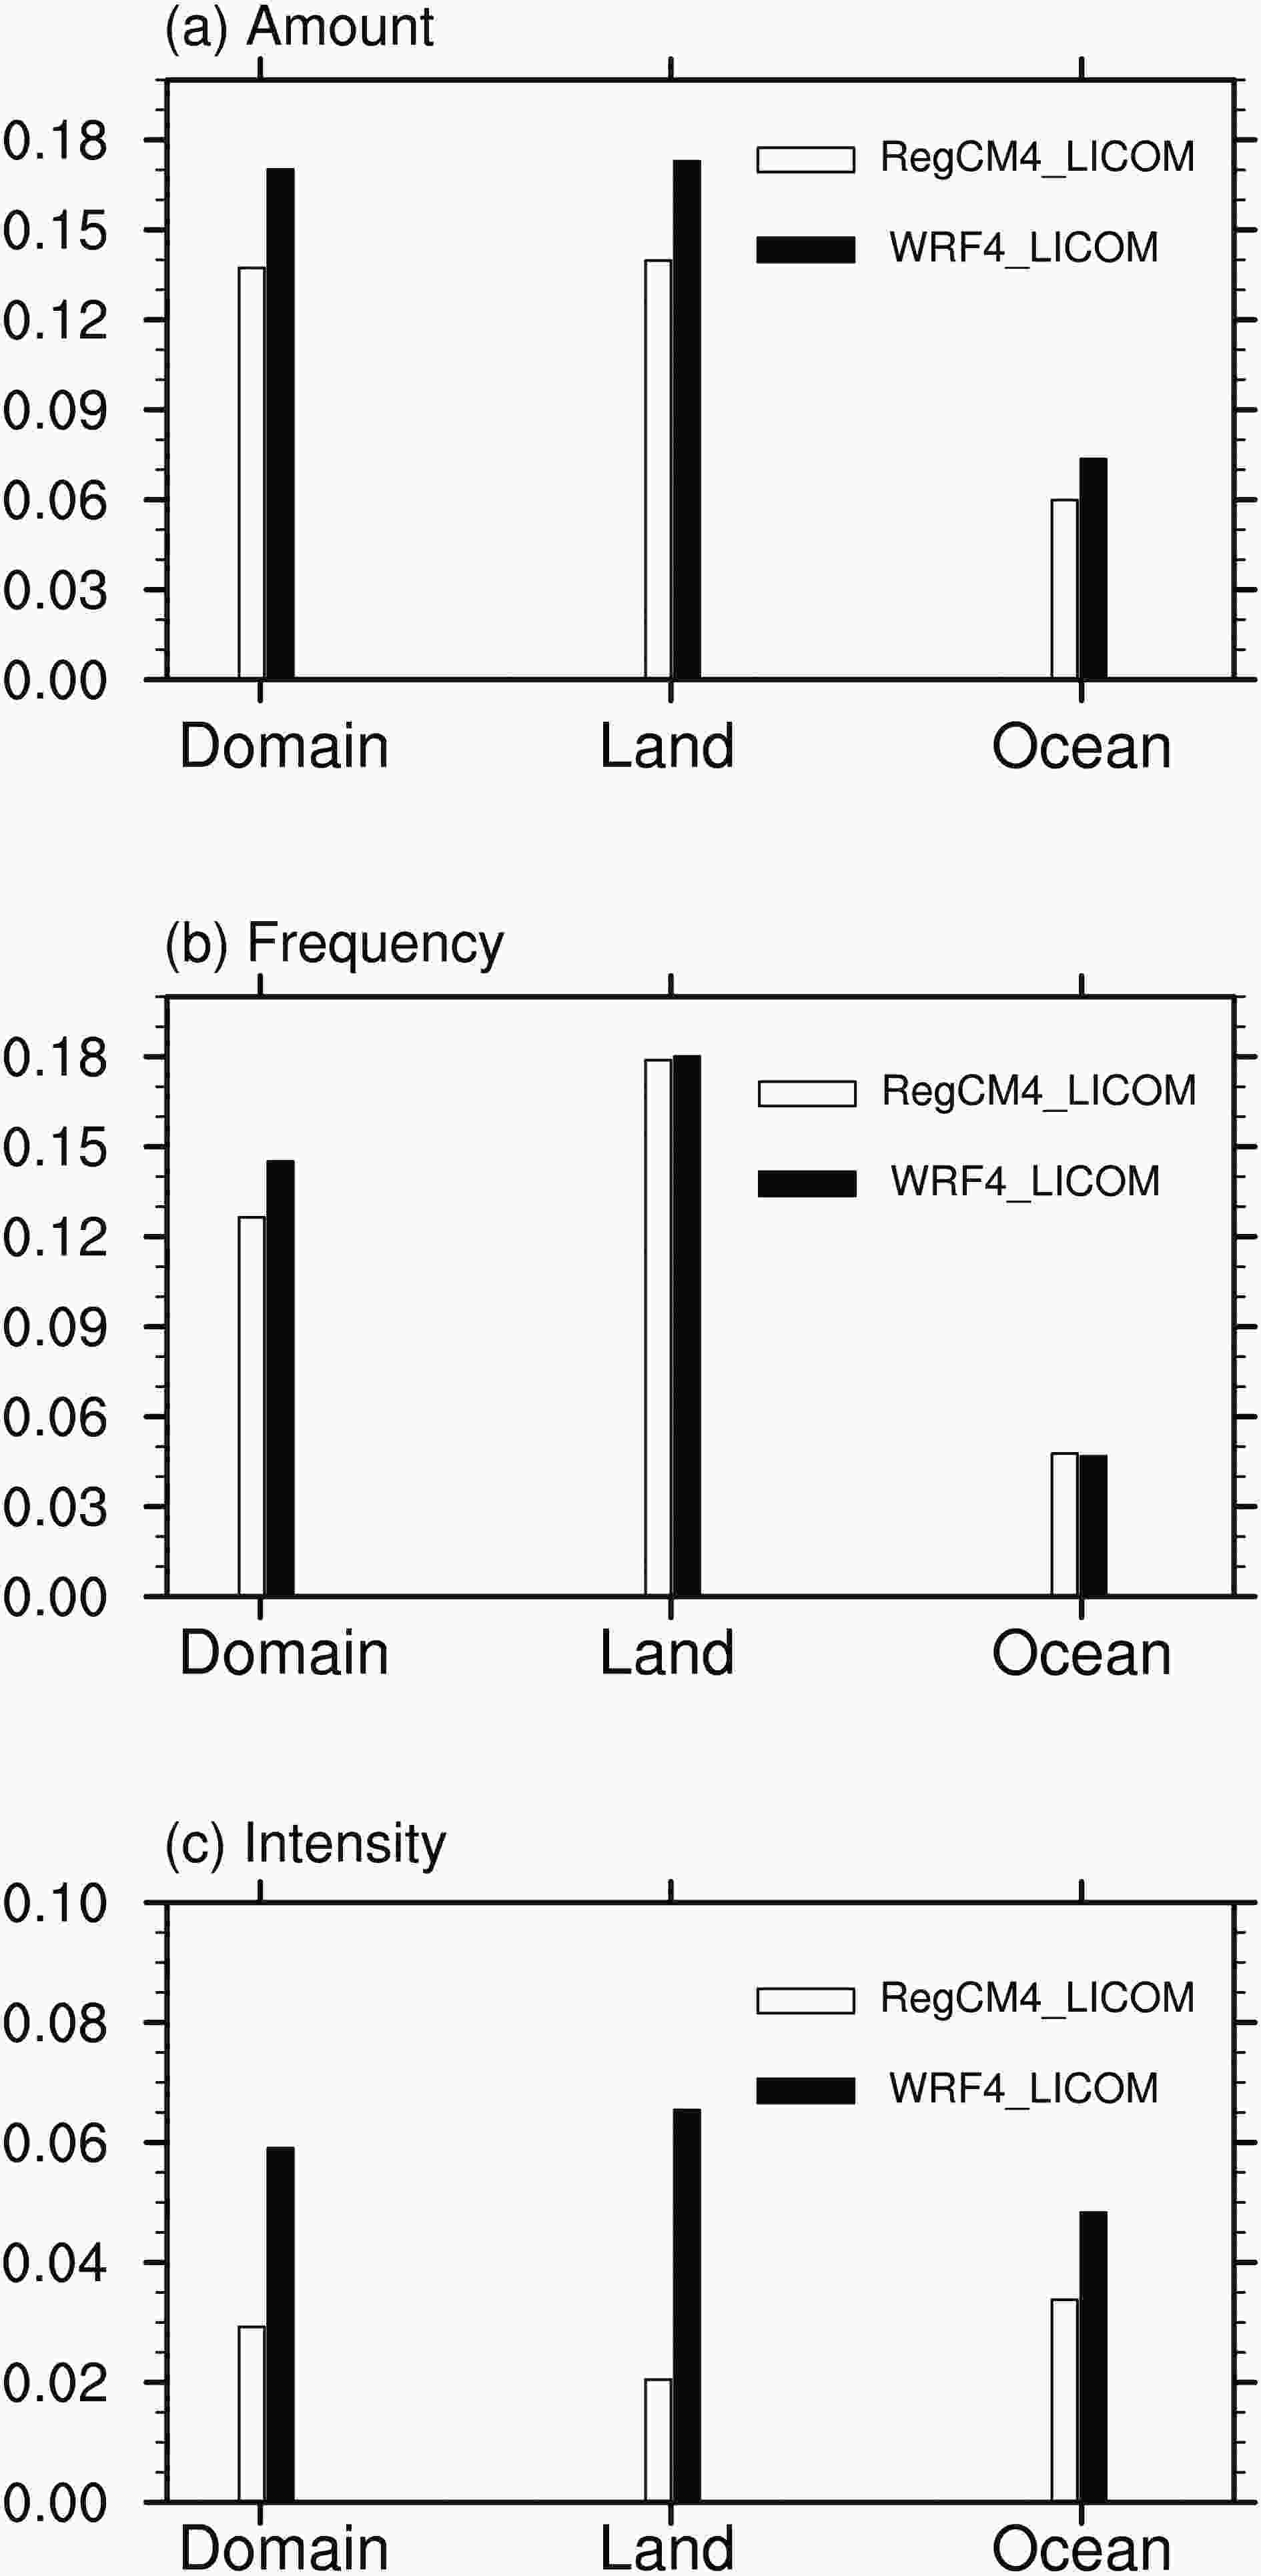 Figure12. Spatial pattern correlation coefficients of the peak time of the 2005 JJA composite diurnal cycle of the (a) rainfall amount, (b) rainfall frequency, and (c) rainfall intensity between regionally coupled simulations and the observations over the WNP (5°S–44°N, 105°–165°E) and the land/oceanic area of the WNP.
An afternoon peak in rainfall frequency dominates over the WNP, with an early morning peak over some oceanic grids (Fig. 11b). The common bias of both models was a dominant nocturnal–early morning peak in rainfall frequency overall in the ocean area. Compared to WRF4_LICOM, the peak time of the rainfall frequency simulated by RegCM4_LICOM over the land area was three hours earlier than that in the observation. The performance of WRF4_LICOM was slightly better than that of RegCM4_LICOM (Fig. 12b). Rainfall intensity exhibits late afternoon and early morning peaks over both the land and ocean areas (Fig. 11c). These features were poorly simulated by both models, although the performance of WRF4_LICOM was better, especially over the land area (Fig. 12c).
But why does WRF4_LICOM perform better in simulating the diurnal cycle of rainfall over land? Table 3 lists the observed and simulated stratiform percentages averaged over the land and oceanic grids of the region (5°S–40°N, 105°–165°E). In the observation, the averaged stratiform percentages are approximately 50% over both land and oceanic grids of the WNP. Both models underestimated the observed stratiform percentage, which is a common bias of convection-parameterized climate models (Yuan, 2013). Both models showed comparable stratiform percentages over the oceanic grids, but RegCM4_LICOM produced higher percentages of convective rainfall than WRF4_LICOM over the land grids of the WNP, which may favor earlier peaks in the rainfall amount and intensity.
| Averaged over (5°S–40°N, 105°–165°E) | Land | Ocean | |
| TRMM3A12 | 49.9% | 53.0% | 48.9% |
| RegCM4_LICOM | 14.4% | 11.1% | 16.7% |
| WRF4_LICOM | 16.3% | 18.9% | 16.4% |
Table3. Observed and simulated stratiform percentages of the JJA mean precipitation averaged over the region (5°S–40°N, 100°–165°E) and the corresponding percentages averaged over land and oceanic grids of the region.
4.1. Summary
To upgrade the regional coupled model FROALS, in this study, the community RCM WRF4 was coupled with a regional high-resolution version of LICOM. The horizontal resolution of WRF4 was set to 15 km, while the horizontal resolution of the oceanic component was 0.1°. The performance of the regional coupled model WRF4_LICOM was compared to that of RegCM4_LICOM, with a focus on the 2005 WNP summer monsoon rainfall. The two regional coupled models shared the same regional ocean model component, horizontal resolution, cumulus parameterization scheme, and experimental design. The major conclusions are summarized below.The upgraded regional ocean–atmosphere coupled model with either RegCM4 or WRF4 as the regional atmospheric model component exhibited improved performance over the WNP compared to that with RegCM3_LICOM. The evident cold biases of the simulated SST over the WNP, along with the dry biases of summer rainfall over the monsoon trough, were significantly reduced in the updated version.
Intercomparison of regional coupled simulations with different regional atmospheric model components showed different skill levels for different climate variables, and no single model was found to systematically outperform the other. RegCM4_LICOM exhibited smaller biases in its simulation of the averaged SST and rainfall over the WNP in terms of RMSE. The spatial distribution of TCs was also partly reproduced in RegCM4_LICOM. However, RegCM4_LICOM tended to underestimate the rainfall over major rainy centers and TC intensity. WRF4_LICOM better captured TC intensity, the percentage contributions of TC-induced rainfall to the total rainfall, the diurnal cycle of rainfall and stratiform percentages, especially over the land area. However, the genesis locations of TCs were shifted too far westwards in WRF4_LICOM. The common biases of both models were also identified. Both models had large dry biases over southern China, underestimated TC intensity, and showed a premature morning peak of rainfall over the ocean area.
The different performances of the two models for simulated rainfall can be partly ascribed to the opposite biases in the simulated WNPSH. The weakened and eastward-shifted (enhanced and westward-shifted) WNPSH in RegCM4_LICOM (WRF4_LICOM) led to dry biases over southern China and dry biases (wet biases) over the mei-yu front region. Further analysis indicated that the overestimated (underestimated) diabatic heating between 400 and 500 hPa over the region around the Philippines in WRF4_LICOM (RegCM4_LICOM) may have induced the stronger (weaker) WNPSH. The enhanced diabatic heating in WRF4_LICOM was mainly due to the stronger condensation heating, while the weakened diabatic heating in RegCM4_LICOM may be more due to the reduced longwave radiative warming associated with fewer high clouds.
The overall reasonable performances of RegCM4_LICOM and WRF4_LICOM indicate that the models can be used for a wide range of applications, i.e., dynamical downscaling of simulations and projections generated by the FGOALS, which will be reported in future studies.
2
4.2. Concluding remarks
In this study, it was challenging to identify which formulation differences listed in Table 1 were the root reasons to explain the different performances between RegCM4-LICOM and WRF4-LICOM over the WNP, since the two models only share the same cumulus scheme. In addition to the model physics, it is noted that the vertical resolution of WRF4 (35L) is higher than that of RegCM4 (23L), which may explain the higher TC intensity in WRF4-LICOM (Ma et al., 2012). The model intercomparison of the simulated mean rainfall biases (section 3.3) implies that the cloud microphysics–radiation interactions may play an essential role. It should be noted that we only compare the performances of RegCM4_LICOM and WRF4_LICOM with a typical physics configuration, which may not be the best configuration for each model over the target region. Currently, more than 100 combinations of different model physics can be configured in both RegCM4 and WRF4. A comprehensive comparison of RegCM4-LICOM and WRF4-LICOM with multiple physics configurations, which requires very large computational resources, is under consideration.In this study, we compared the seasonal biases over the WNP region simulated by two regional ocean–atmosphere coupled models by conducting continuous 13-month simulations with the same initial condition and lateral boundary forcing. One member was used. This experimental design was similar to that of phase one of the Regional Model Intercomparison Project for Asia (Fu et al., 2005), which conducted continuous 18-month simulations. Some studies have argued that the internal variability of the RCMs does not significantly affect the domain-wide average but influences the day-to-day model variability (e.g., Giorgi and Bi, 2000). Nevertheless, the internal variability of regional ocean–atmosphere coupled models and the possible impacts on seasonal biases deserves further investigation.
IAP/CAS intends to develop a next-generation high-resolution RESM with WRF4 as its regional atmospheric model. Coupling WRF4 with LIOCM is an important step towards the development of CAS RESM. Intercomparison of RegCM4-LICOM and WRF4-LICOM with the same cumulus scheme over the WNP region highlights the importance of cloud microphysics–radiation interactions. This implies that the tunable parameters in the cloud microphysics scheme should be given great attention for future tuning of CAS RESM over the East Asia–WNP region.
Acknowledgements. The comments from the reviewers, which significantly improved the manuscript, are greatly appreciated. All the observational datasets used in this study are listed in the references, and the model results used have been archived in figshare (https://doi.org/10.6084/m9.figshare.9917459.v1). This work was jointly supported by the National Key Research and Development Program of China (Grant No. 2018YFA0606003), the National Natural Science Foundation of China (Grant Nos. 41875132 and 41575105), and the Jiangsu Collaborative Innovation Center for Climate Change.
