HTML
--> --> -->Previous studies have pointed out that DCSs affect the atmospheric composition budget of the UTLS via two different steps (Sherwood, 2000; Dessler, 2002; Gettelman et al., 2002; Park et al., 2009). DCSs rapidly lift the air parcel into the main detrainment layer, and then the detrained air will be slowly dehydrated by atmospheric circulation and diabatic heating until it passes through the coldest point of the tropopause (Mote et al., 1996; Sherwood and Dessler, 2000). The freeze?dry function is weaker at higher detrainment heights but its effect on the atmospheric component of the stratosphere is stronger (Brewer, 1949; Jensen et al., 2001; Schiller et al., 2009). The position of the main detrainment height determines the height at which the substances in the lower troposphere and boundary layer can be rapidly transported by the DCSs. However, different DCSs have different outflow heights depending on the local ambient relative humidity, the vertical stability and depth of the thunderstorm cloud. Therefore, investigation of detrainment height location is very important.
Many studies have investigated the characteristics of DCSs (Zipser et al., 2006; Houze et al., 2007; Devasthale and Fueglistaler, 2010; Romatschke et al., 2010; Luo et al., 2011; Xu, 2013; Qie et al., 2014; Takahashi and Luo, 2014; Shi et al., 2017). However, these studies largely focused on the features of the core of DCSs, with their main detrainment height receiving little attention. The anvil, as a proxy of the main detrainment height, is located at the top of cumulus clouds around the level of neutral buoyancy (Stommel, 1947; Morton et al., 1956; Squires and Turner, 1962; Raymond and Blyth, 1986; de Rooy and Siebesma, 2008, 2010; Heus and Jonker, 2008). The Tibetan Plateau and its southern slope are important pathways for stratosphere?troposphere exchange (Zhou et al., 1995; Bannister et al., 2004; Gettelman et al., 2004; Li et al., 2005; Fu et al., 2006; Randel and Park, 2006; Park et al., 2007; Tian et al., 2008; Randel et al., 2010; Chen et al., 2012; Long et al., 2016; Sun et al., 2017). Thus, further investigation of the main detrainment height over the Tibetan Plateau and its southern slope will help us to estimate the contribution of DCSs to global stratosphere?troposphere exchange and quantify the atmospheric composition budget of the UTLS.
In this study, we used satellite data to investigate the main detrainment height over the Tibetan Plateau and its southern slope (Fig. 1). The paper is structured as follows: Section 2 introduces the A-train constellations, including the CloudSat Cloud Profiling Radar (CPR) and Aura Microwave Limb Sounder (MLS), the methods used to characterize the deep convective core (DCC) and anvil, and explains how we assessed the ice water content (IWC) of the background field of deep convection. Section 3 derives the main detrainment height over the Tibetan Plateau and its southern slope and analyzes the spatial and temporal features of the detrainment level. Section 4 compares these features with the change in the ambient field of the IWC and the ice water path (IWP) when the DCSs detrain air into the UTLS. Finally, our conclusions are presented in section 5.
 Figure1. Location of the Tibetan Plateau and its southern slope (25°?40°N, 73°?105°E). The area outlined by the black solid line is the Tibetan Plateau and the region to the south of 35°N with elevation < 3000 m is the southern slope. The topographic base map is from http://maps.stamen.com/.
2.1. Datasets
We used CloudSat and MLS data for June?August 2006?16, except for the year 2011 when a battery anomaly caused the CloudSat satellite to stop collecting data and to lose formation with the A-train. The datasets include 2B-GEOPROF_R04 (http://cloudsat.atmos.colostate.edu/data) and MLS-L2GP-IWC_v04 (https://daac.gsfc.nasa.gov/datasets/ML2IWC_V004). CloudSat, which forms part of the Afternoon Constellation or A-train of Earth-observing satellites, carries the CPR instrument, which has a high sensitivity toward smaller cloud droplets (Stephens et al., 2008). According to the CloudSat data, an accurate detrainment height and the anvil of DCSs can be obtained and detected. The CPR instrument can therefore directly observe the detrained anvil to obtain the main detrainment height. The Aura MLS, which follows about 15 minutes behind CloudSat, can detect changes in the atmospheric components when the detrainment caused by a DCS is recognized by the CPR (Livesey et al., 2006). Such dual observations are beneficial in obtaining a comprehensive view of the outflow process.The A-train includes several Earth-observing satellites that follow the close orbital track within minutes of each other. They provide comprehensive information about a wide variety of climate parameters (Savtchenko et al., 2008; L'Ecuyer and Jiang, 2011). CloudSat launched on 28 April 2006. It successfully joined the A-train alignment on 1 June 2006 and exited the A-train on 26 February 2018. The CPR carried onboard the CloudSat platform was designed to have a strong cloud detection sensitivity for precipitation and cloud particles, with an along-track resolution of 1.9 km and a vertical resolution of 240 m (Stephens et al., 2002, 2008). The Aura satellite was successfully launched on 25 July 2004 and follows about 15 minutes behind CloudSat in the A-train satellite formation. The MLS instrument onboard the Aura satellite uses microwave emissions to measure trace amounts of gases, volcanic eruptions, cloud ice, temperature and geopotential height in the upper troposphere and stratosphere (Waters et al., 2006; Wu et al., 2008).
2
2.2. Methods
The radar echo from the backscattering of cloud and rain droplets can be used to recognize DCSs, including the DCC, stratiform precipitation and the anvil. The CloudSat CPR has been used to study deep convection (Chung et al., 2008; Iwasaki et al., 2010; Luo et al., 2011), overshooting (Luo et al., 2008; Bedka et al., 2012; Iwasaki et al., 2012; Takahashi and Luo, 2012), detrained anvils (Takahashi and Luo, 2012) and aerological cirrus clouds (Sassen et al., 2009). We detected DCSs over the Tibetan Plateau and its southern slope using the following methods.We used a cloud mask of > 30 to obtain high-quality data (Mace, 2007). Radar echo data were used to detect the DCC and the cloud-top height of the DCC (DCC_CTH) required to ensure that the DCS could lift an air parcel to > 14 km, the height at which the UTLS is affected (Highwood and Hoskins, 1998; Folkins et al., 1999). The distance between the cloud base and the surface was < 3 km and the maximum echo value was > 10 dBZ to exclude clouds from non-DCSs. We looked for the detrained anvil near the DCC. The anvil should be a 4?5 km thick heterogeneous layer (Cetrone and Houze, 2009; Yuan and Houze, 2010; Yuan et al., 2011) and the cloud base height of the anvil (anvil_CBH) should be > 9 km to preclude radar echoes from stratiform precipitation. The height of maximum echo inside the anvil is the height of the maximum mass detrainment (anvil_maxMass), which means that the largest amount of air is detrained in this layer (Takahashi and Luo, 2012). We obtained data for 1241 DCSs over a 10-year period. A total of 669 DCSs showed clear detrainment, which requires a horizontal scale of the anvil > 20 km (see Fig. 2).
 Figure2. An example of a DCS that generated on 21 August 2008. The gray shadow represents the topography, and the red lettering annotates the cloud top of the DCC and the anvil maximum mass detrainment.
The Aura satellite follows CloudSat on an adjacent track. The Aura MLS measures the change in the ambient IWC after the CloudSat CPR has probed the DCSs. The IWC detrained by the DCSs has a short life cycle of about 1?2 days (Luo and Rossow, 2004). The distribution of the IWC is more directly affected by the DCS than other gaseous pollutants (e.g., CO, HCN, CH3Cl and chlorofluorocarbons) with a longer life cycle.
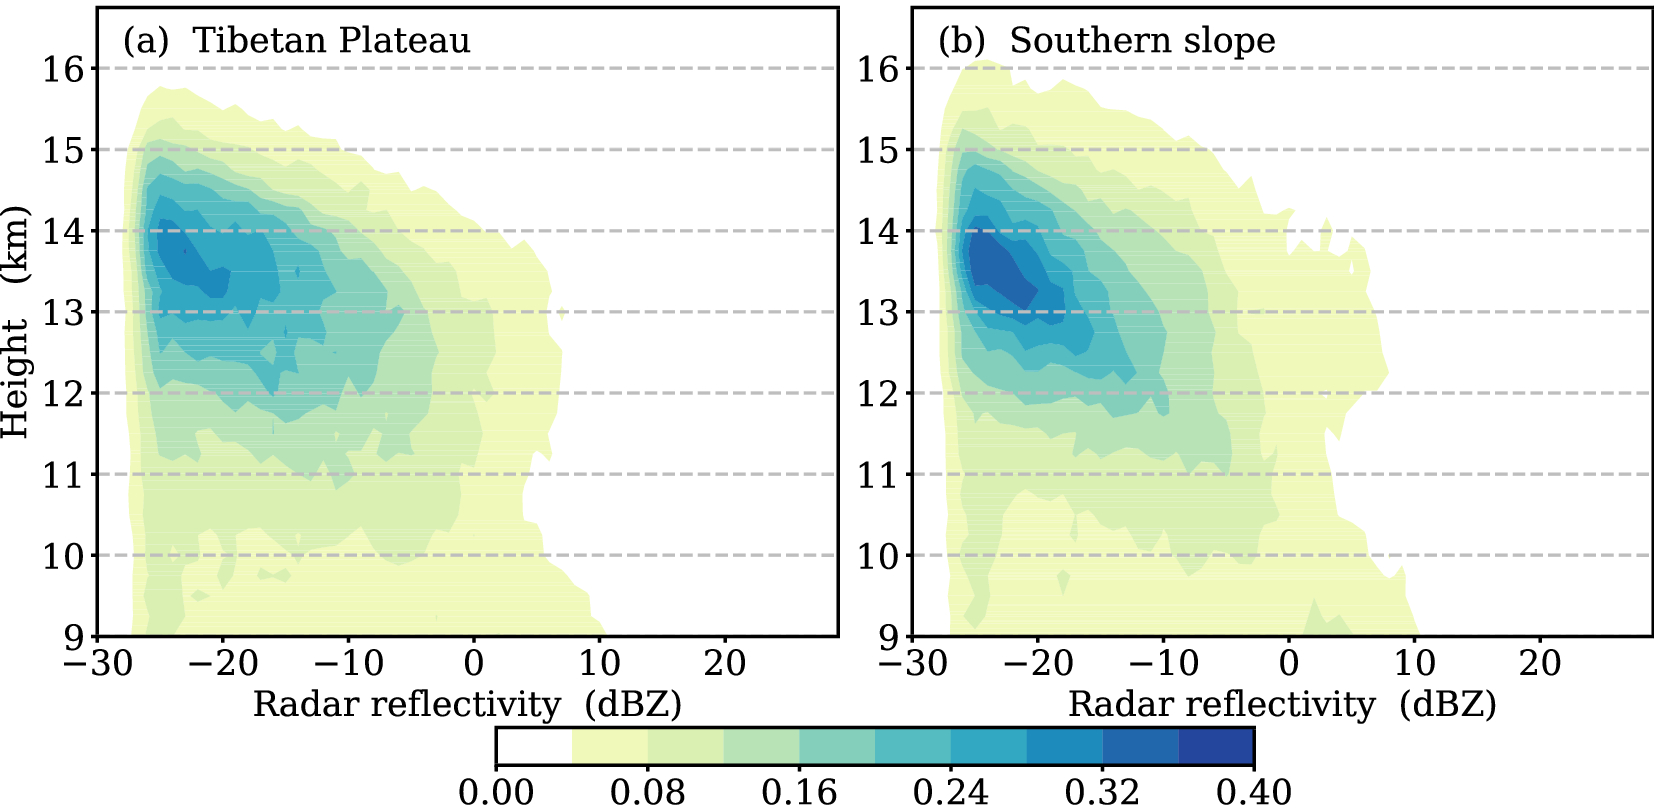 Figure3. Contour map of the frequency distribution of the reflectivity with the anvil height over (a) the Tibetan Plateau and (b) its southern slope. The reflectivity is from CloudSat CPR data. The contours show the bin counts divided by the total counts. Bin dimensions: 1 dBZ × 250 m.
Figure 3 shows that the main detrainment height over the Tibetan Plateau region and its southern slope is higher than that over tropical and global deep convection. Folkins and Martin (2005) concluded 12 km to be the main height of deep convective outflow in the tropics, according to a one-dimensional model of the tropics constrained by observed mean temperature and water vapor profiles. Takahashi and Luo (2012) used the CloudSat datasets to calculate the global mean outflow height as 10.7 km; the pixel samples were limited by an echo top height of 10 dBZ > 10 km. The higher outflow height over the Tibetan Plateau and its southern slope favors more water vapor and aerosols detrained by deep convection to be transported into the stratosphere. As a result, less mass is lost during upward movement.
The detrainment caused by deep convection over the Tibetan Plateau region and its southern slope is different as a result of the complex topography and atmospheric circulation. Figure 4 shows the outflow height/horizontal range of deep convections over the Tibetan Plateau region. It is apparent that the maximum mass outflow height/outflow horizontal range of DCSs is higher/larger over the central and eastern Tibetan Plateau, the west of the southern slope, and the southeastern edge of the Tibetan Plateau than that over the northwestern Tibetan Plateau. The proportion of DCSs with outflow height between 12.5 and 13.5 km is 53.66%, while below 11.5 km it is only 2.84%. About 72.35% of the DCSs have outflow horizontal ranges < 100 km. The mean outflow height over the Tibetan Plateau and its southern slope is 12.9 and 13.3 km, respectively, i.e., the mean outflow height over the southern slope is higher than that over the Tibetan Plateau. The thermodynamic function of the surface determines the population distribution of DCSs; the air parcels of the planetary boundary layer over the southern slope have a higher equivalent potential temperature than over the Tibetan Plateau, thus inducing deeper and more intense convective systems to be generated at the southern slope (Luo et al., 2011; Xu, 2013; Qie et al., 2014; Wu et al., 2016). In addition, the nocturnal moist low-level jet compensating the instability is also a crucial factor in the triggering of deep convection over the southern slope (Houze et al., 2007; Romatschke et al., 2010). It is possible that the intense deep convection over the southern slope produces a higher detrainment height than that over the Tibetan Plateau. Wu et al. (2004) determined that the intense surface radiation heating over the Tibetan Plateau results in low pressure at low levels and high pressure at middle and upper levels, which induces updrafts in the east of the Tibetan Plateau and downdrafts in the west. This phenomenon also explains why deeper and wider convective systems occur over the central and eastern Tibetan Plateau.
 Figure4. Top: Spatial distribution of outflow horizontal range and maximum mass outflow height of DCSs. Bottom: Frequency of different outflow heights/horizontal ranges of DCSs. The depth of the dot color and the size of the dot represent how high the maximum mass outflow height is and how wide the outflow horizontal range is, respectively.
The CloudSat CPR satellite passes the equator at about 1330 LST (daytime; LST = UTC+6) and 0130 LST (nighttime). Figure 5 shows the distribution of outflow height and outflow horizontal range of DCSs during daytime and at nighttime. It is apparent that the DCSs with outflow heights of < 13 km and outflow horizontal ranges of > 100 km are more frequent at nighttime than during daytime, i.e., nocturnal deep convections detrain at relatively low heights but influence a wider area. According to traditional parcel theory, during the daytime, solar radiation heats the surface and produces more convective available potential energy and a higher level of neutral buoyancy, which favors convective development in the vertical direction (Mapes, 1993; Kingsmill and Houze, 1999). At nighttime, however, the lower temperatures and energy make it difficult for convection to reach a higher outflow height, meaning the cloud is more likely to detrain in a horizontal direction.
 Figure5. Distribution of outflow height and outflow horizontal range of DCSs in the daytime (orange dots, 1200?1330 LST) and at nighttime (blue dots, 0000?0130 LST). The histograms show the probability density function of the dots.
Besides the detection of radar echoes, a sharp increase in ambient IWC could directly prove the detrainment height of deep convection. Figure 6 shows the mean profiles of the cloud IWC over the Tibetan Plateau and its southern slope during the DCS events and non-DCS events and the differences between the profiles. An extreme value is located at 178 hPa (height of about 13 km), which coincides with the main detrainment height of DCSs directed by the radar echoes. The profiles of radar echoes and atmospheric components highlight the detrainment height of deep convection at about 178 hPa or 13 km. In the DCS scenario, the mean profile of IWC over the southern slope is higher than that over the Tibetan Plateau, since the deeper and wider convection is located at the southern slope, as mentioned above. In another insight, the magnitude of the increase in IWC over the southern slope is less than that over the Tibetan Plateau (Fig. 6b). The results of the significance testing also show that the deep convection over the Tibetan Plateau has a more obvious hydrating effect for the lower stratosphere. Over the Tibetan Plateau, the differences between profiles during DCS events and during non-DCS events from 215 to 83 hPa are significant at the 95% confidence level. On the southern slope, the differences lower than 100 hPa are significant.
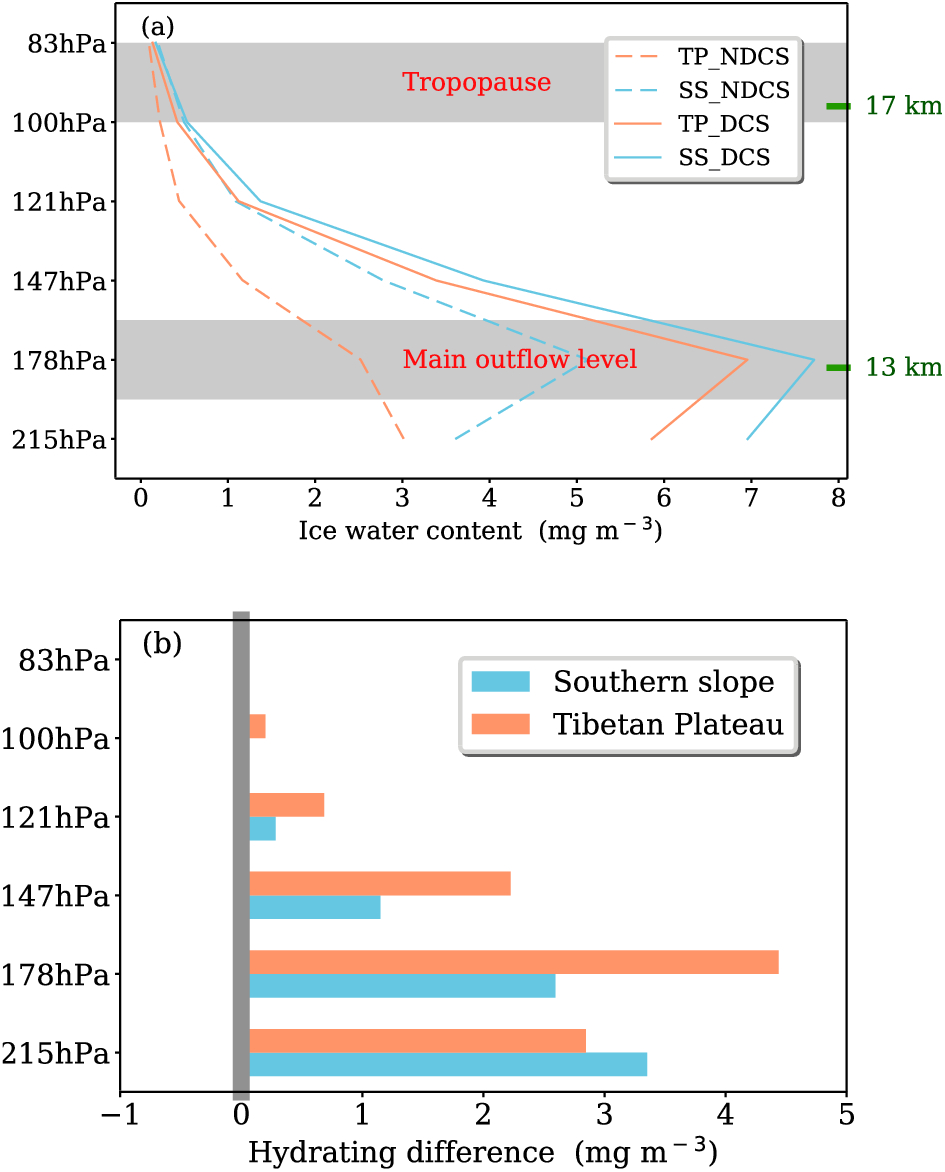 Figure6. (a) Mean profiles of cloud IWC over the Tibetan Plateau and its southern slope during DCS events and non-DCS events. Dashed lines and solid lines represent non-DCS and DCS events, respectively. (b) Differences between profiles during DCS events and non-DCS events.
Deep convection has an important influence for the horizontal distribution of water vapor in the upper troposphere and lower stratosphere (Mullendore et al., 2005). Figures 7 and 8 show the distributions of the IWC at 178 hPa and 121 hPa over the Tibetan Plateau region, respectively, during the DCS events and non-DCS events. The area with more IWC coincides with the distribution of DCSs shown in Fig. 4, which means that the increase in IWC is closely related to the detrainment of deep convection at near real-time. The differences in IWC between the DCS and non-DCS events over the central and eastern areas of the Tibetan Plateau, the western area of the southern slope, and the southeastern edge of the Tibetan Plateau are significant at the 95% confidence level. The clearest evidence of the main detrainment height is seen at 178 hPa. It is noteworthy that the non-DCS scenario does not mean that the atmospheric environment is one of a clear sky. Cirrus cloud is included in the non-DCS scenario. Therefore, the IWC in the upper troposphere is higher than that in the clear-sky condition (Fig. 7a).
 Figure7. Distributions of IWC at 178 hPa during (a) non-DCS events and (b) DCS events, and (c) the differences between (b) and (a).
 Figure8. As in Fig. 7 but at 121 hPa.
These horizontal and vertical results prove that the impact of deep convection for IWC is significant at near real-time. Nevertheless, since the frequency of deep convection is low, the effect of the long periodicity of deep convection detrainment remains uncertain. We estimate the contribution of deep convection to the summer mean IWP field by comparing the difference in mean IWP between all samples from the MLS detector and selected samples after eliminating DCS events. Figure 9 shows the distribution of the IWP (column total of IWC above 6 km) for all IWP samples (including DCS and non-DCS events) and for non-DCS events in June, July and August. After removing the influence of DCSs, the IWP decreases by ~2.83 g m?2 on average (reduction of 16.8%). In the area where DCSs occur frequently, the maximum reduction can be as much as 23.82 g m?2. Figure 10 shows the latitudinal and meridional mean values of IWP between all samples and non-DCS samples. It is apparent that the maximum differences in the latitudinal and meridional mean values are 5.04 and 6.47 g m?2, respectively. These results for the summer IWP distribution imply that DCSs over the Tibetan Plateau and the southern slope have a remarkable impact on the composition of the atmosphere.
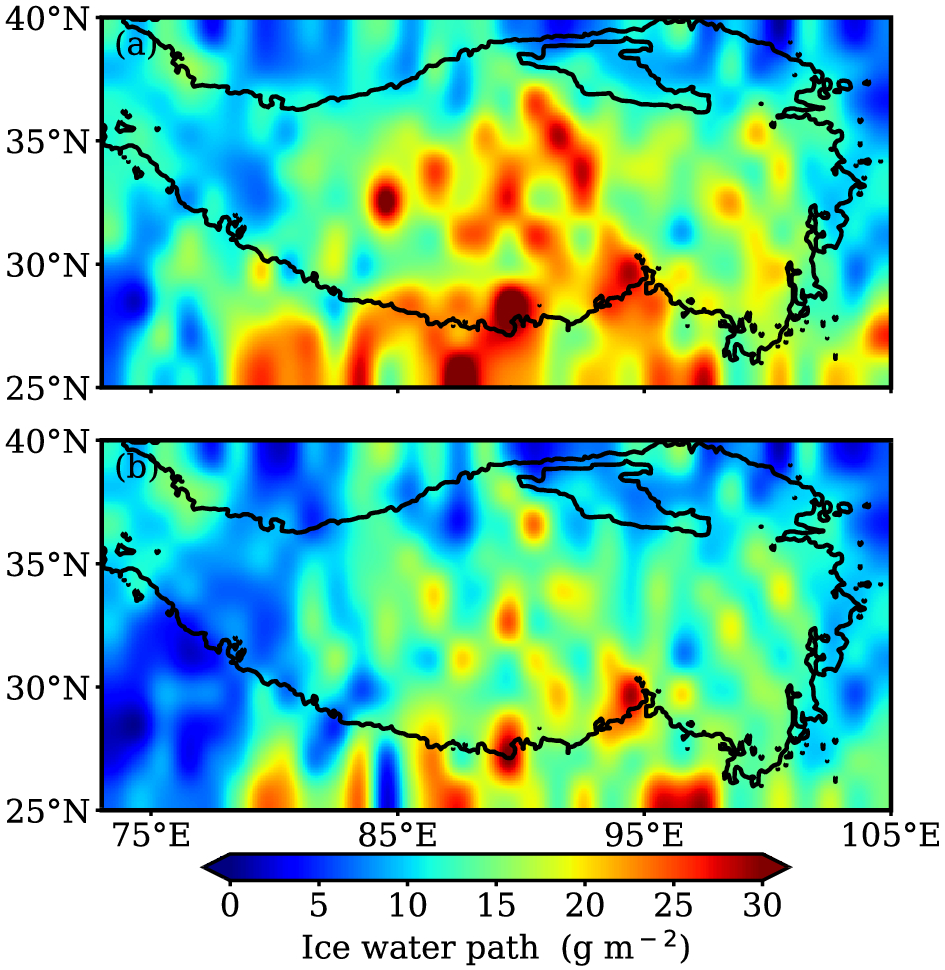 Figure9. Distribution of the column total of IWC (a) during DCS + non-DCS events and (b) during non-DCS events in June, July and August. The column total is calculated above 6 km.
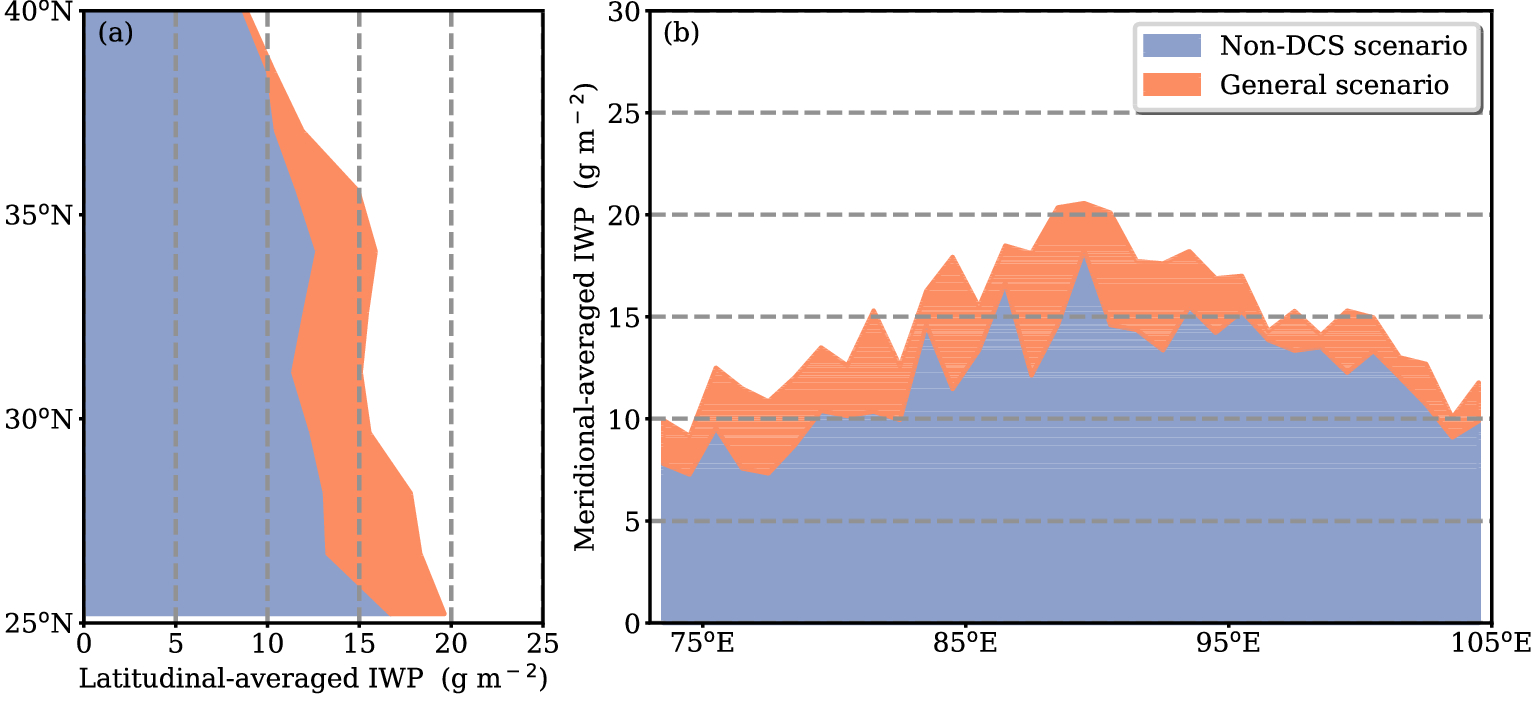 Figure10. Changes in column total IWC (a) with latitude and (b) with longitude during DCS + non-DCS events and during non-DCS events.
In this study, we characterized the main detrainment height of DCSs by mapping radar echoes and the IWC. However, we only investigated the variations in IWC caused by DCSs, since the IWC is more sensitive to the outflow of DCSs than other trace gases in the atmosphere (e.g., water vapor, methane, CO, SO2, C2O2 and HCN). The distributions of these gases in the UTLS are controlled by many factors, such as the anticyclonic circulation over the Tibetan Plateau, the life cycles of the gases, photochemical processes in the UTLS, and the variation in temperature and relative humidity. How DCSs affect these gases needs further investigation.
Another uncertainty problem comes from the CloudSat datasets. CloudSat only detects at two times in a local area each day, and only operated during the daytime overpass after the power outage in 2011. Thus, the absence of integrated diurnal variation and the sample deviation will influence the final results in terms of the main outflow height. In addition, the study area of the southern slope of the Tibetan Plateau has complex topography and atmospheric circulation, and there are possible differences between the DCSs west and east of the southern slope. We only divided the Tibetan Plateau and the southern slope roughly; it would be worthwhile to discuss the DCSs of the southern slope with a more elaborate subregional structure.
Acknowledgments. This study was supported by the National Key Research and Development Program on Monitoring, Early Warning and Prevention of Major Natural Disasters (Grant No. 2018YFC1506006) and the National Natural Science Foundation of China (Project Nos. 41875108 and 41475037). We are grateful for the online availability of the CloudSat and Aura datasets.
