 ,1, 王燕平2, 任海祥2, 王德亮3, 杨兴勇4, 程延喜5, 杜维广2, 盖钧镒,11
 2
3
4
5
Genome-Wide QTL-Allele Dissection of 100-Seed Weight in the Northeast China Soybean Germplasm Population
HAO XiaoShuai1, FU MengMeng1, LIU ZaiDong1, HE JianBo,1, WANG YanPing2, REN HaiXiang2, WANG DeLiang3, YANG XingYong4, CHENG YanXi5, DU WeiGuang2, GAI JunYi,1通讯作者:
责任编辑: 李莉
收稿日期:2019-09-9接受日期:2020-01-2网络出版日期:2020-05-16
| 基金资助: |
Received:2019-09-9Accepted:2020-01-2Online:2020-05-16
作者简介 About authors
郝晓帅,E-mail:15850563928@163.com。

摘要
关键词:
Abstract
Keywords:
PDF (1974KB)元数据多维度评价相关文章导出EndNote|Ris|Bibtex收藏本文
本文引用格式
郝晓帅, 傅蒙蒙, 刘再东, 贺建波, 王燕平, 任海祥, 王德亮, 杨兴勇, 程延喜, 杜维广, 盖钧镒. 东北大豆种质群体百粒重QTL-等位变异的全基因组解析[J]. 中国农业科学, 2020, 53(9): 1717-1729 doi:10.3864/j.issn.0578-1752.2020.09.003
HAO XiaoShuai, FU MengMeng, LIU ZaiDong, HE JianBo, WANG YanPing, REN HaiXiang, WANG DeLiang, YANG XingYong, CHENG YanXi, DU WeiGuang, GAI JunYi.
0 引言
【研究意义】百粒重是大豆产量重要构成因素之一[1,2,3],并受多基因控制,有较高的遗传力[4,5]。全面解析大豆百粒重的遗传机制,并挖掘控制大豆百粒重基因对大豆高产育种具有重要意义。另外,生育期是大豆光周期反应重要生态指标,决定着大豆在不同纬度、地区的种植范围,对产量、品质和适应性都至关重要[6]。东北地域辽阔,大豆资源是美洲大豆的主要种质基础,研究东北大豆百粒重的遗传基础,对世界大豆育种具有重要意义。【前人研究进展】随着科技的发展和大豆公共数据的扩增,越来越多的科研工作者投入到了百粒重QTL(quantitative trait locus)定位和全基因组关联分析研究中[7,8,9,10]。目前,SoyBase (http://soybase.org)数据库已收录约280个基于连锁分析检测的大豆百粒重性状QTL,全基因组关联分析检测的百粒重相关位点也约有90个。例如,SUN等[11]通过构建重组自交家系定位到分布在5个连锁群体上23个大豆百粒重QTL。在所有定位到的QTL中,有9个通过复合区间作图法得到,另外14个通过多区间作图法得到的。KASTOORI等[12]利用3个大豆重组自交家系作图群体,并利用这三个群体构建了联合连锁图谱,最终定位到1个百粒重相关主效QTL。该研究同时还鉴定到了一些百粒重候选基因,这些基因参与了蛋白转运、氨基酸合成等过程。KATO等[13]利用日本和美国2个不同遗传背景下的栽培种构建了2个重组自交家系,在3个环境下定位到了15个与大豆百粒重QTL。以上研究结果为从分子水平揭示大豆百粒重性状的遗传机制奠定了基础。虽然基于连锁分析的QTL定位方法可以估计QTL的位置和效应,但由于其通常仅涉及2个亲本,因此,该方法所能检测到的等位变异较少,例如在重组自交系群体中,每个位点最多有2个等位变异,所以连锁定位方法无法较全面的解析数量性状。基于自然群体的全基因组关联分析为全面解析数量性状提供了方法,其可以检测到群体内单个位点上所有等位变异,相比于连锁定位更加全面,定位精度也比较高。例如,HAO等[14]通过构建关联分析群体,并在5个环境下种植,结合1 142个单核苷酸多态性(single-nucleotide polymorphism,SNP)和209个单倍型进行关联分析,分别定位到40个和9个与大豆百粒重性状显著关联的SNP位点和单倍型。其中,可以同时在3个环境、4个环境以及5个环境下都检测到的SNP分别为3、2和4个。ZHOU等[15]通过对302份大豆自然群体进行至少11×的重测序,利用全基因组关联分析的方法检测到第3、13和17染色体上共计4个大豆百粒重位点。SONAH等[16]对试验材料进行高密度测序,检测到第2、13和20染色体上的3个百粒重性状显著关联的区域。【本研究切入点】尽管全基因关联分析分析已广泛用于动植物数量性状遗传解析,然而以往方法主要基于双等位SNP标记进行分析[17,18],由于自然群体存在广泛的复等位变异,因此,SNP标记无法估计位点的复等位变异效应。其次,以往关联分析研究通常基于单位点模型,忽略了相邻位点间的相互作用[19],导致表型变异解释率可能溢出(>h2,甚至>100%)。另外,单位点模型对每个位点的假设测验均相互独立,这会导致多重测验标准的设置问题,进而导致较高的全试验错误率。对此,以往方法通过提高显著水平进行多重测验矫正,例如Bonferroni方法[20,21],而这又导致以往方法仅能检测少数位点,进而导致遗传率缺失。针对上述全基因组关联分析在数量性状遗传解析中的限制,HE等[22]通过构建具有复等位变异的SNPLDB(SNP linkage disequilibrium block)标记,并基于多位点复等位变异模型,提出了限制性两阶段多位点全基因组关联分析(restricted two-stage multi-locus genome-wide association analysis,RTM-GWAS)方法。该方法基于多位点模型,使用常规显著性水平0.01或0.05,无需进行额外多重测验矫正。多位点模型充分考虑了相邻位点间的相互影响,因此,所检测位点表型变异解释率不会超过性状遗传率。目前,该方法已应用于多个数量性状遗传解析研究[23,24,25]。东北是中国大豆的主产区[26],有着复杂多变的生态环境和相应的的生态类型。研究东北地区代表性品种群体百粒重的遗传结构可以为该地区百粒重乃至产量的育种改良提供参考。【拟解决的关键问题】本研究以东北地区290份大豆材料为试验群体,该群体不仅时间跨度大,类型多,而且包含了东北地区近100年来大豆育种的遗传变异。利用RTM-GWAS方法并结合该群体两年四点表型数据进行关联分析,并利用结果进行候选基因预测及不同大豆成熟期组间控制百粒重性状的遗传结构变化的研究,以期全面解析大豆百粒重性状的遗传机制,并为未来选育高产优质的大豆品种提供理论支撑。1 材料与方法
1.1 材料与田间试验
以2010—2012年在东北地区收集到的在1916—2010年种植比较广泛的361份大豆品种为试验材料。该群体具有衍生后代多,高产,油脂含量高,抗病等特点。2013—2014年将该群体在包括克山(KS)、牡丹江(MDJ)、佳木斯(JMS)和长春(CC)4个代表性地点东北地区的第二生态亚区进行田间试验。采用重复内分组设计,穴播,小区面积为1 m2,每小区种植4穴,每穴保留4株植株,4次重复。待到初花时期,仅调查至少拥有2穴、每穴中至少3株的小区。各试验点采用常规田间管理。各试验点品种正常成熟后,将小区内植株混合收获,室内脱粒后,32℃烘干48 h,然后随机选取100粒种子称量3次取平均值。由于材料之间成熟期差异比较大,361份材料中的71份成熟期过长,最终没有获得百粒重的数据,因此表型数据实际为290份正常成熟材料(包括9份地方品种、276份育成品种以及5份国外品种,电子附表1)的百粒重数据。1.2 线性模型与方差分析
试验数据采用多年多点随机区组方法做近似方差分析,SAS软件PROC GLM程序中方差分析的线性模型为:$y_{ijkl}=\mu+s_i+t_j+b_{k (i,j)}+g_l+(gs)_{il}+(gt)_{jl}+(gst)_{ijl}+\varepsilon_{ijkl}$
其中,yijkl为第i个年份第j个地点下第k个区组内第l个品种的表型观测值,μ为群体平均数,si为第i个年份效应,tj为第j个地点效应,bk(i,j)为第i个年份第j个地点下第k个区组的效应,gl为第l个品种的效应,(gs)il为第i个年份与第l个品种的互作效应,(gt)jl为第j个地点与第l个品种的互作效应,(gst)ijl为第i个年份、第j个地点与第l个品种的三级互作效应,εijkl为随机误差效应。品种视为固定效应,年份、地点、区组以及互作效应视为随机效应。
单个环境下百粒重性状遗传率估计为$h^2=\sigma_g^2/(\sigma_g^2+\sigma^2/r)$,多环境联合遗传率估计为$h^2=\sigma_g^2/(\sigma_g^2+\sigma_{gs}^2/m+\sigma_{gt}^2/n+\sigma_{gst}^2/mn+\sigma^2/mnr)$。其中$\sigma_g^2$为基因型方差,$\sigma_{gs}^2$为基因型与年份互作方差,$\sigma_{gt}^2$为基因型与地点互作方差,$\sigma_{gst}^2$为基因型与年份地点三级互作方差,$\sigma^2$为误差方差,m为年份数目,n为地点数目,r为重复数目。方差组分使用SAS软件VARCOMP程序估计。
1.3 全基因组SNP分析
使用RAD-seq(restriction-site-association DNA sequencing)对290份材料在深圳华大基因进行简化测序。采用常规的CTAB法从新鲜大豆幼苗叶片中提取DNA,借助Illumina Hiseq 2000测序平台并结合多元鸟枪法进行基因组分析[27]。利用SOAP2软件[28]并参考大豆参考基因组Wm82.a1.v1.1[29]对测序所获得的序列进行比对。利用RealSFS检测SNP位点,之后对检测到的SNP位点按照缺失和杂合率≤20%和最小等位基因频率(MAF)≥1%的标准过滤[30],并利用fastPHASE[31]软件对缺失数据填补,最终获得82 966个高质量的SNP。1.4 全基因组关联分析
根据HE等[22]提出的限制性两阶段多位点全基因组关联分析(RTM-GWAS)方法,首先基于全基因组SNP构建获得了15 546个具有复等位变异的SNPLDB标记,每个SNPLDB标记的等位变异数目变化范围为2—9个。然后基于全基因组SNPLDB标记计算个体间的遗传相似系数,并提取特征向量用于控制全基因组关联分析的群体结构。最后,利用多位点模型对百粒重性状进行全基因组关联分析,显著水平设为0.05。由于多位点模型内建全试验误差控制,因此无需进行额外的多重测验矫正。以上计算分析采用RTM- GWAS软件[22]完成。同时,基于SNPLDB构建的遗传相似系数矩阵,使用MEGA 7.0软件[32]构建了Neighbor-joining聚类树以观察群体结构是否异常。
1.5 候选基因的预测
根据检测到的QTL预测候选基因的方法,首先将定位到的SNPLDB两端各扩展50 kb,然后根据SoyBase(http://soybase.org)上提供的基因信息,将全部落在扩展后的SNPLDB区间内的基因选出。然后对每一个选出的基因中的全部SNP和SNPLDB之间的关联进行卡方(Chi-square)检验,显著性水平设为0.05。2 结果
2.1 东北大豆种质群体百粒重的表型和基因型变异特征
各试验点百粒重性状平均值的次数分布和描述统计见表1。东北地区290份大豆品种百粒重平均值为19.8 g,变幅为8.2—29.5 g。不同环境下百粒重平均数变幅为18.3—20.7 g,百粒重最小为6.4—9.7 g,最大为28.2—32.0 g,环境间百粒重存在较大差异。Table 1
表1
表1东北大豆种质群体百粒重次数分布及描述统计
Table 1
| 类型 Type | 百粒重100-seed weight (g) | N | 平均数 Mean | 变幅 Range | 遗传率 h2 | ||||||||||||||
|---|---|---|---|---|---|---|---|---|---|---|---|---|---|---|---|---|---|---|---|
| 7 | 9 | 11 | 12 | 14 | 16 | 17 | 19 | 21 | 23 | 24 | 26 | 28 | 29 | 31 | |||||
| 环境Environment | |||||||||||||||||||
| 长春CC | 1 | 1 | 0 | 0 | 9 | 45 | 75 | 85 | 52 | 14 | 4 | 4 | 290 | 20.3 | 9.7-28.2 | 0.642 | |||
| 佳木斯JMS | 1 | 2 | 10 | 3 | 1 | 1 | 17 | 57 | 93 | 68 | 28 | 4 | 4 | 0 | 1 | 290 | 20.7 | 8.1-32.0 | 0.780 |
| 克山KS | 3 | 2 | 0 | 1 | 5 | 45 | 91 | 83 | 49 | 9 | 1 | 0 | 1 | 290 | 18.3 | 6.4-28.2 | 0.777 | ||
| 牡丹江MDJ | 2 | 0 | 0 | 0 | 10 | 48 | 98 | 85 | 39 | 4 | 3 | 0 | 1 | 290 | 19.9 | 6.7-28.9 | 0.726 | ||
| Mean | 1 | 1 | 0 | 0 | 7 | 53 | 89 | 90 | 39 | 5 | 4 | 0 | 1 | 290 | 19.8 | 8.2-29.5 | 0.923 | ||
| 熟期组Maturity | |||||||||||||||||||
| MG0 | 1 | 2 | 25 | 55 | 51 | 16 | 4 | 1 | 155 | 19.9 | 13.6-25.6 | ||||||||
| MG00 | 1 | 0 | 0 | 0 | 6 | 11 | 15 | 10 | 2 | 45 | 20.3 | 9.9-24.8 | |||||||
| MG000 | 3 | 3 | 5 | 3 | 1 | 15 | 20.4 | 18.8-21.8 | |||||||||||
| MGI+II | 2 | 9 | 33 | 25 | 6 | 75 | 19.7 | 15.6-22.7 | |||||||||||
| MG0+00+000 | 1 | 0 | 1 | 2 | 34 | 69 | 71 | 29 | 7 | 1 | 215 | 20.0 | 9.9-25.6 | ||||||
新窗口打开|下载CSV
东北地区大豆百粒重两年四点联合方差分析显示(表2),百粒重在品种间有极显著差异,基因型、年份、地点间两两互作以及三级互作效应也呈现极显著,说明百粒重存在基因型与环境互作效应。但相比基因型方差,互作效应方差相对较小,多地点百粒重遗传率为0.923,单地点下遗传率变幅为0.642—0.780。
Table 2
表2
表2东北大豆种质群体百粒重多年多点联合方差分析
Table 2
| 模型Model | 变异来源Source | 自由度DF | 均方MS | F | p |
|---|---|---|---|---|---|
| 基因型×年份×地点 Genotype×Year×Location | 年份Year | 1 | 835.46 | 81.59 | <0.001 |
| 地点Location | 3 | 3156.29 | 493.80 | <0.001 | |
| 区组(年份,地点) Block(Year, Location) | 24 | 2.59 | 1.86 | 0.0068 | |
| 基因型Genotype | 289 | 146.47 | 13.74 | <0.001 | |
| 基因型×年份Genotype×Year | 289 | 9.10 | 2.65 | <0.001 | |
| 基因型×地点Genotype×Location | 867 | 5.22 | 1.41 | <0.001 | |
| 基因型×年份×地点Genotype×Year×Location | 849 | 3.70 | 2.65 | <0.001 | |
| 误差Error | 6791 | 1.40 | |||
| 基因型×环境 Genotype×Environment | 环境Environment | 7 | 1978.57 | 308.84 | <0.001 |
| 区组(环境) Block(Environment) | 24 | 2.59 | 1.86 | 0.0068 | |
| 基因型Genotype | 289 | 147.00 | 28.15 | <0.001 | |
| 基因型×环境Genotype×Environment | 2005 | 5.24 | 3.75 | <0.001 | |
| 误差Error | 6791 | 1.40 |
新窗口打开|下载CSV
2.2 东北大豆种质群体百粒重全基因组关联分析
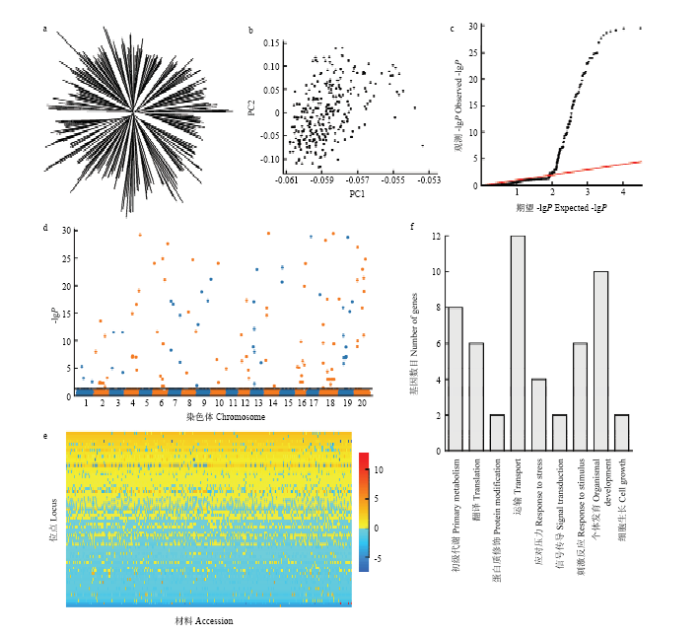
聚类分析(图1-a)显示东北大豆种质群体具有一定的群体结构,但群体分化相对不明显,基于SNPLDB标记的主成分分析(图1-b)也显示该群体虽然有一定的分类倾向,但整体上没有明显的聚类特征。图1
 新窗口打开|下载原图ZIP|生成PPT
图1东北大豆种质群体百粒重表型变异的遗传解析
a:Neighbor-joining聚类树;b:遗传相似系数矩阵特征向量散点图,PC1、PC2分别表示前2个特征向量;c:RTM-GWA 方法QQ图。其中-lgP大于30的记为30;d:RTM-GWAS方法Manhattan图;e:东北大豆种质群体百粒重QTL-allele矩阵;f:百粒重候选基因GO生物过程分布
Fig. 1Genetic dissection of 100-seed weight in the Northeast China soybean germplasm population
a: Neighbor-joining tree; b: Scatter plot of top two eigenvectors of genetic similarity coefficient matrix; c: QQ plot of RTM-GWAS result. -lgP value greater than 30 were shown as 30; d: Manhattan plot of RTM-GWAS result; e: QTL-allele matrix of 100-seed weight in the Northeast China soybean germplasm population; f: GO biological process distribution of 100-seed weight candidate genes
使用RTM-GWAS方法,第一阶段筛选出12 305个候选标记,第二阶段最终检测到76个与大豆百粒重性状显著关联的SNPLDB标记,分布在大豆18条染色体上(表3、图1-c和图1-d),每条染色体上检测到2—7个不等,其中第15、17和20染色体上最少,均只检测到2个SNPLDB标记,第6和18染色体上最多,均检测到7个显著关联的SNPLDB标记。第5和11染色体上没有检测到与大豆百粒重性状相关的SNPLDB标记。由于RTM-GWAS基于多位点模型,所有QTL在同一模型进行拟合,因此,一个位点只能筛选到一个显著的标记,而且通过对存在QTL比较多的染色体上的位点之间物理距离比较发现,相邻2个QTL之间的距离最小为0.58 Mb,最大达到18.21 Mb,且绝大多数相邻位点间的物理距离都超过了5 Mb,因此QTL在各条染色体上并非成簇分布。关联的76个位点中,有15个位点主效不显著,8个位点与环境互作效应不显著。61个主效显著位点总表型变异解释率为65.40%,68个位点与环境互作效应显著位点总表型变异解释率为17.46%,合计解释了82.86%的表型变异(表3)。61个主效显著位点包括18个大效应(R2≥1%)位点和43个小效应(R2<1%)位点,分别解释了52.15%和13.25%的表型变异。与以往研究比较显示,检测的76个SNPLDB标记中,有34个与前人报道的30个QTL存在重叠,另外42个SNPLDB位点为本研究新检测到的位点。
Table 3
表3
表3大豆百粒重显著相关SNPLDB位点
Table 3
| QTL | AN | 主效QTL | QTL×Env. a | QTL | AN | 主效QTL | QTL×Env. a | |||||
|---|---|---|---|---|---|---|---|---|---|---|---|---|
| -lgP | R2 (%) | -lgP | R2 (%) | -lgP | R2 (%) | -lgP | R2 (%) | |||||
| q-SW-1-1 | 2 | - | - | 6.07 | 0.10 | q-SW-12-1 | 2 | 7.95 | 0.08 | 6.99 | 0.11 | |
| q-SW-1-2 | 2 | - | - | 3.47 | 0.06 | q-SW-12-2 | 8 | 4.34 | 0.07 | 4.63 | 0.24 | |
| q-SW-1-3 | 2 | - | - | 2.55 | 0.05 | q-SW-12-3 | 4 | 5.30 | 0.06 | 20.46 | 0.35 | |
| q-SW-2-1 | 5 | 2.87 | 0.04 | 7.60 | 0.21 | q-SW-12-4 | 2 | 2.27 | 0.02 | 3.83 | 0.07 | |
| q-SW-2-2 | 3 | - | - | 2.85 | 0.06 | q-SW-12-5 | 2 | - | - | 3.50 | 0.06 | |
| q-SW-2-3 | 5 | 203.54 | 2.40 | 11.07 | 0.26 | q-SW-13-1 | 6 | 150.15 | 1.76 | 20.04 | 0.42 | |
| q-SW-2-4 | 2 | - | - | 2.29 | 0.05 | q-SW-13-2 | 7 | 76.04 | 0.90 | 46.13 | 0.80 | |
| q-SW-2-5 | 2 | 13.60 | 0.14 | - | - | q-SW-13-3 | 5 | 28.30 | 0.33 | 14.53 | 0.31 | |
| q-SW-2-6 | 2 | 3.00 | 0.03 | - | - | q-SW-13-4 | 4 | 102.12 | 1.16 | 10.74 | 0.23 | |
| q-SW-3-1 | 3 | 5.73 | 0.06 | - | - | q-SW-14-1 | 7 | - | - | 7.12 | 0.26 | |
| q-SW-3-2 | 6 | 3.19 | 0.05 | 12.21 | 0.31 | q-SW-14-2 | 6 | 192.85 | 2.28 | 19.05 | 0.41 | |
| q-SW-3-3 | 5 | 307.65 | 4.26 | 18.50 | 0.37 | q-SW-14-3 | 2 | 63.12 | 0.69 | - | - | |
| q-SW-3-4 | 4 | - | - | 4.81 | 0.14 | q-SW-14-4 | 2 | - | - | 2.26 | 0.05 | |
| q-SW-4-1 | 6 | 19.08 | 0.24 | 5.81 | 0.21 | q-SW-15-1 | 6 | 34.07 | 0.41 | 7.51 | 0.24 | |
| q-SW-4-2 | 5 | 14.91 | 0.18 | 10.54 | 0.26 | q-SW-15-2 | 6 | 40.33 | 0.48 | 15.05 | 0.35 | |
| q-SW-4-3 | 2 | 307.65 | 10.56 | - | - | q-SW-16-1 | 3 | 213.17 | 2.49 | 3.98 | 0.10 | |
| q-SW-4-4 | 6 | 59.53 | 0.70 | 12.31 | 0.31 | q-SW-16-2 | 4 | - | - | 11.03 | 0.23 | |
| q-SW-6-1 | 2 | 35.63 | 0.38 | 3.29 | 0.06 | q-SW-16-3 | 2 | 2.74 | 0.02 | 2.41 | 0.05 | |
| q-SW-6-2 | 6 | 8.46 | 0.11 | 8.63 | 0.26 | q-SW-16-4 | 5 | 20.46 | 0.24 | 14.44 | 0.31 | |
| q-SW-6-3 | 2 | 2.61 | 0.02 | 2.41 | 0.05 | q-SW-16-5 | 7 | 29.99 | 0.37 | 19.95 | 0.45 | |
| q-SW-6-4 | 7 | 29.03 | 0.36 | 23.57 | 0.50 | q-SW-17-1 | 5 | 53.76 | 0.62 | 7.77 | 0.21 | |
| q-SW-6-5 | 8 | 7.57 | 0.12 | 6.58 | 0.27 | q-SW-17-2 | 5 | 2.98 | 0.04 | 26.98 | 0.48 | |
| q-SW-6-6 | 3 | 35.92 | 0.40 | 3.54 | 0.09 | q-SW-18-1 | 5 | 145.14 | 1.69 | 4.18 | 0.16 | |
| q-SW-6-7 | 4 | 49.75 | 0.56 | 8.91 | 0.20 | q-SW-18-2 | 2 | - | - | 2.29 | 0.05 | |
| q-SW-7-1 | 5 | 12.92 | 0.16 | 15.52 | 0.33 | q-SW-18-3 | 6 | 262.05 | 3.16 | 31.38 | 0.57 | |
| q-SW-7-2 | 2 | 147.28 | 1.66 | 2.36 | 0.05 | q-SW-18-4 | 7 | 17.23 | 0.22 | 13.01 | 0.35 | |
| q-SW-7-3 | 6 | 11.66 | 0.15 | 10.25 | 0.28 | q-SW-18-5 | 2 | - | - | 5.50 | 0.09 | |
| q-SW-8-1 | 2 | - | - | 4.40 | 0.08 | q-SW-18-6 | 4 | 200.62 | 2.35 | 10.23 | 0.22 | |
| q-SW-8-2 | 3 | 90.82 | 1.02 | 4.07 | 0.10 | q-SW-18-7 | 5 | 228.35 | 2.71 | 88.81 | 1.24 | |
| q-SW-8-3 | 2 | - | - | - | - | q-SW-19-1 | 8 | 15.85 | 0.21 | 10.59 | 0.32 | |
| q-SW-8-4 | 2 | 45.35 | 0.49 | - | - | q-SW-19-2 | 7 | 178.86 | 2.12 | 14.09 | 0.37 | |
| q-SW-8-5 | 4 | 114.44 | 1.31 | 8.39 | 0.19 | q-SW-19-3 | 7 | 54.88 | 0.64 | 16.95 | 0.38 | |
| q-SW-9-1 | 2 | - | - | 2.12 | 0.05 | q-SW-19-4 | 6 | 74.96 | 0.87 | 11.80 | 0.30 | |
| q-SW-9-2 | 6 | 8.40 | 0.11 | 10.50 | 0.28 | q-SW-19-5 | 5 | 23.13 | 0.27 | 5.86 | 0.18 | |
| q-SW-9-3 | 2 | 24.99 | 0.26 | 4.68 | 0.08 | q-SW-20-1 | 8 | 307.65 | 5.77 | 55.70 | 0.97 | |
| q-SW-9-4 | 6 | 59.00 | 0.69 | 17.45 | 0.39 | q-SW-20-2 | 5 | 34.46 | 0.40 | 13.88 | 0.30 | |
| q-SW-9-5 | 6 | 95.80 | 1.11 | 14.16 | 0.34 | LC-QTL | 83 | 18 | 52.15 | |||
| q-SW-10-1 | 5 | 6.28 | 0.08 | 3.34 | 0.14 | SC-QTL | 205 | 43 | 13.25 | |||
| q-SW-10-2 | 2 | 307.65 | 4.35 | 7.36 | 0.11 | 总Total | 328 | 61 | 65.40 | 68 | 17.46 | |
| q-SW-10-3 | 2 | 89.96 | 0.99 | - | - | |||||||
新窗口打开|下载CSV
2.3 东北大豆种质群体百粒重QTL-allele矩阵及候选基因
与大豆百粒重关联的61个主效显著位点等位变异数目为2—8个,共计288个,其中47个位点存在复等位变异。等位变异效应值变化范围是-7.39—12.74,并进一步构建了61×290(位点×材料)的QTL-allele矩阵(图1-e)。该矩阵代表了东北大豆种质群体百粒重性状的遗传构成,可进一步用于群体分化、候选基因分析以及优化组合设计。61个主效显著位点中仅有39个位点上或其扩展区域中存在共计739个基因,其中602个基因中没有SNP或者没有检测到与SNPLDB显著连锁的SNP,另外137个基因中包含了248个与SNPLDB显著关联的SNP。GO分析显示这137个基因中的83个涉及多种生物过程,包括初级新陈代谢、翻译、蛋白修饰、物质运输、胁迫响应、信号转导,对刺激的响应、器官发育、细胞生长以及一些未知过程(图1-f)。例如,候选基因Glyma18g52250内包含了8个SNP,组成了7种单倍型,对应着位点q-SW-18-7中的5种等位变异。由于候选基因Glyma18g52250前3个SNP并不在位点q-SW-18-7的区间内,因此,候选基因的单倍型数目比位点的等位变异数目多。另外,12个大效应QTL筛选到的候选基因主要参与大豆的代谢、转录、翻译、对刺激响应以及一些未知的生物过程,6个大效应QTL位点没有筛选到候选基因(表4)。Table 4
表4
表4百粒重性状相关大效应QTL和候选基因
Table 4
| QTL | R2 (%) | 候选基因 Candidate gene | 基因本体生物学过程 Gene ontology biological process |
|---|---|---|---|
| q-SW-3-3 | 4.43 | Glyma03g31790 | 囊泡介导的运输Vesicle-mediated transport |
| Glyma03g31810 | 线粒体mRNA修饰Mitochondrial mRNA modification | ||
| Glyma03g31820 | 微管细胞骨架组织Microtubule cytoskeleton organization | ||
| Glyma03g31940 | 甲壳素响应Response to chitin | ||
| Glyma03g32040 | 高尔基体内囊泡介导转运Intra-Golgi vesicle-mediated transport | ||
| q-SW-4-3 | 10.93 | Glyma04g38830 | 细胞分裂素代谢Cytokinin metabolic |
| Glyma04g38870 | 甲基转移酶活性Methyltransferase activity | ||
| Glyma04g38955 | 糖介导的信号通路Sugar mediated signaling pathway | ||
| q-SW-8-5 | 1.36 | Glyma08g44800 | RRNA加工RRNA processing |
| Glyma08g44820 | 蛋白水解Proteolysis | ||
| Glyma08g44960 | 未知Unknown | ||
| Glyma08g44921 | 跨膜运输Transmembrane transport | ||
| q-SW-9-5 | 1.16 | Glyma09g41070 | 液泡运输Vacuolar transport |
| Glyma09g41140 | 肌醇六磷酸磷酸酯的生物合成过程Myo-inositol hexakisphosphate biosynthetic process | ||
| Glyma09g41150 | 胚胎发育以种子休眠结束Embryo development ending in seed dormancy | ||
| Glyma09g41260 | 氧化应激响应Response to oxidative stress | ||
| Glyma09g41320 | 鸟嘌呤运输Guanine transport | ||
| Glyma09g41121 | 未知Unknown | ||
| q-SW-13-1 | 1.83 | Glyma13g08170 | 翻译调控Regulation of translation |
| q-SW-13-4 | 1.21 | Glyma13g29011 | 种子萌发Seed germination |
| q-SW-14-2 | 2.37 | Glyma14g08040 | 嘧啶核糖核苷酸生物合成Pyrimidine ribonucleotide biosynthetic |
| Glyma14g08050 | 缺氧响应Response to hypoxia | ||
| Glyma14g08070 | 种子萌发正调控Positive regulation of seed germination | ||
| Glyma14g08220 | 脱落酸应激响应Response to abscisic acid stimulus | ||
| Glyma14g08075 | 未知Unknown | ||
| Glyma14g08145 | 未知Unknown | ||
| q-SW-16-1 | 2.58 | Glyma16g06320 | 未知Unknown |
| q-SW-18-1 | 1.75 | Glyma18g10460 | 新陈代谢Metabolic |
| Glyma18g10470 | 防御反应Defense response | ||
| q-SW-18-3 | 3.28 | Glyma18g16720 | 蛋白质折叠Protein folding |
| Glyma18g16761 | 蛋白水解Proteolysis | ||
| q-SW-18-6 | 2.44 | Glyma18g36455 | 未知Unknown |
| q-SW-18-7 | 2.81 | Glyma18g52250 | 盐胁迫响应Response to salt stress |
| Glyma18g52260 | 转录调控Regulation of transcription | ||
| Glyma18g52290 | 碳水化合物代谢Carbohydrate metabolic | ||
| Glyma18g52350 | Basipetal生长素运输Basipetal auxin transport |
新窗口打开|下载CSV
2.4 东北大豆种质群体新熟期组百粒重QTL-等位变异的新生和汰除
将大豆品种按照生育期进行熟期组划分,有助于品种交流、引种以及育种方案的设计。根据盖钧镒等[33]提出的中国大豆熟期组划分方法,将本研究群体材料划分为000、00、0、Ⅰ和Ⅱ等5个熟期组。其中,Ⅰ和Ⅱ为东北大豆种质旧熟期组,000、00和0为东北大豆种质新熟期组。不同熟期组的百粒重均值变幅为19.7—20.4 g,虽然平均数差异不大,但百粒重最小值为9.9—18.8 g,最大值为21.8—25.6 g,各熟期组之间百粒重变幅差异较大(表1)。基于百粒重QTL-等位变异体系分析,东北大豆熟期缩短过程中百粒重位点等位变异发生了一定的新生和汰除(表5)。这里将旧熟期组Ⅰ和Ⅱ合并(MGI+Ⅱ)作为基础,将新熟期组遗传结构与之比较,结果显示,从MGI+Ⅱ到MG0,MG0中同时新生了一些大效应的正效应和负效应等位变异,例如在QTL q-SW-20-1上新生了第1、2、7和8号等位变异,QTL q-SW-14-2 的上新生了第1号等位变异。q-SW-20-1的第8号和QTL q-SW-14-2的第1号等位变异分别是本研究中百粒重QTL-等位变异体系中正负效应的最大值。由MG0到MG00,MG0中新生的QTL q-SW-20-1的第8号等位变异以及其他33个小到中等正效应的等位变异在MG00中被汰除,但MG00中汰除的负效应大部分为小效应等位变异。由MG00到MG000,MG000汰除了一批效应较大的负效和正效等位变异,其中就包括最大负效应等位变异(q-SW-14-2的第1号等位变异,效应值为-7.39)以及较大正效等位变异(q-SW-20-1的第7号等位变异,效应值为4.74)。而新增的等位变异中最大正、负效应分别仅为1.20和-3.78,这就使得MG000中材料的百粒重变幅在2个方向均大幅缩小,即从9.9—24.8到18.8—21.8。Table 5
表5
表5百粒重QTL-等位变异在熟期组间的变化
Table 5
| QTL | a1 | a2 | a3 | a4 | a5 | a6 | a7 | a8 | QTL | a1 | a2 | a3 | a4 | a5 | a6 | a7 | a8 | QTL | a1 | a2 | a3 | a4 | a5 | a6 | a7 | a8 | |||||||||||||
|---|---|---|---|---|---|---|---|---|---|---|---|---|---|---|---|---|---|---|---|---|---|---|---|---|---|---|---|---|---|---|---|---|---|---|---|---|---|---|---|
| 1-1 | yz | 7-3 | X | yz | 14-4 | yz | |||||||||||||||||||||||||||||||||
| 1-2 | y | 8-1 | z | 15-1 | X | ||||||||||||||||||||||||||||||||||
| 1-3 | yz | 8-2 | z | 15-2 | z | z | |||||||||||||||||||||||||||||||||
| 2-1 | z | z | 8-3 | XYZ | yz | XZ | 16-1 | ||||||||||||||||||||||||||||||||
| 2-2 | z | yz | 8-4 | xyz | XYZ | XYZ | XYZ | XYZ | xyz | 16-2 | XY | yz | |||||||||||||||||||||||||||
| 2-3 | X | XY | z | 8-5 | xyz | xyz | xyz | xyz | 16-3 | ||||||||||||||||||||||||||||||
| 2-4 | XZ | 9-1 | z | 16-4 | yz | ||||||||||||||||||||||||||||||||||
| 2-5 | z | 9-2 | xy | z | 16-5 | yz | z | ||||||||||||||||||||||||||||||||
| 2-6 | yz | 9-3 | XY | 17-1 | XY | z | |||||||||||||||||||||||||||||||||
| 3-1 | XY | XYZ | Y | 9-4 | XYZ | y | z | 17-2 | z | y | |||||||||||||||||||||||||||||
| 3-2 | X | XZ | 9-5 | yz | 18-1 | XYZ | y | z | |||||||||||||||||||||||||||||||
| 3-3 | yz | yz | 10-1 | X | XY | 18-2 | z | ||||||||||||||||||||||||||||||||
| 3-4 | z | y | 10-2 | X | 18-3 | y | z | z | yz | ||||||||||||||||||||||||||||||
| 4-1 | yz | yz | yz | z | 10-3 | z | 18-4 | yz | yz | yz | XY | ||||||||||||||||||||||||||||
| 4-2 | z | yz | yz | 12-1 | 18-5 | yz | |||||||||||||||||||||||||||||||||
| 4-3 | z | 12-2 | z | XZ | yz | z | z | yz | 18-6 | yz | yz | y | |||||||||||||||||||||||||||
| 4-4 | YZ | yz | xz | z | z | 12-3 | yz | z | 18-7 | z | |||||||||||||||||||||||||||||
| 6-1 | 12-4 | yz | 19-1 | X | |||||||||||||||||||||||||||||||||||
| 6-2 | z | X | 12-5 | z | 19-2 | z | xyz | z | |||||||||||||||||||||||||||||||
| 6-3 | XZ | 13-1 | z | yz | z | 19-3 | XY | XY | |||||||||||||||||||||||||||||||
| 6-4 | z | yz | z | 13-2 | z | yz | XZ | z | 19-4 | yz | yz | z | YZ | ||||||||||||||||||||||||||
| 6-5 | yz | y | yz | y | yz | 13-3 | z | XYZ | z | 19-5 | z | ||||||||||||||||||||||||||||
| 6-6 | yz | yz | 13-4 | z | yz | 20-1 | XZ | X | z | y | yz | XY | X | ||||||||||||||||||||||||||
| 6-7 | xyz | 14-1 | yz | z | z | 20-2 | y | y | |||||||||||||||||||||||||||||||
| 7-1 | XYZ | z | 14-2 | XYZ | XY | yz | |||||||||||||||||||||||||||||||||
| 7-2 | 14-3 | xy | |||||||||||||||||||||||||||||||||||||
| 熟期组 Maturity group | 等位变异总数 Total allele | 继承等位变异 Inherent allele | 变化等位变异 Changed allele | 新生等位变异 Emerged allele | 汰除等位变异 Excluded allele | ||||||||||||||||||||||||||||||||||
| Allele no. | QTL no. | Allele no. | QTL no. | Allele no. | QTL no. | Allele no. | QTL no. | Allele no. | QTL no. | ||||||||||||||||||||||||||||||
| Ⅰ+Ⅱ | 292 (147, 145) | 76 | |||||||||||||||||||||||||||||||||||||
| 0 vs.Ⅰ+Ⅱ | 321 (162, 159) | 76 | 287 (144, 143) | 76 | 39 (21,18) | 30 | 34 (18,16) | 25 | 5 (3,2) | 5 | |||||||||||||||||||||||||||||
| 00 vs. 0 | 250 (125,125) | 76 | 247 (123, 124) | 76 | 77(41,36) | 49 | 3 (2,1) | 2 | 74 (39,35) | 49 | |||||||||||||||||||||||||||||
| 000 vs. 00 | 208 (105,103) | 76 | 189 (96,93) | 76 | 80(38,42) | 52 | 19 (9,10) | 17 | 61(29,32) | 44 | |||||||||||||||||||||||||||||
| 0+00+000 vs.Ⅰ+Ⅱ | 324 (163, 161) | 76 | 288 (144, 144) | 76 | 40 (22,18) | 31 | 36 (19,17) | 27 | 4(3,1) | 4 | |||||||||||||||||||||||||||||
新窗口打开|下载CSV
进一步将熟期组0、00与000的材料合并(MG0+00+000)后与MGI+Ⅱ进行比较分析。从熟期组MGI+Ⅱ到0,到00,再到000的过程中,新生的等位变异累计共56个(34+3+19),但MGI+Ⅱ和MG0+00+000相差的新生等位变异却只有36个(表5)。同时从熟期组MGI+Ⅱ到0,到00,再到000的过程中,汰除的等位变异共计140个(5+74+61),但MGI+Ⅱ和MG0+00+000相差的汰除等位变异只有4个,这说明一些等位变异在MG0、MG00、MG000之间存在新生和汰除的反复过程,即在一个熟期组中被汰除后,又在其他熟期组中作为新生等位变异重新出现。例如,QTL q-SW-4-4上的第1号等位变异在MG0中被汰除后,又在MG00新生出来,并继续传递给了MG000,QTL q-SW-20-1的第8号等位变异在MG0组中新生,随后又在MG00中被汰除。综上所述,等位变异在不同熟期组间正效和负效等位变异几乎是同等数量新生或汰除,使得东北大豆群体各熟期组之间百粒重均值变化不大。但各熟期组的QTL-等位变异构成不尽相同,从而导致各熟期组之间百粒重的变化范围呈现差异。因而新生的熟期组群体中,百粒重的QTL-等位变异结构是有差异的,说明百粒重还有重组的潜力。
3 讨论
本研究采用限制性两阶段多位点全基因组关联分析(RTM-GWAS)方法,能够较全面地解析东北大豆种质群体百粒重性状QTL及其复等位变异,分析结果不仅可用于个别基因挖掘,还可用于群体遗传以及作物育种的优化组合设计等方面的研究。RTM-GWAS方法通过构建SNPLDB标记来检测资源群体的复等位变异,从而提高检测功效。本研究检测的76个位点上共计存在328个复等位变异(表3),平均每个位点存在4.3个复等位变异。与以往GWAS基于的SNP标记仅有2种变异相比,SNPLDB标记的复等位性更符合资源群体遗传特性。其次,RTM-GWAS方法采用多位点模型检测全基因组QTL,相比以往单位点模型方法,不仅提高了检测功效,还将检测位点的表型变异解释率控制在性状遗传率范围内。本研究定位到与百粒重关联的SNPLDB位点中61个主效显著位点共解释65.40%的表型变异。而以往方法往往只能检测到个别位点,例如COPLEY等[34]利用67 594个SNP标记仅定位到了5个百粒重相关位点。另外,本研究有34个SNPLDB标记位点与30个已报道QTL重叠,其余42个为本研究新检测位点。候选基因分析共筛选到了137个与大豆百粒重相关的候选基因。这一数量远远超过前人研究结果。例如WANG等[35]利用SNP芯片定到了11个百粒重位点,但是只筛选到5个候选基因。CONTRERAS-SOTA等[36]仅得到了2个大豆百粒重相关的候选基因。ZHANG等[37]总共筛选到6个候选基因。将前人的结果和RTM-GWAS方法的结果比较,充分证明了RTM-GWAS方法的优势和可行性。
本研究利用定位结果的QTL-等位变异体系对大豆各熟期组百粒重性状的遗传机制进行了研究,分析表明各熟期组间百粒重的变异幅度变化较大,主要是因为等位变异在新熟期组形成过程中发生了新生或汰除,比如,等位变异由熟期组00向熟期组000过度过程中第14染色体上的QTL q-SW-14-2的第1号等位变异(效应值为-7.39,是全部76个位点的328个等位变异中最大的负效等位变异,等位变异的顺序按照效应值从小到大排列)的汰除使得熟期组000中百粒重的最小值得到了大大提升,另外4个QTL,q-SW-2-3的第5号等位变异,q-SW-13-1的第6号等位变异,q-SW-18-4的第2号等位变异,q-SW-20-2的第5号等位变异(以上4个QTL的4个等位变异均为相应QTL位点上效应值最大的等位变异)的汰除也使得熟期组000百粒重的最大值由熟期组00的24.8 g降到21.8 g。从百粒重均值来看,各熟期组间变化不大,这主要是因为等位变异在传递过程中正效和负效等位变异几乎是同等数量的新生或汰除,但是比较发现各成熟期组中新生和汰除的等位变异不尽相同,发生了很大变化,说明百粒重的遗传机制在各熟期组间发生了变化。本研究为研究群体间等位变异的迁移汰除以及群体结构的变化提供了新思路。
4 结论
东北大豆种质群体中检测到76个大豆百粒重相关SNPLDB标记位点,共存在328个等位变异,其中61个主效显著位点解释了65.40%表型变异(大效应和小效应位点分别为18和43个,解释表型变异的52.15%和13.25%),68个与环境互作效应显著位点解释了17.46%的表型变异。所检测的34个SNPLDB标记位点与已报道30个QTL重叠。基于检测的SNPLDB标记位点,共注释到137个百粒重相关候选基因。各熟期组百粒重均值变化不大,但是QTL-等位变异比较分析显示各熟期组间百粒重的遗传结构发生了变化。参考文献 原文顺序
文献年度倒序
文中引用次数倒序
被引期刊影响因子
DOI:10.3864/j.issn.0578-1752.2016.09.002URL [本文引用: 1]

【Objective】 Seed weight is a major target of breeding as it is not only a component of seed yield but it also affects quality, so, different uses have different requirements for it. This study is to identify QTL associated with 100-seed weight, obtain the linkage markers and explore its diversity. Eventually provide a scientific basis of genetic improvement of seed weight.【Method】Recombinant inbred lines (RIL) derived from a cross of Jidou12×Heidou were used to detect the QTL associated with 100-seed weight, the composite interval mapping (CIM) method in WinQTL Cartographer software was used for the QTL analysis based on the seed weight observed in two years. A putative QTL was claimed using a genome-wise type I error of P<0.05 determined by 300 permutations. In addition, a total of 205 soybean landraces and improved cultivars were used to identify phenotype through 3 years, and genotyped by SSR marker that linked with seed weight. Allelic frequency variation is more than 5% (corresponding to the number of resource materials is more than 10) as the efficient allelic variation.【Result】In RIL, the distribution frequency of seed weight was basically in normal, and the narrow-sense heritability was 88.72%. Five QTL for 100-seed weight were identified. These QTL scattered on Chr.02 (D1b), Chr.06 (C2), Chr.08 (A2) and Chr.17 (D2), respectively and could explain 7.68%-12.83% of the phenotype variation. The additive effect of the QTL varied from 0.65 g to 0.84 g. Two QTL were detected in two years. The qSW-6-1 flanked by SSR markers Satt457 and Sat_062 on Chr.06 explaining 12.02% of the phenotype variation, linked marker was Satt281, and the additive effect was -0.81 g. The qSW-17-1 flanked by SSR markers Satt301 to Satt310 on Chr.17 explaining 12.83% of the variation, and the additive effect was -0.84 g. Based on the germplasm, the allele number of the eight SSR loci, associated with five QTL identified via RIL, varied from 2 to 8, and the genetic diversity index varied from 0.34 to 0.82. Six alleles, Satt281-227 bp, Barcsoyssr_2_304-245 bp, Satt301-199 bp, Sat_406-214 bp, Satt119-136 bp and Satt341-218 bp, were correlated with large seed weight. Satt281-227 bp was the novel alleles in RIL and nature population, mainly distributed in the domestic improved cultivars that with big seed weight. Among the 205 accessions, only three accessions (Lü75, Zhongpindaheidou, Zhongye2) contained more than four alleles associated with large seed weight. 【Conclusion】 In this study, five QTL associated with 100-seed weight were identified by linkage analysis in RIL which crossed by improved cultivars Jidou12 and landraces Heidou. One allele of these was additive effect among RIL and nature population. The diversity distribution was made clear among the 205 accessions. The results can be applied to the parental selection and marker-assisted breeding in the process of seed weight improvement.
DOI:10.3864/j.issn.0578-1752.2016.09.002URL [本文引用: 1]
【Objective】 Seed weight is a major target of breeding as it is not only a component of seed yield but it also affects quality, so, different uses have different requirements for it. This study is to identify QTL associated with 100-seed weight, obtain the linkage markers and explore its diversity. Eventually provide a scientific basis of genetic improvement of seed weight.【Method】Recombinant inbred lines (RIL) derived from a cross of Jidou12×Heidou were used to detect the QTL associated with 100-seed weight, the composite interval mapping (CIM) method in WinQTL Cartographer software was used for the QTL analysis based on the seed weight observed in two years. A putative QTL was claimed using a genome-wise type I error of P<0.05 determined by 300 permutations. In addition, a total of 205 soybean landraces and improved cultivars were used to identify phenotype through 3 years, and genotyped by SSR marker that linked with seed weight. Allelic frequency variation is more than 5% (corresponding to the number of resource materials is more than 10) as the efficient allelic variation.【Result】In RIL, the distribution frequency of seed weight was basically in normal, and the narrow-sense heritability was 88.72%. Five QTL for 100-seed weight were identified. These QTL scattered on Chr.02 (D1b), Chr.06 (C2), Chr.08 (A2) and Chr.17 (D2), respectively and could explain 7.68%-12.83% of the phenotype variation. The additive effect of the QTL varied from 0.65 g to 0.84 g. Two QTL were detected in two years. The qSW-6-1 flanked by SSR markers Satt457 and Sat_062 on Chr.06 explaining 12.02% of the phenotype variation, linked marker was Satt281, and the additive effect was -0.81 g. The qSW-17-1 flanked by SSR markers Satt301 to Satt310 on Chr.17 explaining 12.83% of the variation, and the additive effect was -0.84 g. Based on the germplasm, the allele number of the eight SSR loci, associated with five QTL identified via RIL, varied from 2 to 8, and the genetic diversity index varied from 0.34 to 0.82. Six alleles, Satt281-227 bp, Barcsoyssr_2_304-245 bp, Satt301-199 bp, Sat_406-214 bp, Satt119-136 bp and Satt341-218 bp, were correlated with large seed weight. Satt281-227 bp was the novel alleles in RIL and nature population, mainly distributed in the domestic improved cultivars that with big seed weight. Among the 205 accessions, only three accessions (Lü75, Zhongpindaheidou, Zhongye2) contained more than four alleles associated with large seed weight. 【Conclusion】 In this study, five QTL associated with 100-seed weight were identified by linkage analysis in RIL which crossed by improved cultivars Jidou12 and landraces Heidou. One allele of these was additive effect among RIL and nature population. The diversity distribution was made clear among the 205 accessions. The results can be applied to the parental selection and marker-assisted breeding in the process of seed weight improvement.
DOI:10.1016/j.molp.2017.03.006URLPMID:28363587 [本文引用: 1]
Cultivated soybeans may lose some useful genetic loci during domestication. Introgression of genes from wild soybeans could broaden the genetic background and improve soybean agronomic traits. In this study, through whole-genome sequencing of a?recombinant inbred line population derived from a cross between a wild soybean ZYD7 and a cultivated soybean HN44, and mapping of quantitative trait loci for seed weight, we discovered that a phosphatase 2C-1 (PP2C-1) allele from wild soybean ZYD7 contributes to the increase in seed weight/size. PP2C-1 may achieve this function by enhancing cell size of integument and activating a subset of seed trait-related genes. We found that PP2C-1 is associated with GmBZR1, a soybean ortholog of Arabidopsis BZR1, one of key transcription factors in brassinosteroid (BR) signaling, and facilitate accumulation of dephosphorylated GmBZR1. In contrast, the PP2C-2 allele with variations of a few amino acids at the N-terminus did not exhibit this function. Moreover, we showed that GmBZR1 could promote seed weight/size in transgenic plants. Through analysis of cultivated soybean accessions, we found that 40% of the examined accessions do not have the PP2C-1 allele, suggesting that these accessions can be improved by introduction of this allele. Taken together, our study identifies an elite allele PP2C-1, which can enhance seed weight and/or size in soybean, and pinpoints that manipulation of this allele by molecular-assisted breeding may increase production in soybean and other legumes/crops.
[本文引用: 1]
[本文引用: 1]
URL [本文引用: 1]
【目的】百粒重是控制大豆产量性状的主要数量性状,对大豆产量性状进行基因定位具有重要的研究和应用价值。现有百粒重QTL定位结果分散,需选择合适的公共图谱,整合前人的研究结果,使其真正应用到实践中。【方法】以2004年发布大豆公共遗传连锁图谱soymap2为参考图谱,将近20年不同试验中的大豆百粒重的QTLs进行映射整合,构建百粒重QTL综合图谱。利用BioMercator2.1的映射功能将国内外常用的大豆图谱上的百粒重QTLs通过公共标记映射整合到大豆公共遗传连锁图谱soymap2上,并利用Meta分析,通过对比已经报道的QTLs的95%的置信区间来推断QTL位置,从而提取真正有效的QTL标记。【结果】在已经发表的文献中共找到65个百粒重QTLs定位信息,其中有53个QTLs定位区间与公共图谱有共有标记,包括36个增效效应的QTLs和17个减效效应的百粒重QTLs,共得到12个QTL簇,通过Meta分析,发掘出6个增效效应和6个减效效应的百粒重“通用QTLs”及其连锁标记。【结论】本研究得到的“通用QTLs”其置信区间最小可达到1.52 cM,为辅助选择分子标记、QTL精细定位以及数量性状基因的克隆奠定基础。
DOI:10.1007/BF00230118URLPMID:24162474 [本文引用: 1]
Seed weight (SW) is a component of soybean, Glycine max (L.) Merr., seed yield, as well as an important trait for food-type soybeans. Two soybean populations, 120 F4-derived lines of 'Young'xPI416937 (Pop1) and 111 F2-derived lines of PI97100x'Coker 237' (Pop2), were mapped with RFLP makers to identify quantitative trait loci (QTLs) conditioning SW across environments and populations. The genetic map of Pop1 consisted of 155 loci covering 973 cM, whereas Pop2 involved 153 loci and covered 1600 cM of map distance. For Pop1, the phenotypic data were collected from Plains, GA., Windblow, N.C., and Plymouth, N.C., in 1994. For Pop2, data were collected from Athens, GA., in 1994 and 1995, and Blackville, S.C., in 1995. Based on single-factor analysis of variance (ANOVA), seven and nine independent loci were associated with SW in Pop1 and Pop2, respectively. Together the loci explained 73% of the variability in SW in Pop1 and 74% in Pop2. Transgressive segregation occurred among the progeny in both populations. The marker loci associated with SW were highly consistent across environments and years. Two QTLs on linkage group (LG) F and K were located at similar genomic regions in both populations. The high consistency of QTLs across environments indicates that effective marker-assisted selection is feasible for soybean SW.
[本文引用: 1]
[本文引用: 1]
[本文引用: 1]
DOI:10.1007/s001220100621URL [本文引用: 1]
[D].
[本文引用: 1]
[D].
[本文引用: 1]
[本文引用: 1]
[本文引用: 1]
DOI:10.1007/s11033-012-1808-4URLPMID:22740134 [本文引用: 1]
100-Seed weight (100-SW) of soybean is an important but complicated quantitative trait to yield. This study was focus on the quantitative trait loci (QTLs) of soybean 100-SW from 2006 to 2010, using recombination inbred lines population that was derived from a cross between Charleston and Dongnong 594. A total of 23 QTLs for 100-SW were detected in the linkage group C2, D1a, F, G and O. Nine QTLs were identified by composite interval mapping including one QTL with the minimum confidence interval (CI) of 1.3 cM, while 14 QTLs by multiple interval mapping. Furthermore, 94 reported QTLs of 100-SW were integrated with our QTL mapping results using BioMercator. As a result, 15 consensus QTLs and their corresponding markers were identified. The minimum CI was reduced to 1.52 cM by the combination of meta-analysis. These findings may merit fine-mapping of these QTL in soybean.
[本文引用: 1]
DOI:10.1007/s00122-014-2304-0URLPMID:24718925 [本文引用: 1]
We detected a QTL for single seed weight in soybean that was stable across multiple environments and genetic backgrounds with the use of two recombinant inbred line populations. Single seed weight (SSW) in soybean is a key determinant of both seed yield and the quality of soy food products, and it exhibits wide variation. SSW is under genetic control, but the molecular mechanisms of such control remain unclear. We have now investigated quantitative trait loci (QTLs) for SSW in soybean and have identified such a QTL that is stable across multiple environments and genetic backgrounds. Two populations of 225 and 250 recombinant inbred lines were developed from crosses between Japanese and US cultivars of soybean that differ in SSW by a factor of ~2, and these populations were grown in at least three different environments. A whole-genome panel comprising 304 simple sequence repeat (SSR) loci was applied to mapping in each population. We identified 15 significant QTLs for SSW dispersed among 11 chromosomes in the two populations. One QTL located between Sat_284 and Sat_292 on chromosome 17 was detected (3.6?&lt;?LOD?&lt;?14.1) in both populations grown in all environments. This QTL, tentatively designated qSw17-1, accounted for 9.4-20.9?% of phenotypic variation in SSW, with a dominant allele being associated with increased SSW. Given its substantial effect on SSW, qSw17-1 is an attractive target for positional cloning, and SSR markers closely associated with this locus may prove useful for marker-assisted selection for SSW control in soybean.
DOI:10.1007/s00122-011-1719-0URLPMID:21997761 [本文引用: 1]
Genome-wide association analysis is a powerful approach to identify the causal genetic polymorphisms underlying complex traits. In this study, we evaluated a population of 191 soybean landraces in five environments to detect molecular markers associated with soybean yield and its components using 1,536 single-nucleotide polymorphisms (SNPs) and 209 haplotypes. The analysis revealed that abundant phenotypic and genetic diversity existed in the studied population. This soybean population could be divided into two subpopulations and no or weak relatedness was detected between pair-wise landraces. The level of intra-chromosomal linkage disequilibrium was about 500 kb. Genome-wide association analysis based on the unified mixed model identified 19 SNPs and 5 haplotypes associated with soybean yield and yield components in three or more environments. Nine markers were found co-associated with two or more traits. Many markers were located in or close to previously reported quantitative trait loci mapped by linkage analysis. The SNPs and haplotypes identified in this study will help to further understand the genetic basis of soybean yield and its components, and may facilitate future high-yield breeding by marker-assisted selection in soybean.
DOI:10.1038/nbt.3096URLPMID:25643055 [本文引用: 1]
Understanding soybean (Glycine max) domestication and improvement at a genetic level is important to inform future efforts to further improve a crop that provides the world's main source of oilseed. We detect 230 selective sweeps and 162 selected copy number variants by analysis of 302 resequenced wild, landrace and improved soybean accessions at &gt;11× depth. A genome-wide association study using these new sequences reveals associations between 10 selected regions and 9 domestication or improvement traits, and identifies 13 previously uncharacterized loci for agronomic traits including oil content, plant height and pubescence form. Combined with previous quantitative trait loci (QTL) information, we find that, of the 230 selected regions, 96 correlate with reported oil QTLs and 21 contain fatty acid biosynthesis genes. Moreover, we observe that some traits and loci are associated with geographical regions, which shows that soybean populations are structured geographically. This study provides resources for genomics-enabled improvements in soybean breeding.
DOI:10.1111/pbi.12249URLPMID:25213593 [本文引用: 1]
Soya bean is a major source of edible oil and protein for human consumption as well as animal feed. Understanding the genetic basis of different traits in soya bean will provide important insights for improving breeding strategies for this crop. A genome-wide association study (GWAS) was conducted to accelerate molecular breeding for the improvement of agronomic traits in soya bean. A genotyping-by-sequencing (GBS) approach was used to provide dense genome-wide marker coverage (&gt;47,000 SNPs) for a panel of 304 short-season soya bean lines. A subset of 139 lines, representative of the diversity among these, was characterized phenotypically for eight traits under six environments (3 sites × 2 years). Marker coverage proved sufficient to ensure highly significant associations between the genes known to control simple traits (flower, hilum and pubescence colour) and flanking SNPs. Between one and eight genomic loci associated with more complex traits (maturity, plant height, seed weight, seed oil and protein) were also identified. Importantly, most of these GWAS loci were located within genomic regions identified by previously reported quantitative trait locus (QTL) for these traits. In some cases, the reported QTLs were also successfully validated by additional QTL mapping in a biparental population. This study demonstrates that integrating GBS and GWAS can be used as a powerful complementary approach to classical biparental mapping for dissecting complex traits in soya bean.
[本文引用: 1]
DOI:10.1016/s0168-9525(01)02409-xURLPMID:11525814 [本文引用: 1]
Levels of heterozygosity for single nucleotide polymorphisms vary by more than one order of magnitude in different regions of the human genome. Regional differences in the rate of recombination explain a substantial fraction of the variation in levels of nucleotide polymorphism, consistent with the widespread action of natural selection at the molecular level.
URLPMID:8013918 [本文引用: 1]
Adequate separation of effects of possible multiple linked quantitative trait loci (QTLs) on mapping QTLs is the key to increasing the precision of QTL mapping. A new method of QTL mapping is proposed and analyzed in this paper by combining interval mapping with multiple regression. The basis of the proposed method is an interval test in which the test statistic on a marker interval is made to be unaffected by QTLs located outside a defined interval. This is achieved by fitting other genetic markers in the statistical model as a control when performing interval mapping. Compared with the current QTL mapping method (i.e., the interval mapping method which uses a pair or two pairs of markers for mapping QTLs), this method has several advantages. (1) By confining the test to one region at a time, it reduces a multiple dimensional search problem (for multiple QTLs) to a one dimensional search problem. (2) By conditioning linked markers in the test, the sensitivity of the test statistic to the position of individual QTLs is increased, and the precision of QTL mapping can be improved. (3) By selectively and simultaneously using other markers in the analysis, the efficiency of QTL mapping can be also improved. The behavior of the test statistic under the null hypothesis and appropriate critical value of the test statistic for an overall test in a genome are discussed and analyzed. A simulation study of QTL mapping is also presented which illustrates the utility, properties, advantages and disadvantages of the method.
DOI:10.1101/gr.7.10.986URLPMID:9331369 [本文引用: 1]
Genes differentially expressed in different tissues, during development, or during specific pathologies are of foremost interest to both basic and pharmaceutical research. &quot;Transcript profiles&quot; or &quot;digital Northerns&quot; are generated routinely by partially sequencing thousands of randomly selected clones from relevant cDNA libraries. Differentially expressed genes can then be detected from variations in the counts of their cognate sequence tags. Here we present the first systematic study on the influence of random fluctuations and sampling size on the reliability of this kind of data. We establish a rigorous significance test and demonstrate its use on publicly available transcript profiles. The theory links the threshold of selection of putatively regulated genes (e.g., the number of pharmaceutical leads) to the fraction of false positive clones one is willing to risk. Our results delineate more precisely and extend the limits within which digital Northern data can be used.
DOI:10.1186/1471-2105-9-114URLPMID:18298808 [本文引用: 1]
We consider effects of dependence among variables of high-dimensional data in multiple hypothesis testing problems, in particular the False Discovery Rate (FDR) control procedures. Recent simulation studies consider only simple correlation structures among variables, which is hardly inspired by real data features. Our aim is to systematically study effects of several network features like sparsity and correlation strength by imposing dependence structures among variables using random correlation matrices.
DOI:10.1007/s00122-017-2962-9URLPMID:28828506 [本文引用: 3]
The innovative RTM-GWAS procedure provides a relatively thorough detection of QTL and their multiple alleles for germplasm population characterization, gene network identification, and genomic selection strategy innovation in plant breeding. The previous genome-wide association studies (GWAS) have been concentrated on finding a handful of major quantitative trait loci (QTL), but plant breeders are interested in revealing the whole-genome QTL-allele constitution in breeding materials/germplasm (in which tremendous historical allelic variation has been accumulated) for genome-wide improvement. To match this requirement, two innovations were suggested for GWAS: first grouping tightly linked sequential SNPs into linkage disequilibrium blocks (SNPLDBs) to form markers with multi-allelic haplotypes, and second utilizing two-stage association analysis for QTL identification, where the markers were preselected by single-locus model followed by multi-locus multi-allele model stepwise regression. Our proposed GWAS procedure is characterized as a novel restricted two-stage multi-locus multi-allele GWAS (RTM-GWAS, https://github.com/njau-sri/rtm-gwas ). The Chinese soybean germplasm population (CSGP) composed of 1024 accessions with 36,952 SNPLDBs (generated from 145,558 SNPs, with reduced linkage disequilibrium decay distance) was used to demonstrate the power and efficiency of RTM-GWAS. Using the CSGP marker information, simulation studies demonstrated that RTM-GWAS achieved the highest QTL detection power and efficiency compared with the previous procedures, especially under large sample size and high trait heritability conditions. A relatively thorough detection of QTL with their multiple alleles was achieved by RTM-GWAS compared with the linear mixed model method on 100-seed weight in CSGP. A QTL-allele matrix (402 alleles of 139 QTL?×?1024 accessions) was established as a compact form of the population genetic constitution. The 100-seed weight QTL-allele matrix was used for genetic characterization, candidate gene prediction, and genomic selection for optimal crosses in the germplasm population.
DOI:10.1093/jxb/erv342URLPMID:26163701 [本文引用: 1]
A representative sample comprising 366 accessions from the Chinese soybean landrace population (CSLRP) was tested under four growth environments for determination of the whole-genome quantitative trait loci (QTLs) system of the 100-seed weight trait (ranging from 4.59g to 40.35g) through genome-wide association study (GWAS). A total of 116 769 single nucleotide polymorphisms (SNPs) were identified and organized into 29 121 SNP linkage disequilibrium blocks (SNPLDBs) to fit the property of multiple alleles/haplotypes per locus in germplasm. An innovative two-stage GWAS was conducted using a single locus model for shrinking the marker number followed by a multiple loci model utilizing a stepwise regression for the whole-genome QTL identification. In total, 98.45% of the phenotypic variance (PV) was accounted for by four large-contribution major QTLs (36.33%), 51 small-contribution major QTLs (43.24%), and a number of unmapped minor QTLs (18.88%), with the QTL×environment variance representing only 1.01% of the PV. The allele numbers of each QTL ranged from two to 10. A total of 263 alleles along with the respective allele effects were estimated and organized into a 263×366 matrix, giving the compact genetic constitution of the CSLRP. Differentiations among the ecoregion matrices were found. No landrace had alleles which were all positive or all negative, indicating a hidden potential for recombination. The optimal crosses within and among ecoregions were predicted, and showed great transgressive potential. From the QTL system, 39 candidate genes were annotated, of which 26 were involved with the gene ontology categories of biological process, cellular component, and molecular function, indicating that diverse genes are involved in directing the 100-seed weight.
DOI:10.1007/s00122-017-2960-yURLPMID:28799029 [本文引用: 1]
The RTM-GWAS was chosen among five procedures to identify DTF QTL-allele constitution in a soybean NAM population; 139 QTLs with 496 alleles accounting for 81.7% of phenotypic variance were detected. Flowering date (days to flowering, DTF) is an ecological trait in soybean, closely related to its ability to adapt to areas. A nested association mapping (NAM) population consisting of four RIL populations (LM, ZM, MT and MW with M8206 as their common parent) was established and tested for their DTF under five environments. Using restriction-site-associated DNA sequencing the population was genotyped with SNP markers. The restricted two-stage multi-locus (RTM) genome-wide association study (GWAS) (RTM-GWAS) with SNP linkage disequilibrium block (SNPLDB) as multi-allele genomic markers performed the best among the five mapping procedures with software publicly available. It identified the greatest number of quantitative trait loci (QTLs) (139) and alleles (496) on 20 chromosomes covering almost all of the QTLs detected by four other mapping procedures. The RTM-GWAS provided the detected QTLs with highest genetic contribution but without overflowing and missing heritability problems (81.7% genetic contribution vs. heritability of?97.6%), while SNPLDB markers matched the NAM population property of multiple alleles per locus. The 139 QTLs with 496 alleles were organized into a QTL-allele matrix, showing the corresponding DTF genetic architecture of the five parents and the NAM population. All lines and parents comprised both positive and negative alleles, implying a great potential of recombination for early and late DTF improvement. From the detected QTL-allele system, 126 candidate genes were annotated and χ 2 tested as a DTF candidate gene system involving nine biological processes, indicating the trait a complex, involving several biological processes rather than only a handful of major genes.
DOI:10.1007/s00122-018-3174-7URLPMID:30167759 [本文引用: 1]
Eighty-six R1 QTLs accounting for 89.92% phenotypic variance in a soybean RIL population were identified using RTM-GWAS with SNPLDB marker which performed superior over CIM and MLM-GWAS with BIN/SNPLDB marker. A population (NJRIKY) composed of 427 recombinant inbred lines (RILs) derived from Kefeng-1?×?NN1138-2 (MGII?×?MGV, MG maturity group) was applied for detecting flowering date (R1) quantitative trait locus (QTL) system in soybean. From a low-depth re-sequencing (~?0.75?×), 576,874 SNPs were detected and organized into 4737 BINs (recombination breakpoint determinations) and 3683 SNP linkage disequilibrium blocks (SNPLDBs), respectively. Using the association mapping procedures &quot;Restricted Two-stage Multi-locus Genome-wide Association Study&quot; (RTM-GWAS), &quot;Mixed Linear Model Genome-wide Association Study&quot; (MLM-GWAS) and the linkage mapping procedure &quot;Composite Interval Mapping&quot; (CIM), 67, 36 and 10 BIN-QTLs and 86, 14 and 23 SNPLDB-QTLs were detected with their phenotypic variance explained (PVE) 88.70-89.92% (within heritability 98.2%), 146.41-353.62% (overflowing) and 88.29-172.34% (overflowing), respectively. The RTM-GWAS with SNPLDBs which showed to be more efficient and reasonable than the others was used to identify the R1 QTL system in NJRIKY. The detected 86 SNPLDB-QTLs with their PVE from 0.02 to 30.66% in a total of 89.92% covered 51 out of 104 R1 QTLs in 18 crosses in SoyBase and 26 out of 139 QTLs in a nested association mapping population, while the rest 29 QTLs were novel ones. From the QTL system, 52 candidate genes were annotated, including the verified gene E1, E2, E9 and J, and grouped into 3 categories of biological processes, among which 24 genes were enriched into three protein-protein interaction networks, suggesting gene networks working together. Since NJRIKY involves only MGII and MGV, the QTL/gene system among MG000-MGX should be explored further.
[D].
[本文引用: 1]
[D].
[本文引用: 1]
DOI:10.1101/gr.115402.110URLPMID:21233398 [本文引用: 1]
We present a new approach to genotyping based on multiplexed shotgun sequencing that can identify recombination breakpoints in a large number of individuals simultaneously at a resolution sufficient for most mapping purposes, such as quantitative trait locus (QTL) mapping and mapping of induced mutations. We first describe a simple library construction protocol that uses just 10 ng of genomic DNA per individual and makes the approach accessible to any laboratory with standard molecular biology equipment. Sequencing this library results in a large number of sequence reads widely distributed across the genomes of multiplexed bar-coded individuals. We develop a Hidden Markov Model to estimate ancestry at all genomic locations in all individuals using these data. We demonstrate the utility of the approach by mapping a dominant marker allele in D. simulans to within 105 kb of its true position using 96 F1-backcross individuals genotyped in a single lane on an Illumina Genome Analyzer. We further demonstrate the utility of our method by genetically mapping more than 400 previously unassembled D. simulans contigs to linkage groups and by evaluating the quality of targeted introgression lines. At this level of multiplexing and divergence between strains, our method allows estimation of recombination breakpoints to a median of 38-kb intervals. Our analysis suggests that higher levels of multiplexing and/or use of strains with lower levels of divergence are practicable.
DOI:10.1093/bioinformatics/btp336URLPMID:19497933 [本文引用: 1]
SOAP2 is a significantly improved version of the short oligonucleotide alignment program that both reduces computer memory usage and increases alignment speed at an unprecedented rate. We used a Burrows Wheeler Transformation (BWT) compression index to substitute the seed strategy for indexing the reference sequence in the main memory. We tested it on the whole human genome and found that this new algorithm reduced memory usage from 14.7 to 5.4 GB and improved alignment speed by 20-30 times. SOAP2 is compatible with both single- and paired-end reads. Additionally, this tool now supports multiple text and compressed file formats. A consensus builder has also been developed for consensus assembly and SNP detection from alignment of short reads on a reference genome.
[本文引用: 1]
DOI:10.1126/science.1190371URLPMID:20595611 [本文引用: 1]
Residents of the Tibetan Plateau show heritable adaptations to extreme altitude. We sequenced 50 exomes of ethnic Tibetans, encompassing coding sequences of 92% of human genes, with an average coverage of 18x per individual. Genes showing population-specific allele frequency changes, which represent strong candidates for altitude adaptation, were identified. The strongest signal of natural selection came from endothelial Per-Arnt-Sim (PAS) domain protein 1 (EPAS1), a transcription factor involved in response to hypoxia. One single-nucleotide polymorphism (SNP) at EPAS1 shows a 78% frequency difference between Tibetan and Han samples, representing the fastest allele frequency change observed at any human gene to date. This SNP's association with erythrocyte abundance supports the role of EPAS1 in adaptation to hypoxia. Thus, a population genomic survey has revealed a functionally important locus in genetic adaptation to high altitude.
DOI:10.1086/502802URLPMID:16532393 [本文引用: 1]
We present a statistical model for patterns of genetic variation in samples of unrelated individuals from natural populations. This model is based on the idea that, over short regions, haplotypes in a population tend to cluster into groups of similar haplotypes. To capture the fact that, because of recombination, this clustering tends to be local in nature, our model allows cluster memberships to change continuously along the chromosome according to a hidden Markov model. This approach is flexible, allowing for both &quot;block-like&quot; patterns of linkage disequilibrium (LD) and gradual decline in LD with distance. The resulting model is also fast and, as a result, is practicable for large data sets (e.g., thousands of individuals typed at hundreds of thousands of markers). We illustrate the utility of the model by applying it to dense single-nucleotide-polymorphism genotype data for the tasks of imputing missing genotypes and estimating haplotypic phase. For imputing missing genotypes, methods based on this model are as accurate or more accurate than existing methods. For haplotype estimation, the point estimates are slightly less accurate than those from the best existing methods (e.g., for unrelated Centre d'Etude du Polymorphisme Humain individuals from the HapMap project, switch error was 0.055 for our method vs. 0.051 for PHASE) but require a small fraction of the computational cost. In addition, we demonstrate that the model accurately reflects uncertainty in its estimates, in that probabilities computed using the model are approximately well calibrated. The methods described in this article are implemented in a software package, fastPHASE, which is available from the Stephens Lab Web site.
DOI:10.1093/bib/bbn017URLPMID:18417537 [本文引用: 1]
The Molecular Evolutionary Genetics Analysis (MEGA) software is a desktop application designed for comparative analysis of homologous gene sequences either from multigene families or from different species with a special emphasis on inferring evolutionary relationships and patterns of DNA and protein evolution. In addition to the tools for statistical analysis of data, MEGA provides many convenient facilities for the assembly of sequence data sets from files or web-based repositories, and it includes tools for visual presentation of the results obtained in the form of interactive phylogenetic trees and evolutionary distance matrices. Here we discuss the motivation, design principles and priorities that have shaped the development of MEGA. We also discuss how MEGA might evolve in the future to assist researchers in their growing need to analyze large data set using new computational methods.
DOI:10.32687/0869-866X-2019-27-3-286-289URLPMID:31251864 [本文引用: 1]
On the basis of official statistics of 1995-2014 a comparative analysis of the dynamics of stillbirths of boys and girls in the Bryansk region and the Russian Federation was carried out. The study established exceeding of rate of stillbirths in boys over stillbirths in girls at 14.4% and 9.0% correspondingly both in the Bryansk Oblast and the Russian Federation that confirms the global trend of higher risk of stillbirth in boys by approximately to 10%. In case the stillbirth rate in the Bryansk Oblast will proceed established trend the ratio of stillbirths will increase relatively to the nationwide values in 2016 - 2021 and will reach 30% in 2021. At that, the gap between indices of boys and girls will increase up to 32,8%.
DOI:10.1186/s12864-018-4558-4URLPMID:29490606 [本文引用: 1]
To continue to meet the increasing demands of soybean worldwide, it is crucial to identify key genes regulating flowering and maturity to expand the cultivated regions into short season areas. Although four soybean genes have been successfully utilized in early maturity breeding programs, new genes governing maturity are continuously being identified suggesting that there remains as yet undiscovered loci governing agronomic traits of interest. The objective of this study was to identify novel loci and genes involved in a diverse set of early soybean maturity using genome-wide association (GWA) analyses to identify loci governing days to maturity (DTM), flowering (DTF) and pod filling (DTPF), as well as yield and 100 seed weight in Canadian environments. To do so, soybean plant introduction lines varying significantly for maturity, but classified as early varieties, were used. Plants were phenotyped for the five agronomic traits for five site-years and GWA approaches used to identify candidate loci and genes affecting each trait.
DOI:10.1038/srep20728URLPMID:26856884 [本文引用: 1]
Domestication of soybeans occurred under the intense human-directed selections aimed at developing high-yielding lines. Tracing the domestication history and identifying the genes underlying soybean domestication require further exploration. Here, we developed a high-throughput NJAU 355?K SoySNP array and used this array to study the genetic variation patterns in 367 soybean accessions, including 105 wild soybeans and 262 cultivated soybeans. The population genetic analysis suggests that cultivated soybeans have tended to originate from northern and central China, from where they spread to other regions, accompanied with a gradual increase in seed weight. Genome-wide scanning for evidence of artificial selection revealed signs of selective sweeps involving genes controlling domestication-related agronomic traits including seed weight. To further identify genomic regions related to seed weight, a genome-wide association study (GWAS) was conducted across multiple environments in wild and cultivated soybeans. As a result, a strong linkage disequilibrium region on chromosome 20 was found to be significantly correlated with seed weight in cultivated soybeans. Collectively, these findings should provide an important basis for genomic-enabled breeding and advance the study of functional genomics in soybean.
DOI:10.1371/journal.pone.0171105URLPMID:28152092 [本文引用: 1]
Mapping quantitative trait loci through the use of linkage disequilibrium (LD) in populations of unrelated individuals provides a valuable approach for dissecting the genetic basis of complex traits in soybean (Glycine max). The haplotype-based genome-wide association study (GWAS) has now been proposed as a complementary approach to intensify benefits from LD, which enable to assess the genetic determinants of agronomic traits. In this study a GWAS was undertaken to identify genomic regions that control 100-seed weight (SW), plant height (PH) and seed yield (SY) in a soybean association mapping panel using single nucleotide polymorphism (SNP) markers and haplotype information. The soybean cultivars (N = 169) were field-evaluated across four locations of southern Brazil. The genome-wide haplotype association analysis (941 haplotypes) identified eleven, seventeen and fifty-nine SNP-based haplotypes significantly associated with SY, SW and PH, respectively. Although most marker-trait associations were environment and trait specific, stable haplotype associations were identified for SY and SW across environments (i.e., haplotypes Gm12_Hap12). The haplotype block 42 on Chr19 (Gm19_Hap42) was confirmed to be associated with PH in two environments. These findings enable us to refine the breeding strategy for tropical soybean, which confirm that haplotype-based GWAS can provide new insights on the genetic determinants that are not captured by the single-marker approach.
DOI:10.1007/s00122-015-2614-xURLPMID:26518570 [本文引用: 1]
Twenty-two loci for soybean SW and candidate genes conditioning seed development were identified; and prediction accuracies of GS and MAS were estimated through cross-validation and validation with unrelated populations. Soybean (Glycine max) is a major crop for plant protein and oil production, and seed weight (SW) is important for yield and quality in food/vegetable uses of soybean. However, our knowledge of genes controlling SW remains limited. To better understand the molecular mechanism underlying the trait and explore marker-based breeding approaches, we conducted a genome-wide association study in a population of 309 soybean germplasm accessions using 31,045 single nucleotide polymorphisms (SNPs), and estimated the prediction accuracy of genomic selection (GS) and marker-assisted selection (MAS) for SW. Twenty-two loci of minor effect associated with SW were identified, including hotspots on Gm04 and Gm19. The mixed model containing these loci explained 83.4% of phenotypic variation. Candidate genes with Arabidopsis orthologs conditioning SW were also proposed. The prediction accuracies of GS and MAS by cross-validation were 0.75-0.87 and 0.62-0.75, respectively, depending on the number of SNPs used and the size of training population. GS also outperformed MAS when the validation was performed using unrelated panels across a wide range of maturities, with an average prediction accuracy of 0.74 versus 0.53. This study convincingly demonstrated that soybean SW is controlled by numerous minor-effect loci. It greatly enhances our understanding of the genetic basis of SW in soybean and facilitates the identification of genes controlling the trait. It also suggests that GS holds promise for accelerating soybean breeding progress. The results are helpful for genetic improvement and genomic prediction of yield in soybean.
