 ,1, 赵晋铭1, 王吴彬1, 邢光南1, 喻德跃1, 张小燕3, 李春燕3, 陈受宜2, 盖钧镒,11
 2
3
Detection Power of RTM-GWAS Applied to 100-Seed Weight QTL Identification in a Recombinant Inbred Lines Population of Soybean
PAN LiYuan1, HE JianBo,1, ZHAO JinMing1, WANG WuBin1, XING GuangNan1, YU DeYue1, ZHANG XiaoYan3, LI ChunYan3, CHEN ShouYi2, GAI JunYi,1通讯作者:
责任编辑: 李莉
收稿日期:2019-08-24接受日期:2020-01-2网络出版日期:2020-05-16
| 基金资助: |
Received:2019-08-24Accepted:2020-01-2Online:2020-05-16
作者简介 About authors
潘丽媛,E-mail:panly89@126.com。

摘要
关键词:
Abstract
Keywords:
PDF (1349KB)元数据多维度评价相关文章导出EndNote|Ris|Bibtex收藏本文
本文引用格式
潘丽媛, 贺建波, 赵晋铭, 王吴彬, 邢光南, 喻德跃, 张小燕, 李春燕, 陈受宜, 盖钧镒. RTM-GWAS方法应用于大豆RIL群体百粒重QTL检测的功效[J]. 中国农业科学, 2020, 53(9): 1730-1742 doi:10.3864/j.issn.0578-1752.2020.09.004
PAN LiYuan, HE JianBo, ZHAO JinMing, WANG WuBin, XING GuangNan, YU DeYue, ZHANG XiaoYan, LI ChunYan, CHEN ShouYi, GAI JunYi.
0 引言
【研究意义】大豆是人类植物蛋白和脂肪的主要食物来源[1],产量一直是大豆生产发展的关注点,而百粒重是大豆产量构成的重要因子,一般与产量呈正相关[2]。百粒重作为数量性状,具有复杂的遗传基础,而现有的连锁定位方法,仅能定位到少数几个位点,限制了其遗传体系的全面解析,需要高效的定位方法进行全基因组QTL检测以全面解析其遗传基础。【前人研究进展】前人基于连锁定位的复合区间作图法(composite interval mapping,CIM)[3]对多个双亲群体进行了百粒重性状的QTL定位分析。目前,SoyBase数据库(https://www.soybase.org/,截至2017年3月)已经收录了基于40个不同群体、利用不同定位方法检测到的250个大豆百粒重QTL。最近,FUJII等[4]利用一个包含181个家系的重组自交系群体(recombinant inbred line,RIL),在2个环境下利用CIM方法共检测到5个百粒重QTL,分布于第12、13、17和20等4条染色体上。ZHANG等[5]通过半野生豆花皮豆(Huapidou)和一个栽培豆齐黄26(Qihuang26)衍生的RIL群体,利用完备区间作图法(inclusive composite interval mapping,ICIM)和CIM分别检测到10个和5个百粒重QTL。由于连锁定位往往仅能定位到少数几个大效应位点,并且置信区间较大,不利于进一步筛选候选基因。现今,众多研究者通过关联分析的方法,利用自然群体进行大豆百粒重遗传解析[6,7,8,9,10,11,12,13]。COPLEY等[14]利用86个早熟组(MG 000—MG 00)大豆材料在2个环境下仅检测到5个百粒重QTL。JING等[15]通过由地方种质和育成品种构成的包含185个大豆材料的自然群体检测到20个与百粒重关联的SNP位点,其中11个SNP连续分布在同一基因组区域。为了解决现有GWAS方法中遗传率缺失(missing heritability)和自然群体中的复等位变异问题,HE等[16]开发了一种新的限制性两阶段多位点关联分析方法(restricted two-stage multi-locus genome- wide association study,RTM-GWAS),该方法通过遗传率控制位点的总表型变异解释率,利用二阶段方法和多位点模型提高了检测功效,并成功应用于多个自然群体和多亲本群体[17,18,19,20,21,22]。【本研究切入点】利用连锁定位方法检测到的大豆百粒重QTL较少,表型变异解释率丢失较多。而随着分子标记信息的加密,关联分析的精度提高,并且双亲群体中的群体结构简单[23],前人已多次成功将关联分析方法应用于双亲群体中[24,25,26],选择高效的关联分析方法有助于大豆百粒重数量性状遗传基础的全面解析,可为揭示其完整基因体系提供支持。【拟解决的关键问题】本研究基于科丰1号×南农1138-2衍生的重组自交系NJRIKY群体,利用3个环境下的大豆百粒重表型数据和3 683个SNPLDB标记,使用CIM、MLM-GWAS和RTM-GWAS 3种定位方法检测百粒重QTL,以QTL数目及总的表型变异解释率判定其检测功效,筛选最佳定位方法,进一步解析NJRIKY群体中百粒重的全基因组QTL体系及候选基因体系。1 材料与方法
1.1 供试材料
以栽培大豆科丰1号和南农1138-2为母本和父本,衍生了一个含有427个家系的重组自交系(recombinant inbred line,RIL)群体。群体命名为NJRIKY,由两部分组成;其中184个家系创制于1994年夏,F2世代采用单粒传法繁代,F3-F7家系内混合收获播种,F7家系内随机收获1株,种植F2:8世代,最终经过群体校正后获得;另外243个家系采用同样方法获得[27]。亲本科丰1号来自黄淮海二熟制春夏作大豆品种生态区,由中科院遗传研究所选育,熟期组为MG II,黑色种皮;亲本南农1138-2来自长江中下游二熟制春夏作大豆品种生态区,由南京农业大学选育,熟期组为MG V,黄色种皮[28]。1.2 田间试验
NJRIKY群体及亲本,2012—2013年夏季于江苏省南京市南京农业大学江浦试验站(32.07°N, 118.62°E)和2013年夏季于山东省济宁市圣丰试验站(36.67°N,116.98°E)3个环境进行田间试验。3个环境分别简称为12JP、13JP和13SF,代表2012年江浦试验站、2013年江浦试验站和2013年圣丰试验站。田间试验均采用立方格子设计,每个环境3次重复,江浦试验站采用穴播,两穴一个小区,穴距为0.7 m×0.8 m,每穴定苗6株;圣丰试验站采用行播,行长2 m,行距0.5 m,常规田间管理,籽粒成熟后按小区分别收获脱粒,并在35—40℃条件下烘干至恒重,取100个完整籽粒置于精度0.01 g天平称量记录。1.3 标记分型
利用427家系及2个亲本的新鲜幼嫩叶片采用CTAB法[29]提取DNA,建库并利用Illumina Hiseq2000进行双端测序,通过与参考基因组Williams82 v1.1比对获得SNP。按照缺失≤20%、错误率≤1%和杂合率<5%的标准过滤获得39 353个高质量SNP。利用NPUTE[30]对SNP缺失基因型进行填补,用于SNPLDB(SNP linkage disequilibrium block)标记构建[25]。利用贺建波等[16]开发的RTM-GWAS软件,根据双亲带型划分SNPLDB标记,设置的最大窗口为200 kb使用默认设置的置信区间法定义区段,计算标记间的LD(D’),若95%以上的SNP的D’值位于0.70—0.98,则说明具有强LD水平,则被划分到一个单体型区块中,这样全基因组的SNP被划分为SNP连锁不平衡区块(SNP linkage disequilibrium block,SNPLDB)。根据双亲带型进行SNPLDB基因型分型,少量非亲本单体型被与其最相似的亲本单体型替换,最终获得3 683个SNPLDB标记用于遗传图谱构建及QTL定位[25]。1.4 表型数据分析
采用SAS软件PROC GLM进行多环境下表型数据的联合方差分析,同时利用PROC MIXED的REML方法估计方差组分,根据$h^2=\sigma_g^2/(\sigma_g^2+\sigma_{ge}^2/n+\sigma^2/rn)$和$h^2=\sigma_g^2/(\sigma_g^2+\sigma^2/r)$分别估计多环境和单环境下的性状遗传率,遗传变异系数(genotypic coefficient of variation,GCV)为100×σg/μ,其中$\sigma_g^2$为遗传方差,$\sigma_{ge}^2$为基因型与环境互作方差,$\sigma^2$为误差方差,n为环境的个数,r为一个环境内的试验重复数,μ为整体平均数。1.5 QTL定位方法
利用3种方法进行NJRIKY群体的百粒重QTL定位,分别为复合区间作图法(CIM)[3]、混合线性模型全基因组关联分析方法(mixed linear model GWAS或MLM-GWAS)[31]、限制性两阶段多位点全基因组关联分析方法(RTM-GWAS)[16]。CIM方法应用Windows QTL Cartographer V2.5软件,表型数据为多环境下各家系百粒重均值,前景及背景选择的显著水平为0.05,步长为1 cM,并进行排列测验1 000次,确定QTL检测LOD阈值。
MLM-GWAS方法[31]应用TASSEL 3.0软件[32],表型数据为多环境下各家系百粒重均值,参数设定为默认参数,采用5个主成分(principal component,P)和个体间亲缘关系(kinship,K)矩阵,即P+K模型的MLM进行关联分析,并利用R软件fdrtool包[33]进行假发现率(false discovery rate,FDR)多重测验校正,显著水平为0.05。
RTM-GWAS方法利用限制性二阶段多位点全基因组关联分析方法(RTM-GWAS)软件[16]进行QTL定位,表型数据为多环境小区原始观测值,显著水平设为0.05,分析模型同时考虑QTL与环境互作效应。根据表型变异解释率(phenotypic variation explained,PVE)大小将QTL分为两类:大贡献(large contribution,LC)主效位点(PVE≥3%);小贡献(small contribution,SC)主效位点(PVE<3%)。
1.6 候选基因体系注释
首先,检测SNPLDB标记(±100 kb)物理区间内的注释基因;然后利用卡平方(χ2)独立性测验,显著水平设为0.05,检测SNPLDB标记与注释基因内SNP之间的相关性。当这二者显著相关时,则该SNP所在的注释基因被确定为候选基因;同时,利用SoyBase数据库(https://www. soybase.org)提取所有注释基因的功能注释(gene ontology,GO),优先选择与籽粒发育相关的注释基因确定为候选基因。同时给出候选基因的功能注释(GO)结果。2 结果
2.1 多环境下NJRIKY群体百粒重变异
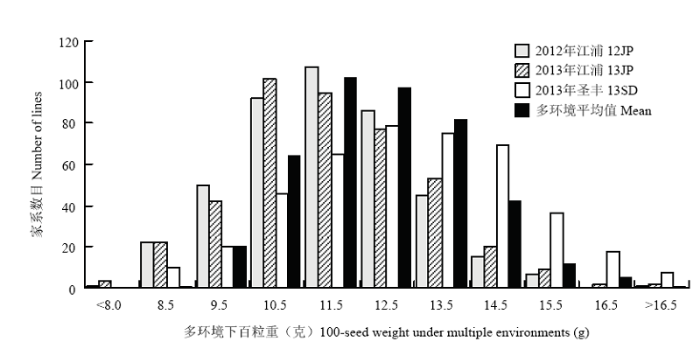
从表1可以看出3个环境下NJRIKY群体的亲本科丰1号和南农1138-2的表型差异较大,多环境平均值分别为9.0和17.9 g,重组自交家系的百粒重变异范围为8.6—17.1 g(图1),遗传变异系数为12.4%,变异范围位于双亲之间。该群体百粒重的遗传率较高,多环境联合下为85.4%,单环境下为92.5%—93.9%。多环境联合方差分析的结果表明家系间、环境间及家系与环境互作的差异均达到极显著水平(表2)。图1
 新窗口打开|下载原图ZIP|生成PPT
图1多环境下NJRIKY群体百粒重的频数分布图
Mean表示各家系3个环境百粒重平均数
Fig. 1Frequency distribution of 100-seed weight in NJRIKY under multiple environments
Mean represents the aveage 100-seed weight of each line across three environments
Table 1
表1
表1多环境下NJRIKY群体百粒重的次数分布和描述统计
Table 1
| 环境 Environment | 亲本 Parent (g) | 重组自交系群体 RIL | |||||
|---|---|---|---|---|---|---|---|
| 科丰1号 Kefeng-1 | 南农1138-2 NN1138-2 | 平均值 Mean | 最小值 Min. | 最大值 Max. | 遗传变异 系数GCV(%) | 遗传率 h2(%) | |
| 12JP | 8.5 | 15.7 | 11.4 | 7.5 | 16.0 | 13.5 | 93.3 |
| 13JP | 8.8 | 14.9 | 11.6 | 7.6 | 20.6 | 15.5 | 92.5 |
| 13SF | 9.8 | 23.2 | 13.9 | 9.2 | 19.5 | 15.1 | 93.9 |
| 平均 Mean | 9.0 | 17.9 | 12.3 | 8.6 | 17.1 | 12.4 | 85.4 |
新窗口打开|下载CSV
Table 2
表2
表2NJRIKY群体多环境联合方差分析结果
Table 2
| 变异来源 Source of variation | 自由度 DF | 均方 MS | F值 F value | P值 P value |
|---|---|---|---|---|
| 环境 Environment | 2 | 2308.47 | 101.66 | <0.0001 |
| 重复(环境)Replication(Environment) | 6 | 20.08 | 12.59 | <0.0001 |
| 区组(环境×重复)Block(Environment×Replication) | 180 | 1.34 | 1.78 | <0.0001 |
| 家系 Line | 426 | 23.66 | 6.81 | <0.0001 |
| 家系×环境 Line×Environment | 851 | 3.50 | 4.67 | <0.0001 |
| 误差 Error | 2245 | 0.75 | ||
| 合计 Total | 3710 |
新窗口打开|下载CSV
2.2 不同定位方法下百粒重QTL检测结果
利用3 683个SNPLDB标记及CIM、MLM-GWAS和RTM-GWAS 3种定位方法对NJRIKY群体的百粒重性状进行QTL定位(表3),并通过QTL的数目和总的表型变异解释率来比较各个方法的检测功效,选取最佳的定位结果进行该群体的百粒重遗传体系解析。Table 3
表3
表3NJRIKY群体中利用不同定位方法检测到的百粒重位点结果概要
Table 3
| 定位方法 Method | 检测的QTL Detected QTLs | 表型变异解释率 PVE (%) | 已报道的QTL Reported QTLs |
|---|---|---|---|
| RTM-GWAS | |||
| Mapped QTL | 57(19) | 70.78 | 41(84) |
| LC major QTL | 5(5) | 23.30 | |
| SC major QTL | 52(19) | 47.48 | |
| QTL×Env. | 20(13) | 4.20 | |
| Unmapped QTL | 14.52 | ||
| CIM | |||
| Mapped QTL | 14(8) | 56.47 | 13(16) |
| MLM-GWAS | |||
| Mapped QTL | 6(3) | 18.47 | 6(18) |
新窗口打开|下载CSV
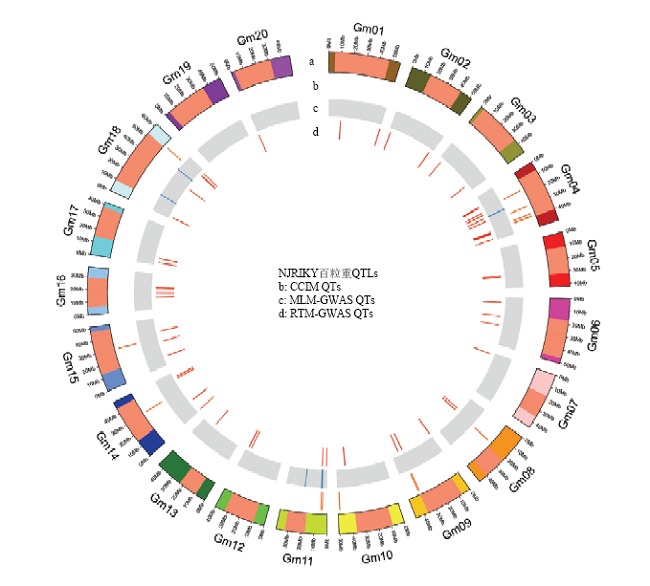
在连锁定位中较为普遍使用的CIM方法下共检测到14个百粒重QTL,分布在8个连锁群上,总表型变异解释率(PVE)为56.47%(图2和表4)。在普遍使用的关联分析方法MLM-GWAS中仅检测到6个QTL,位于3条染色体上,总PVE为18.47%(图2和表4)。利用RTM-GWAS方法,检测到57个百粒重QTL,分布在除Gm19以外的19条染色体上,共解释70.78%的表型变异,结合方差分析估计得到的遗传率为85.4%,剩余14.52%的表型变异来源于未定位到的微效QTL(图2)。其中位于13条染色体上的20个百粒重QTL与环境存在互作效应,共解释4.20%的表型变异(表3和表5)。
图2
 新窗口打开|下载原图ZIP|生成PPT
图23种定位方法下百粒重的QTL全基因组分布图
a:染色体结构,异染色质区域标为浅红色(单位为Mb)
Fig. 2Genome-wide distributions of 100-seed weight QTLs detected by three QTL mapping procedures
a: Chromosome structure with heterochromatin regions in light red color (scale in Mb unit)
Table 4
表4
表4NJRIKY群体中在CIM和MLM-GWAS方法下的百粒重QTL
Table 4
| 标记Marker | LOD/-lgP | 表型变异解释率PVE (%) | SoyBase QTL |
|---|---|---|---|
| CIM | |||
| Gm04_BLOCK_15191938_15271503 | 3.67 | 2.94 | 5-2 |
| Gm04_BLOCK_36700318_36900222 | 3.08 | 2.55 | 36-15 |
| Gm04_BLOCK_39069193_39185415 | 2.93 | 2.37 | 36-15 |
| Gm04_BLOCK_38868989_39068925 | 2.45 | 2.01 | 36-15 |
| Gm04_BLOCK_29674388_29831299 | 1.96 | 1.59 | 20-2 |
| Gm08_BLOCK_19121233_19314940 | 4.11 | 3.41 | 7-1,34-1,34-13,36-1,37-8 |
| Gm09_BLOCK_35812609_35851884 | 6.81 | 5.76 | 40-4 |
| Gm09_36859571 | 6.97 | 5.86 | 40-4 |
| Gm10_BLOCK_49435374_49524464 | 4.44 | 3.69 | |
| Gm11_3955010 | 7.78 | 6.91 | 37-9 |
| Gm11_BLOCK_5228756_5269867 | 12.39 | 11.03 | 21-1 |
| Gm14_BLOCK_29877119_30044908 | 2.36 | 1.90 | 23-1,13-2 |
| Gm15_BLOCK_29781764_29980832 | 3.69 | 2.95 | 6-1,36-12 |
| Gm18_54211355 | 4.12 | 3.50 | 3-3 |
| 总计Total | 56.47 | ||
| MLM-GWAS | |||
| Gm04_BLOCK_23431433_23626782 | 3.72 | 3.36 | 20-2,5-2,36-15,45-3 |
| Gm11_BLOCK_4611160_4662697 | 3.27 | 2.88 | 37-9 |
| Gm11_BLOCK_5228756_5269867 | 4.03 | 3.69 | 37-9,21-1,22-2,49-2 |
| Gm11_20972740 | 3.12 | 2.73 | 21-1,20-4,20-3,11-1,32-1,4-1,10-3,36-11 |
| Gm18_BLOCK_16884478_16885174 | 3.40 | 3.03 | 2-5 |
| Gm18_45987500 | 3.17 | 2.78 | 27-1 |
| 总计Total | 18.47 |
新窗口打开|下载CSV
Table 5
表5
表5NJRIKY群体中与百粒重性状关联的QTL位点
Table 5
| QTL | 标记 Marker | -lgP | 贡献率 R2 (%) | QTL | 标记 Marker | -lgP | 贡献率 R2 (%) | |
|---|---|---|---|---|---|---|---|---|
| Sw-11-2 | Gm11_BLOCK_5228756_5269867 | 56.22 | 7.57* | Sw-05-1 | Gm05_BLOCK_28628661_28825701 | 7.42 | 0.82* | |
| Sw-09-2 | Gm09_BLOCK_34358756_34538440 | 39.72 | 5.12* | Sw-04-1 | Gm04_BLOCK_10110270_10257050 | 6.78 | 0.74 | |
| Sw-04-7 | Gm04_BLOCK_39928569_39957258 | 29.72 | 3.72* | Sw-06-1 | Gm06_BLOCK_5723355_5918489 | 6.58 | 0.71 | |
| Sw-08-1 | Gm08_16468204 | 28.90 | 3.61 | Sw-06-3 | Gm06_30304358 | 6.52 | 0.71* | |
| Sw-10-1 | Gm10_BLOCK_41285429_41285653 | 26.41 | 3.27 | Sw-15-2 | Gm15_25471398 | 6.31 | 0.68 | |
| Sw-18-5 | Gm18_59805347 | 24.23 | 2.98* | Sw-16-5 | Gm16_BLOCK_23266112_23462965 | 5.98 | 0.64 | |
| Sw-13-1 | Gm13_31358574 | 23.33 | 2.86* | Sw-02-1 | Gm02_BLOCK_2190737_2384686 | 5.72 | 0.61* | |
| Sw-17-1 | Gm17_BLOCK_2938402_3123352 | 20.28 | 2.45 | Sw-04-4 | Gm04_BLOCK_19626939_19826251 | 5.51 | 0.59 | |
| Sw-04-9 | Gm04_BLOCK_40868266_40917625 | 19.75 | 2.38 | Sw-03-2 | Gm03_BLOCK_41020781_41042956 | 5.12 | 0.54 | |
| Sw-16-1 | Gm16_BLOCK_12959169_13153966 | 16.33 | 1.94 | Sw-03-1 | Gm03_3970385 | 4.52 | 0.47 | |
| Sw-01-2 | Gm01_BLOCK_55629182_55799927 | 15.79 | 1.87* | Sw-15-3 | Gm15_36895087 | 4.48 | 0.46 | |
| Sw-18-1 | Gm18_BLOCK_1922631_2035120 | 15.72 | 1.86* | Sw-06-2 | Gm06_20892550 | 4.34 | 0.45* | |
| Sw-14-4 | Gm14_BLOCK_44088379_44288183 | 15.18 | 1.79* | Sw-04-2 | Gm04_BLOCK_10815779_11015107 | 3.97 | 0.40 | |
| Sw-14-1 | Gm14_1033115 | 14.10 | 1.65 | Sw-10-3 | Gm10_BLOCK_41542940_41691982 | 3.68 | 0.37 | |
| Sw-07-1 | Gm07_BLOCK_1944869_1966911 | 12.09 | 1.40 | Sw-01-1 | Gm01_BLOCK_12639088_12838656 | 3.65 | 0.36 | |
| Sw-09-1 | Gm09_BLOCK_264001_463636 | 11.95 | 1.38* | Sw-12-2 | Gm12_BLOCK_37972975_37975786 | 3.46 | 0.34* | |
| Sw-15-1 | Gm15_BLOCK_9079223_9250661 | 11.21 | 1.29* | Sw-14-2 | Gm14_BLOCK_13649138_13846641 | 3.19 | 0.31 | |
| Sw-04-8 | Gm04_BLOCK_40184350_40334324 | 10.84 | 1.24 | Sw-14-3 | Gm14_BLOCK_42062012_42261888 | 2.98 | 0.29 | |
| Sw-18-2 | Gm18_36907653 | 10.77 | 1.23 | Sw-04-11 | Gm04_BLOCK_47626591_47646641 | 2.94 | 0.28 | |
| Sw-10-2 | Gm10_41392627 | 10.09 | 1.15 | Sw-16-2 | Gm16_15575581 | 2.92 | 0.28 | |
| Sw-08-2 | Gm08_BLOCK_19121233_19314940 | 9.71 | 1.10 | Sw-04-10 | Gm04_41805915 | 2.65 | 0.25 | |
| Sw-09-3 | Gm09_BLOCK_39036252_39210642 | 9.27 | 1.04 | Sw-16-4 | Gm16_BLOCK_21928405_22126811 | 2.54 | 0.24 | |
| Sw-11-1 | Gm11_BLOCK_767896_842085 | 8.80 | 0.99 | Sw-04-6 | Gm04_BLOCK_26906733_27091677 | 2.54 | 0.24* | |
| Sw-12-1 | Gm12_BLOCK_35239969_35240158 | 8.77 | 0.98 | Sw-18-4 | Gm18_56862453 | 2.13 | 0.19 | |
| Sw-17-2 | Gm17_BLOCK_7387475_7572446 | 8.11 | 0.90* | Sw-04-3 | Gm04_BLOCK_17249185_17373282 | 2.03 | 0.18 | |
| Sw-16-3 | Gm16_BLOCK_17551378_17602014 | 8.03 | 0.89 | Sw-05-2 | Gm05_30058805 | 1.83 | 0.16* | |
| Sw-18-3 | Gm18_BLOCK_56236139_56414021 | 8.00 | 0.89 | Sw-12-3 | Gm12_BLOCK_38208501_38296133 | 1.61 | 0.13* | |
| Sw-02-2 | Gm02_BLOCK_48637411_48823121 | 7.59 | 0.84 | Sw-20-1 | Gm20_236372 | 1.52 | 0.13 | |
| Sw-04-5 | Gm04_BLOCK_23431433_23626782 | 7.59 | 0.84* | 共计Total | 57 | 70.78 |
新窗口打开|下载CSV
遵循常规,以位点前后1 Mb的范围来归并QTL,发现RTM-GWAS方法几乎覆盖了CIM(8个QTL/共14个QTL,PVE=40.85%/总PVE=56.47%)和MLM-GWAS(4个QTL/共6个QTL,PVE=12.96%/总PVE=18.47%)方法的结果,包括位于第11染色体上的效应最大的位点Gm11_BLOCK_5228756_ 5269867,这个位点在3种方法中的表型变异解释率均最大,分别为11.05%(CIM)、3.69%(MLM-GWAS)和7.57%(RTM-GWAS)。
以上3种定位方法的百粒重QTL结果表明,RTM-GWAS方法的检测功效最高,检测到更多的QTL(57 vs. 14和6),解释了更多的表型变异(70.78% vs. 56.47%和18.47%),在NJRIKY群体中检测到了较为全面的百粒重性状的遗传体系,所以将对RTM-GWAS方法检测到的由57个QTL构成的影响NJRIKY群体百粒重性状的遗传体系进行进一步的遗传解析。这里要特别指出,RTM-GWAS还检测到57个QTL中有20个是与环境存在互作(或因环境而波动)的QTL,这是其他2种定位方法所不及的。
2.3 NJRIKY RIL群体中百粒重的QTL及候选基因体系
利用3 683个SNPLDB标记及RTM-GWAS方法对NJRIKY群体百粒重进行全基因QTL检测,第一阶段中,利用一般线性模型(general linear model,GLM)筛选到1 860个候选SNPLDB标记;第二阶段中,多位点模型最终检测到57个与百粒重相关的QTL(图3和表5)。图3
 新窗口打开|下载原图ZIP|生成PPT
图3NJRIKY中百粒重关联分析的曼哈顿图和QQ图
Fig. 3Manhattan and quantile-quantile plots of GWAS for 100-seed weight in NJRIKY population
57个百粒重QTL分布于19条染色体,表型变异解释率变化范围为7.57%—0.13%,其中35个QTL的PVE为0.13%—1.00%,17个为1.00%—3.00%,剩余5个为3.00%—7.57%,表明百粒重作为一个复杂的数量性状,其所包含的位点贡献率变化范围广,不仅仅包含表型变异解释率很大的QTL,还包含更多小贡献率的QTL。
57个QTL构成的调控NJRIKY群体百粒重的QTL体系中,第4染色体包含的QTL数目最多,共14个QTL,第20染色体包含的QTL最少,仅为1个QTL。Sw-11-2、Sw-09-2、Sw-04-7、Sw-08-1、Sw-10-1分别解释了7.57%、5.12%、3.72%和3.61%的表型变异(phenotypic variation,PV),为大贡献主效QTL,共解释了23.30%的PV,剩余52个小贡献主效QTL共解释了47.48%的PV。NJRIKY群体的QTL体系中41个QTL与SoyBase中收录的包含52个亲本的30个双亲群体中检测到的81个QTL(共250个QTL)的位置一致(表3)。
RTM-GWAS在3个环境下还检测到20个QTL与环境存在互作效应,其中,3个位于第4、9和11染色体的大贡献主效QTL和17个位于12条染色体上的小贡献主效QTL(表5)。
通过RTM-GWAS方法对NJRIKY群体的百粒重性状进行较为全面的检测后,基于高密度的遗传标记,进一步推断其候选基因体系。通过SNPLDB标记与预测基因内的SNP进行χ2检验,共在57个QTL中检测到36个候选基因解释了54.12%的PV,其中4个候选基因来自4个大贡献主效QTL,剩余32个候选基因来自32个小贡献主效位点,还有20个QTL中未检测到符合条件的候选基因(存在2个QTL的候选基因相同)(表6)。通过GO注释可以看出13个候选基因与籽粒发育相关,剩余的候选基因的功能变化丰富,包含了转运、蛋白糖基化、转录调节因子、脱落酸响应等,表明这些候选基因通过不同生物途径共同调控百粒重性状的表达。
Table 6
表6
表6RTM-GWAS方法中检测到的与百粒重相关的候选基因体系
Table 6
| QTL | 解释率 R2 (%) | 候选基因 Candidate gene | SNP数目 No. of SNPs | GO注释 GO description |
|---|---|---|---|---|
| Sw-01-2 | 1.87 | Glyma01g45220 | 6 | 胚胎发育Embryo Development |
| Sw-02-1 | 0.61 | Glyma02g02860 | 1 | PSII相关的光收集复合物II过程PSII associated light-harvesting complex II process |
| Sw-02-2 | 0.84 | Glyma02g43960 | 2 | 种子休眠时胚胎发育终止Embryo development ending in seed dormancy |
| Sw-03-1 | 0.47 | Glyma03g04020 | 1 | 多糖分解过程Polysaccharide catabolic process |
| Sw-03-2 | 0.54 | Glyma03g33360 | 1 | 麦芽糖代谢过程Maltose metabolic process |
| Sw-04-1 | 0.74 | Glyma04g11582 | 1 | 转运Transport |
| Sw-04-7 | 3.72 | Glyma04g34070 | 1 | 响应镉离子Response to cadmium- ion |
| Sw-04-9 | 2.38 | Glyma04g34660 | 1 | 脂肪酸代谢过程Fatty acid catabolic process |
| Sw-04-10 | 0.25 | Glyma04g35511 | 1 | 转录的调节,依赖DNA Regulation of transcription, DNA-dependent |
| Sw-04-11 | 0.28 | Glyma04g41810 | 2 | 蛋白质糖基化Protein glycosylation |
| Sw-05-1 | 0.82 | Glyma05g23100 | 1 | |
| Sw-06-1 | 0.71 | Glyma06g07880 | 2 | 种子休眠时胚胎发育终止Embryo development ending in seed dormancy |
| Sw-07-1 | 1.40 | Glyma07g02940 | 3 | ATP分解过程ATP catabolic process |
| Sw-08-1 | 3.61 | Glyma08g21620 | 3 | 分生组织生长调节Regulation of meristem growth |
| Sw-08-2 | 1.10 | Glyma08g24950 | 1 | 细胞生长Cell growth |
| Sw-09-1 | 1.38 | Glyma09g00430 | 4 | 响应脱落酸Response to abscisic acid stimulus |
| Sw-09-3 | 1.04 | Glyma09g32540 | 2 | 毒素分解过程Toxin catabolic process |
| Sw-10-1, | 3.27 | Glyma10g32920 | 2 | 种子发育Seed development |
| Sw-10-2 | 1.15 | 2 | ||
| Sw-10-3 | 0.37 | Glyma10g33160 | 1 | 花器官的形成Floral organ formation |
| Sw-11-1 | 0.99 | Glyma11g01405 | 4 | 鸟苷四磷酸代谢过程Guanosine tetraphosphate metabolic process |
| Sw-11-2 | 7.57 | Glyma11g07430 | 1 | 葡糖醛酸木聚糖代谢过程Glucuronoxylan metabolic process |
| Sw-12-1 | 0.98 | Glyma12g31670 | 2 | 细胞过程规则Abaxial cell fate specification |
| Sw-12-3 | 0.13 | Glyma12g35020 | 4 | 转录正调控Positive regulation of transcription |
| Sw-13-1 | 2.86 | Glyma13g28260 | 1 | |
| Sw-14-1 | 1.65 | Glyma14g01790 | 1 | 多糖生物合成过程Polysaccharide biosynthetic process |
| Sw-14-3 | 0.29 | Glyma14g33820 | 1 | 花发育调节作用Regulation of flower development |
| Sw-14-4 | 1.79 | Glyma14g35260 | 1 | 核转录mRNA分解代谢过程Nuclear-transcribed mRNA catabolic process |
| Sw-15-1 | 1.29 | Glyma15g12410 | 4 | 蛋白质糖基化Protein glycosylation |
| Sw-16-5 | 0.64 | Glyma16g20730 | 1 | 过渡金属离子转运Transition metal ion transport |
| Sw-17-1 | 2.45 | Glyma17g04360 | 1 | |
| Sw-17-2 | 0.90 | Glyma17g09961 | 3 | |
| Sw-18-1 | 1.86 | Glyma18g02940 | 1 | 转录调控Regulation of transcription |
| Sw-18-3 | 0.89 | Glyma18g46517 | 2 | |
| Sw-18-4 | 0.19 | Glyma18g47240 | 1 | 表皮细胞分裂调节Regulation of epidermal cell division |
| Sw-18-5 | 2.98 | Glyma18g50760 | 3 | 多糖生物合成过程Polysaccharide biosynthetic process |
| Sw-20-1 | 0.13 | Glyma20g00565 | 4 | |
| 共计Total | 54.12 | 36 |
新窗口打开|下载CSV
3 讨论
3.1 高效的RTM-GWAS方法适用于双亲群体的QTL定位
随着测序技术的快速发展,植物生物学家的研究重心逐渐从少数基因功能向挖掘调控目标性状的全面基因体系和基因网络转移[34]。前人结果表明,RTM-GWAS方法适用于自然群体和巢式关联群体的数量性状全基因组位点检测[16-17, 19]。本研究在3种不同的QTL方法中,RTM-GWAS几乎覆盖了其他方法(CIM和MLM-GWAS)检测到的所有QTL。RTM-GWAS检测到较多的QTL(57个QTL)解释了更多的表型变异(70.78%),而在CIM和MLM-GWAS检测到的QTL仅解释了56.47%和18.47%的表型变异。由于双亲群体中不存在复杂的群体结构问题,将关联分析的方法应用到双亲群体中,提高了检测精度,将大大加快双亲群体数量性状的遗传体系的全面解析。另外,利用RTM-GWAS方法,由于其通过遗传率控制了位点的总表型变异解释率,利用二阶段和多位点模型提高了检测功效,仅利用一个双亲群体就检测到了41个QTL与已报道的52个大豆材料中的81个QTL位置一致,并且13个候选基因与籽粒发育相关,表明RTM-GWAS方法在双亲群体RIL群体中QTL定位表现高效,适用于双亲群体的QTL定位。3.2 大豆百粒重性状的遗传体系
大豆是人类重要的植物蛋白和油脂的食物来源,大豆百粒重与产量的直接相关[2],直接决定了大豆百粒重性状的重要性。前人已经通过不同类型的群体对大豆百粒重的遗传体系进行了研究[18, 35],本研究利用RTM-GWAS方法在亲本具有较大差异的NJRIKY群体中检测到57个百粒重相关联的QTL,其中16个QTL是该群体检测到的新位点,Sw-09-2的PVE达到5.12%。5个大效应主效QTL中,Sw-11-2的贡献率最高为7.57%,其位置与SoyBase中的seed weight 21-1、seed weight 22-2和seed weight 49-2一致,其中seed weight 21-1和seed weight 22-2来源于科丰1号和南农1138-2的184个家系后代群体[36,37],QTL区间较大(5 132 968—6 184 217 bp),群体扩大及标记加密后,SNPLDB的位置为5 228 756-5 269 867 bp。Sw-04-7的贡献率为3.71%,与已报道的seed weight 36-15和seed weight 45-3位于相近位置。Sw-08-1的PVE为3.60%,与已报道的3个QTL位置相近,其中seed weight 22-1的定位群体为NJRIKY群体的184个家系。Sw-10-1的贡献率为3.27%,与seed weight 34-8和seed weight 25-4[38,39]的位置相近,这两个已报道位点的标记区间极大,约7 Mb,可能是定位的群体大小及标记密度的影响。其他小贡献主效QTL中也不乏被多个群体多次定位到的位点,如Sw-15-2的贡献率在本群体中仅为0.68%,其与SoyBase中的7个双亲群体中的8个QTL位置相近。NJRIKY群体中检测到36个候选基因中,13个候选基因与籽粒发育相关。其中2个候选基因Glyma10g32920、Glyma08g21620分别来自2个大贡献主效QTL——Sw-10-1和Sw-08-1,剩余11个候选基因来自11个小贡献主效位点。如,Sw-01-2(PVE=1.87%)的候选基因Glyma01g45220与胚发育相关,其在拟南芥中的同源基因AT1G50030表达产物为TOR蛋白,直接调控了植物的胚生长发育和逆境响应[40]。具有不同功能的候选基因,共同调控了复杂的百粒重性状的表达,而现今的研究还具有局限性,包括材料的限制等,因此,综合越来越多的群体中百粒重性状的结果,结合高效的QTL定位方法,为全面解析基因体系及网络提供了必要基础。
4 结论
NJRIKY RIL群体中,双亲的百粒重差异较大,适用于百粒重性状的遗传解析。利用3种定位方法,在3个环境下,RTM-GWAS方法定位到的QTL更多,表型变异解释率更高,其检测功效优于其他2种方法(CIM和MLM-GWAS)。通过RTM-GWAS定位到57个百粒重QTL构成了NJRIKY群体的百粒重遗传体系,表明高效的QTL定位方法将加快全面解析复杂的百粒重性状的遗传体系。参考文献 原文顺序
文献年度倒序
文中引用次数倒序
被引期刊影响因子
DOI:10.1002/(SICI)1097-0215(19960904)67:5&lt;681::AID-IJC15&gt;3.0.CO;2-8URLPMID:8782658 [本文引用: 1]

cis-diamminedichloroplatinum (II) (CDDP) has been used both alone and in combination with other chemotherapeutics for cancer chemotherapy. Although CDDP acts primarily on DNA, it can also act at the tumor-cell membrane to inhibit methionine transport. The latter mechanism of CDDP is reported to have an important role as a chemical modulator in enhancing chemotherapeutic effects of 5-fluorouracil in tumor cells. We report here the effects of CDDP on methionine uptake in an in vivo brain-tumor model. C6 brain-tumor cells were stereotactically inoculated in the right basal ganglia of 6-week-old male Sprague-Dawley rats. Ten days after the inoculation, autoradiographic images were obtained using (14C-methyl)-L-methionine. The tracer uptake, represented as differential absorption ratio (DAR) and an acid-insoluble fraction (AIF), was measured in both brain tumors and normal brain with or without an intravenous injection of CDDP. The tumor/non-tumor DAR and AIF decreased significantly (P &lt; 0.01, as determined by the Mann-Whitney U-test) after CDDP treatment, whereas the non-tumor DAR and AIF remained almost unchanged. These findings indicate that CDDP inhibits methionine uptake selectively in brain-tumor tissue and may therefore be a potent chemical modulator in the chemotherapy of brain tumors.
[本文引用: 2]
URLPMID:8013918 [本文引用: 2]
Adequate separation of effects of possible multiple linked quantitative trait loci (QTLs) on mapping QTLs is the key to increasing the precision of QTL mapping. A new method of QTL mapping is proposed and analyzed in this paper by combining interval mapping with multiple regression. The basis of the proposed method is an interval test in which the test statistic on a marker interval is made to be unaffected by QTLs located outside a defined interval. This is achieved by fitting other genetic markers in the statistical model as a control when performing interval mapping. Compared with the current QTL mapping method (i.e., the interval mapping method which uses a pair or two pairs of markers for mapping QTLs), this method has several advantages. (1) By confining the test to one region at a time, it reduces a multiple dimensional search problem (for multiple QTLs) to a one dimensional search problem. (2) By conditioning linked markers in the test, the sensitivity of the test statistic to the position of individual QTLs is increased, and the precision of QTL mapping can be improved. (3) By selectively and simultaneously using other markers in the analysis, the efficiency of QTL mapping can be also improved. The behavior of the test statistic under the null hypothesis and appropriate critical value of the test statistic for an overall test in a genome are discussed and analyzed. A simulation study of QTL mapping is also presented which illustrates the utility, properties, advantages and disadvantages of the method.
DOI:10.1270/jsbbs.17098URLPMID:29875601 [本文引用: 1]
Single seed weight (SSW), or seed size, is a seed yield components (SYC) in soybean, and it is suggested that the genetic factors regulating SSW are involved in the control of other SYCs. The quantitative trait loci (QTLs) for SSW and their effects on the other SYCs were investigated using a recombinant inbred line population derived from typical small- and large-seeded cultivars that were cultivated in two different environments. QTL analysis detected four environmentally stable QTLs for SSW, two of which coincided with the defined loci, qSw17-1 and Ln. The effects of the other loci, qSw12-1 and qSw13-1, were confirmed by analyzing residual heterozygous line progenies derived from the recombinant population. These four QTL regions were also involved in the control of an additional SYC, namely the large-seeded allele at each locus that reduced either the number of pods per plant or the number of ovules per pod. These results suggest the presence of at least two different regulatory mechanisms for SSW. Isolation of genes responsible for these QTLs provides an important tool in the understanding and utilization of SSW diversity for soybean breeding.
DOI:10.1186/s12864-018-5035-9URLPMID:30157757 [本文引用: 1]
Soybean is not only an important oil crop, but also an important source of edible protein and industrial raw material. Yield-traits and quality-traits are increasingly attracting the attention of breeders. Therefore, fine mapping the QTLs associated with yield-traits and quality-traits of soybean would be helpful for soybean breeders. In the present study, a high-density linkage map was constructed to identify the QTLs for the yield-traits and quality-traits, using specific length amplified fragment sequencing (SLAF-seq).
DOI:10.1038/nbt.3096URLPMID:25643055 [本文引用: 1]
Understanding soybean (Glycine max) domestication and improvement at a genetic level is important to inform future efforts to further improve a crop that provides the world's main source of oilseed. We detect 230 selective sweeps and 162 selected copy number variants by analysis of 302 resequenced wild, landrace and improved soybean accessions at &gt;11× depth. A genome-wide association study using these new sequences reveals associations between 10 selected regions and 9 domestication or improvement traits, and identifies 13 previously uncharacterized loci for agronomic traits including oil content, plant height and pubescence form. Combined with previous quantitative trait loci (QTL) information, we find that, of the 230 selected regions, 96 correlate with reported oil QTLs and 21 contain fatty acid biosynthesis genes. Moreover, we observe that some traits and loci are associated with geographical regions, which shows that soybean populations are structured geographically. This study provides resources for genomics-enabled improvements in soybean breeding.
[本文引用: 1]
DOI:10.1371/journal.pone.0171105URLPMID:28152092 [本文引用: 1]
Mapping quantitative trait loci through the use of linkage disequilibrium (LD) in populations of unrelated individuals provides a valuable approach for dissecting the genetic basis of complex traits in soybean (Glycine max). The haplotype-based genome-wide association study (GWAS) has now been proposed as a complementary approach to intensify benefits from LD, which enable to assess the genetic determinants of agronomic traits. In this study a GWAS was undertaken to identify genomic regions that control 100-seed weight (SW), plant height (PH) and seed yield (SY) in a soybean association mapping panel using single nucleotide polymorphism (SNP) markers and haplotype information. The soybean cultivars (N = 169) were field-evaluated across four locations of southern Brazil. The genome-wide haplotype association analysis (941 haplotypes) identified eleven, seventeen and fifty-nine SNP-based haplotypes significantly associated with SY, SW and PH, respectively. Although most marker-trait associations were environment and trait specific, stable haplotype associations were identified for SY and SW across environments (i.e., haplotypes Gm12_Hap12). The haplotype block 42 on Chr19 (Gm19_Hap42) was confirmed to be associated with PH in two environments. These findings enable us to refine the breeding strategy for tropical soybean, which confirm that haplotype-based GWAS can provide new insights on the genetic determinants that are not captured by the single-marker approach.
DOI:10.1270/jsbbs.63.441URLPMID:24757383 [本文引用: 1]
Wild soybean, the progenitor of cultivated soybean, is an important gene pool for ongoing soybean breeding efforts. To identify yield-enhancing quantitative trait locus (QTL) or gene from wild soybean, 113 wild soybeans accessions were phenotyped for five yield-related traits and genotyped with 85 simple sequence repeat (SSR) markers to conduct association mapping. A total of 892 alleles were detected for the 85 SSR markers, with an average 10.49 alleles; the corresponding PIC values ranged from 0.07 to 0.92, with an average 0.73. The genetic diversity of each SSR marker ranged from 0.07 to 0.93, with an average 0.75. A total of 18 SSR markers were identified for the five traits. Two SSR markers, sct_010 and satt316, which are associated with the yield per plant were stably expressed over two years at two experimental locations. Our results suggested that association mapping can be an effective approach for identifying QTL from wild soybean.
DOI:10.1007/s00122-015-2614-xURLPMID:26518570 [本文引用: 1]
Twenty-two loci for soybean SW and candidate genes conditioning seed development were identified; and prediction accuracies of GS and MAS were estimated through cross-validation and validation with unrelated populations. Soybean (Glycine max) is a major crop for plant protein and oil production, and seed weight (SW) is important for yield and quality in food/vegetable uses of soybean. However, our knowledge of genes controlling SW remains limited. To better understand the molecular mechanism underlying the trait and explore marker-based breeding approaches, we conducted a genome-wide association study in a population of 309 soybean germplasm accessions using 31,045 single nucleotide polymorphisms (SNPs), and estimated the prediction accuracy of genomic selection (GS) and marker-assisted selection (MAS) for SW. Twenty-two loci of minor effect associated with SW were identified, including hotspots on Gm04 and Gm19. The mixed model containing these loci explained 83.4% of phenotypic variation. Candidate genes with Arabidopsis orthologs conditioning SW were also proposed. The prediction accuracies of GS and MAS by cross-validation were 0.75-0.87 and 0.62-0.75, respectively, depending on the number of SNPs used and the size of training population. GS also outperformed MAS when the validation was performed using unrelated panels across a wide range of maturities, with an average prediction accuracy of 0.74 versus 0.53. This study convincingly demonstrated that soybean SW is controlled by numerous minor-effect loci. It greatly enhances our understanding of the genetic basis of SW in soybean and facilitates the identification of genes controlling the trait. It also suggests that GS holds promise for accelerating soybean breeding progress. The results are helpful for genetic improvement and genomic prediction of yield in soybean.
DOI:10.1111/pbi.12249URLPMID:25213593 [本文引用: 1]
Soya bean is a major source of edible oil and protein for human consumption as well as animal feed. Understanding the genetic basis of different traits in soya bean will provide important insights for improving breeding strategies for this crop. A genome-wide association study (GWAS) was conducted to accelerate molecular breeding for the improvement of agronomic traits in soya bean. A genotyping-by-sequencing (GBS) approach was used to provide dense genome-wide marker coverage (&gt;47,000 SNPs) for a panel of 304 short-season soya bean lines. A subset of 139 lines, representative of the diversity among these, was characterized phenotypically for eight traits under six environments (3 sites × 2 years). Marker coverage proved sufficient to ensure highly significant associations between the genes known to control simple traits (flower, hilum and pubescence colour) and flanking SNPs. Between one and eight genomic loci associated with more complex traits (maturity, plant height, seed weight, seed oil and protein) were also identified. Importantly, most of these GWAS loci were located within genomic regions identified by previously reported quantitative trait locus (QTL) for these traits. In some cases, the reported QTLs were also successfully validated by additional QTL mapping in a biparental population. This study demonstrates that integrating GBS and GWAS can be used as a powerful complementary approach to classical biparental mapping for dissecting complex traits in soya bean.
DOI:10.1186/s12864-017-3922-0URLPMID:28701220 [本文引用: 1]
Soybean seed weight is not only a yield component, but also a critical trait for various soybean food products such as sprouts, edamame, soy nuts, natto and miso. Linkage analysis and genome-wide association study (GWAS) are two complementary and powerful tools to connect phenotypic differences to the underlying contributing loci. Linkage analysis is based on progeny derived from two parents, given sufficient sample size and biological replication, it usually has high statistical power to map alleles with relatively small effect on phenotype, however, linkage analysis of the bi-parental population can't detect quantitative trait loci (QTL) that are fixed in the two parents. Because of the small seed weight difference between the two parents in most families of previous studies, these populations are not suitable to detect QTL that have considerable effects on seed weight. GWAS is based on unrelated individuals to detect alleles associated with the trait under investigation. The ability of GWAS to capture major seed weight QTL depends on the frequency of the accessions with small and large seed weight in the population being investigated. Our objective was to identify QTL that had a pronounced effect on seed weight using a selective population of soybean germplasm accessions and the approach of GWAS and fixation index analysis.
DOI:10.1038/srep20728URLPMID:26856884 [本文引用: 1]
Domestication of soybeans occurred under the intense human-directed selections aimed at developing high-yielding lines. Tracing the domestication history and identifying the genes underlying soybean domestication require further exploration. Here, we developed a high-throughput NJAU 355?K SoySNP array and used this array to study the genetic variation patterns in 367 soybean accessions, including 105 wild soybeans and 262 cultivated soybeans. The population genetic analysis suggests that cultivated soybeans have tended to originate from northern and central China, from where they spread to other regions, accompanied with a gradual increase in seed weight. Genome-wide scanning for evidence of artificial selection revealed signs of selective sweeps involving genes controlling domestication-related agronomic traits including seed weight. To further identify genomic regions related to seed weight, a genome-wide association study (GWAS) was conducted across multiple environments in wild and cultivated soybeans. As a result, a strong linkage disequilibrium region on chromosome 20 was found to be significantly correlated with seed weight in cultivated soybeans. Collectively, these findings should provide an important basis for genomic-enabled breeding and advance the study of functional genomics in soybean.
DOI:10.1186/s12864-018-4558-4URLPMID:29490606 [本文引用: 1]
To continue to meet the increasing demands of soybean worldwide, it is crucial to identify key genes regulating flowering and maturity to expand the cultivated regions into short season areas. Although four soybean genes have been successfully utilized in early maturity breeding programs, new genes governing maturity are continuously being identified suggesting that there remains as yet undiscovered loci governing agronomic traits of interest. The objective of this study was to identify novel loci and genes involved in a diverse set of early soybean maturity using genome-wide association (GWA) analyses to identify loci governing days to maturity (DTM), flowering (DTF) and pod filling (DTPF), as well as yield and 100 seed weight in Canadian environments. To do so, soybean plant introduction lines varying significantly for maturity, but classified as early varieties, were used. Plants were phenotyped for the five agronomic traits for five site-years and GWA approaches used to identify candidate loci and genes affecting each trait.
DOI:10.3389/fpls.2018.01392URLPMID:30369935 [本文引用: 1]
Seed weight per plant (SWPP) of soybean (Glycine max (L.) Merr.), a complicated quantitative trait controlled by multiple genes, was positively associated with soybean seed yields. In the present study, a natural soybean population containing 185 diverse accessions primarily from China was used to analyze the genetic basis of SWPP via genome-wide association analysis (GWAS) based on high-throughput single-nucleotide polymorphisms (SNPs) generated by the Specific Locus Amplified Fragment Sequencing (SLAF-seq) method. A total of 33,149 SNPs were finally identified with minor allele frequencies (MAF) > 5% which were present in 97% of all the genotypes. Twenty association signals associated with SWPP were detected via GWAS. Among these signals, eight SNPs were novel loci, and the other twelve SNPs were overlapped or located in the linked genomic regions of the reported QTL from SoyBase database. Several genes belonging to the categories of hormone pathways, RNA regulation of transcription in plant development, ubiquitin, transporting systems, and other metabolisms were considered as candidate genes associated with SWPP. Furthermore, nine genes from the flanking region of Gm07:19488264, Gm08:15768591, Gm08:15768603, or Gm18:23052511 were significantly associated with SWPP and were stable among multiple environments. Nine out of 18 haplotypes from nine genes showed the effect of increasing SWPP. The identified loci along with the beneficial alleles and candidate genes could be of great value for studying the molecular mechanisms underlying SWPP and for improving the potential seed yield of soybean in the future.
DOI:10.1007/s00122-017-2962-9URLPMID:28828506 [本文引用: 5]
The innovative RTM-GWAS procedure provides a relatively thorough detection of QTL and their multiple alleles for germplasm population characterization, gene network identification, and genomic selection strategy innovation in plant breeding. The previous genome-wide association studies (GWAS) have been concentrated on finding a handful of major quantitative trait loci (QTL), but plant breeders are interested in revealing the whole-genome QTL-allele constitution in breeding materials/germplasm (in which tremendous historical allelic variation has been accumulated) for genome-wide improvement. To match this requirement, two innovations were suggested for GWAS: first grouping tightly linked sequential SNPs into linkage disequilibrium blocks (SNPLDBs) to form markers with multi-allelic haplotypes, and second utilizing two-stage association analysis for QTL identification, where the markers were preselected by single-locus model followed by multi-locus multi-allele model stepwise regression. Our proposed GWAS procedure is characterized as a novel restricted two-stage multi-locus multi-allele GWAS (RTM-GWAS, https://github.com/njau-sri/rtm-gwas ). The Chinese soybean germplasm population (CSGP) composed of 1024 accessions with 36,952 SNPLDBs (generated from 145,558 SNPs, with reduced linkage disequilibrium decay distance) was used to demonstrate the power and efficiency of RTM-GWAS. Using the CSGP marker information, simulation studies demonstrated that RTM-GWAS achieved the highest QTL detection power and efficiency compared with the previous procedures, especially under large sample size and high trait heritability conditions. A relatively thorough detection of QTL with their multiple alleles was achieved by RTM-GWAS compared with the linear mixed model method on 100-seed weight in CSGP. A QTL-allele matrix (402 alleles of 139 QTL?×?1024 accessions) was established as a compact form of the population genetic constitution. The 100-seed weight QTL-allele matrix was used for genetic characterization, candidate gene prediction, and genomic selection for optimal crosses in the germplasm population.
DOI:10.1007/s00122-017-2960-yURLPMID:28799029 [本文引用: 2]
The RTM-GWAS was chosen among five procedures to identify DTF QTL-allele constitution in a soybean NAM population; 139 QTLs with 496 alleles accounting for 81.7% of phenotypic variance were detected. Flowering date (days to flowering, DTF) is an ecological trait in soybean, closely related to its ability to adapt to areas. A nested association mapping (NAM) population consisting of four RIL populations (LM, ZM, MT and MW with M8206 as their common parent) was established and tested for their DTF under five environments. Using restriction-site-associated DNA sequencing the population was genotyped with SNP markers. The restricted two-stage multi-locus (RTM) genome-wide association study (GWAS) (RTM-GWAS) with SNP linkage disequilibrium block (SNPLDB) as multi-allele genomic markers performed the best among the five mapping procedures with software publicly available. It identified the greatest number of quantitative trait loci (QTLs) (139) and alleles (496) on 20 chromosomes covering almost all of the QTLs detected by four other mapping procedures. The RTM-GWAS provided the detected QTLs with highest genetic contribution but without overflowing and missing heritability problems (81.7% genetic contribution vs. heritability of?97.6%), while SNPLDB markers matched the NAM population property of multiple alleles per locus. The 139 QTLs with 496 alleles were organized into a QTL-allele matrix, showing the corresponding DTF genetic architecture of the five parents and the NAM population. All lines and parents comprised both positive and negative alleles, implying a great potential of recombination for early and late DTF improvement. From the detected QTL-allele system, 126 candidate genes were annotated and χ 2 tested as a DTF candidate gene system involving nine biological processes, indicating the trait a complex, involving several biological processes rather than only a handful of major genes.
DOI:10.1093/jxb/erv342URLPMID:26163701 [本文引用: 2]
A representative sample comprising 366 accessions from the Chinese soybean landrace population (CSLRP) was tested under four growth environments for determination of the whole-genome quantitative trait loci (QTLs) system of the 100-seed weight trait (ranging from 4.59g to 40.35g) through genome-wide association study (GWAS). A total of 116 769 single nucleotide polymorphisms (SNPs) were identified and organized into 29 121 SNP linkage disequilibrium blocks (SNPLDBs) to fit the property of multiple alleles/haplotypes per locus in germplasm. An innovative two-stage GWAS was conducted using a single locus model for shrinking the marker number followed by a multiple loci model utilizing a stepwise regression for the whole-genome QTL identification. In total, 98.45% of the phenotypic variance (PV) was accounted for by four large-contribution major QTLs (36.33%), 51 small-contribution major QTLs (43.24%), and a number of unmapped minor QTLs (18.88%), with the QTL×environment variance representing only 1.01% of the PV. The allele numbers of each QTL ranged from two to 10. A total of 263 alleles along with the respective allele effects were estimated and organized into a 263×366 matrix, giving the compact genetic constitution of the CSLRP. Differentiations among the ecoregion matrices were found. No landrace had alleles which were all positive or all negative, indicating a hidden potential for recombination. The optimal crosses within and among ecoregions were predicted, and showed great transgressive potential. From the QTL system, 39 candidate genes were annotated, of which 26 were involved with the gene ontology categories of biological process, cellular component, and molecular function, indicating that diverse genes are involved in directing the 100-seed weight.
DOI:10.1007/s00122-016-2724-0URLPMID:27189002 [本文引用: 2]
Utilizing an innovative GWAS in CSLRP, 44 QTL 199 alleles with 72.2?% contribution to SIFC variation were detected and organized into a QTL-allele matrix for cross design and gene annotation. The seed isoflavone content (SIFC) of soybeans is of great importance to health care. The Chinese soybean landrace population (CSLRP) as a genetic reservoir was studied for its whole-genome quantitative trait loci (QTL) system of the SIFC using an innovative restricted two-stage multi-locus genome-wide association study procedure (RTM-GWAS). A sample of 366 landraces was tested under four environments and sequenced using RAD-seq (restriction-site-associated DNA sequencing) technique to obtain 116,769 single nucleotide polymorphisms (SNPs) then organized into 29,119 SNP linkage disequilibrium blocks (SNPLDBs) for GWAS. The detected 44 QTL 199 alleles on 16 chromosomes (explaining 72.2?% of the total phenotypic variation) with the allele effects (92 positive and 107 negative) of the CSLRP were organized into a QTL-allele matrix showing the SIFC population genetic structure. Additional differentiation among eco-regions due to the SIFC in addition to that of genome-wide markers was found. All accessions comprised both positive and negative alleles, implying a great potential for recombination within the population. The optimal crosses were predicted from the matrices, showing transgressive potentials in the CSLRP. From the detected QTL system, 55 candidate genes related to 11 biological processes were χ (2)-tested as an SIFC candidate gene system. The present study explored the genome-wide SIFC QTL/gene system with the innovative RTM-GWAS and found the potentials of the QTL-allele matrix in optimal cross design and population genetic and genomic studies, which may have provided a solution to match the breeding by design strategy at both QTL and gene levels in breeding programs.
DOI:10.3389/fpls.2018.01793URLPMID:30568668 [本文引用: 1]
Soybean is one of the world's major vegetative oil sources, while oleic acid and linolenic acid content are the major quality traits of soybean oil. The restricted two-stage multi-locus genome-wide association analysis (RTM-GWAS), characterized with error and false-positive control, has provided a potential approach for a relatively thorough detection of whole-genome QTL-alleles. The Chinese soybean landrace population (CSLRP) composed of 366 accessions was tested under four environments to identify the QTL-allele constitution of seed oil, oleic acid and linolenic acid content (SOC, OAC, and LAC). Using RTM-GWAS with 29,119 SNPLDBs (SNP linkage disequilibrium blocks) as genomic markers, 50, 98, and 50 QTLs with 136, 283, and 154 alleles (2-9 per locus) were detected, with their contribution 82.52, 90.31, and 83.86% to phenotypic variance, corresponding to their heritability 91.29, 90.97, and 90.24% for SOC, OAC, and LAC, respectively. The RTM-GWAS was shown to be more powerful and efficient than previous single-locus model GWAS procedures. For each trait, the detected QTL-alleles were organized into a QTL-allele matrix as the population genetic constitution. From which the genetic differentiation among 6 eco-populations was characterized as significant allele frequency differentiation on 28, 56, and 30 loci for the three traits, respectively. The QTL-allele matrices were also used for genomic selection for optimal crosses, which predicted transgressive potential up to 24.76, 40.30, and 2.37% for the respective traits, respectively. From the detected major QTLs, 38, 27, and 25 candidate genes were annotated for the respective traits, and two common QTL covering eight genes were identified for further study.
[本文引用: 1]
DOI:10.1007/s00425-018-2952-4URLPMID:29980855 [本文引用: 1]
RTM-GWAS identified 111 DT QTLs, 262 alleles with high proportion of QEI and genetic variation accounting for 88.55-95.92% PV in NAM, from which QTL-allele matrices were established and candidate genes annotated. Drought tolerance (DT) is one of the major challenges for world soybean production. A nested association mapping (NAM) population with 403 lines comprising two recombinant inbred line (RIL) populations: M8206?×?TongShan and ZhengYang?×?M8206 was tested for DT using polyethylene-glycol (PEG) treatment under spring and summer environments. The population was sequenced using restriction-site-associated DNA sequencing (RAD-seq) filtered with minor allele frequency (MAF)?≥?0.01, 55,936 single nucleotide polymorphisms (SNPs) were obtained and organized into 6137 SNP linkage disequilibrium blocks (SNPLDBs). The restricted two-stage multi-locus genome-wide association studies (RTM-GWAS) identified 73 and 38 QTLs with 174 and 88 alleles contributed main effect 40.43 and 26.11% to phenotypic variance (PV) and QTL-environment interaction (QEI) effect 24.64 and 10.35% to PV for relative root length (RRL) and relative shoot length (RSL), respectively. The DT traits were characterized with high proportion of QEI variation (37.52-41.65%), plus genetic variation (46.90-58.40%) in a total of 88.55-95.92% PV. The identified QTLs-alleles were organized into main-effect and QEI-effect QTL-allele matrices, showing the genetic and QEI architecture of the three parents/NAM population. From the matrices, the possible best genotype was predicted to have a weighted average value over two indicators (WAV) of 1.873, while the top ten optimal crosses among RILs with 95th percentile WAV 1.098-1.132, transgressive over the parents (0.651-0.773) but much less than 1.873, implying further pyramiding potential. From the matrices, 134 candidate genes were annotated involved in nine biological processes. The present results provide a novel way for molecular breeding in QTL-allele-based genomic selection for optimal cross selection.
DOI:10.1016/j.tplants.2006.12.001URLPMID:17224302 [本文引用: 1]
Linkage disequilibrium (LD) mapping in plants detects and locates quantitative trait loci (QTL) by the strength of the correlation between a trait and a marker. It offers greater precision in QTL location than family-based linkage analysis and should therefore lead to more efficient marker-assisted selection, facilitate gene discovery and help to meet the challenge of connecting sequence diversity with heritable phenotypic differences. Unlike family-based linkage analysis, LD mapping does not require family or pedigree information and can be applied to a range of experimental and non-experimental populations. However, care must be taken during analysis to control for the increased rate of false positive results arising from population structure and variety interrelationships. In this review, we discuss how suitable the recently developed alternative methods of LD mapping are for crops.
DOI:10.1007/s00122-011-1558-zURLPMID:21373796 [本文引用: 1]
Quantitative trait locus (QTL) detection is commonly performed by analysis of designed segregating populations derived from two inbred parental lines, where absence of selection, mutation and genetic drift is assumed. Even for designed populations, selection cannot always be avoided, with as consequence varying correlation between genotypes instead of uniform correlation. Akin to linkage disequilibrium mapping, ignoring this type of genetic relatedness will increase the rate of false-positives. In this paper, we advocate using mixed models including genetic relatedness, or 'kinship' information for QTL detection in populations where selection forces operated. We demonstrate our case with a three-way barley cross, designed to segregate for dwarfing, vernalization and spike morphology genes, in which selection occurred. The population of 161 inbred lines was screened with 1,536 single nucleotide polymorphisms (SNPs), and used for gene and QTL detection. The coefficient of coancestry matrix was estimated based on the SNPs and imposed to structure the distribution of random genotypic effects. The model incorporating kinship, coancestry, information was consistently superior to the one without kinship (according to the Akaike information criterion). We show, for three traits, that ignoring the coancestry information results in an unrealistically high number of marker-trait associations, without providing clear conclusions about QTL locations. We used a number of widely recognized dwarfing and vernalization genes known to segregate in the studied population as landmarks or references to assess the agreement of the mapping results with a priori candidate gene expectations. Additional QTLs to the major genes were detected for all traits as well.
DOI:10.1007/s00122-018-3174-7URLPMID:30167759 [本文引用: 3]
Eighty-six R1 QTLs accounting for 89.92% phenotypic variance in a soybean RIL population were identified using RTM-GWAS with SNPLDB marker which performed superior over CIM and MLM-GWAS with BIN/SNPLDB marker. A population (NJRIKY) composed of 427 recombinant inbred lines (RILs) derived from Kefeng-1?×?NN1138-2 (MGII?×?MGV, MG maturity group) was applied for detecting flowering date (R1) quantitative trait locus (QTL) system in soybean. From a low-depth re-sequencing (~?0.75?×), 576,874 SNPs were detected and organized into 4737 BINs (recombination breakpoint determinations) and 3683 SNP linkage disequilibrium blocks (SNPLDBs), respectively. Using the association mapping procedures &quot;Restricted Two-stage Multi-locus Genome-wide Association Study&quot; (RTM-GWAS), &quot;Mixed Linear Model Genome-wide Association Study&quot; (MLM-GWAS) and the linkage mapping procedure &quot;Composite Interval Mapping&quot; (CIM), 67, 36 and 10 BIN-QTLs and 86, 14 and 23 SNPLDB-QTLs were detected with their phenotypic variance explained (PVE) 88.70-89.92% (within heritability 98.2%), 146.41-353.62% (overflowing) and 88.29-172.34% (overflowing), respectively. The RTM-GWAS with SNPLDBs which showed to be more efficient and reasonable than the others was used to identify the R1 QTL system in NJRIKY. The detected 86 SNPLDB-QTLs with their PVE from 0.02 to 30.66% in a total of 89.92% covered 51 out of 104 R1 QTLs in 18 crosses in SoyBase and 26 out of 139 QTLs in a nested association mapping population, while the rest 29 QTLs were novel ones. From the QTL system, 52 candidate genes were annotated, including the verified gene E1, E2, E9 and J, and grouped into 3 categories of biological processes, among which 24 genes were enriched into three protein-protein interaction networks, suggesting gene networks working together. Since NJRIKY involves only MGII and MGV, the QTL/gene system among MG000-MGX should be explored further.
DOI:10.1534/genetics.110.116863URLPMID:20439773 [本文引用: 1]
Model organisms offer many advantages for the genetic analysis of complex traits. However, identification of specific genes is often hampered by a lack of recombination between the genomes of inbred progenitors. Recently, genome-wide association studies (GWAS) in humans have offered gene-level mapping resolution that is possible because of the large number of accumulated recombinations among unrelated human subjects. To obtain analogous improvements in mapping resolution in mice, we used a 34th generation advanced intercross line (AIL) derived from two inbred strains (SM/J and LG/J). We used simulations to show that familial relationships among subjects must be accounted for when analyzing these data; we then used a mixed model that included polygenic effects to address this problem in our own analysis. Using a combination of F(2) and AIL mice derived from the same inbred progenitors, we identified genome-wide significant, subcentimorgan loci that were associated with methamphetamine sensitivity, (e.g., chromosome 18; LOD = 10.5) and non-drug-induced locomotor activity (e.g., chromosome 8; LOD = 18.9). The 2-LOD support interval for the former locus contains no known genes while the latter contains only one gene (Csmd1). This approach is broadly applicable in terms of phenotypes and model organisms and allows GWAS to be performed in multigenerational crosses between and among inbred strains where familial relatedness is often unavoidable.
URL [本文引用: 1]
Recombinant inbred line (RIL) population is one of the often-used populations for construction of genetic map and QTL mapping. There might appear some extra-biased segregation in the initial RIL population due to multiple generation sampling and natural and artificial reasons. Based on an analysis o
[本文引用: 1]
[本文引用: 1]
DOI:10.1093/nar/8.19.4321URLPMID:7433111 [本文引用: 1]
A method is presented for the rapid isolation of high molecular weight plant DNA (50,000 base pairs or more in length) which is free of contaminants which interfere with complete digestion by restriction endonucleases. The procedure yields total cellular DNA (i.e. nuclear, chloroplast, and mitochondrial DNA). The technique is ideal for the rapid isolation of small amounts of DNA from many different species and is also useful for large scale isolations.
DOI:10.1093/bioinformatics/btm220URLPMID:17646323 [本文引用: 1]
Typical high-throughput genotyping techniques produce numerous missing calls that confound subsequent analyses, such as disease association studies. Common remedies for this problem include removing affected markers and/or samples or, otherwise, imputing the missing data. On small marker sets imputation is frequently based on a vote of the K-nearest-neighbor (KNN) haplotypes, but this technique is neither practical nor justifiable for large datasets.
DOI:10.1038/ng1702URLPMID:16380716 [本文引用: 2]
As population structure can result in spurious associations, it has constrained the use of association studies in human and plant genetics. Association mapping, however, holds great promise if true signals of functional association can be separated from the vast number of false signals generated by population structure. We have developed a unified mixed-model approach to account for multiple levels of relatedness simultaneously as detected by random genetic markers. We applied this new approach to two samples: a family-based sample of 14 human families, for quantitative gene expression dissection, and a sample of 277 diverse maize inbred lines with complex familial relationships and population structure, for quantitative trait dissection. Our method demonstrates improved control of both type I and type II error rates over other methods. As this new method crosses the boundary between family-based and structured association samples, it provides a powerful complement to currently available methods for association mapping.
DOI:10.1093/bioinformatics/btm308URLPMID:17586829 [本文引用: 1]
Association analyses that exploit the natural diversity of a genome to map at very high resolutions are becoming increasingly important. In most studies, however, researchers must contend with the confounding effects of both population and family structure. TASSEL (Trait Analysis by aSSociation, Evolution and Linkage) implements general linear model and mixed linear model approaches for controlling population and family structure. For result interpretation, the program allows for linkage disequilibrium statistics to be calculated and visualized graphically. Database browsing and data importation is facilitated by integrated middleware. Other features include analyzing insertions/deletions, calculating diversity statistics, integration of phenotypic and genotypic data, imputing missing data and calculating principal components.
DOI:10.1093/bioinformatics/btn209URLPMID:18441000 [本文引用: 1]
False discovery rate (FDR) methodologies are essential in the study of high-dimensional genomic and proteomic data. The R package 'fdrtool' facilitates such analyses by offering a comprehensive set of procedures for FDR estimation. Its distinctive features include: (i) many different types of test statistics are allowed as input data, such as P-values, z-scores, correlations and t-scores; (ii) simultaneously, both local FDR and tail area-based FDR values are estimated for all test statistics and (iii) empirical null models are fit where possible, thereby taking account of potential over- or underdispersion of the theoretical null. In addition, 'fdrtool' provides readily interpretable graphical output, and can be applied to very large scale (in the order of millions of hypotheses) multiple testing problems. Consequently, 'fdrtool' implements a flexible FDR estimation scheme that is unified across different test statistics and variants of FDR.
[本文引用: 1]
DOI:10.1016/j.molp.2017.03.006URLPMID:28363587 [本文引用: 1]
Cultivated soybeans may lose some useful genetic loci during domestication. Introgression of genes from wild soybeans could broaden the genetic background and improve soybean agronomic traits. In this study, through whole-genome sequencing of a?recombinant inbred line population derived from a cross between a wild soybean ZYD7 and a cultivated soybean HN44, and mapping of quantitative trait loci for seed weight, we discovered that a phosphatase 2C-1 (PP2C-1) allele from wild soybean ZYD7 contributes to the increase in seed weight/size. PP2C-1 may achieve this function by enhancing cell size of integument and activating a subset of seed trait-related genes. We found that PP2C-1 is associated with GmBZR1, a soybean ortholog of Arabidopsis BZR1, one of key transcription factors in brassinosteroid (BR) signaling, and facilitate accumulation of dephosphorylated GmBZR1. In contrast, the PP2C-2 allele with variations of a few amino acids at the N-terminus did not exhibit this function. Moreover, we showed that GmBZR1 could promote seed weight/size in transgenic plants. Through analysis of cultivated soybean accessions, we found that 40% of the examined accessions do not have the PP2C-1 allele, suggesting that these accessions can be improved by introduction of this allele. Taken together, our study identifies an elite allele PP2C-1, which can enhance seed weight and/or size in soybean, and pinpoints that manipulation of this allele by molecular-assisted breeding may increase production in soybean and other legumes/crops.
DOI:10.1007/s11703-007-0001-3URL [本文引用: 1]
DOI:10.1007/s00122-003-1527-2URLPMID:15067400 [本文引用: 1]
A set of 184 recombinant inbred lines (RILs) derived from soybean vars. KefengNo.1 × Nannong1138-2 was used to construct a genetic linkage map. The two parents exhibit contrasting characteristics for most of the traits that were mapped. Using restricted fragment length polymorphisms (RFLPs), simple sequence repeats (SSRs) and expressed sequence tags (ESTs), we mapped 452 markers onto 21 linkage groups and covered 3,595.9cM of the soybean genome. All of the linkage groups except linkage groupF were consistent with those of the consensus map of Cregan et al. (1999). Linkage groupF was divided into two linkage groups, F1 and F2. The map consisted of 189 RFLPs, 219 SSRs, 40 ESTs, three Rgene loci and one phenotype marker. Ten agronomic traits—days to flowering, days to maturity, plant height, number of nodes on main stem, lodging, number of pods per node, protein content, oil content, 100-seed weight, and plot yield—were studied. Using winqtlcart, we detected 63 quantitative trait loci (QTLs) that had LOD>3 for nine of the agronomic traits (only exception being seed oil content) and mapped these on 12 linkage groups. Most of the QTLs were clustered, especially on groupsB1 and C2. Some QTLs were mapped to the same loci. This pleiotropism was common for most of the QTLs, and one QTL could influence at most five traits. Seven EST markers were found to be linked closely with or located at the same loci as the QTLs. EST marker GmKF059a, encoding a repressor protein and mapped on groupC2, accounted for about 20% of the total variation of days to flowering, plant height, lodging and nodes on the main stem, respectively.
DOI:10.1007/s00122-012-1859-xURLPMID:22481120 [本文引用: 1]
Seed weight, measured as mass per seed, is an important yield component of soybean and is generally positively correlated with seed yield (Burton et al, Crop Sci 27:1093, 1987). In previous reports, quantitative trait loci (QTL) associated with seed weight, were identified in single genetic background. The objective of the present study was to identify QTL and epistatic QTL underlying soybean seed weight in three RIL populations (with one common male parent 'Hefeng25') and across three different environments. Overall, 18, 11, and 17 seed weight QTL were identified in HC ('Hefeng25' x 'Conrad'), HM ('Hefeng25' x 'Maple Arrow'), and HB ('Hefeng25' x 'Bayfield') populations, respectively. The amount of phenotypic variation explained by a single QTL underlying seed weight was usually less than 10 %. The environment and background-independent QTL often had higher additive (a) effects. In contrast, the environment or background-dependent QTL were probably due to weak expression of QTL. QTL by environment interaction effects were in the opposite direction of a effects and/or epistasis effects. Four QTL and one QTL could be identified (2.0 < LOD < 9.06) in the HC and HB populations, respectively, across three environments (swHCA2-1, swHCC2-1, swHCD1b-1, swHCA2-2 (linked to Satt233, Satt424, Satt460, Satt428, respectively) and swHBA1-1(Satt449). Seven QTL could be identified in all three RIL populations in at least one location. Two QTL could be identified in the three RIL populations across three environments. These two QTL may have greater potential for use in marker-assisted selection of seed weight in soybean.
[本文引用: 1]
DOI:10.1016/j.molcel.2017.12.002URLPMID:29290610 [本文引用: 1]
As sessile organisms, plants must adapt to variations in the environment. Environmental stress triggers various responses, including growth inhibition, mediated by the plant hormone abscisic acid (ABA). The mechanisms that integrate stress responses with growth are poorly understood. Here, we discovered that the Target of Rapamycin (TOR) kinase phosphorylates PYL ABA receptors at a conserved serine residue to prevent activation of the stress response in unstressed plants. This phosphorylation?disrupts PYL association with ABA and with PP2C phosphatase effectors, leading to inactivation?of SnRK2 kinases. Under stress, ABA-activated SnRK2s phosphorylate Raptor, a component of the TOR complex, triggering TOR complex dissociation?and inhibition. Thus, TOR signaling represses ABA signaling and stress responses in unstressed conditions, whereas ABA signaling represses TOR signaling and growth during times of stress. Plants utilize this conserved phospho-regulatory feedback mechanism to optimize the balance of growth and stress responses.
