2
Spatial-Temporal Characteristics and Economic Relevance of Agricultural Carbon Emissions in Hubei Province
LI Bo1,2, DU JianGuo1, LIU XueQi1责任编辑: 李云霞
收稿日期:2019-06-3接受日期:2019-07-5网络出版日期:2019-12-01
| 基金资助: |
Received:2019-06-3Accepted:2019-07-5Online:2019-12-01
作者简介 About authors
李波,Tel:18971565717;E-mail:liboscuec@126.com

摘要
关键词:
Abstract
Keywords:
PDF (804KB)元数据多维度评价相关文章导出EndNote|Ris|Bibtex收藏本文
本文引用格式
李波, 杜建国, 刘雪琪. 湖北省农业碳排放的时空特征及经济关联性[J]. 中国农业科学, 2019, 52(23): 4309-4319 doi:10.3864/j.issn.0578-1752.2019.23.011
LI Bo, DU JianGuo, LIU XueQi.
0 引言
【研究意义】如今,随着湖北省农业生产大量使用农药、化肥和农膜等农用物资,再加上农业生产逐渐机械化,使用了大量的柴油,严重影响着湖北省的生态环境,且给湖北省农业的可持续发展带来巨大的压力。农业碳排放和农业经济发展之间存在着辩证统一的关系:一方面,随着大量使用农业机械,农业柴油的使用量急剧增加,从而产生了大量的碳排放;另一方面,随着农业碳减排技术的快速发展和普及,促进了农业的碳减排。湖北省是农业大省,农业生产的碳排放在总的碳排放中占据了较大的比重,碳排放所带来的温室效应和农业生产导致的面源污染等环境问题不容忽视。基于此,通过分析农业碳排放的经济关联性,这对湖北省将来的碳减排工作的开展,提供了重要的理论依据和参考。【前人研究进展】近些年来,对碳排放影响经济增长的研究越来越多,国内采用以下几种方法进行研究:对碳排放与经济发展进行EKC检验,得出碳排放强度与人均GDP的EKC曲线具有倒“U”形状[1,2,3];构建Cobb-Douglas生产函数模型,并将能源作为新的变量引入,通过建立向量自回归模型,发现经济增长与能源消耗之间存在的关系[4,5,6];测算了湖北省农业碳排放并采用LMDI模型进行因素分解,结果显示经济因素则推动了农业碳排放的快速上升,这表明经济与农业碳排放存在一定的关系[6,7,8,9];运用EKC模型对农业经济增长与农业碳排放之间的关系进行分析,并利用Kaya方法对因素进行分解,发现农业碳排放最主要的驱动因素是经济增长,并且碳排放与农业经济增长之间存在非均衡的“N”型曲线关系[10,11,12]。而国外对经济增长与碳排放之间关系的研究有:COLE[13]、ALEXANDRA[14]和SOONAE[15]等发现碳排放量和收入分配之间符合库兹涅茨曲线。ACIL[16]和RUBEN等[17]对各个国家的农业碳排放进行了测算,发现各个国家的农业生产方式不同,从而对经济的影响也不同。COONDOO等[18]从格兰杰因果关系的角度分析了人均收入之间和碳排放量的关系,研究结果表明不同国家的人均收入和碳排放量之间存在不同的因果关系。【本研究切入点】目前,农业经济发展进入新常态,但农业减排形势依旧严峻。农业经济增长与农业碳排放之间存在着十分密切的关系,既不能只顾发展农业经济而破坏生态环境,也不能一味的强调保护环境,为了减排而放弃了农业经济发展。所以要协调经济增长与农业碳排放之间的关系,才能保证社会经济环境的可持续发展。从现有的文献来看,我国对农业碳排放的大部分研究都是运用全国的数据进行分析,研究范围较大,缺少针对性,并且仅仅局限于简单的时间序列数据分析。【拟解决的关键问题】本文主要以湖北省的农业碳排放为主要的研究对象,在分析湖北省碳排放时空特征的基础上,通过Kernel密度估计模型分析农业碳排放的时空演进趋势,再运用协整理论与误差修正模型,对湖北省经济增长与农业碳排放的关联性进行了实证分析,揭示农业碳排放与经济增长的内在效应机理,为湖北省农业减排的政策制定提供参考依据,对于加快湖北省农业转型升级和促进农业高质量发展具有一定的指导意义。1 研究方法与数据来源
1.1 农业碳排放量的测算方法
一般来说,农业碳排放是指农业(本文指种植业)生产中所直接或者间接产生的温室气体的排放[19]。JOHNSON[20]曾基于该研究框架对美国农业生产产生的温室气体排放量进行测算,其结果表明农业活动产生的碳排放量约相当于2.25亿t当量CO2。通过参考和归纳相关文献,本文将农业碳排放的碳源分为以下6个方面,分别包括源自于农药、化肥、农膜、农用柴油等农用物资的大量使用;翻耕等引发的有机碳流失;农业灌溉所消耗的电能。根据上述种类,可以列出农业碳排放的估计公式如下:式中,E表示农业碳排放总量,Ei表示各类农业碳源的碳排放量,Ti表示各农业碳源的消耗量,δi表示各农业碳源的碳排放系数,具体见表1。
Table 1
表1
表1农业碳排放系数及来源
Table 1
| 碳源 Carbon source | 碳排放系数 Carbon emissions coefficient | 参考来源 Reference sources |
|---|---|---|
| 化肥 Fertilizer | 0.8956 kg·kg-1 | WEST[21] |
| 农药 Pesticide | 4.9341 kg·kg-1 | 美国橡树岭国家实验室 Oak Ridge National Lab |
| 农膜 Agricultural film | 5.18 kg·kg-1 | IREEA |
| 柴油 Farm diesel fuel | 0.5927 kg·kg-1 | IPCC |
| 翻耕 Plowing | 312.6 kg·km-2 | 中国农业大学生物与技术学院 College of Biotechnology, China Agricultural University |
| 农业灌溉 Irrigation | 19.533 kg·hm-2 | DUBEY[22] |
新窗口打开|下载CSV
1.2 协整理论与误差修正模型(ECM模型)
变量之间有着长期的稳定关系,即它们之间是协整的[23]。由于在长期中经济变量之间可能存在一种稳定关系,但在短时间内这一种长期稳定关系也许会被打破。在1987年ENGLE和GRANGER针对这类问题提出了Ganger表述定理,利用协整分析变量之间所存在协整关系(即长期稳定关系),并且用这种协整关系构建出误差修正项,将短期波动和误差修正项相联系,对短期失衡部分做出修正,为非平稳序列的建模提供了一个新途径[24]。在误差修正模型中,协整关系可以表示为如下模型:
式中,y和x均为同阶单整序列,并且y和x存在协整关系,可以将公式(2)改写,得到公式(3):
式中,k0=α/(1-φ1),k1=(β0+β1)/(1-φ1),则公式(3)称为一阶误差修正模型。其中β0代表影响参数;反馈效果表示为(1-φ1);k0 和k1是长期反映系数[25]。误差修正模型反映了变量的长期均衡对短期波动的影响。
本文用计量检验及建模均由EVIEWS 8.0系统软件完成,采用EG两步法(即恩格尔-格兰杰检验)对时间序列进行协整检验。数据方面,本文选取碳排放强度数据(即单位面积农业碳排放),其中包括总碳排放强度以及化肥、农药、农膜、农用柴油、翻耕以及农业灌溉等的碳排放强度;研究湖北省农业经济增长与农业碳排放之间的关系,也就是研究农业生产的公平与效率之间关系[26,27,28]。基于此,分析中将采用能反映湖北省农业经济发展水平的人均农业总产值指标。
其中,r表示湖北省人均农业总产值,qd表示碳排放强度,hf表示化肥,nm表示农膜,ny表示农药,fg表示翻耕,gg表示农业灌溉,cy表示农用柴油,t表示时间序列。为了更好的反映数据之间的关系,提高模型精度,增加可靠性,对碳排放量和人均农业总产值分别取对数,记为:
lnr=ln(rt)
lnqd=ln(qdt)
lnhf=ln(hft)
lnnm=ln(nmt)
lnny=ln(nyt)
lncy=ln(cyt)
lnfg=ln(fgt)
lngg=ln(ggt)
为了防止“伪回归”现象出现,运用ADF检验对时间序列进行平稳性检验,它是对以下3个模型分别顺序进行t检验:
式中,α为截距项,且为常数,β0 t为时间趋势项,εt独立同分布,且服从正态分布,Δyt-i为因变量的滞后差分项,其中p为滞后阶数。公式(4)代表均不含截距项α和时间趋势β0 t,公式(5)代表不含时间趋势项β0 t但含截距项α,公式(6)表示含截距项α和时间趋势项β0 t。
1.3 Kernel密度估计
用来估计概率密度函数的非参数方法被称为核密度估计,此方法利用一个移动的核函数在每个数据点上,然后将核密度函数的作用效果叠加起来,形成平滑的峰值函数来拟合观察值,避免了由模型的设定造成观察值和实际值之间的偏误,对真实的概率分布曲线进行估计[29,30,31]。设随机变量的密度函数为f(x),x点的概率密度函数为:本文设x为碳排放量,N代表观测对象的个数,K(·)代表核函数(积分为1且均值为0)。h代表带宽,是反映核密度估计曲线的平滑程度的,h越大,核密度估计曲线越平坦,h越小,核密度估计曲线越陡峭。所以带宽的选择应该满足以下公式:
核函数是一种平滑函数,Kernel 密度函数有多种形式,主要分为三角核函数、四次核函数、Epanechnikov核函数、Gaussian核函数等类型[32]。本文为了更好地分析中国的农地利用净碳排放的分布动态演变趋势,采用Gaussian核函数模型如下:
1.4 数据来源与整理
本文所使用的化肥、农药、农膜、柴油、农业总产值、有效灌溉面积、农作物面积和总人口数据来自1994—2018年《湖北统计年鉴》、《中国农村统计年鉴》和湖北省土地利用变更调查数据。化肥、农药、农膜和农用柴油均以湖北省实际使用量为准,农业灌溉面积数据采用有效灌溉面积数据,翻耕面积数据采用湖北省农作物的总面积。农业总产值以2005年为不变价,计算的实际农业总产值,再折算湖北省人均农业总产值。1.5 研究思路
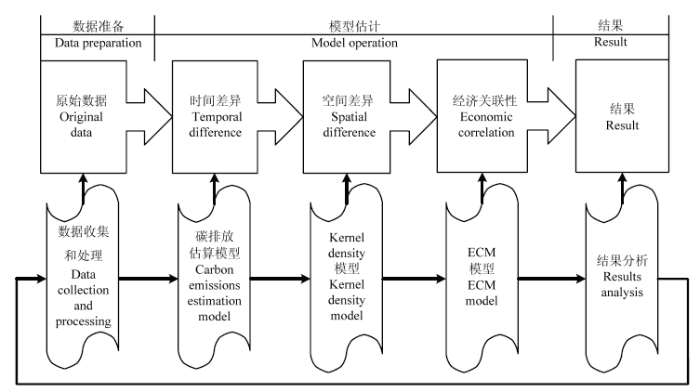
研究将分为3个步骤:(1)数据准备;(2)模型估计,分为时间差异分析、空间差异分析和经济关联性分析;(3)结果。具体如图1所示。图1
 新窗口打开|下载原图ZIP|生成PPT
图1研究框架图
Fig. 1Research framework
2 结果
2.1 湖北省农业碳排放特征分析
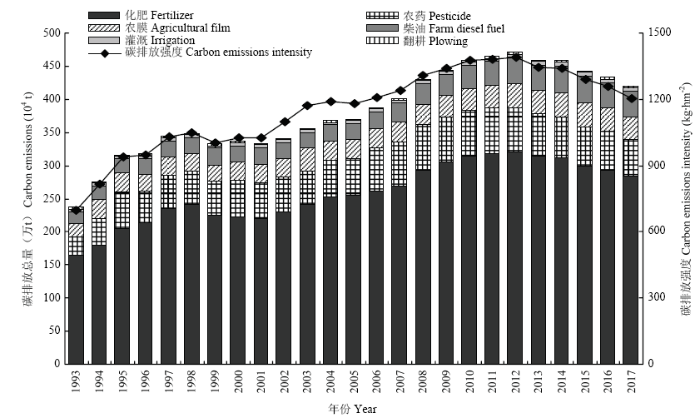
根据上面给出的碳排放测算公式,测算1993—2017年湖北省农业碳排放量。结果表明湖北省农业碳排放量从1993年的236.48万t增长到2017年的419.73万t,年平均递增2.21%。总体上,1993—2012年湖北省碳排放总量为波动上升,2012年湖北省农业碳排放总量达到,最大值470.75万t,2012—2017年为缓慢下降阶段。其中,化肥、农药、农膜、柴油、翻耕和农业灌溉的年平均递增分别为2.23%、2.44%、2.40%、3.32%、0.44%和2.32%。(图2)。图2
 新窗口打开|下载原图ZIP|生成PPT
图21993—2017年湖北省农业碳排放量
Fig. 2Changes on carbon emissions of agriculture from 1993 to 2017 in Hubei Province
总体来说,从1993到2017年碳排放总量是呈上升后下降趋势,在1993—1997年急速上升,但在1998—2001年由于湖北省遇到了百年一遇的特大洪灾,全省农业受到极大的冲击,有小幅度的下降但后面增速又有所回升,到了2012年以后为平稳下降。从碳排放强度来看,总体上是呈升-降的趋势,特别是在2009年后碳排放强度大幅下降,正因为2009年我国“十二五”规划提出:五年期间全国碳排放强度下降17%。由此可以看出湖北省也越来越重视绿色发展,大力推行绿色生产方式,不断加大农业环境治理力度,增强农业绿色发展能力,碳排放总量和强度增速有所放缓,但还需进一步出台并落实更为有效的农业减排措施。
由图2可知,1993—2012年化肥、农药、农膜、农用柴油、翻耕和农业灌溉等6类碳源所产生的碳排放量在都呈现逐渐上升的趋势,其中柴油的涨幅较为剧烈,主要的原因是农业的机械化,大量使用机械来进行农业活动,从而导致柴油的使用量不断上升;化肥对农业碳排放的贡献最大,占了总的碳排放的一半多,这说明大量使用化学制品虽然提高了产量但是会加大碳排放,因此要优化对化学制品的使用,提高利用效率,不断推进清洁生产,有机肥替代化肥,有序推进湖北省农业绿色发展实验示范区建设。2012年后6类碳源所产生的碳排放量均呈现不同程度的下降趋势,一方面,说明湖北省不断提高农业生产的质量和效率,重视农资的合理利用,在一定程度上抑制了碳排放的增长;另一方面,反映出湖北省正在逐步重视农业低碳化、生态化发展,尤其是化肥农药零增长行动取得了阶段性成果。从农业碳排放总量的环比增速来看,湖北省农业碳排放环比增速和碳排放的强度自2012年呈现下降的趋势,从1993年的697.02×10⁴ t·hm-2的碳排放强度上升到2012年的1 388.61×10⁴ t·hm-2(最大值),随后出现较为缓慢的下降,碳排放强度虽有下降,但碳排放强度的年增长率仍然为2.21%。这表明湖北省低碳农业存在广阔的发展空间,尤其是在低碳农业生产方式方面拥有巨大的发展潜力。
2.2 湖北省农业碳排放的演进趋势分析
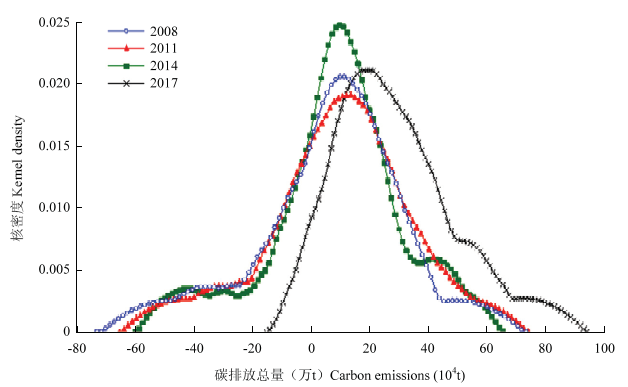
本文基于2005—2017年湖北省17个地(市,州)农业碳排放的面板数据对湖北省农业碳排放的时空演进趋势进行分析,系统地考察湖北省农业碳排放的地区差距和动态分布演进。图3为湖北省各地市州的碳排放总量在2008、2011、2014和2017年的Kernel密度曲线。图3
 新窗口打开|下载原图ZIP|生成PPT
图3湖北省农业碳排放趋势
Fig. 3The trend of agricultural carbon emission in Hubei Province
由图3可知,从具体来看,对比2008年,2011年的Kernel密度函数峰值明显下降,波峰变宽,分布曲线的右尾有明显向外延伸并且有所抬升,这说明在考察期内湖北省的农业碳排放的地区差距有明显的扩大;对比2011年,2014年的密度函数峰值有明显上升的趋势,分布曲线的左尾有微弱的向里移动,分布曲线的右尾呈现下降趋势,变化区间基本上没有发生变化,这表明在此考察期间内湖北省的农业碳排放的地区差距有变小的趋势,但并不显著;与2014年相比,2017年的分布曲线明显右移,且峰值下降,波峰明显变宽,分布曲线右尾抬升,表明此期内湖北省的农业碳排放的地区差距有明显的扩大。
从整体来看,Kernel密度函数的峰值先出现“降-升-降”趋势,整体上波峰是变平缓的,密度函数变化区间由宽变窄,分布曲线左尾向右移,右尾呈现明显向外延伸的趋势,整体上分布曲线逐渐向右移动,这表明在此样本考察期间内湖北省各地市州农业碳排放的地区差距有明显的扩大。总的上来说,湖北省地区之间农业碳排放的差距虽有波动,但湖北省农业碳排放的地区差距总体趋势是在不断扩大的。这可能一是因为鄂东、鄂中、鄂西地形不同影响了农业的发展,鄂东和鄂西以山地和丘陵为主,而鄂中位于江汉平原地区适宜发展农业,所以农业较为发达,农业碳排放也就相对较多;二是因为鄂东、鄂中和鄂西农业经济发展程度不一致,鄂中和鄂东农业经济较为发达,农业技术较鄂西先进,导致农业碳排放水平差距不断加大;三是为因地制宜的发展,湖北省在2008年提出建设“鄂西生态文明旅游圈”,大力发展旅游业,而鄂东和鄂中是武汉城市圈的核心地区,大力发展经济,这样使得湖北省各地市州农业碳排放的地区差距越来越大。
2.3 湖北省农业碳排放与经济发展的协整关系检验
首先对各变量进行单根检验,检验变量之间的平稳性,若平稳则进行协整回归,进一步对变量之间的协整关系进行检验,即对回归方程的残差进行单根检验,若残差序列的非平稳的,则变量之间不存在协整关系;若残差序列是平稳的,则说明方程的因变量和自变量之间存在协整关系,即长期稳定关系。然后对存在协整关系的变量进行误差修正,即将协整回归中的误差项看做均衡误差,通过对短期非均衡状态进行调整,提高模型的可靠性。通过采用EG两步检验法,分别对湖北省人均农业总产值、碳排放强度、化肥、农膜、农药、翻耕、农业灌溉以及农业柴油等时间序列进行单位根检验,检验平稳性的结果如表2所示。
Table 2
表2
表2变量的ADF单位根检验
Table 2
| 变量 Variable | (C,T,L) | ADF | 10%的临界值 10% critical value | 结果 Result |
|---|---|---|---|---|
| lnr | (C,T,1) | -2.619490 | -3.248592 | 不平稳 Nonstationary |
| Δlnr | (C,T,0) | -4.724729 | -3.248592 | 平稳 Stationary |
| lnqd | (C,T,4) | 1.668840 | -3.268973 | 不平稳 Nonstationary |
| Δlnqd | (C,T,0) | -4.066077 | -3.248592 | 平稳 stationary |
| lnny | (C,T,0) | -4.486446 | -2.635542 | 平稳 Stationary |
| lnnm | (C,T,0) | -3.590363 | -2.635542 | 平稳 Stationary |
| lnhf | (C,T,1) | -2.083700 | -2.638752 | 不平稳 Nonstationary |
| Δ(lnhf) | (C,T,0) | -2.467557 | -2.638752 | 不平稳 Nonstationary |
| Δ(lnhf,2) | (C,T,2) | -2.772617 | -2.650413 | 平稳 Stationary |
| lncy | (C,T,4) | -4.462896 | -3.268973 | 平稳 Stationary |
| lnfg | (C,T,0) | -1.058579 | -2.635542 | 不平稳 Nonstationary |
| Δ(lnfg) | (C,T,0) | -3.567947 | -2.638752 | 平稳 Stationary |
| lngg | (C,T,0) | -1.364105 | -2.635542 | 不平稳 Nonstationary |
| Δ(lngg) | (C,T,0) | -4.724753 | -2.638752 | 平稳 Stationary |
新窗口打开|下载CSV
lnny、lnnm、lncy原序列是稳定序列,lnr、lnqd、lnfg和lngg经过一阶差分后达到平稳,为一阶单整序列,lnhf为二阶单整序列。为了验证各碳排放指标强度可能存在的协整关系,按长期趋势方程:lnyt=α+βlnrt+?t对各碳排放指标强度进行对数线性回归,回归的结果如表3。
Table 3
表3
表3农业碳排放强度对经济增长的对数线性回归结果
Table 3
| 回归方程 Regression equation | lnqd | lnny | lnnm | lnhf | lncy | lnfg | lngg |
|---|---|---|---|---|---|---|---|
| 截距项 Intercept term | 4.044588 | 1.280000 | 0.613811 | 2.075700 | -1.592469 | 0.413725 | -0.180667 |
| lnr | 0.400699 | 0.367696 | 0.372047 | 0.463909 | 0.660435 | 0.058325 | 0.225756 |
| R2 | 0.671052 | 0.468211 | 0.730201 | 0.807386 | 0.920123 | 0.283119 | 0.583475 |
| F | 46.91988 | 20.25022 | 62.24868 | 96.40987 | 264.9415 | 9.083428 | 32.21875 |
| P-value | 0.000001 | 0.000162 | 0.000000 | 0.000000 | 0.000000 | 0.006185 | 0.000009 |
| DW | 0.166886 | 0.553936 | 1.629285 | 0.269658 | 0.662351 | 0.343682 | 0.779662 |
新窗口打开|下载CSV
然后在对农业碳排放强度对经济增长的对数线性回归得出的残差进行ADF单位根检验,即得到表4。
Table 4
表4
表4残差序列的ADF单位根检验结果
Table 4
| 变量 Variable | (C, T, K) | ADF | 10%临界值 10% critical value | P值 P-value | 结果 Result |
|---|---|---|---|---|---|
| e(lnqd) | (C,T,3) | -1.762135 | -1.607830 | 0.0743 | 平稳 Stationary |
| e(lnny) | (C,T,0) | -2.940086 | -1.608793 | 0.0051 | 平稳 Stationary |
| e(lnnm) | (C,T,0) | -4.965301 | -1.608793 | 0.0000 | 平稳Stationary |
| e(lnhf) | (C,T,0) | -1.288432 | -1.608793 | 0.1767 | 不平稳Nonstationary |
| e(lncy) | (C,T,2) | -4.278487 | -1.608175 | 0.0002 | 平稳 Stationary |
| e(lnfg) | (C,T,0) | -1.302478 | -1.608793 | 0.1726 | 不平稳 Nonstationary |
| e(lngg) | (C,T,0) | -3.322898 | -1.608793 | 0.0019 | 平稳 Stationary |
新窗口打开|下载CSV
由表4可以看出,在10%的检验水平下,化肥和翻耕的残差序列是不平稳的,即化肥、翻耕和人均农业总产值之间不存在协整关系,后面便不考虑相关序列。根据Granger协整定理,可以得出湖北省农业经济增长与总碳排放强度、农药碳排放强度、农膜碳排放强度、农用柴油碳排放强度和农业灌溉碳排放强度之间存在协整关系,得到的协整向量分别为(4.044588,0.400699)、(1.280000,0.367696)、(0.613811,0.372047)、(-1.592469,0.660435)、(-0.180667,0.225756)。因为变量之间具有协整关系这说明变量之间存在一种长期稳定的关系,鉴于此基本可以推断出湖北省还处于传统耕作模式向绿色低碳耕作模式转变的关键期,并且这种发展模式已存在较长时间,这与湖北省农业发展的历史情况基本相符合。
建立相应的误差修正项ECM如下。
碳排放强度-经济增长ECM项:
ecm(lnqd)=lnqdt-4.044588-0.400699lnrt
农药使用碳排放强度-经济增长ECM项:
ecm(lnny)=lnnyt-1.280000-0.367696lnrt
农膜使用碳排放强度-经济增长ECM项:
ecm(lnnm)=lnnmt-0.613811-0.372047lnrt
柴油使用碳排放强度-经济增长ECM项:
ecm(lncy)=lncyt+1.592469-0.660435lnrt
灌溉的碳排放强度-经济增长ECM项:
ecm(lngg)=lnggt+0.180667-0.225756lnrt
遵循动态经济计量学的“一般到特殊”的建模思想,先设定农业经济增长和农业碳排放强度(设滞后阶数为2)的自回归分布滞后模型如下:
lnyt=α0+α1lnyt-1+α2lnyt-2+α3lnrt+α4lnrt-1+α5lnrt-2+?t
逐次剔除不显著的变量,得到:
lnqd=1.468503+0.434191lnqdt-1+0.409156lnqdt-2+0.194127lnrt-0.241570lnrt-2
Adjusted R2=0.966856 DW=2.113440 F=131.2700 P=0.000
lnny=2.275572+0.307667lnnyt-2+0.578338lnrt-0.507051lnrt-1
Adjusted R2=0.526166 DW=1.095332 F=7.032819 P=0.002262
lnnm=1.680944+0.588740lnrt
Adjusted R2=0.730201 DW=1.629285 F=62.24868 P=0.000
lncy=-0.582728+0.619506lncyt-1+0.251008lnrt
Adjusted R2=0.981865 DW=1.518428 F=568.4820 P=0.000
lngg=-0.377167+0.458452lnggt-1+0.159081lnrt
Adjusted R2=0.776455 DW=1.769775 F=40.94384 P=0.000
对湖北省农业经济发展与农业碳排放强度进行误差修正,修正结果如下:假如湖北省人均农业总产值每增加1%,农药碳排放强度、农膜碳排放强度、农用柴油碳排放强度以及农业灌溉碳排放强度分别增加0.58%、0.59%、0.25%和0.15%,农业碳排放总强度增加0.19%。
3 讨论
大多数研究中国农业碳排放的关联性,研究相对较为抽象和笼统,不具有针对性,而不同地区的农业碳减排现状不一样,减排潜力也有所不同,本文针对湖北省农业碳排放的时空特征,根据湖北省实际情况,从化肥、农药、农用薄膜、柴油、翻耕和农业灌溉6大碳源来测算湖北省农业碳排放,构建农业碳排放指标衡量体系,从整体上定量把握了湖北省低碳农业发展现状,并且结合湖北省低碳农业发展的现实,进一步分析湖北省农业碳排放总量、强度及6类碳源碳排放变化的原因。对现有的有关农业碳排放的经济关联性研究进行补充,目前研究多使用的数据主要局限于时间序列数据或截面数据,本文使用面板数据利用Kernel密度估计对农业碳排放进行动态分布与趋势演变,不仅限于静态分析,而是采用多角度动态分析。
运用协整理论与误差修正模型,对湖北省经济增长与农业碳排放的关联性进行了实证分析,定量揭示湖北省农业碳排放及与经济增长关系,深入剖析湖北省农业碳排放存在的问题和对策,研究具有较强针对性,对于推进湖北省农业供给侧结构性改革,加快实施农业转型升级和高质量发展具有一定的实践指导意义。
研究也具有一定的局限性,虽然探索了湖北省农业碳排放与经济的关联性,但并没有深入研究如何合理的平衡湖北省农业经济发展和农业碳减排之间的关系,后续研究需要对上述问题进行深入的探讨。
4 结论
4.1 近些年,湖北省农业碳排放总量、强度和6类碳源碳排放均出现不同程度的下降趋势,这说明湖北省逐步重视农业低碳化、生态化发展,并取得阶段性成果。4.2 湖北省各地市州农业碳排放的地区差距有明显的扩大,可能因为农业经济发展、生产条件和地区发展战略不同而导致地区间农业碳排放差距越来越明显。
4.3 湖北省农业经济增长与农业碳排放总强度,与农药、农膜、农用柴油和农业灌溉的碳排放强度之间存在长期稳定关系。湖北省人均农业总产值每增加1%,农药、农膜、农用柴油和农业灌溉的碳排放强度分别增加0.37%、0.59%、0.25%和0.09%,农业碳排放总强度增加0.19%。
参考文献 原文顺序
文献年度倒序
文中引用次数倒序
被引期刊影响因子
[本文引用: 1]
[本文引用: 1]
[本文引用: 1]
[本文引用: 1]
[本文引用: 1]
[本文引用: 1]
[本文引用: 1]
[本文引用: 1]
DOI:10.1016/j.jtbi.2018.12.023URLPMID:30571960 [本文引用: 1]

The evolutionary design of regulatory control balances various tradeoffs in performance. Fast reaction to environmental change tends to favor plastic responsiveness at the expense of greater sensitivity to perturbations that degrade homeostatic control. Greater homeostatic stability against unpredictable disturbances tends to reduce performance in tracking environmental change. This article applies the classic principles of engineering control theory to the evolutionary design of regulatory systems. The engineering theory clarifies the conceptual aspects of evolutionary tradeoffs and provides analytic methods for developing specific predictions. On the conceptual side, this article clarifies the meanings of integral control, feedback, and design, concepts that have been discussed in a confusing way within the biological literature. On the analytic side, this article presents extensive methods and examples to study error-correcting feedback, which is perhaps the single greatest principle of design in both human-engineered and naturally designed systems. The broad framework and associated software code provide a comprehensive how-to guide for making models that focus on functional aspects of regulatory control and for making comparative predictions about regulatory design in response to various kinds of environmental challenge. The second article in this series analyzes how alternative regulatory designs influence the relative levels of genetic variability, stochasticity of trait expression, and heritability of disease.
DOI:10.1016/j.jtbi.2018.12.023URLPMID:30571960 [本文引用: 1]
The evolutionary design of regulatory control balances various tradeoffs in performance. Fast reaction to environmental change tends to favor plastic responsiveness at the expense of greater sensitivity to perturbations that degrade homeostatic control. Greater homeostatic stability against unpredictable disturbances tends to reduce performance in tracking environmental change. This article applies the classic principles of engineering control theory to the evolutionary design of regulatory systems. The engineering theory clarifies the conceptual aspects of evolutionary tradeoffs and provides analytic methods for developing specific predictions. On the conceptual side, this article clarifies the meanings of integral control, feedback, and design, concepts that have been discussed in a confusing way within the biological literature. On the analytic side, this article presents extensive methods and examples to study error-correcting feedback, which is perhaps the single greatest principle of design in both human-engineered and naturally designed systems. The broad framework and associated software code provide a comprehensive how-to guide for making models that focus on functional aspects of regulatory control and for making comparative predictions about regulatory design in response to various kinds of environmental challenge. The second article in this series analyzes how alternative regulatory designs influence the relative levels of genetic variability, stochasticity of trait expression, and heritability of disease.
[本文引用: 2]
[本文引用: 2]
[D].
DOI:10.1016/j.scitotenv.2019.02.363URLPMID:30852204 [本文引用: 1]
The Beijing-Tianjin-Hebei region's rapid economic development has led to a dramatic increase in its CO2 emissions, which is closely related to various regions' consumption habits and structures. In this paper, the decomposition analysis method based on input and output (IO-SDA) was applied to decompose the CO2 emissions change of the Beijing-Tianjin-Hebei region from 1997 to 2012 into five driving factors: population, carbon emission efficiency, production structure, final use structure and per capita regional GDP, and then the final use structure factor was further analyzed. The results show that: (1) the population and per capita regional GDP promote the CO2 emissions of all regions; Carbon emission efficiency is the biggest offsetting factor; The effect of final use structure changes on the growth of CO2 emissions in Beijing and Hebei remains unchanged. The effect on Tianjin was from 0.7Mt offset to 0.8Mt promotion. (2) Urban household consumption is the most important factor offsetting CO2 emissions in Beijing. Investment and export are the most important final use types for promoting the growth of CO2 emissions in Tianjin and Hebei, with the contribution of 95.78% and 88.09%, respectively. (3) From the sectoral perspective: The construction sector has the greatest impact on the total capital formation of the three regions. In terms of exports, Beijing's tertiary industry has the largest offsetting effect, while Tianjin and Hebei mainly rely on the promotion of metal smelting and other manufacturing industries. Finally, some policy implications for low carbonization are proposed in the Beijing-Tianjin-Hebei region.
[本文引用: 1]
[本文引用: 1]
[本文引用: 1]
[本文引用: 1]
[本文引用: 1]
[本文引用: 1]
[本文引用: 1]
[本文引用: 1]
[本文引用: 1]
[本文引用: 1]
DOI:10.1016/j.scitotenv.2019.05.028URLPMID:31078854 [本文引用: 1]
Economic development drives industrialization, which increased the value of the extracted natural resources. Excessive usage of natural resources, through agriculture, deforestation, and mining can affect the environment. In this regard, the present study investigates the effects of natural resources' abundance on carbon dioxide (CO2) emissions. The study uses annual panel data spanning from 1990 to 2015 in BRICS countries. The augmented mean group (AMG) panel algorithm, robust to crosssectional dependence and heterogeneity, infers the heterogeneous effect of natural resources on CO2 emissions among BRICS countries. Abundance of natural resources mitigates CO2 emission in Russia, but contributes to pollution in South Africa. In addition to this, natural resources help to form Environmental Kuznets Curve (EKC) hypothesis in Brazil, China, Russia, and South Africa. Finally, causality analysis suggested feedback hypothesis between natural resources and CO2 emissions.
DOI:10.1016/j.ecolecon.2010.06.004URL [本文引用: 1]
DOI:10.1016/j.enpol.2011.06.028URL [本文引用: 1]
This study aims to investigate a relationship between economic development and air pollution at the regional level, and further suggest energy policies for climate change mitigation. The present study examines an Environmental Kuznets Curve (EKC) hypothesis analyzing annual panel data of 16 metropolitan regions in Korea over a 16-year time period. The analysis results show that there is no one-dominant shape of EKC for SO(2) and NO(2); each region has its own EKC. That is, although we find the potential existence of U-shaped and N-shaped curves, the region-specific coefficients are enormously heterogeneous across regions. For CO, on the other hand, the random coefficient model shows that there is a dominant U-shaped curve across regions. In addition, energy consumption appears to be the most significant variable in explaining air pollution. Based on these results, we assert that environmental policy should consider the different characteristics of each region and type of pollutant. (C) 2011 Elsevier Ltd.
DOI:10.1161/CIRCULATIONAHA.119.042155URLPMID:31841369 [本文引用: 1]
Following regulatory guidance set forth in 2008 by the US Food and Drug Administration for new drugs for type 2 diabetes mellitus, many large randomized, controlled trials have been conducted with the primary goal of assessing the safety of antihyperglycemic medications on the primary end point of major adverse cardiovascular events, defined as cardiovascular death, nonfatal myocardial infarction, or nonfatal stroke. Heart failure (HF) was not specifically mentioned in the US Food and Drug Administration guidance and therefore it was not a focus of these studies when planned. Several trials subsequently showed the impact of antihyperglycemic drugs on HF outcomes, which were not originally specified as the primary end point of the trials. The most impressive finding has been the substantial and consistent risk reduction in HF hospitalization seen across 4 trials of sodium glucose cotransporter 2 inhibitors. However, to date, these results have not led to regulatory approval of any of these drugs for a HF indication or a recommendation for use by US HF guidelines. It is therefore important to explore to what extent persuasive treatment effects on nonprimary end points can be used to support regulatory claims and guideline recommendations. This topic was discussed by researchers, clinicians, industry sponsors, regulators, and representatives from professional societies, who convened on the US Food and Drug Administration campus on March 6, 2019. This report summarizes these discussions and the key takeaway messages from this meeting.
DOI:10.1016/j.jeem.2005.08.001URL [本文引用: 1]
DOI:10.1016/S0921-8009(01)00280-4URL [本文引用: 1]
Abstract
Empirical studies of the Environmental Kuznets Curve (EKC) examine the presence or otherwise of an inverted U-shaped relationship between the level of pollution and the level of income. Customarily, in the diagram of EKC the level of income is shown on the horizontal axis and that of pollution on the vertical axis. Thus, it is presumed that the relationship between income and pollution is one of unidirectional causality with income causing environmental changes and not vice versa. The validity of this presumption is now being questioned. It is being asserted that the nature and direction of causality may vary from one country to the other. In this paper, we present the results of a study of income–CO2 emission causality based on a Granger causality test to cross-country panel data on per capita income and the corresponding per capita CO2 emission data. Briefly, our results indicate three different types of causality relationship holding for different country groups. For the developed country groups of North America and Western Europe (and also for Eastern Europe) the causality is found to run from emission to income. For the country groups of Central and South America, Oceania and Japan causality from income to emission is obtained. Finally, for the country groups of Asia and Africa the causality is found to be bi-directional. The regression equations estimated as part of the Granger causality test further suggest that for the country groups of North America and Western Europe the growth rate of emission has become stationary around a zero mean, and a shock in the growth rate of emission tends to generate a corresponding shock in the growth rate of income. In contrast, for the country groups of Central and South America, Oceania and Japan a shock in the income growth rate is likely to result in a corresponding shock in the growth rate of emission. Finally, causality being bi-directional for the country groups of Asia and Africa, the income and the emission growth rates seemed to reinforce each other.URL [本文引用: 1]
为了便于比较我国循环农业发展的历史轨迹和区域差异,构建了一套统一的评价指标体系,并从时间和空间维度上对我国循环农业发展进行了综合评价和制约性分析。结果显示:1999-2008年间我国循环农业发展水平总体呈现出上升态势。从因素类型来看,经济与社会发展对我国循环农业发展的制约性先增强后减弱,资源的减量投入制约最大且逐年增强,资源循环利用和资源环境安全的制约性逐年减弱;2008年我国31个省市区的循环农业发展差异明显,水平较高的地区主要集中在东北和中西部地区,而水平较低的则主要集中在东部沿海地区。??
URL [本文引用: 1]
为了便于比较我国循环农业发展的历史轨迹和区域差异,构建了一套统一的评价指标体系,并从时间和空间维度上对我国循环农业发展进行了综合评价和制约性分析。结果显示:1999-2008年间我国循环农业发展水平总体呈现出上升态势。从因素类型来看,经济与社会发展对我国循环农业发展的制约性先增强后减弱,资源的减量投入制约最大且逐年增强,资源循环利用和资源环境安全的制约性逐年减弱;2008年我国31个省市区的循环农业发展差异明显,水平较高的地区主要集中在东北和中西部地区,而水平较低的则主要集中在东部沿海地区。??
DOI:10.1016/j.envpol.2007.06.030URLPMID:17706849 [本文引用: 1]
Agriculture is a source for three primary greenhouse gases (GHGs): CO(2), CH(4), and N(2)O. It can also be a sink for CO(2) through C sequestration into biomass products and soil organic matter. We summarized the literature on GHG emissions and C sequestration, providing a perspective on how agriculture can reduce its GHG burden and how it can help to mitigate GHG emissions through conservation measures. Impacts of agricultural practices and systems on GHG emission are reviewed and potential trade-offs among potential mitigation options are discussed. Conservation practices that help prevent soil erosion, may also sequester soil C and enhance CH(4) consumption. Managing N to match crop needs can reduce N(2)O emission and avoid adverse impacts on water quality. Manipulating animal diet and manure management can reduce CH(4) and N(2)O emission from animal agriculture. All segments of agriculture have management options that can reduce agriculture's environmental footprint.
DOI:10.1016/S0167-8809(01)00233-XURL [本文引用: 1]
DOI:10.1080/15427520902969906URL [本文引用: 1]
[本文引用: 1]
[本文引用: 1]
[本文引用: 1]
[本文引用: 1]
[本文引用: 1]
[本文引用: 1]
[本文引用: 1]
[本文引用: 1]
[本文引用: 1]
[本文引用: 1]
URL [本文引用: 1]
能源消费是碳排放的主要来源.随着中国经济的快速发展,能源消费的急剧增长以及以煤为主的能源结构在短期内很难改变,因此,碳排放不可避免地会出现一定幅度的增加.本文基于碳排放量的基本等式,采用对数平均权重Divisia分解法(Logarithmic mean weight Divisia method,LMD),建立中国人均碳排放的因素分解模型,定量分析了1995-2004年间,能源结构、能源效率和经济发展等因素的变化对中国人均碳排放的影响,结果显示经济发展对拉动中国人均碳排放的贡献率呈指数增长,而能源效率和能源结构对抑制中国人均碳排放的贡献率都呈倒"u".这说明能源效率对抑制中国碳排放的作用在减弱,以煤为主的能源结构未发生根本性变化,能源效率和能源结构的抑制作用难以抵销由经济发展拉动的中国碳排放量增长.
[本文引用: 1]
[本文引用: 1]
[本文引用: 1]
[本文引用: 1]
[本文引用: 1]
[本文引用: 1]
DOI:10.1016/j.chnaes.2016.09.003URL [本文引用: 1]
DOI:10.1016/j.chnaes.2016.09.003URL [本文引用: 1]
