 ,1,2
,1,2Temporal and Spatial Variation Characteristics of Phosphorus Element Flows in the Crop-Livestock Production System of Hainan Island
DING Shang1, GUO HaoHao1, SONG ChenYang1, DIAO XiaoPing2, ZHAO HongWei,1,2通讯作者:
收稿日期:2018-08-25接受日期:2018-11-9网络出版日期:2019-03-01
| 基金资助: |
Received:2018-08-25Accepted:2018-11-9Online:2019-03-01
作者简介 About authors
丁尚,E-mail:

摘要
关键词:
Abstract
Keywords:
PDF (1253KB)元数据多维度评价相关文章导出EndNote|Ris|Bibtex收藏本文
本文引用格式
丁尚, 郭浩浩, 宋晨阳, 刁晓平, 赵洪伟. 海南岛农牧生产体系磷元素流动时空变化特征[J]. 中国农业科学, 2019, 52(5): 860-873 doi:10.3864/j.issn.0578-1752.2019.05.008
DING Shang, GUO HaoHao, SONG ChenYang, DIAO XiaoPing, ZHAO HongWei.
0 引言
【研究意义】磷元素既是动植物生长所需重要营养元素,同时也是农牧业生产中的重要养分资源[1]。比起氮元素,生物圈中磷元素稀少,农业生产土壤磷素获取困难[2]。磷肥的使用保证了作物营养元素的供应,是粮食增产的重要保障[3]。但随着磷肥的不合理施用,大量的磷素累积于土壤中,造成了资源浪费和环境污染等问题[4,5],畜牧业生产中,畜禽粪尿的排放也造成了一定的环境问题[6]。因此,在农牧业发展过程中,需实现对磷素的优化管理。海南自1988年建省办经济特区以来,农牧业已取得长足发展,农业现代化水平不断提高,但同时也出现了农牧发展不均衡,农牧生产体系结合不紧密等现象。因而了解该区域农牧生产体系磷素流动规律,对提高体系磷循环、优化区域养分资源配置和促进海南岛农牧业可持续发展具有重要意义。【前人研究进展】目前,针对养分流动及其平衡管理问题国内外****已有相关研究。SENTHILKUMAR等[7]利用物质流分析的方法,以法国为研究区域,量化了区域尺度上土壤磷流动和磷预算对农业生产系统的依赖程度;VAN DIJK等[8]则进一步分析了欧盟国家的磷流动,通过考虑具体国家相关数据和历史背景,研究包括了“作物生产-动物生产-食品加工-非食品生产-消费”等5大部分,为解决“phosphorous challenges”问题提供了科学的解决方案。在畜禽养殖中的氮磷流动研究上,LIANG等[9]通过优化畜禽粪尿在不同区域间的运输,提高了农牧结合的紧密程度;MA等[10]则基于物质流分析的方法构建了中国食物链养分流动模型(NUtrient flows in Food chains, Environment and Resources use,NUFER),用于分析评价区域氮磷养分在生产和消费环节的利用率和损失状况。随后,BAI等[11]利用NUFER模型,定量分析了全国尺度粮食生产和消费链中磷的使用和损失情况,发现了磷的使用与GDP变化间的非线性关系以及与蔬菜、水果、动物来源之间的线性关系,并采用情景分析探讨了至2030年实现更加可持续的磷利用途径。在区域尺度上,张华芳等[12]以河北省为研究对象,对农牧生产体系磷素流动特征及其环境效应进行了详细分析;张建杰等[13]则使用NUFER模型与ArcGIS相结合,从时空维度分析了2011年山西省11个地/市农牧生产体系磷元素流动特征及环境风险,提出应进一步加强农牧耦合程度、提高有机废弃物的循环利用效率以实现区域间养分的高效利用。这些研究通过引入方法或模型,使得食物链和农牧生产体系的养分流动规律更加清晰,同时也为养分管理提供了科学依据。【本研究切入点】目前,对海南地区农牧生产体系的研究较少,关于体系的磷素输入输出量核算、磷素利用率、体系的结合程度以及环境效应等方面的研究尚不明确。【拟解决的关键问题】基于NUFER模型,通过数据核算与实地调研,分析1987—2016年间海南热带特色农牧生产体系磷素流动、利用率和环境排放特征,明确不同区域间养分流动差异,以期为海南岛农牧业生产乃至热带地区磷素流动管理提供科学参考。1 材料与方法
1.1 研究区概况
海南岛是我国第二大岛,位于东经108°37′E—111°03′E,北纬18°10′N—20°10′N,面积约3.39万平方公里。海南岛属热带季风气候,全年气候温和,典型土壤为砖红壤,是发展热带特色高效农业的宝地。1987—2016年,本地农牧业取得较快发展。2016年瓜果蔬菜产量为975.14万吨,主要热带作物产量为64.81万吨,农业总产值695.64亿元。截止2016年底,畜牧业总产值达267.10亿元,牲畜年出栏量638万头,家禽年出栏量15 315万只,其中肉蛋奶类总产量达81.41万吨[14]。1.2 研究方法
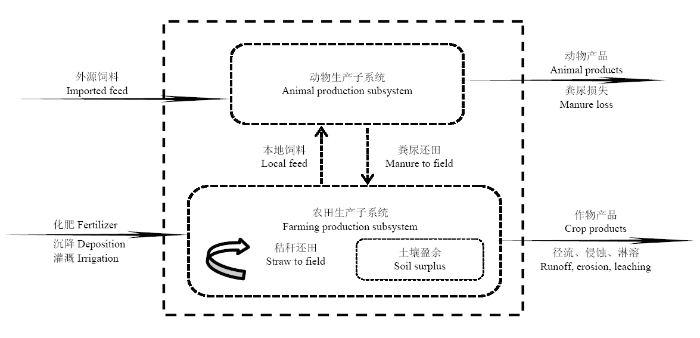
NUFER模型适用于国家或区域尺度上养分流动研究,可以模拟“土壤-作物生产-畜禽生产-家庭消费”系统磷素流动过程和利用率[15]。本研究基于NUFER模型,以“土壤-作物-畜禽”为研究对象,定量海南岛农牧生产体系磷素流动时空变化特征(图1),研究单元为海南省18个市/县(三沙市除外)。图1
 新窗口打开|下载原图ZIP|生成PPT
图1农牧生产体系磷素流动模型
Fig. 1Schematic diagram of phosphorus flows model in the crop-livestock production system
1.3 计算方法
农牧生产体系中,农田生产子系统磷素输入项包括化肥投入、粪尿还田、农田灌溉、干湿沉降等;输出项包括本地饲料供应、作物产品输出、土壤淋洗及径流侵蚀作用;动物生产子系统磷素输入项包括饲料投入(本地饲料投入及外源饲料投入),输出项包括动物主副产品输出,以及粪尿损失等。体系磷素循环包括秸秆还田、粪尿还田和本地饲料。1.3.1 农田生产子系统磷流动项
输入项PIMPfarm=Pfer+$\sum\limits_{i=1}^{8}{{{\text{P}}_{\text{mtf}}}}$+Pirr+Pad;
输出项PEXPfarm=$\sum\limits_{i=1}^{15}{{{\text{P}}_{\text{gra}}}}$+$\sum\limits_{i=1}^{7}{{{\text{P}}_{\text{str}}}}$+Prel+Pfeedin。
式中,Pfer为化肥磷输入;$\sum\limits_{i=1}^{8}{{{\text{P}}_{\text{mtf}}}}$为粪尿还田;Pirr为灌溉水磷输入;Pad为干湿沉降磷输入。$\sum\limits_{i=1}^{15}{{{\text{P}}_{\text{gra}}}}$为主产品磷输出;$\sum\limits_{i=1}^{7}{{{\text{P}}_{\text{str}}}}$为副产品磷输出;Prel为土壤径流、侵蚀、淋溶磷输出。
1.3.2 动物生产子系统磷流动项 输入项PIMPanimal =Pfeedimport+Pfeedin;输出项PEXPanimal=$\sum\limits_{i=1}^{8}{{{\text{P}}_{\text{pro}}}}$+Pful。式中,Pfeedimport为外源饲料磷输入;Pfeedin为本地饲料磷输入。$\sum\limits_{i=1}^{8}{{{\text{P}}_{\text{pro}}}}$为动物主副产品磷输出;Pful为粪尿磷输出。
1.3.3 农牧生产体系磷素评价指标 农田生产子系统磷利用率(PUEc)=作物主产品磷素量/农田子系统磷素总投入×100%;动物生产子系统磷利用率(PUEa)=动物主产品磷素量/动物子系统磷素总投入×100%;农牧结合系统磷素综合利用率(PUEc+a)=(作物主产品磷素量+动物主产品磷素量-作物主产品饲用量)/农牧系统磷素总投入×100%;土壤磷素盈余量=农田输入磷素量-农田输出磷素量;体系间磷循环量=秸秆还田磷素+本地饲料磷素+粪尿还田磷素。
1.4 数据来源
本文数据来源包括3个方面:本地数据、统计数据以及文献数据。本地数据:本地数据包括热带地区单位面积干湿沉降磷量[16],基于MITERRA-EUROPE模型[17]的本地径流、侵蚀、淋溶因子,海南省畜牧技术推广总站提供的海南岛畜牧养殖基本信息,调研获得的作物种植、畜禽粪尿回收利用情况。
统计数据:本研究所需数据包括1987—2016年海南省各市/县耕地数量、主要农作物播种面积及产量、畜牧业生产情况等主要来源于海南省统计年鉴[14]。
文献数据:农田生产子系统中,主产品含磷比例来自《中国食物成分表》[18]和张少若等研究结果[19,20,21,22],草谷比、秸秆养分含量等参考李书田等[23]研究,南方地区单位灌溉面积磷含量参考鲁如坤等[24]研究结果,作物产品饲用比例、粪尿还田比例在结合调研和马林[25]研究成果上获得。动物生产子系统中,畜禽粪尿排泄量和含磷比例等来自王方浩等研究结果[6,26-27],动物活体各部分磷含量参考张建杰等[13]研究数据。
1.5 情景分析设计
有研究表明[28,29],在2005年的基础上,中国2030年植物性和动物性食品的总需求将分别增加25%和80%,其中玉米和大豆的产量将增加40%,其他作物产量将增加10%。在生态文明建设方面,预计到2030年,畜禽粪便资源化利用率达到90%,畜禽规模保持稳定增长[30]。《海南省现代农业“十三五”发展规划》(2016—2020)指出[31],家畜数量将缓慢增加,家禽数量将进一步提高,粪尿还田率达到75%,5年内化肥使用减少5%,结合当前海南省化肥使用过量的情况,2030年化肥施用量在2016年的基础上可减少20%—30%,秸秆还田利用率可达到85%以上。据此设计3种情景进行分析。情景1(S1):到2030年,化肥施用量较2016年减少25%,根据近年畜禽养殖数量变化,在2016年的基础上,家畜按15%增长计算,家禽按50%增长计算,植物性食品按10%增长进行计算。
情景2(S2):到2030年,化肥施用量较2016年减少25%,依据CHEN等[28]的预测,在2005年的基础上,植物性食品增加25%,动物性食品增加80%。结合海南发展实际,家畜规模按35%增长计算,家禽规模按85%增长计算,畜禽粪便资源化利用率达到90%(其中粪尿还田部分为75%)。
情景3(S3):根据《海南省现代农业“十三五”发展规划》中各项指标进行农牧业生产,2030年农牧规模与2020年保持一致。在此基础上秸秆还田、作物饲用和粪尿还田比例上升10%。
2 结果
2.1 海南岛农田、动物生产子系统30年间磷素流动变化
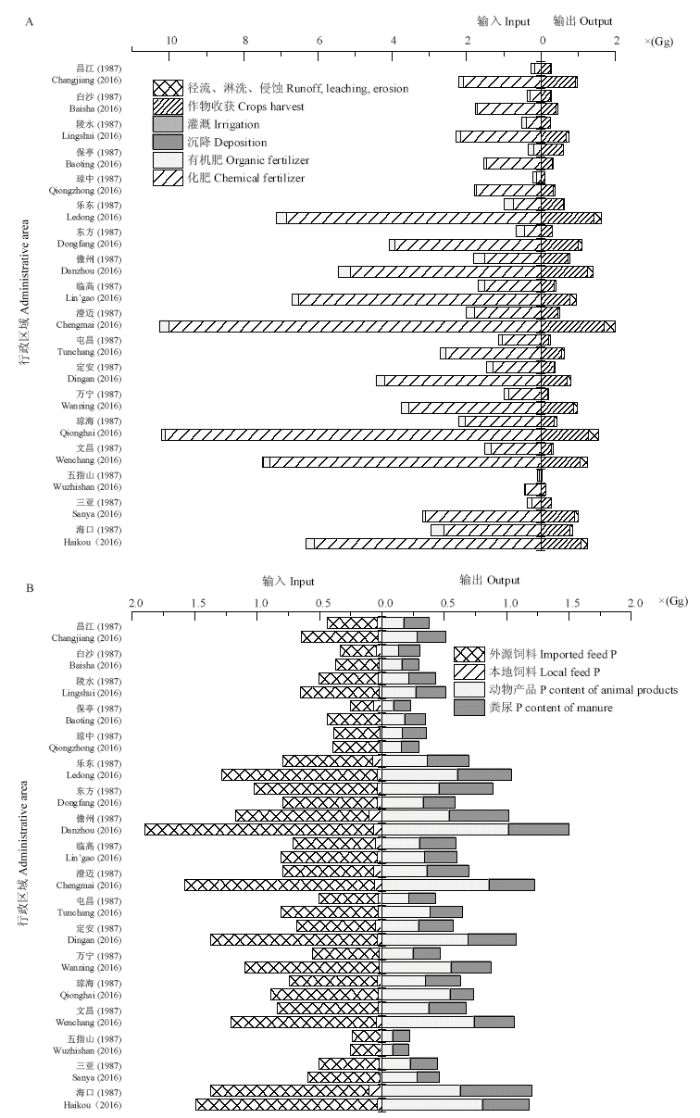
1987—2016年,海南岛农田生产子系统磷素输入、输出量增长较快(图2-A、2-B),总输入量由21.34 Gg增至81.19 Gg,2016年较1987年增长了2.80倍。其中化肥一直是农田生产子系统磷素输入的重要来源,1987年,其磷素输入量为19.01 Gg,占农田总投入量的89.08%,到2016年,化肥磷素投入量为79.23 Gg,占农田总投入的97.59%。有机肥料投入30年间维持在2.70—4.28 Gg,在农田生产子系统中始终占据较小比例。从磷素输出量来看,农田生产子系统输出总量由1987年的6.20 Gg增至2016年的18.20 Gg,作物产品作为农田磷素主要输出项,30年间由5.25 Gg增至15.48 Gg,较30年前增长了1.95倍。径流、侵蚀和淋溶损失量较小,总损失量由0.52 Gg增至2.18 Gg,维持在农田生产子系统磷素总输出的8.39%—11.98%。对于动物生产子系统(图2-C、2-D),磷素输入主要分为两个阶段,第一阶段为快速增长阶段(1987—2005),磷素总投入由11.40 Gg增至19.92 Gg;第二阶段为减产后缓慢增加阶段(2006—2016),磷素总输入量由13.17 Gg增至15.31 Gg。其中外源饲料为动物生产子系统磷素输入主要来源,30年间由10.97 Gg增至14.77 Gg,维持在系统磷素总投入的95.35%以上。从输出项来看,动物生产子系统输出总量由1987年的9.63 Gg增至2016年的11.90 Gg。其中畜禽粪尿量变化缓慢,30年间维持在3.34—5.81 Gg,而动物产品磷素输出量由1987年的5.65 Gg增至2005年的10.60 Gg,近年保持在8.00 Gg左右。图2
 新窗口打开|下载原图ZIP|生成PPT
图2海南岛农田(A、B)、动物(C、D)生产子系统30年间磷素流动变化
Fig. 2Phosphorus flows changes in the farming production subsystem (A, B) and animal production subsystem (C, D) of Hainan Island in 30 years
2.2 海南岛农田、动物生产子系统磷素流动空间变化
1987—2016年,海南岛农田生产子系统不同区域间差异较大(图3-A),系统磷总输入量增长最快的是澄迈,30年间增加了7.65 Gg,其次为琼海、乐东,分别增加了7.41、5.58 Gg,五指山增长最慢,仅增长了0.15 Gg。从输入项构成看,澄迈、琼海等地30年间化肥磷素输入量增长较快,分别增加了8.22、8.05 Gg,五指山、保亭等地增长缓慢,增值分别为0.36、1.28 Gg。沉降、灌溉和有机肥料的磷素输入30年间无明显变化。农田生产子系统磷素总输出量增长最快的为澄迈,增长1.49 Gg,保亭较1987年降低0.32 Gg。从输出项构成看,各地作物产品磷素输出量增长均较为缓慢,且大多低于1.00 Gg,其中澄迈增长最快,为1.26 Gg,保亭较1987年略有降低,减少0.30 Gg。到2016年,各地径流、侵蚀和淋溶损失均在0.30 Gg以下,损失量较小。对于动物生产子系统(图3-B),澄迈30年间磷素总输入增长最多,为0.78 Gg,东方较1987年减少0.22 Gg。从输入项构成看,1987—2016年,各市/县外源饲料磷素输入量变化在0.79 Gg以下,2016年外源需求量较高的有儋州(1.84 Gg)、澄迈(1.52 Gg)、海口(1.45 Gg)。本地饲料磷素输入量较1987年略有降低。动物生产子系统磷素总输出量30年间变化不大,从输出项构成看,2016年儋州动物产品磷素输出量最多,五指山最少。动物粪尿磷素产生量较高的为儋州、乐东和定安,较低的为五指山、白沙和琼中。图3
 新窗口打开|下载原图ZIP|生成PPT
图3海南岛农田(A)、动物(B)生产子系统磷素流动空间变化
Fig. 3Spatial changes of phosphorus flows in the farming production subsystem (A) and animal production subsystem (B) of Hainan Island
2.3 海南岛农牧生产体系磷素损失时空分布特征
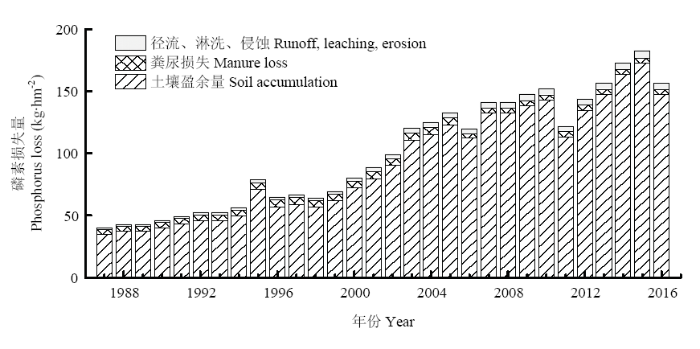
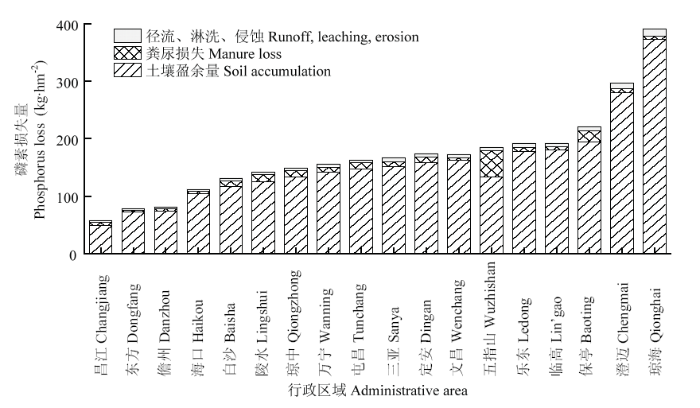
由于土壤对磷素吸附能力较强[32],导致磷在土壤中的移动性较差。农田生产子系统中,磷素主要通过积累在土壤中难以循环利用而损失。1987—2016年单位耕地面积土壤磷素盈余量快速增长,30年间由35.00 kg·hm-2增至147.40 kg·hm-2(图4)。2016年土壤磷素盈余量较大的为琼海、澄迈、保亭和临高,分别为372.79、279.82、194.14和181.09 kg·hm-2(图5)。磷的其他损失途径为土壤侵蚀、径流和淋洗,30年间损失量在1.21—5.85 kg·hm-2。在动物生产子系统中,磷素主要通过粪尿的直接排放而损失,畜禽粪便单位耕地面积承载量由1987年的3.83 kg·hm-2增至2005年的5.77 kg·hm-2,此后呈减少趋势,到2016年仅为3.77 kg·hm-2(图4)。空间分布上,2016年各市/县粪尿损失量较大的为五指山、保亭、陵水等地(图5)。图4
 新窗口打开|下载原图ZIP|生成PPT
图41987—2016年海南岛农牧生产体系磷素损失变化特征
Fig. 4Characteristics of phosphorus loss in the crop-livestock production system of Hainan Island from 1987 to 2016
图5
 新窗口打开|下载原图ZIP|生成PPT
图52016年海南岛农牧生产体系磷素损失空间变化特征
Fig. 5Spatial variation of phosphorus loss in the crop-livestock production system of Hainan Island in 2016
2.4 农牧生产体系磷素循环及利用率
农牧生产体系间磷素循环大致分为3个阶段(图6-A),第一阶段为1987—1998年,单位耕地面积磷素循环量从7.83 kg·hm-2增至11.80 kg·hm-2,第二阶段为1999—2004年,保持在11.00 kg·hm-2左右,第三阶段为2005—2016年,磷素循环量由10.03 kg·hm-2减至7.72 kg·hm-2。秸秆还田和本地饲料量呈现较小增幅,粪尿还田磷量则由1987年的5.36 kg·hm-2降至2016年的4.56 kg·hm-2。30年来,农田生产子系统磷素利用率由13.01%增至13.86%,动物生产子系统磷素利用率由4.78%增至7.62%,农牧生产体系磷素利用率缓慢增长,由1987年的10.78%增至2016年的13.09%(图6-B)。空间分布上(图7-A、7-B),2016年五指山、陵水、屯昌等地磷素循环量相对较高,分别为19.48、12.93和12.46 kg·hm-2。农牧生产体系磷素利用率昌江最高,为23.41%,临高最低,仅为7.37%。图6
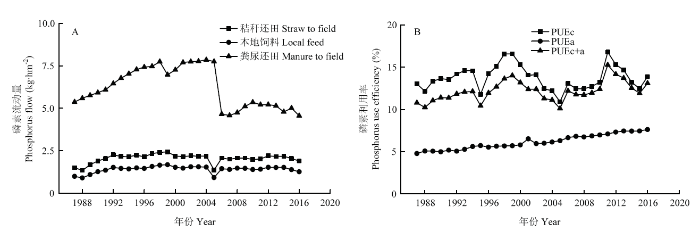 新窗口打开|下载原图ZIP|生成PPT
图6海南岛农牧生产体系磷素循环量(A)和利用率(B)变化
Fig. 6Changes of phosphorus circulation quantity (A) and use efficiency (B) in the crop-livestock production system of Hainan Island
图7
 新窗口打开|下载原图ZIP|生成PPT
图72016年海南岛农牧生产体系磷素循环量(A)和利用率(B)空间变化特征
Fig. 7Spatial variation of phosphorus circulation quantity (A) and use efficiency (B) in the crop-livestock production system of Hainan Island in 2016
2.5 基于情景设计下的海南岛2030年磷素流动
2016年海南岛农牧生产体系磷素主要输入量(磷肥和外源饲料)为94.00 Gg,单位耕地面积磷素损失量(径流、淋溶、侵蚀损失以及土壤磷盈余和粪尿损失)为156.27 kg·hm-2,动植物产品量为23.82 Gg,磷素利用率为13.09%。如图8所示,在减少化肥施用和维持农牧业稳定增长的情况下(S1),2030年海南岛农牧生产体系磷素主要输入量将达77.14 Gg,较2016年减少16.86 Gg,单位耕地面积磷素损失量为107.43 kg·hm-2,动植物产品磷素输出量将达到27.20 Gg,磷素利用率为17.68%。当减少化肥施用,并较快发展畜牧业和提高畜禽粪尿利用率时(S2),磷素主要输入量为78.76 Gg,单位耕地面积磷素损失量为123.46 kg·hm-2,动植物产品磷素输出量将达到21.54 Gg,磷素利用率为11.36%。当减缓发展速度,着力于提高各项效率时(S3),到2030年,农牧生产体系磷素主要输入量为85.40 Gg,单位耕地面积磷素损失量为126.78 kg·hm-2,动植物产品磷素输出量将达到27.07 Gg,磷素利用率为15.29%。图8
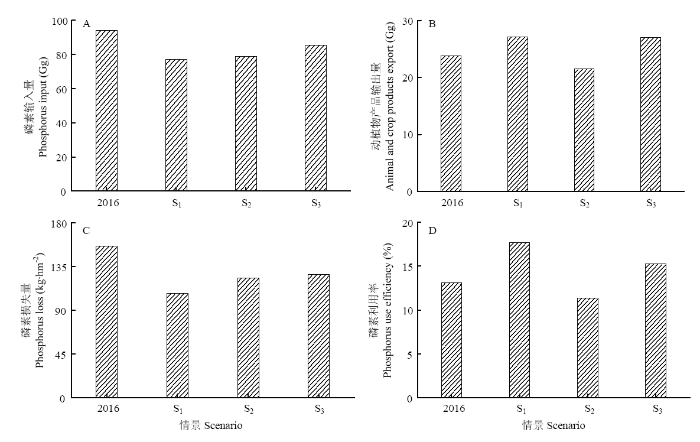 新窗口打开|下载原图ZIP|生成PPT
图8不同情景下磷素主要输入量(A)、产品输出量(B)、磷素损失量(C)和磷素利用率(D)比较
Fig. 8Comparison of major input amounts of phosphorus (A), output amounts of products (B), phosphorus loss (C) and phosphorus use efficiency (D) in different scenarios
3 讨论
3.1 海南岛农牧生产体系磷素流动时间变化特征
1987—2016年,海南岛农田生产子系统磷素输入量持续增长,化肥磷素输入量在总输入中的比例始终在89.08%以上,高于我国其他地区[13,15]。究其原因,由于热带区域自然条件,农田复种指数高,可一年四季进行农业耕作,磷肥不断投入以供作物养分需求。同时,海南岛土壤平均pH约为5[33],对磷元素吸附能力较强[34],致使磷素利用率较低,磷肥投入量不断增加。在高磷肥投入条件下,海南岛土壤磷素盈余量快速增长,2016年海南岛单位耕地面积土壤磷素盈余量为147.40 kg·hm-2,这与陈敏鹏等[35]报道的基于全国尺度的土壤表观氮磷平衡清单相符(海南大部分区域位于100—300 kg·hm-2),但远高于欧盟1990—1991年农场水平磷素盈余量标准19.5 kg·hm-2[36]。对于动物生产子系统,畜禽规模在1987—2005年保持快速增长,由于2005年9月台风“达维”的影响,省内养殖业受损严重,加上10月我国部分地区相继发生高致病性禽流感疫情,本地控制畜禽养殖规模,从2006年开始,畜牧业规模大为缩减,近年来缓慢上升[37]。从输入项看,动物生产子系统外源饲料依赖比例较大,主要由于本地多发展热带经济作物,粮食作物种植比例较低,致使本地饲料供给始终维持在较低水平。就畜禽粪尿输出而言,海南岛畜禽粪尿磷素损失比例30年间一直在40%以上,这是由于海南岛畜禽养殖规模化程度较低且粪尿处理技术较为落后[31]。2016年海南岛畜禽粪尿磷素的平均单位耕地面积承载量为3.77 kg·hm-2,低于OENEMA等[38]提出的土壤粪肥施磷量的限值35 kg·hm-2,主要因为本地畜禽养殖规模相对较小,粪尿产生总量较低,因此,海南岛粪肥施磷量还具有较大的提升空间,同时意味着化肥磷素施用量具有较大的减量空间。当前,海南岛农牧生产体系分离较严重,主要由于畜禽养殖集约化程度的提高和畜禽粪尿资源化利用效率降低,同时体系间磷素利用较低也是农牧生产体系分离的重要原因。30年来,农牧生产体系磷素循环大致可以分为3个阶段。1998年以前,海南岛种植业、养殖业发展较快,农牧生产体系间磷素循环量稳步上升,1998—2004年间,畜牧业发展缓慢增长,种植业规模略有下降,体系磷素循环量保持稳定。2004年以后,受农牧生产体系集约化程度、畜牧业规模、种植业发展等因素制约,农牧生产体系分离加剧。2016年海南岛农田生产、动物生产和农牧生产体系磷素利用率分别为13.86%、7.62%和13.09%,均低于2010年全国平均水平(分别为37%、17%和30.3%)[11],从农田生产子系统来看,可能与海南岛土壤pH较低导致作物对磷素吸收效率较低和较大的磷肥施用量有关。从动物生产子系统来看,主要限制因素是饲料生产体系磷素投入量高和养殖体系粪尿还田利用率低,海南岛畜禽养殖规模化程度不高也是导致磷素利用率低的重要原因,柏兆海[39]研究表明,专业养殖户和大型规模化养殖体系将表现出更高的养分利用效率。就农牧生产体系而言,受农田和动物生产子系统的规模和磷素利用率的影响,农牧生产体系磷素利用率也保持较低水平。本研究结果显示,与我国其他地区农牧生产体系磷素利用率与农田生产子系统差异较大不同[12-13,15],海南岛两者磷素利用率相近,这是因为农牧生产体系主要输出项目来自农田生产子系统。由此反映出海南岛农牧生产体系各子系统发展不合理现状,2016年作物主产品磷素输出量为11.26 Gg,而动物主产品磷素输出量仅为1.17 Gg。从规模上来看,以北京市为例[15],海南岛耕地面积4 273 km2,约为北京的2倍,但在畜禽养殖上,2016年海南岛畜禽数量约为900万头当量猪,略高于北京市的数量。农牧业的不均衡发展导致诸如土壤粪肥施磷量较低,化肥施用量较高,土壤磷素盈余量过大等问题。因而,促进海南岛农牧生产各个子系统间协调稳定发展对今后海南岛农牧业生产具有重要意义。
3.2 海南岛农牧生产体系磷素流动空间变化特征
海南岛农田生产子系统磷素输入和输出量空间分布特征具体表现为南北高、中部低,这与海南岛区域间地理特征、农业发展水平以及耕地面积等因素的差异有关。海南岛地势四周相对低平,中间高耸,呈穹隆山地形,因而在南北地区农业生产条件较为优越,中部地区多发展槟榔、橡胶等种植业。同时,如海口、文昌、临高、儋州等地农业耕地面积较大,农田生产子系统磷素流动量也较高。而三亚、陵水等地为南繁育种科研基地,农业现代化水平相对较高,在水稻、瓜菜等种苗培育上具有较大优势。本研究发现,三亚耕地面积约为海口的1/3,2016年磷肥输入量为海口的1/2,但作物产品磷素输出量与海口相近,同时,2016年三亚农田生产子系统磷素利用率为23.64%,高于海口的12.31%,可见较高的农业现代化程度有利于提高农牧生产体系磷素流动效率。为优化资源配置,海南岛划分为“琼北、琼南、琼中、琼东和琼西”5个发展区域[31],近年琼北地区主要发展生猪,鸡、鹅等规模化养殖,琼南和琼中地区多发展种植业,琼东地区近年来调减猪牛羊的养殖规模,导致琼海、万宁动物生产子系统磷素流动量降低。琼西地区正加快建设畜禽养殖规模化基地,因而儋州和东方等地动物生产子系统磷素流动量逐步提高。受区域划分影响,海南岛动物生产子系统磷素流动空间分布特征为西部和北部较高,东部和南部较低。
3.3 3种情景下农牧生产体系磷素流动分析
通过减少磷肥的施用量,土壤磷盈余量将得到较大的降低,但在畜牧业快速发展过程中,畜禽粪尿的无序排放也会导致单位耕地面积磷素损失量的较快增加。S1情景下的农牧生产体系磷素利用率最高,2030年较2016年将增长4.59%,其原因是除了控制磷肥施用量外,动植物产品磷素输出量在3个情景中也最多,说明保证农田生产和动物生产子系统协调稳定发展将会给农牧生产体系带来较大收益。由于近年海南岛作物生产增长速度高于CHEN等[28]预测结果,在S2情景下,依照CHEN等预测的作物增长速度,海南农田生产子系统至2030年将表现出缓慢增长。即使期间动物生产子系统得到较快发展,结果农牧生产体系产品输出量和磷素利用率在3种情境下仍为最低,其主要原因是农田生产子系统体系较为庞大,作物产品输出量比重较大,一旦减缓农田生产子系统发展,对农牧生产体系产品总输出量影响较大,同时,较低的主产品输出量水平会导致磷素利用率的降低。在S3情景下,2030年农牧生产体系主要磷素输入量较2016年仅减少8.60 Gg,主要由于《海南省现代农业“十三五”发展规划》对磷肥的输入要求控制在2016年的85%左右,鉴于海南岛施肥过量现状,磷肥输入量仍有下降的潜力。同时,通过提高秸秆和粪尿还田以及作物产品饲用比例,可较好地提高农牧耦合程度。由情景分析看出,S1情景下农牧生产体系管理方式是最优的,由S3可以看出,通过科学的养分管理方式提高资源的循环利用率对促进海南岛农牧业绿色发展意义重大。而在S2情景下,仅仅考虑动物生产子系统单个系统的发展,对农牧生产体系整体养分流动效率的提高是不利的。
3.4 海南岛农牧生产体系磷素流动管理的相关建议
针对海南岛当前农牧生产过程中存在的问题,提出以下优化途径:(1)优化农牧业布局。农牧生产体系由分散式家庭种养模式到可持续集约化管理。在规模化管理过程中,采用合理的种植技术和饲养管理方式[40,41],从优化选种到产品管理,逐步提高作物和动物产品产量。并结合区域发展,建立种养结合生产基地;(2)合理施用肥料。对于农牧业养分管理,首要是减少化肥的施用[42],当前海南岛磷肥施用过量问题突出,为保证磷肥合理施用,应结合海南实际情况,合理划分施肥类型区,推广测土施肥技术,建设测土配方施肥体系[31]。并推广优质商品有机肥料、高效缓释肥料、生物肥料、水溶性肥料等新型肥料;(3)改善畜禽粪尿管理。改善畜禽粪尿管理符合农牧结合的核心要求[43],首先应按照“废弃物+清洁能源+有机肥”三位一体技术路线,改造完善规模畜禽场基础条件。实行畜禽养殖全链条管理,从圈舍饲养到粪尿储存运输建立粪尿收集装置和网管运输装置,同时推广多原料全混式发酵、全自动高温好氧发酵等技术。通过畜禽粪尿的科学管理,以达到减少粪便损失和增加畜禽粪尿还田施用率的目的[44];(4)应加强管理并出台相关政策。管理上需从源头减少磷素的投入,控制化肥和外源饲料的使用量。政策上则要借鉴国内外相关成果,政府对化肥的使用、粪尿的运输管理等应进行具体指导[45]。同时,应加大针对农业面源污染防治的财政投入,以推动相关技术和设施的落实。4 结论
1987—2016年海南岛农牧生产体系取得较快发展,磷素总输入与总输出量不断上升,受区域农业发展水平、地理环境和农业发展规划等因素影响,不同区域间养分流动差异较大。当前农田生产子系统主要依赖化肥磷素输入,随着磷肥输入量的快速增长,土壤磷素盈余量也不断上升。动物生产子系统主要依赖外源饲料磷素输入,30年间外源输入量从10.97 Gg增至14.77 Gg,维持在饲料总投入的95.45%—96.80%。与全国平均水平相比,海南岛农牧生产体系环境损失情况较为严重,磷素利用率较低,农牧生产体系出现了较严重的分离。传统的粗放式农牧业生产方式已经无法满足海南当下发展的需要,在未来应进一步优化农牧业布局,推广种养结合生产模式,加强对畜禽粪尿的管理。通过合理的技术手段和管理方式,在保证农田生产子系统与动物生产子系统协同增长的前提下,实现海南岛农牧生产体系的绿色协调发展。
参考文献 原文顺序
文献年度倒序
文中引用次数倒序
被引期刊影响因子
DOI:10.3321/j.issn:1000-7857.2008.01.013URL [本文引用: 1]

人类食物链养分的流动及其管理决定了资源、环境、社会经济、生产、食物安全等多个可持续发展目标的实现。结合近年研究结果和文献资料,系统地分析了我国未来可持续发展中食物链养分管理的重要性及其难点,提出了相应的优化食物链养分管理建议。分析结果表明,在21世纪,随着中国人口增长、社会经济发展和生活水平的逐步提高,食物链养分流量将进一步加大,更多的资源消耗和环境养分排放也随之而来;未来将面临更为严峻的食物链养分问题;目前的养分管理模式不适应于未来的需求,这些问题将是我国可持续发展面临的重要挑战。为此,提出优化食物营养结构以减少过量养分摄入、加快提高食物链养分利用效率和养分循环率、加强食物链养分管理研究等建议。
DOI:10.3321/j.issn:1000-7857.2008.01.013URL [本文引用: 1]
人类食物链养分的流动及其管理决定了资源、环境、社会经济、生产、食物安全等多个可持续发展目标的实现。结合近年研究结果和文献资料,系统地分析了我国未来可持续发展中食物链养分管理的重要性及其难点,提出了相应的优化食物链养分管理建议。分析结果表明,在21世纪,随着中国人口增长、社会经济发展和生活水平的逐步提高,食物链养分流量将进一步加大,更多的资源消耗和环境养分排放也随之而来;未来将面临更为严峻的食物链养分问题;目前的养分管理模式不适应于未来的需求,这些问题将是我国可持续发展面临的重要挑战。为此,提出优化食物营养结构以减少过量养分摄入、加快提高食物链养分利用效率和养分循环率、加强食物链养分管理研究等建议。
DOI:10.1146/annurev.energy.25.1.53URL [本文引用: 1]
DOI:10.1016/j.fcr.2010.03.001URL [本文引用: 1]
In many low input agricultural systems, phosphorus (P) is one of the most limiting mineral nutrients for plant production. Although applying P fertilizer, if available, is the most performing practice, this should be accompanied by other measures. The use of genetically enhanced plants with improved P acquisition efficiency may represent a sustainable solution to increase crop yields in these systems. This review is intended to provide a summary on adaptation mechanisms of crop plants facing P deficiency as the starting point to develop a research approach for improving P acquisition efficiency. P acquisition efficiency in this review refers to external P efficiency. The suggested research approach includes three strategies: molecular assisted plant breeding, deployment of transgenic plants and the use of agricultural practices. The natural source for improving P nutrition of plants is the existing large genetic variation for plant traits that are associated with P acquisition efficiency and will therefore be emphasized in this review.
DOI:10.1016/j.scitotenv.2008.06.031URLPMID:18649924 [本文引用: 1]
The transfer of nutrients from agricultural land to waters attracts the attention of policy makers as well as scientists as it plays an increasingly significant role in affecting the water environment. It is therefore essential to first understand the nutrient flow in agricultural systems and then correspondingly formulate a series of cost-effective policies and best management practices (BMPs). On the basis of an emission inventory analysis (EIA) and a nutrient full balance (NFB) calculation, this paper presents a partial substance flow analysis (SFA) method, as well as an Agricultural Phosphorus Flow Analysis (AgiPhosFA) model, to describe the phosphorus (P) flow in the agricultural systems in China and assess the impact of human activities on waters driven by agriculture and rural life. It is estimated that average P input and output were 28.902kg ha 61 1 a 61 1 and 14.202kg ha 61 1 a 61 1 respectively in China in 2004, while the total P utilization efficiency (Plant uptake P/P input) in agriculture was 45.7% leading to an average P surplus of 14.702kg ha 61 1 a 61 1. Excessive P application through mineral fertilizer in the arable farming system has led to the accumulation of soil P and constituted a risk to the recipient water quality, whereas the grassland grazing system is confronted with a severe P deficit problem which has resulted in widespread grass degradation. Therefore it may be an efficient way to mitigate the problems simultaneously by regulating and balancing the P flows between the two systems. Uncertainties of the method and model are also discussed in terms of model conceptualization, data and parameters, and spatial and temporal variability.
DOI:10.1126/science.1167755URL [本文引用: 1]
DOI:10.3321/j.issn:1000-6923.2006.05.024URL [本文引用: 2]
通过对畜禽粪便年排放量的估算方法和畜禽粪便排泄参数的确定,估算了我国畜禽养殖业粪便产生量并对由此产生的环境效应进行了评价.结果表明,2003年我国畜禽养殖业共产生31.90亿t粪便,是当年工业产生固体废物的3.2倍;畜禽粪便及其中的氮、磷纯养分平均耕地负荷分别为24t/hm2,N107kg/hm2和P29kg/hm2.部分地区的畜禽养殖业已经对当地环境构成了污染.
DOI:10.3321/j.issn:1000-6923.2006.05.024URL [本文引用: 2]
通过对畜禽粪便年排放量的估算方法和畜禽粪便排泄参数的确定,估算了我国畜禽养殖业粪便产生量并对由此产生的环境效应进行了评价.结果表明,2003年我国畜禽养殖业共产生31.90亿t粪便,是当年工业产生固体废物的3.2倍;畜禽粪便及其中的氮、磷纯养分平均耕地负荷分别为24t/hm2,N107kg/hm2和P29kg/hm2.部分地区的畜禽养殖业已经对当地环境构成了污染.
DOI:10.1007/s10705-011-9478-5URL [本文引用: 1]
Abstract02year which declined over years to 4.402kg P02ha02year in 2006, but huge differences between the 21 regions were observed, confirming the heterogeneity of the regional P flows. Agricultural production systems strongly influenced the P flows through feed, fodder and animal excretion, while P fertiliser consumption was only partially influenced. As a consequence, both the regional soil P budgets and the magnitude of soil P inflows and outflows were strongly dependent on the regional agricultural production systems. A balanced soil P budget could be obtained in crop farming regions, but it strongly relied on P fertiliser use. The animal farming regions continued to accumulate P in the soil, and further use of P fertilisers in these regions is questionable. Finally, there was no simple rule between the mixed farming systems and the soil P budget. This study offers some initial elements for understanding the drivers of mineral P fertiliser use, i.e. the factors governing P fertiliser use by the farmers. It may also contribute to the redesign of regional farming systems oriented towards more effective use of nutrients at the global scale.
DOI:10.1016/j.scitotenv.2015.08.048URLPMID:26421756 [本文引用: 1]
61Phosphorus (P) flows were analysed in detail for EU-27 and its Member States61The food consumption-production-waste chain and non-food flows were considered61The EU-27 is characterized by large P-rock import and long-term P soil accumulation61Large P losses exist, especially emissions to the environment and sequestered waste61The relatively low recycling and efficiency provide opportunities for improvement
DOI:10.1016/S1002-0160(06)60052-0URL [本文引用: 1]
This study of Mikasa City in 2001, which analyzed N flow between N production and N load in seven agricultural and settlement subsystems, i.e., paddy, onion, wheat, vegetable, dairy, chicken, and citizen subsystems, aimed to compare N flow in each subsystem, to determine the main sources of the N load, and to evaluate the influence of agricultural production and food consumption on N cycling in a rural area. The results showed that in Mikasa city, 38.5% of the N load came from point sources and the remainder from non-point sources with intensive vegetable farming imparting a serious N load. Because of the internal N cycling in the dairy subsystem, chemical fertilizer application was reduced by 70.2%, and 23.72 Mg manure N was recycled to the field; therefore, the N utilization efficiency was raised from 18.1% to 35.1%. If all the manure N in the chicken subsystem was recycled, chemical fertilizer application would be reduced by 8.1% from the present level, and the point sources of N pollution would be reduced by 20.8%.
DOI:10.2134/jeq2009.0403URLPMID:20830916 [本文引用: 1]
Increasing nitrogen (N) and phosphorus (P) inputs have greatly contributed to the increasing food production in China during the last decades, but have also increased N and P losses to the environment. The pathways and magnitude of these losses are not well quantified. Here, we report on N and P use efficiencies and losses at a national scale in 2005, using the model NUFER (NUtrient flows in Food chains, Environment and Resources use). Total amount of ew N imported to the food chain was 48.8 Tg in 2005. Only 4.4.Tg reached households as food. Average N use efficiencies in crop production, animal production, and the whole food chain were 26, 11, and 9%, respectively. Most of the imported N was lost to the environment, that is, 23 Tg N to atmosphere, as ammonia (57%), nitrous oxide (2%), dinitrogen (33%), and nitrogen oxides (8%), and 20 Tg to waters. The total P input into the food chain was 7.8 Tg. The average P use efficiencies in crop production, animal production, and the whole food chain were 36, 5, and 7%, respectively. This is the first comprehensive overview of N and P balances, losses, and use efficiencies of the food chain in China. It shows that the N and P costs of food are high (for N 11 kg kg for P 13 kg kg Key measures for lowering the N and P costs of food production are (i) increasing crop and animal production, (ii) balanced fertilization, and (iii) improved manure management.
DOI:10.1007/s10705-015-9737-yURL [本文引用: 2]
China has become the largest mineral phosphorus (P) fertilizer consumer in the world, but current use is not sustainable. Here, we report on a quantitative analysis of the P use and losses in the...
URL [本文引用: 2]
集约化农田和畜牧生产的发展及其结合程度,极大地改变了磷的利用及去向,并由此影响动植物生产性能和环境效应.本文利用物质流分析方法,回顾和总结了1980年以来河北省农牧体系的磷素利用和去向,探讨了磷素的环境效应.结果表明:31年来河北省农田体系磷输入量增加了4倍,其中化肥占80%左右,作物收获磷仅增加了1倍多,农田磷盈余量由10.3万t增加到66.7万t,上升了近6倍;同时,畜牧体系磷输入量也大量增加,且表现为外源饲料依赖率由45.0%提高到81.6%,而本地农田饲料的贡献逐年下降,动物粪尿磷产生量增加了5.6倍,但进入农田的比例由95.0%下降到37.5%;河北省农牧生产体系磷的利用和循环日渐脱节.31年中,河北省整个农牧体系累积输入磷量达到2 060.5万t,而产品累计输出磷量为345.3万t,向环境排放的磷素量高达327.9万t,磷富集和环境排放比较严重.因此,河北省需要提高动物粪尿磷的循环利用率,限制农田化肥磷的投入量,调整农牧业发展模式,努力实现农牧协调发展.
DOI:10.13930/j.cnki.cjea.151278URLMagsci [本文引用: 4]
为揭示山西省农牧生产体系磷流动空间分布特征, 进一步为养分资源综合管理提供科学建议, 本研究使用食物链养分流动模型(NUFER)与ArcGIS相结合, 以2011年山西省11个地市农牧生产体系为研究对象, 计算了农牧生产体系中的磷流动、损失及账户平衡, 并对各个生产体系的磷利用效率(PUE)、有机废弃物中磷的循环利用效率、磷的损失途径等重要指标进行了综合评价, 描述了2011年山西省各地市农牧生产体系与区域尺度的磷流动变化特征。研究结果表明, 山西省各地市农牧体系磷的投入和损失差异较大, 农田生产体系投入范围在22.5~83.0 kg.hm<sup>-2</sup>, 而整个农牧生产体系损失区间在2.7~8.8 kg.hm<sup>-2</sup>; 磷的投入和损失均总体呈现东南部高、西北部低的空间分布格局; 各地市农田磷素均有盈余但程度不均, 为9.4~48.4kg.hm<sup>-2</sup>。农田生产系统的磷素利用效率(PUEc)高于全国平均水平; 农牧生产体系的磷利用效率(PUEc+a)较低, 全省平均水平仅为30.3%, 主要是由于农牧分离较为严重; 有机废弃物的循环利用效率较低(60%)。省域东南部存在潜在环境风险, 晋城、晋中等地市有大量的粪尿磷未得到回收利用, 可作为周边农业主产区的农田养分资源。因此通过提高农牧生产体系的养分管理水平和区域间养分资源协同管理, 能够大幅提高磷的利用效率, 同时有效降低环境风险, 实现山西农业可持续发展。
[本文引用: 2]
[本文引用: 2]
DOI:10.13930/j.cnki.cjea.160970URL [本文引用: 4]
分析大城市郊区"土壤-饲料-奶牛"养殖体系养分流动和环境排放特征是合理控制养殖规模、促进农牧结合、保护生态环境和保障畜禽产品供应等政策制定的基础.本研究选取北京市郊区28个规模化奶牛农场,调研包括饲料来源和投入、奶牛生产和粪尿管理以及产品输出情况.结合公开发表的文献数据和北京市统计数据,利用NUFER-animal模型对1980—2013年北京市规模化奶牛农场"土壤-饲料-奶牛"生产系统养分流动特征、利用效率和环境损失的时空变化进行了定量化分析.结果表明,1980—2013年,奶牛个体尺度(仅包括泌乳牛)氮利用效率从14.9%增加到21.2%,磷利用效率从13.8%增加到27.3%;群体尺度(包括犊牛、育成牛、青年牛、泌乳牛和干乳牛)氮利用效率从14.5%增加到18.2%,磷利用效率从15.8%增加到24.9%;系统尺度(土壤-饲料-奶牛)氮利用效率从11.3%增加到15.8%,磷利用效率从13.3%增加到22.3%.北京市奶牛养殖个体尺度、群体尺度和系统尺度氮利用效率在1985年前减少;而1985年后逐渐增加.个体尺度、群体尺度和系统尺度磷利用效率均不断增加.系统尺度氮总损失从1980年的1516 t增加到2013年的16973 t;磷总损失从114 t增加到1763 t.生产1 kg氮磷产品造成的氮和磷损失均表现出不断减少的趋势.北京市"土壤-饲料-奶牛"生产系统氮磷流动特征发生了很大变化,养分利用效率和总环境损失不断增加.产生这一变化的原因是养殖数量的增加、养殖模式从传统向集约化转变和环保管理措施的完善.因此,调整奶牛养殖从数量型向质量型转变以及提高喂养技术和粪尿管理水平等是提高都市奶牛养殖可持续发展的必要措施.
[本文引用: 1]
[本文引用: 1]
DOI:10.2134/jeq2008.0108URLPMID:19202011 [本文引用: 1]
Received for publication February 29, 2008. The high N inputs to agricultural systems in many regions in 27 member states of the European Union (EU-27) result in N leaching to groundwater and surface water and emissions of ammonia (NH3), nitrous oxide (N2O), nitric oxide (NO), and dinitrogen (N2) to the atmosphere. Measures taken to decreasing these emissions often focus at one specific pollutant, but may have both antagonistic and synergistic effects on other N emissions. The model MITERRA-EUROPE was developed to assess the effects and interactions of policies and measures in agriculture on N losses and P balances at a regional level in EU-27. MITERRA-EUROPE is partly based on the existing models CAPRI and GAINS, supplemented with a N leaching module and a module with sets of measures. Calculations for the year 2000 show that denitrification is the largest N loss pathway in European agriculture (on average 44 kg N ha–1 agricultural land), followed by NH3 volatilization (17 kg N ha–1), N leaching (16 kg N ha–1) and emissions of N2O (2 kg N ha–1) and NOX (2 kg N ha–1). However, losses between regions in the EU-27 vary strongly. Some of the measures implemented to abate NH3 emission may increase N2O emissions and N leaching. Balanced N fertilization has the potential of creating synergistic effects by simultaneously decreasing N leaching and NH3 and N2O emissions. MITERRA-EUROPE is the first model that quantitatively assesses the possible synergistic and antagonistic effects of N emission abatement measures in a uniform way in EU-27
[本文引用: 1]
[本文引用: 1]
URL [本文引用: 1]
根据我国有关专家30年的研究成果,着重论述了橡胶、剑麻、胡椒等热带作物营养诊断的方法及其在指导施肥中的应用.同时对热带作物营养诊断指导施肥作出评价.从而探讨了今后热带作物营养诊断的研究方向,并指出了应用营养诊断指导施肥需要注意的技术问题。
.
URL [本文引用: 1]
根据我国有关专家30年的研究成果,着重论述了橡胶、剑麻、胡椒等热带作物营养诊断的方法及其在指导施肥中的应用.同时对热带作物营养诊断指导施肥作出评价.从而探讨了今后热带作物营养诊断的研究方向,并指出了应用营养诊断指导施肥需要注意的技术问题。
URL [本文引用: 1]
.
URL [本文引用: 1]
DOI:10.16178/j.issn.0528-9017.20170423URL [本文引用: 1]
对草莓、茶叶、蓝莓、杨梅、西红花、火龙果等6种经济作物果实和营养器官中的氮、磷、钾、钙、镁等养分含量进行检测分析.结果表明,6种经济作物生产100kg果实(鲜叶、球茎)氮磷钾总量分别为0.962、1.792、0.165、0.260、0.876、0.889kg,茶叶>草莓>火龙果>西红花>杨梅>蓝莓;草莓、茶叶、西红花、火龙果等4种作物养分需求前3位均为氮、钾和钙,杨梅和蓝莓养分需求前3位为氮、钾和镁;6种经济作物氮磷钾比例为5.2~47.8∶1∶5.5~64.3,差异显著.
DOI:10.16178/j.issn.0528-9017.20170423URL [本文引用: 1]
对草莓、茶叶、蓝莓、杨梅、西红花、火龙果等6种经济作物果实和营养器官中的氮、磷、钾、钙、镁等养分含量进行检测分析.结果表明,6种经济作物生产100kg果实(鲜叶、球茎)氮磷钾总量分别为0.962、1.792、0.165、0.260、0.876、0.889kg,茶叶>草莓>火龙果>西红花>杨梅>蓝莓;草莓、茶叶、西红花、火龙果等4种作物养分需求前3位均为氮、钾和钙,杨梅和蓝莓养分需求前3位为氮、钾和镁;6种经济作物氮磷钾比例为5.2~47.8∶1∶5.5~64.3,差异显著.
[本文引用: 1]
[本文引用: 1]
DOI:10.3864/j.issn.0578-1752.2011.20.009URLMagsci [本文引用: 1]
弄清中国不同区域农田养分投入、产出和平衡状况,对养分资源管理和肥料的科学分配与施用,提高肥料利用效率等具有重要意义。在参考现有资料的基础上,系统分析和论述了中国的养分资源及其利用现状,估算了各种有机肥资源及其可提供的氮磷钾养分数量,分析和评价了中国不同区域养分输入、输出特点及平衡状况。针对目前养分输入、输出存在的一系列问题,提出了养分资源管理的对策和建议。
DOI:10.3864/j.issn.0578-1752.2011.20.009URLMagsci [本文引用: 1]
弄清中国不同区域农田养分投入、产出和平衡状况,对养分资源管理和肥料的科学分配与施用,提高肥料利用效率等具有重要意义。在参考现有资料的基础上,系统分析和论述了中国的养分资源及其利用现状,估算了各种有机肥资源及其可提供的氮磷钾养分数量,分析和评价了中国不同区域养分输入、输出特点及平衡状况。针对目前养分输入、输出存在的一系列问题,提出了养分资源管理的对策和建议。
URL [本文引用: 1]
本文研究了五个生态站地区农田养分循环的养分收入参数,包括有机肥养分含量,降雨带入的养分量,灌溉水带入的养分量,豆科作物共生固N量等。
URL [本文引用: 1]
本文研究了五个生态站地区农田养分循环的养分收入参数,包括有机肥养分含量,降雨带入的养分量,灌溉水带入的养分量,豆科作物共生固N量等。
[本文引用: 1]
[本文引用: 1]
[本文引用: 1]
[本文引用: 1]
DOI:10.1016/j.scitotenv.2012.03.028URLPMID:22542299 [本文引用: 1]
78 The 1st integrated assessment of N and P use efficiencies in the food chain in China. 78 The mean cost of 1kg N and 1kg P in Chinese food is 11kg N and 13kg P. 78 N and P use efficiencies decreased in crop production and food processing. 78 N and P use efficiencies increased in animal production. 78 Total N and P losses from agriculture strongly increased between 1980 and 2005.
DOI:10.1038/nature13609URLPMID:25186728 [本文引用: 3]
Agriculture faces great challenges to ensure global food security by increasing yields while reducing environmental costs. Here we address this challenge by conducting a total of 153 site-year field experiments covering the main agro-ecological areas for rice, wheat and maize production in China. A set of integrated soil-crop system management practices based on a modern understanding of crop ecophysiology and soil biogeochemistry increases average yields for rice, wheat and maize from 7.2 million grams per hectare (Mg ha(-1)), 7.2 Mg ha(-1) and 10.5 Mg ha(-1) to 8.5 Mg ha(-1), 8.9 Mg ha(-1) and 14.2 Mg ha(-1), respectively, without any increase in nitrogen fertilizer. Model simulation and life-cycle assessment show that reactive nitrogen losses and greenhouse gas emissions are reduced substantially by integrated soil-crop system management. If farmers in China could achieve average grain yields equivalent to 80% of this treatment by 2030, over the same planting area as in 2012, total production of rice, wheat and maize in China would be more than enough to meet the demand for direct human consumption and a substantially increased demand for animal feed, while decreasing the environmental costs of intensive agriculture.
DOI:10.1021/es400456uURLPMID:23656482 [本文引用: 1]
The nitrogen (N) and phosphorus (P) costs of food production have increased greatly in China during the last 30 years, leading to eutrophication of surface waters, nitrate leaching to groundwater, and greenhouse gas emissions. Here, we present the results of scenario analyses in which possible changes in food production-consumption in China for the year 2030 were explored. Changes in food chain structure, improvements in technology and management, and combinations of these on food supply and environmental quality were analyzed with the NUFER model. In the business as usual scenario, N and P fertilizer consumption in 2030 will be driven by population growth and diet changes and will both increase by 25%. N and P losses will increase by 44 and 73%, respectively, relative to the reference year 2005. Scenarios with increased imports of animal products and feed instead of domestic production, and with changes in the human diet, indicate reductions in fertilizer consumption and N and P losses relative to the business as usual scenario. Implementation of a package of integrated nutrient management measures may roughly nullify the increases in losses in the business as usual scenario and may greatly increase the efficiency of N and P throughout the whole food chain.
URL [本文引用: 1]
农业关乎国家食物安全、资源安全和生态安全。大力推动农业可持续发展,是实现"五位一体"战略布局、建设美丽中国的必然选择,是中国特色新型农业现代化道路的内在要求。为指导全国农业可持续发展,编制本规划。
URL [本文引用: 1]
农业关乎国家食物安全、资源安全和生态安全。大力推动农业可持续发展,是实现"五位一体"战略布局、建设美丽中国的必然选择,是中国特色新型农业现代化道路的内在要求。为指导全国农业可持续发展,编制本规划。
[本文引用: 4]
[本文引用: 4]
DOI:10.3969/j.issn.1672-6510.2010.03.009URL [本文引用: 1]
以土壤作为吸磷剂,研究了其对磷的吸附特性,并探讨了土壤对磷的吸附机制实验结果表明,供试 土壤的磷吸附状况能很好地吻合Langmuir模型,运用该模型可推算出供试土壤的最大磷吸附量,其值介于312.50-1000.00μg/g之间,大 小顺序为:湖南郴州土壤〉广东新会土壤〉江苏靖江土壤〉江苏南京土壤〉湖北石首土壤.磷的最大吸附量与土壤本身的理化特性相关,黏粒、铁元素、铝元素含量 越高的土壤,其对磷的吸附效果越好.
DOI:10.3969/j.issn.1672-6510.2010.03.009URL [本文引用: 1]
以土壤作为吸磷剂,研究了其对磷的吸附特性,并探讨了土壤对磷的吸附机制实验结果表明,供试 土壤的磷吸附状况能很好地吻合Langmuir模型,运用该模型可推算出供试土壤的最大磷吸附量,其值介于312.50-1000.00μg/g之间,大 小顺序为:湖南郴州土壤〉广东新会土壤〉江苏靖江土壤〉江苏南京土壤〉湖北石首土壤.磷的最大吸附量与土壤本身的理化特性相关,黏粒、铁元素、铝元素含量 越高的土壤,其对磷的吸附效果越好.
URL [本文引用: 1]
利用海南省2008-2014年的土壤长期定位监测数据,对海南省近年来的耕地有机质和pH值现状和变化行了分析。结果表明,2014年我省土壤有机质含量和pH值平均分别为23.79 g/kg和5.63;其中有机质大部分处于'缺'等级(小于20 g/kg)和'中'等级(大于20 g/kg,小于30 g/kg),从区域来看,有机质呈东部高西部低,pH值则呈中部高、东西部低。2008-2014年全省土壤有机质含量整体呈上升趋势,土壤pH变化呈稳中有升趋势。分析认为,这与近年来海南省大力推广有机质提升行动密切相关。
.
URL [本文引用: 1]
利用海南省2008-2014年的土壤长期定位监测数据,对海南省近年来的耕地有机质和pH值现状和变化行了分析。结果表明,2014年我省土壤有机质含量和pH值平均分别为23.79 g/kg和5.63;其中有机质大部分处于'缺'等级(小于20 g/kg)和'中'等级(大于20 g/kg,小于30 g/kg),从区域来看,有机质呈东部高西部低,pH值则呈中部高、东西部低。2008-2014年全省土壤有机质含量整体呈上升趋势,土壤pH变化呈稳中有升趋势。分析认为,这与近年来海南省大力推广有机质提升行动密切相关。
DOI:10.1023/A:1013351617532URL [本文引用: 1]
In most soils, inorganic phosphorus occurs at fairly low concentrations in the soil solution whilst a large proportion of it is more or less strongly held by diverse soil minerals. Phosphate ions can indeed be adsorbed onto positively charged minerals such as Fe and Al oxides. Phosphate (P) ions can also form a range of minerals in combination with metals such as Ca, Fe and Al. These adsorption/desorption and precipitation/dissolution equilibria control the concentration of P in the soil solution and, thereby, both its chemical mobility and bioavailability. Apart from the concentration of P ions, the major factors that determine those equilibria as well as the speciation of soil P are (i) the pH, (ii) the concentrations of anions that compete with P ions for ligand exchange reactions and (iii) the concentrations of metals (Ca, Fe and Al) that can coprecipitate with P ions. The chemical conditions of the rhizosphere are known to considerably differ from those of the bulk soil, as a consequence of a range of processes that are induced either directly by the activity of plant roots or by the activity of rhizosphere microflora. The aim of this paper is to give an overview of those chemical processes that are directly induced by plant roots and which can affect the concentration of P in the soil solution and, ultimately, the bioavailability of soil inorganic P to plants. Amongst these, the uptake activity of plant roots should be taken into account in the first place. A second group of activities which is of major concern with respect to P bioavailability are those processes that can affect soil pH, such as proton/bicarbonate release (anion/cation balance) and gaseous (O /CO ) exchanges. Thirdly, the release of root exudates such as organic ligands is another activity of the root that can alter the concentration of P in the soil solution. These various processes and their relative contributions to the changes in the bioavailability of soil inorganic P that can occur in the rhizosphere can considerably vary with (i) plant species, (ii) plant nutritional status and (iii) ambient soil conditions, as will be stressed in this paper. Their possible implications for the understanding and management of P nutrition of plants will be briefly addressed and discussed.
DOI:10.3321/j.issn:0250-3301.2007.06.025URL [本文引用: 1]
利用OECD表观氮平衡模型框架,建立了中国表观氮磷平衡核算的框架、方法和数据库.模型结果表明,2003年中国土壤表观氮磷盈余总量分别为640×104 t和98×104 t,氮磷盈余强度分别为16.56 kg/hm2 2.53 kg/hm2.由于中国氮磷平衡区域分布严重不平衡,面临着氮磷盈余管理和氮磷缺损管理的双重压力.化肥和畜禽粪便是中国土壤氮磷投入最主要的来源,因此是中国氮磷盈余管理最佳切入点.由于各地氮磷投入结构各异,在氮磷盈余严重的中东部地区,不宜采用"一刀切"的政策,而应针对不同地区氮磷输入的特点进行氮磷盈余管理.
DOI:10.1590/S0101-98802010000200004URL [本文引用: 1]
To address the growing problem of environmental degradation from livestock operations, the U.S. Environmental Protection Agency has sponsored a multidisciplinary project called Livestock and the Environment: A National Pilot Project (NPP). This report details the linkages among the policy space, the dairy farm economic model, and the environmental fate and transport simulation models. A summary of the NPP's conceptual framework illustrates the overall model organization and linkages within the NPP.
[本文引用: 1]
[本文引用: 1]
DOI:10.1016/j.watres.2003.10.005URLPMID:15053104 [本文引用: 1]
Abstract This study explores the effects of manure policy options for agricultural land in The Netherlands on nitrate leaching to groundwater, ammonia and nitrous oxide emissions to the atmosphere and on eutrophication of surface waters. The implementation of the farm gate balance MINAS at farm level, with levy-free N surpluses in the range of 300 to 40 kg per ha per year, and levy-free P surpluses in the range of 17.5 to 0.4 kg of P per ha per year, have been examined. Results indicate that nitrate concentrations in the upper groundwater are related to N surplus, land use, soil type and groundwater level. On dry sandy soils, the N surplus has to be below 60 to 140 kg of N per ha per year, depending on land use, to decrease the nitrate concentrations in the upper groundwater to below 50 mg nitrate per litre. Decreases of N and P concentrations in surface waters, upon lowering levy-free surpluses appear relatively small. For improving the ecological state of surface waters, we recommend a combination of low levy-free N and P surpluses with dredging P rich sediments, flushing of ditches, and decreasing discharges from other sources.
[本文引用: 1]
[本文引用: 1]
DOI:10.5713/ajas.1999.305URL [本文引用: 1]
In the paper insight is given in the legislation policy to restrain environmental pollution by pig husbandry, focused on The Netherlands (Mineral Accounting System). Besides, nutritional measures are presented to reduce environmental pollution by lowering excretion of N and P, emphasizing (multi) phase feeding, the use of low protein, synthetic amino acids supplemented diets, phytase and its effect on phosphorus and calcium digestibility, its interaction with phytic acid and proteins, and the environmental impact of the use of phytase in pig diets. Also, nutritional means are indicated to reduce ammonia volatilization from pig operations. It is concluded that nutrition management can substantially contribute to reduction of N and P excretion by pigs, mainly by lowering dietary protein levels, (multi) phase feeding and the use of microbial phytase, and that the use of phytase on a large scale in The Netherlands has a tremendous environmental impact. In 20 years the excretion of P in growing-finishing pigs has more than halved. Ammonia emission from manure of pigs can be reduced substantially by lowering dietary protein content, but also by including additional non-starch polysaccharides in the diet. A very promising method to reduce ammonia emission is to manipulate dietary cation-anion difference, e.g. by adding acidifying salts to the diet, which will lower pH of urine substantially. Further research is desirable. This also applies to determining dietary factors influencing the odour release from manure. Finally, some speculation on the future of pig farming from an environmental viewpoint is presented.
[本文引用: 1]
[本文引用: 1]
DOI:10.1023/A:1021107026067URL [本文引用: 1]
China is a big country with a huge population and limited farmland area per capita. To produce enough food for feeding the population is of vital importance for the county. A huge achievement in food...
[本文引用: 1]
正中国农田养分资源管理和高产高效理论与技术取得了重要突破。在玉米-小麦轮作体系,产量和养分利用率可同步提高15%—30%~([1]),显示育种、栽培、养分管理等综合集成技术增产增效潜力巨大。但该体系着重考虑了化肥养分的高效利用,对粮田有机肥的施用考虑较少,更是忽略了牧草养分管理研究。与此同时,种植业生产与畜牧业生产如何匹配、如何提高农
[本文引用: 1]
正中国农田养分资源管理和高产高效理论与技术取得了重要突破。在玉米-小麦轮作体系,产量和养分利用率可同步提高15%—30%~([1]),显示育种、栽培、养分管理等综合集成技术增产增效潜力巨大。但该体系着重考虑了化肥养分的高效利用,对粮田有机肥的施用考虑较少,更是忽略了牧草养分管理研究。与此同时,种植业生产与畜牧业生产如何匹配、如何提高农
DOI:10.1016/j.livsci.2007.09.007URL [本文引用: 1]
Manure management systems are conducive to nutrient and carbon losses, but the magnitude of the loss highly depends on the nutrient element, the manure management system and the environmental conditions. This paper discusses manure management systems in the 27 Member States of the European Union (EU-27) and nutrient losses from these systems, with emphasis on nitrogen (N). In general, losses decrease in the order: C, N >> S > K, Na, Cl, B > P, Ca, Mg, metals. Assessments made with the integrated modeling tool MITERRA-EUROPE indicate that the total N excretion in 2000 by livestock in EU-27 was 65 10,40002kton. About 65% of the total N excretion was collected in barns and stored for some time prior to application to agricultural land. Almost 30% of the N excreted in barns was lost during storage; approximately 19% via NH 3 emissions, 7% via emissions of NO, N 2O and N 2, and 4% via leaching and run-off. Differences between Member States in mean N losses from manure storages were large (range 19.5–35%). Another 19% of the N excreted in animal housing systems was lost via NH 3 emissions following the application of the manure to land. The results indicate that maximally 52% of the N excreted in barns was effectively recycled as plant nutrient. Various emission abatement measures can be implemented and have been implemented already in some Member States to reduce the emissions of NH 3 and N 2O, and the leaching of N and P. There is scope to reduce NH 3 emissions by 65 30% relative to the reference year 2000, although the uncertainty in estimated emissions and in the estimated effects of emission abatement measures is relatively large.
DOI:10.2527/2004.8213_supplE196xURLPMID:15471798 [本文引用: 1]
This paper discusses governmental policies and measures that regulate the use of animal manure in the European Union (EU-15). Systematic intervention by governments with European agriculture in general started at the end of the 19th century. Major changes in governmental policies on agriculture followed after the establishment of the EU and its Common Agricultural Policy (CAP) in 1957. Environmental side effects of the large-scale intensification of agricultural production were addressed following the reform of the CAP and the implementation of various environmental regulations and directives from the beginning of the 1990s. The Nitrate Directive approved in 1991 has exerted, as yet, the strongest influence on intensive livestock production systems. This directive regulates the use of N in agriculture, especially through its mandatory measures to designate areas vulnerable to nitrate leaching and to establish action programs and codes of good agricultural practice for these areas. These measures have to ensure that for each farm the amount of N applied via livestock manure shall not exceed 170 kg x ha(-1) x yr(-1). These measures have large consequences, especially for countries with intensive animal agriculture, including The Netherlands, Belgium, Denmark, and Ireland. The mean livestock density in these countries is between 1.5 and 4 livestock units/ha, and the average amounts of N in animal manure range from 100 to 300 kg/ha of agricultural land. More than 10 yr after approval of the Nitrate Directive, there appears to be a delay in the implementation and enforcement in many member states, which reflects in part the major complications that arise from this directive for intensive livestock farming. It also reflects the fact that environmental policies in agriculture have economic consequences. The slow progress in the enforcement of environmental legislations in agriculture combined with the increasing public awareness of food safety, animal welfare, and landscape maintenance call for a more fundamental change in EU agriculture.
