 ,1, 程志强1
Spatio-Temporal Variability of Soil Available Nutrients Based on Remote Sensing and Crop Model
FANG HuiTing1,2, MENG JiHua,1, CHENG ZhiQiang1通讯作者:
收稿日期:2018-06-6接受日期:2018-09-28网络出版日期:2019-02-13
| 基金资助: |
Received:2018-06-6Accepted:2018-09-28Online:2019-02-13
作者简介 About authors
方慧婷,E-mail:

摘要
关键词:
Abstract
Keywords:
PDF (4313KB)元数据多维度评价相关文章导出EndNote|Ris|Bibtex收藏本文
本文引用格式
方慧婷, 蒙继华, 程志强. 基于遥感与作物模型的土壤速效养分时空变异分析[J]. 中国农业科学, 2019, 52(3): 478-490 doi:10.3864/j.issn.0578-1752.2019.03.008
FANG HuiTing, MENG JiHua, CHENG ZhiQiang.
0 引言
【研究意义】土壤速效氮(available nitrogen,AN)、速效磷(available phosphorus,AP)、速效钾(available potassium,AK)是决定作物生长,农田稳定输出和生态平衡的关键因素。土壤是包含作物生长所需养分的载体,是在时间和空间上均连续的变异体。土壤属性因土质、地貌、降水以及人为的施肥灌溉等原因,而表现出高度的时空变异的特性[1,2,3,4,5]。该特性表现为,即使在土质相同的同一片区域内,同一时刻的不同空间位置,土壤属性也存在明显的差异[6]。传统的农业生产通常不考虑这种差异性,对农作物地块采取均一化施肥管理。这种盲目的施肥方式,不仅降低了资源的利用率,还会造成区域水体的污染。因此,研究土壤速效养分的时空变化规律对保护区域土壤环境、保障粮食产量和促进农业的可持续发展有着重要的指导意义。【前人研究进展】目前对土壤养分变异分析的研究,主要是基于地面调查法、土壤光谱法以及利用植被指数反演法获取的土壤养分数据。对于地面调查数据,利用地统计方法进行土壤养分时空变异分析的研究已有不少[7,8,9],该方法在单点上可以保持较高精度,但是存在代表性差、成本高、时效性差等缺点[10],影响养分变异的分析精度。土壤的反射光谱可以有效表征土壤中的养分信息[11]。目前基于地面光谱数据的土壤养分分析的研究已有不少[12,13]。遥感技术的发展使得快速大面积获取土壤信息成为可能[14]。其中基于高光谱遥感数据来反演土壤养分信息得到广泛应用[15,16],在此基础上进行养分时空变异分析,可以有效减少单点面尺度外推所带来的不确定性。但该方法模型建立需要裸土期的高光谱数据,对遥感数据的获取时间和质量要求较高,且主要获取的是土壤表层的养分,使其应用受到限制。植被指数法则通过建立土壤养分和作物长势参数的联系,利用遥感数据反演作物长势参数来获得土壤养分含量[17],可以实现土壤养分变化的动态监测[18],但是目前采用的多为经验统计模型,其准确性和稳定性往往无法保证。【本研究切入点】作物模型能够很好地模拟作物的生理生化特征以及土壤养分的变化情况[19],遥感数据弥补了作物模型基于单点外推导致的参数标定问题,可以实现土壤养分的实时有效监测,该方法可弥补经验统计模型的不足,提高反演的准确性和稳定度[20,21,22],从而提高土壤养分变化分析结果的准确性。但是目前基于作物模型反演的土壤养分进行变异性分析的研究较少。现阶段有关土壤养分变化的研究多以一年或者10年作为单一时间尺度[23,24,25,26],虽然可以在较大时间尺度上掌握土壤养分的动态变化,但是从精准农业的角度考虑,在作物生长季内的较小时间尺度上进行土壤养分分析更利于变量施肥,提高资源利用率和作物产量。有关土壤养分分析的空间尺度选择,有从大空间尺度上考虑土壤类型和土质变化等对养分变化的影响[27,28,29];对于中小尺度上的土壤养分分析,有针对单一农作物展开的[30],也有基于农田尺度上单一的轮作模式进行的[31]。但是基于田块尺度上多种作物轮作农田的土壤养分时空变异鲜有研究。【拟解决的关键问题】本文以位于黑龙江省讷河市的双山基地农场为研究区,以HJ-1 CCD数据和WOFOST作物模型反演得到的AN、AP和AK为研究对象,依据统计学、相关性分析等理论,分别在年际间和生长季内,基于农田和田块尺度对各速效养分的变化特征进行分析,并从轮作模式、地形要素、气象条件等方面来分析速效养分变化的主要影响因素,以期为农田的生态平衡保护和变量施肥提供理论依据。1 研究区与方法
1.1 研究区概况
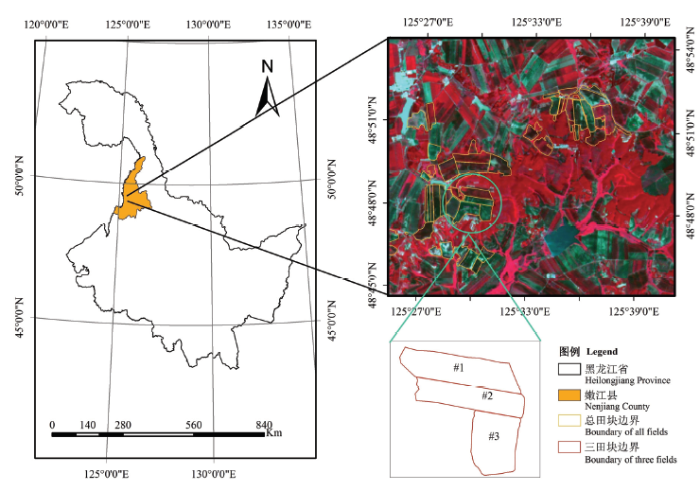
研究区位于黑龙江省嫩江县双山基地农场48°45′35″—48°52′36″N,125°24′22″—125°38′26″E。总面积39 km2,农场的地块平均面积较大,为56.7 hm2。海拔高度为255—389 m,农场整体的坡度较缓,多为缓坡(2—6°,占58%)和较陡坡(6—15°,占24%)。农场主要种植的作物是春玉米、大豆和小麦,种植面积约占90%,其中春玉米的种植面积超过50%。农作物为一年一熟制,一般在5月中下旬播种,在9月底至10月初成熟。农场的土壤类型固定,上层为黑土土壤,厚度约为1.2 m,腐殖质及养分含量高。下层为黄土,厚度超过10 m,肥力低,本文基于黑土层进行分析研究。本研究在实验农场进行2012—2016年的连续观测期间,农场作物均采取均衡施肥管理,即种植同种作物的田块采取相同的施肥模式。图1显示了农场的具体位置及用于分析的#1、#2和#3田块的分布情况。图1
 新窗口打开|下载原图ZIP|生成PPT
图1双山农场位置及田块分布
Fig. 1Location and distribution of study area
1.2 数据来源
本文使用的基础数据主要包括气象数据、地形数据和作物分布图。气象数据来自当地的历史气象资料;30 m分辨率的数字高程数据来源于中国科学院计算机网络信息中心;作物分布图是基于农场的耕作计划和遥感影像分类结果得到,获取的从2012—2016年间主要作物玉米、大豆和小麦3种作物的空间分布。本研究所使用的遥感数据是时间序列HJ-1CCD数据,该数据采集自灾害监测预报小卫星星座A、B 星(HJ-1A /1B星)。一共采集2012—2016年间的55景影像,其中2014年使用的时间序列HJ-1CCD数据如表1所示。完成辐射定标、大气校正、几何精校正等一系列预处理。速效养分数据来源于WOFOST作物模型和遥感数据同化的速效养分反演结果[21],得到研究区在2012—2016年间,AN、AP和AK年平均速效养分含量分布,以及以5 d为步长的生长季内速效养分的分布。Table 1
表1
表1双山基地农场时间序列HJ-1 CCD数据
Table 1
| 传感器 Sensor | 采集时间 Time | 轨道号 Orbit number |
|---|---|---|
| HJ-1A CCD1 | 2014-5-03 | 451-52 |
| HJ-1A CCD2 | 2014-6-06 | 448-56 |
| HJ-1A CCD1 | 2014-6-23 | 453-53 |
| HJ-1A CCD1 | 2014-8-06 | 451-56 |
| HJ-1B CCD2 | 2014-9-06 | 448-56 |
| HJ-1A CCD1 | 2014-9-18 | 454-53 |
| HJ-1A CCD2 | 2014-9-24 | 452-56 |
| HJ-1B CCD2 | 2014-10-04 | 452-56 |
新窗口打开|下载CSV
1.3 研究方法
1.3.1 速效养分反演方法 本文利用作物模型和遥感数据同化来实现土壤速效养分的稳定准确反演。首先使用地面土壤采样数据来完成WOFOST模型参数的标定,生成参数标定数据集和精度评价数据集;利用遥感数据反演叶面积指数(LAI),生成数据同化数据集;接着采用集合卡尔曼滤波(EnKF)数据同化算法使时间序列遥感数据参与到模型模拟中,将模拟由点外推至区域。WOFOST作物模型可以模拟最佳养分含量(作物能够吸收的最高的养分,认为没有养分胁迫)下的作物生理参数(生物量、LAI),遥感可以获取实际的生理参数(实际作物生长认为是受到养分胁迫的),两者对比的差异可以认为是由于养分胁迫引起的,利用养分胁迫引起的参数的变化可以反推实际的土壤速效养分含量。本文中采用的土壤速效养分反演算法将作物的生长分成了三个阶段:①起始生长阶段;②水分限制条件下的生长模拟及速效养分反演阶段;③养分限制条件下的生长模拟阶段。①②和②③阶段的临界点分别为A和B。第一阶段模拟作物播种到出苗的过程,认为该阶段的水分胁迫生长可以代表实际生长,A点处得到相应的LAI等长势参数;第二阶段是养分反演算法实现阶段,模型在A点开始模拟作物的生长,主要考虑水分限制长势, 模拟到B点时,通过比对水分限制条件下B点的LAI和LAI遥感反演模型计算的LAI值(遥感反演得到的LAI是同时包含水分限制和养分限制的),利用查找表法寻找两者差值的最小值所对应的养分含量组合,就是所要反演的养分结果;第三阶段主要是用于估算作物生物量和产量等参数(利用阶段②得到的养分重新带入A点,模型在养分模块的参与下模拟作物实际的水分-养分限制下的长势直到生长季结束)。具体WOFOST作物模型的参数标定,遥感数据同化以及反演精度的验证已有相应研究成果[20,21]。
1.3.2 时空变化分析方法 基于以上土壤速效养分的反演结果,使用ArcGIS(10.2)的ArcMap / Spatial Analyst模块,对土壤速效养分进行分级制图,定性分析土壤速效养分在不同年份间的空间变异。
选取平均值,标准偏差(Standard Deviation,SD),变异系数(Coefficient of Variation,CV),最大值和最小值作为分析指标,实现土壤速效养分的定量统计描述。关于变异系数,通常认为CV大于100%为强变异;CV大于10%且小于100%时为中等变异;当CV小于10%时为弱变异。
1.3.3 养分变化原因分析 采用线性回归方法分析土壤速效养分变化量与初始值之间的关系。并进行回归方程的显著性检验,如果满足线性关系,则有式(1)成立,其中S回与S残 如式(2)和(3)所示。然后通过确定显著性水平α,并根据F表查找临界值Fα,如果F<F0.05(1,n-2),则没有显著的线性关系;如果F0.05(1,n-2)<F<F0.01(1,n-2),则称自变量和因变量间有显著的线性关系;若F>F0.01(1,n-2),则称两者间有十分显著的线性关系。
$F=\frac{{{S}_{}}/1}{{{S}_{}}/(n-2)}\sim F(1,n-2) \ (1)$
${{S}_{}}=\sum\nolimits_{i=1}^{n}{\left( {{{\hat{Y}}}_{i}}-\bar{Y} \right){{~}^{2}}}~~~~~~~ (2)$
${{S}_{}}=\sum\nolimits_{i=1}^{n}{\left( {{Y}_{i}}-{{{\hat{Y}}}_{i}} \right){{~}^{2}}}~~~~~~~ (3)$
2 结果
2.1 农场尺度上土壤速效养分时空变异分析
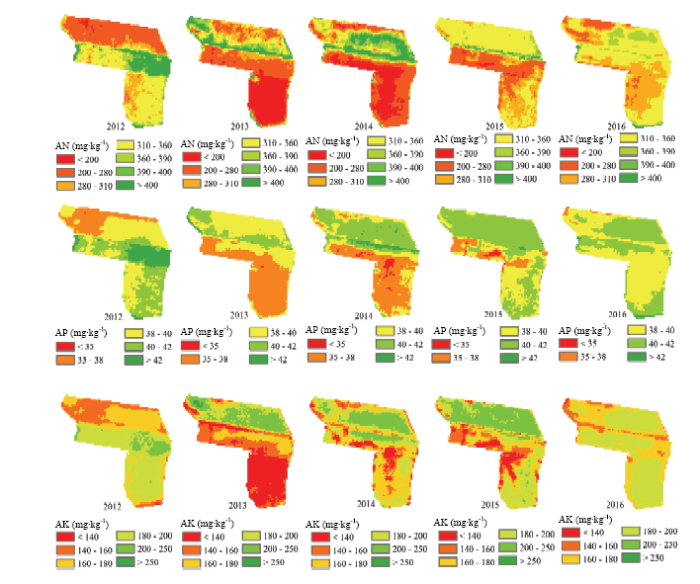
2.1.1 时空变异特征 图2为玉米和大豆田块AN的年际分布图,由图可知,土壤AN含量逐年向中间值靠拢,呈现均一化分布趋势。统计各个养分含量等级的面积比可知,极低、低和较高、高、极高等级的面积比随时间的变化呈现出波浪型下降趋势,且均在2014年呈现波峰;较低和中等等级的面积比呈现波浪型上升趋势,且均在2014年呈现波谷;土壤AN含量变化的集中趋势为280—360 mg·kg-1。AP和AK表现出类似的变化特征,且集中趋势分别为38—42 mg·kg-1和160—200 mg·kg-1,且该部分像元比例分别增加18.5%、23.1%和23.8%。图2
 新窗口打开|下载原图ZIP|生成PPT
图22012—2016 年农田尺度上土壤速效氮空间分布
Fig. 2The spatial distribution maps of soil available nitrogen (AN) under farm scale from 2012 to 2016
2.1.2 基本统计特征 表2为土壤AN的描述性统计结果,均为生长季前反演所得数据。由表可知,农场尺度上连续5年的AN含量平均值差异不大,与2012年相比,2016年的养分含量最低值提高了86.3%,最高值降低了19.9%,养分含量整体有向中间值靠拢的趋势。从变异系数来看,5年的养分含量均呈现中等程度的变异,除2014年的变异系数出现了突变之外,其余年份的变异系数整体呈现下降的趋势。说明5年内农田尺度上的土壤AN分布的差异性在减弱。考虑到2013年是涝年,雨水的淋洗是导致2014年土壤AN变异程度增加的直接原因。AP和AK的变异系数分别下降0.074和0.159,在2012—2016年内也表现出与AN类似的均一化特征。不同的是,5年内AK的变异系数随时间的变化单调递减,并未在2014年表现出突变,即AK在涝灾时期表现出的稳定性要更高。
Table 2
表2
表22012—2016年土壤速效氮描述性统计
Table 2
| 年份 Year | 平均值 Mean (mg·kg-1) | 最小值 Min (mg·kg-1) | 最大值 Max (mg·kg-1) | 标准差 SD (mg·kg-1) | 变异系数 CV |
|---|---|---|---|---|---|
| 2012 | 297.2 | 96.5 | 466.8 | 149.43 | 0.47 |
| 2013 | 304.9 | 170.1 | 457.9 | 93.21 | 0.30 |
| 2014 | 298.0 | 176.1 | 568.6 | 155.31 | 0.49 |
| 2015 | 301.9 | 187.2 | 397.3 | 75.30 | 0.24 |
| 2016 | 304.2 | 179.8 | 373.8 | 81.27 | 0.26 |
新窗口打开|下载CSV
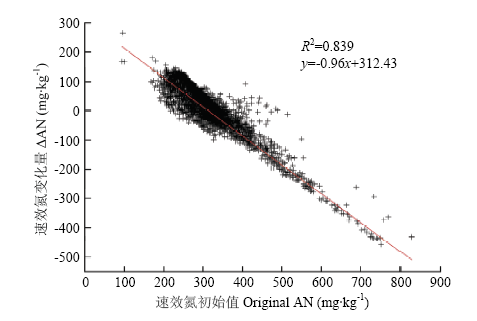
图3是AN在2012年含量初值和2012—2016年间变化量的散点图,由图可知AN变化量与初始值呈现极显著的负相关(P<0.01)。经过分析,AP的变化量也均与初始值呈现极显著的负相关,拟合结果分别为y= -0.99x+39.60(R2=0.882);而AK的拟合结果为y= -0.83x+149.26(R2=0.569), 这与养分本身在土壤中的稳定性有关。
图3
 新窗口打开|下载原图ZIP|生成PPT
图32012—2016年土壤速效氮含量变化量与2012年土壤速效氮之间的关系
横坐标是2012年的速效氮含量,纵坐标为2016年与2012年速效氮含量的差值
Fig. 3Relationships between contents of soil AN in 2012 and variation of the contents from 2012 to 2016
The horizontal axis represents the contents of AN in 2012, and the vertical axis represents the variation of the contents from 2012 to 2016
2.2 田块尺度上土壤速效养分时空变异分析
根据2012—2016年间作物分布图可知每一个田块单元的轮作模式。为了更好地分析轮作模式对速效养分变化的影响,选择了玉米-大豆轮作和玉米连作两种典型种植模式。另外考虑到田块面积和地形地貌等因素的影响,因此选择分布较为集中的相邻地块进行对比分析。考虑到以上两点,在农场东南方向选择3个相邻的地块,编号为#1、#2、#3(图1)。3个田块5年的轮作模式分别为B-M-B-M-B、M-B-M-B-M和M-M-M-M-M(B为大豆,M为玉米)。2.2.1 速效养分年际变化特征 图4给出了2012— 2016年间,#1、#2和#3田块上土壤AN、AP和AK的空间分布。5年内的速效养分均表现出明显的均一化特征,与农场尺度的养分含量集中趋势一致。对于#1地块,2013年的速效养分表现出东北部较低,并被“U型”高值包围的现象。这与地形分布有密切关系,#1地块的东北部海拔相对较高,在2013年涝灾的影响下,雨水对土壤的淋洗作用,使得速效养分随地形分布的特征更加明显。而到2014年时养分随地形分布的差异性减小,这主要是人工均衡化施肥的结果。对比发现,#1和#2田块养分含量差异性要大于#2和#3田块,这主要是轮作模式的影响,因为#1和#2田块的轮作模式正好相反,而#2和#3田块则有3年的耕作作物都为玉米。对于5年均种植玉米的#3田块, 2013和2014年的速效养分含量较低,而其余年份的速效养分含量差异不大。去除2013年的涝灾影响,还有一部分是因为2014年是丰年,土壤中被玉米吸收利用的速效养分比例增大,则存留在土壤中的速效养分含量减少。
图4
 新窗口打开|下载原图ZIP|生成PPT
图42012—2016年田块尺度上土壤速效养分空间分布
Fig. 4The spatial distribution maps of soil available nutrients under plot scale
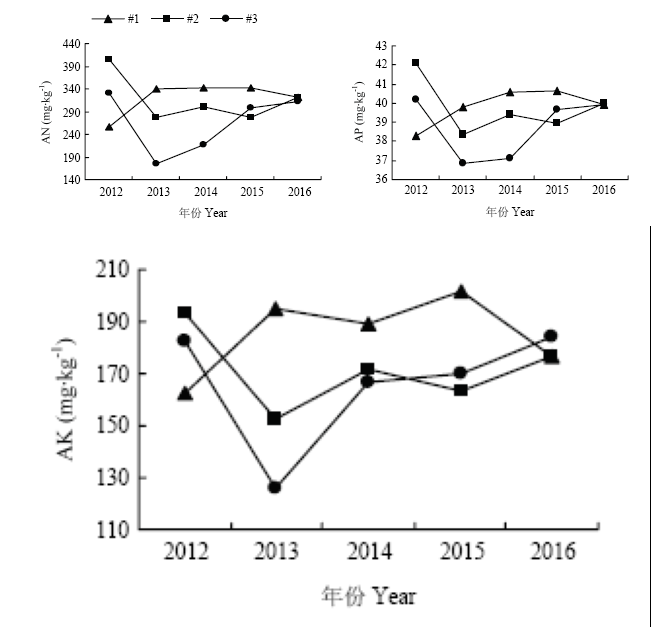
2.2.2 速效养分生长季内变化特征 图5分别是#1、#2、#3的土壤AN、AP和AK在2012—2016年间生长季内平均值的变化。由图可知到2016年时,3块田块的平均养分含量趋于一致,3种速效养分均随时间呈现出均一化特征。#2和#3田块的速效养分含量均在2013年发生不同程度的降低,两个田块的AN分别降低了31.4%和47.0%;AP分别降低了9%和8%;AK分别降低了21.2%和31.0%。#1和#2田块的速效养分变化趋势近乎相反,这与两个田块轮作模式正好相反有关。对于#1和#2田块来说,种植玉米的年份土壤速效养分高于种植大豆的年份,这主要是轮作模式的影响,因为种植玉米的田块施肥量要大于种植大豆的田块。#1田块的AN在2012—2013年间增加84.1 mg·kg-1,主要原因轮作模式的影响导致人为施肥量的增加;而2013—2014年施肥量减少,但是AN含量不仅未减少,反而增加了1.5 mg·kg-1,主要是由于豆科作物本身的根瘤固氮作用,增加了土壤中氨化氮的含量。
图5
 新窗口打开|下载原图ZIP|生成PPT
图5田块尺度土壤速效养分生长季内平均值变化
Fig. 5The average changes of soil available nutrients during the growth season under field scale
图6分别为#1和#3田块2012—2016年的生长季内AN变化情况(生长季模拟期为从5月19日至9月11日,以5 d为步长)。两个田块均在2014年AN下降速率最快。这与2014年是丰年有关,丰年作物产量高,相同时间内从土壤中吸收的营养物质更多,即吸收养分速率更快。2013年两块田均种植玉米,施氮肥量相同,对于生长季内的第1个月,#1田块土壤AN含量比#3多了近96.5%,这与#1田块前一轮作作物为大豆密切相关。大豆根瘤菌固氮作用使得第二年土壤的速效氮含量增多,可以相应减少氮肥的施用量。
图6
 新窗口打开|下载原图ZIP|生成PPT
图6#1和#3田块土壤AN含量生长季内变化
Fig. 6The changes of soil AN during the growth season in plot #1 and #3
2.3 土壤速效养分时空变化的影响因素
2.3.1 田间施肥管理因素 研究区采取均衡施肥管理,对同种作物使用相同的施肥量,不同种作物使用不同的施肥配方,玉米田块的施肥量大于大豆田块。以#1田块为例,2013和2014年分别种植的是玉米和大豆,氮肥施用量减少,但是土壤AN、含量却有少量增加,这主要是大豆的根瘤菌固氮作用的影响,该作用甚至可与人为施肥导致的养分含量差异相比拟。2.3.2 地形气候因素 选取地形差异较大的地块进行速效养分含量的分析,发现地势偏高的地块速效养分含量普遍偏低,且在2013年涝灾后,该田块速效养分含量下降更快。这是由于地形差异,导致速效养分因雨水的淋洗发生空间上的变异,且二者对速效养分变异性的影响相互促进。表3给出了研究区2012—2016年的月平均气温和月降水量。从表3可知,2012—2015年间,年平均气温平稳上升,到2016年发生下降。温度的升高会促进作物土壤中养分的吸收,促使养分含量下降,结合图2和图4可知,温度不是速效养分含量变化的主要原因。由表4可知,5年内研究区年度总降水量变化与速效养分含量变化呈现相反的趋势。2013年中雨以上雨水最多,达到25次,该年的速效养分平均含量最低。2015年和2016年中雨以上雨水总次数相同,但2016年间有一次暴雨,其对土壤的淋洗作用较大,因此强度较大的降雨对土壤速效养分变异的影响较大。
Table 3
表3
表3研究区2012—2016年月平均气温及降水量统计
Table 3
| 年度 Year | 指标 Item | 1 Jan. | 2 Feb. | 3 Mar. | 4 Apr. | 5 May | 6 Jun. | 7 Jul. | 8 Aug. | 9 Sep. | 10 Oct. | 11 Nov. | 12 Dec. | 平均值 Mean | 总和 Sum |
|---|---|---|---|---|---|---|---|---|---|---|---|---|---|---|---|
| 2012 | 平均温度 Average temperature (℃) | -28.8 | -21.1 | -8.9 | 4.5 | 13.8 | 20 | 22.3 | 19.1 | 12.9 | 2.7 | -11.2 | -24.5 | 0 | / |
| 总降水量 Total precipitation (mm) | 0.9 | 1.5 | 1.5 | 12.9 | 25.3 | 140.1 | 88.6 | 26.3 | 175.2 | 36.3 | 14.7 | 10.2 | / | 533.5 | |
| 2013 | 平均温度 Average temperature (℃) | -27.6 | -22 | -12.3 | 2 | 14.9 | 19.4 | 21.4 | 19.1 | 12.3 | 3 | -5.6 | -17.8 | 0.6 | / |
| 总降水量 Total precipitation (mm) | 6 | 9.8 | 12.4 | 13.9 | 93.8 | 109.8 | 228.1 | 104.8 | 51.5 | 39.1 | 12.4 | 5.4 | / | 687 | |
| 2014 | 平均温度 Average temperature (℃) | -24.6 | -23.7 | -7.1 | 8.2 | 12.5 | 21.5 | 20.5 | 19.6 | 12.1 | 2.2 | -8.8 | -20.9 | 1 | / |
| 总降水量 Total precipitation (mm) | 7.6 | 12.5 | 0 | 0.6 | 87.5 | 45.3 | 133.8 | 135.8 | 92.4 | 18.5 | 16.5 | 6.8 | / | 557.3 | |
| 2015 | 平均温度 Average temperature (℃) | -19.8 | -14.4 | -6.9 | 4.7 | 11.4 | 20 | 22.5 | 20.8 | 12.7 | 3.7 | -9.6 | -17.2 | 2.3 | / |
| 总降水量 Total precipitation (mm) | 0.1 | 22.6 | 7.3 | 16.1 | 37.4 | 60.3 | 14 | 106.1 | 72.4 | 25 | 1.3 | 6.9 | / | 369.5 | |
| 2016 | 平均温度 Average temperature (℃) | -22.1 | -18.3 | -3.8 | 4.6 | 13.8 | 17.1 | 21.35 | 18.91 | 14.09 | 0.103 | -16.8 | -21.46 | 0.6 | / |
| 总降水量 Total precipitation (mm) | 1.2 | 0.2 | 4 | 12 | 54.7 | 111.5 | 58.2 | 57.6 | 158.1 | 17.8 | 26.8 | 3.4 | / | 505.5 |
新窗口打开|下载CSV
Table 4
表4
表42012—2016年中雨、大雨和暴雨的降水次数
Table 4
| 年度 Year | 中雨 Moderate rain (10-25 mm) | 大雨 Heavy rain (25-50 mm) | 暴雨 Torrential rain (50-100 mm) | 总计 Total |
|---|---|---|---|---|
| 2012 | 9 | 3 | 1 | 13 |
| 2013 | 20 | 5 | 0 | 25 |
| 2014 | 13 | 2 | 1 | 16 |
| 2015 | 10 | 2 | 0 | 12 |
| 2016 | 9 | 2 | 1 | 12 |
新窗口打开|下载CSV
3 讨论
3.1 土壤速效养分时空变化分析
土壤速效养分含量不仅与土壤类型、质地、地形等结构性因素有关,也与耕作模式、施肥管理等人为因素有关。在农场尺度上土壤速效养分表现出的空间差异性不仅与耕种模式有关,也要考虑地形因素。在田块尺度上土壤速效养分也表现出一定的空间差异性,这与作物在不同地点的吸收能力和土壤结构等因素相关,这与宋晓宇等[32]的研究成果一致。经过连续5年的观测,发现无论在农田尺度还是田块尺度上,土壤速效养分的空间差异性均在减弱,说明人为因素对土壤速效养分的空间变异影响很大。经过长时间的耕作、施肥管理等人为干预,在一定程度上削弱了结构性因素对速效养分空间差异性的影响。这与杨昭君[33]的研究成果一致。土壤速效养分5年内的平均含量基本保持稳定,这与人为施肥管理的作用密不可分,可以认为近5年内的人为肥料投入与作物产出相平衡,并维持了农田的肥力收支平衡。生长季内以5天为步长的养分变化情况表明,作物在不同的生长周期对养分的吸收效率不同,这与侯振安[34]的结论一致。可以根据养分变化趋势找准作物在生长季内的养分吸收规律,在养分吸收高峰期予以追肥,才能将肥料的作用最大化。3.2 土壤速效养分变化原因分析
人类的耕作模式和施肥管理是农田土壤养分变化的主要原因,高纬度黑土区,合理的轮作有益于有机质的积累,与张迪[35]的结论一致。本文针对玉米-大豆轮作和玉米连作田块进行了对比分析,其中大豆的固氮作用对速效氮含量的增加起到重要作用。除了大豆-玉米轮作,还有冬小麦-玉米轮作、冬小麦-大豆轮作以及冬小麦-夏玉米、春玉米两年三熟轮作等。可以研究不同轮作模式下作物对土壤速效养分吸收效率的影响,寻找最佳的轮作模式。崔贝[36]认为温度的升高会增加土壤养分的代谢效率,易于作物吸收,从而导致养分含量降低。本文结论与其不一致的原因主要在于研究区的差异性,双山基地农场所在区域年平均气温比北京小汤山镇低大约12℃,气温的作用没有那么明显;此外本研究区中到暴雨以上的降水更多,降水量的增多会增大土壤养分的淋溶,造成土壤养分的损失。分析可知,本研究中降水对土壤养分的作用力要大于气温。土壤养分初始值明显影响养分的空间格局及其演变规律,本文中土壤AN和AP的变化量均与初始含量呈现明显的负相关,这与于洋[8]的结论一致。但AK的相关性不明显,养分本身在土壤中的稳定性以及其对作物生长影响的类型和程度有关,钾肥可以增强作物抗倒伏的能力,但作用程度要低于速效氮和有效磷。本文只针对3种不同的速效养分分析其变化规律,但不同养分间的相互作用和影响有待后续研究。为寻找最佳的氮磷钾施肥比例提供参考依据。3.3 应用
实现农田的分区施肥管理和动态的土壤速效养分监测,可为农田的变量施肥提供参考依据。依据历史土壤速效养分的观测数据以及各个影响因子的取值,求解各个因子的影响权重,并建立土壤速效养分预测模型。可以将模型用于预测未来的速效养分含量,从而可以指导变量施肥,这是下一步的研究方向。4 结论
4.1
2012—2016年,农场尺度上土壤AN、AP和AK含量的平均水平变幅不大,但是养分含量更加均一,养分分布的空间差异性在减弱。田块尺度上的土壤养分表现出同样的均一化特征,说明研究区人为因素对土壤速效养分空间变异的影响要高于结构性因素。生长季内土壤养分的动态变化与作物生长周期表现出较明显的相关性,其变化规律可以指导作物生长季内的追肥,提高资源的利用效率。4.2
较强降雨会增大土壤养分的淋溶,增大土壤养分的流失,降雨的影响要高于温度。田块间的养分分布差异主要影响因素是轮作模式的不同,特别是当耕种作物由玉米变为大豆时,氮肥施用量减少,但是田间土壤AN含量并未减少,反而有少量增加,这主要是豆科作物的根瘤菌固氮作用。土壤养分的初始值明显影响了其空间分布格局和演变规律。参考文献 原文顺序
文献年度倒序
文中引用次数倒序
被引期刊影响因子
URL [本文引用: 1]

The soil moisture is a quantity of paramount importance in the study of hydrologic phenomena and soil-atmosphere interaction. Because of its high spatial and temporal variability, the soil moisture monitoring scheme was investigated here both for soil moisture retrieval by remote sensing and in view of the use of soil moisture data in rainfall-runoff modeling. To this end, by using a portable T...
[本文引用: 1]
URL [本文引用: 1]
In karst regions, the spatial heterogeneity of soil mineral oxides and environmental variables is still not clear. We investigated the spatial heterogeneity of SiO 2 , Al 2 O 3 , Fe 2 O 3 , CaO, MgO, P 2 O 5 , K 2 O, and MnO contents in the soils of slope land, plantation forest, secondary forest, and primary forest, as well as their relationships with environmental variables in a karst region of Southwest China. Geostatistics, principal component analysis (PCA), and canonical correlation analysis (CCA) were applied to analyze the field data. The results show that SiO 2 was the predominant mineral in the soils (45.02% 67.33%), followed by Al 2 O 3 and Fe 2 O 3 . Most soil mineral oxide components had a strong spatial dependence, except for CaO, MgO, and P 2 O 5 in the plantation forest, MgO and P 2 O 5 in the secondary forest, and CaO in the slope land. Dimensionality reduction in PCA was not appropriate due to the strong spatial heterogeneity in the ecosystems. Soil mineral oxide components, the main factors in all ecosystems, had greater influences on vegetation than those of conventional soil properties. There were close relationships between soil mineral oxide components and vegetation, topography, and conventional soil properties. Mineral oxide components affected species diversity, organic matter and nitrogen levels.
URL [本文引用: 1]
An extensive knowledge of the temporal variability of soil fertility parameters and how this variation affects the environment is imperative to a wide range of disciplines within agricultural science for optimal crop production and ecosystem preservation. This paper examines the temporal variability of soil pH, organic matter (OM), cation exchange capacity (CEC), total nitrogen (TN), total phosphorus (TP), available phosphorus (P Av), and available potassium (K Av) on Cambosols (Entisols) ( n = 179) and Anthrosols (Inceptisols) ( n = 95) in Zhangjiagang County, China from 1980 to 2004. Nutrient input was monitored from 1983 to 2004. Annual N fertilizer rates were significantly different during three periods (1983–1989, 1989–1999, 1999–2004), where annual rates increased significantly after 1989 and then decreased after 1999. Annual P fertilizer rates were significantly different during two periods (1983–1993, 1993–2004) where annual rates increased after 1993. No change was found in K fertilizer rates. Soil pH marginally increased by 0.14 units in Cambosols, but significantly decreased by 1.02 units in Anthrosols. OM, CEC, and TN increased in both soil orders an average of 2.15 g kg 611, 1.6 cmol kg 611, and 0.21 g kg 611, respectively. TP decreased in Anthrosols by 70 mg kg 611, P Av increased in Cambosols by 4.83 mg kg 611, and K Av decreased in Cambosols by 15 mg kg 611. Fertilizer input rates are causing nutrient imbalances, contributing to acidification in Anthrosols, and decreasing C/N ratios. Nutrient loading of N and deficiency of K is also a potential problem in the area. Efforts should be made to readjust soil nutrient inputs to reach an optimal, sustainable level.
[本文引用: 1]
[本文引用: 1]
.
[本文引用: 1]
[本文引用: 1]
[本文引用: 1]
[本文引用: 1]
[本文引用: 2]
[本文引用: 2]
URL [本文引用: 1]
Soil properties can vary spatially due to differences in topography, parent material, and land management practices. For site-specific management within the field, information on spatial variation of soil properties is essential. This case study was conducted to quantify the spatial variability of available plant nutrients and organic matter under arable cropping in New Zealand. Within a 10.4-ha paddock that had a long-term history of arable cropping, 91 samples (07.5 cm) were collected in a grid pattern for determination of mineral nitrogen (Min N), anaerobically mineralizable N (AMN), Olsen P, total carbon (TC), and total N (TN). The data were evaluated using geostatistical and classical statistical methods. Although the paddock had a flat topography and had been managed uniformly for many years, nutrient concentrations exhibited substantial variability. All measured variables except mineral N showed moderate positional dependence. Autocorrelation distances were 400 m for Olsen P, 293 m for AMN, and 347 m for TC. Soil C showed a strong, positive correlation with the amount of clay plus fine silt (<5 m fraction) and a negative correlation with sand content. These results suggest that textural variation was a major factor influencing within-field variability in soil organic matter. Using the spatial data, zones with different plant nutrient requirements were identified (four for N; two for P). An application strategy that accounts for fertility differences between zones may improve fertilizer use efficiency and contribute to better environmental outcomes; P inputs could be reduced by 50% by avoiding application to the high Olsen P zone.
DOI:10.1097/SS.0b013e3181906a09URL [本文引用: 1]
Visible near-infrared reflectance spectroscopy (VNIRS) has proven to be a rapid and inexpensive method for soil assessment and could be useful for mapping soil properties. Our objective was to use VNIRS to predict soil organic matter (OM) content and assess the use of VNIRS in combination with geostatistical methods to characterize spatial variability and map OM distribution. Soil samples were ...
URL [本文引用: 1]
The long–range goal of this study was to develop a portable, soil nitrate sensor to determine soil nitrate contentin–situ. The immediate objective of this study was to develop a rapid technique to determine soil nitrate content using diffusereflectance spectroscopy in the mid–infrared (MIR) range. A Fourier Transform Infrared (FTIR) spectrophotometer was usedto determine the MIR response of various concentrations of calcium nitrate solution in water. The results clearly showed theexistence of a strong nitrate absorption peak at 7194 nm (1390 cm –1 ). For KBr–diluted soil samples, the ratio of the area underthe nitrate absorbance peak (1360–1390 cm –1 ) to the water absorbance peak (1640–1660 cm –1 ) was proportional to nitrateconcentration. Mid–infrared diffuse reflectance spectroscopy detected soil nitrate content at low concentrations inKBr–diluted soil samples. However, when undiluted soil samples containing varying amounts of nitrate content were testedin the MIR range, it was necessary to further condition the data with noise filtering techniques. Three noise removaltechniques were compared to improve the spectral quality: (1) the Savitzky and Golay, (2) FFT filtering, and (3) waveletdenoising. The wavelet denoising technique resulted in the highest coefficient of determination (R 2 = 0.856) for nitrateprediction. These noise removal techniques could not remove specular reflection effects and band overlap. To overcome theseproblems, a continuous wavelet transform, which could remove specular reflection as well as minimize noise, was used todeconvolute the soil spectral data, resulting in a high correlation (R 2 = 0.878) between soil nitrate content and MIR diffusespectral reflectance.
[本文引用: 1]
[本文引用: 1]
[本文引用: 1]
[本文引用: 1]
URL [本文引用: 1]
Soil organic carbon (SOC) dynamics affect soil quality, agricultural productivity and atmospheric CO2 concentration. Despite the need for spatial assessments of SOC content over time, reliable estimates from traditional field survey methods are limited by data availability; where measurements are often made at discrete point locations, at a coarse sample spacing or over a limited spatial extent. Remote sensing (RS) is in a strong position to provide spatially distributed, reproducible, scale-appropriate and resource-efficient measurements of SOC content and fluxes at field, landscape and regional scales. This paper provides a critical review of optical RS techniques for such applications. The first part of the paper reviews the methods, instruments and techniques used for developing predictive models for monitoring spatial SOC content. Secondly, sources of spatio-temporal SOC variations are examined, including the lateral transfer of SOC by erosion, soil structural breakdown and land management practices, in the context of RS data and techniques. The key challenges of using RS to monitor SOC contents are discussed along with opportunities for improving SOC predictions within a spatial framework. Such opportunities include the use of ancillary data, scale-specific methods, improved development of spectral libraries and better integration of RS technologies into empirical and simulation SOC models. This paper aims to provide a transparent assessment and practical guide to RS techniques and products in order to further advance and better incorporate the use of RS methods within soil science.
URL [本文引用: 1]
This paper compares predictions of soil organic carbon (SOC) using visible and near infrared reflectance (vis–NIR) hyperspectral proximal and remote sensing data. Soil samples were collected in the Narrabri region, dominated by Vertisols, in north western New South Wales (NSW), Australia. Vis–NIR spectra were collected over this region proximally with an AgriSpec portable spectrometer (350–250002nm) and remotely from the Hyperion hyperspectral sensor onboard satellite (400–250002nm). SOC contents were predicted by partial least-squares regression (PLSR) using both the proximal and remote sensing spectra. The spectral resolution of the proximal and remote sensing data did not affect prediction accuracy. However, predictions of SOC using the Hyperion spectra were less accurate than those of the Agrispec data resampled to similar resolution as the Hyperion spectra. Finally, the SOC map predicted using Hyperion data shows similarity with field observations. There is potential for the use of hyperspectral remote sensing for predictions of soil organic carbon. The use of these techniques will facilitate the implementation of digital soil mapping.
URL [本文引用: 1]
78 Soil organic carbon (SOC) is heterogeneously distributed within agricultural fields. 78 Accurate SOC prediction was done with airborne hyperspectral imaging at field-scale. 78 A pixel-wise map of SOC content is more realistic than an interpolated map. 78 Imaging spectroscopy is a useful tool for precision agriculture and soil C monitoring.
.
[本文引用: 1]
[本文引用: 1]
[本文引用: 1]
URL [本文引用: 1]
Regional crop yield prediction is a significant component of national food security assessment and food policy making. The crop growth model based on field scale is limited when it is extrapolated to regional scale to estimate crop yield due to the uncertainty of the input parameters. The data assimilation method which combines crop growth model and remotely sensed data has been proven to be the most effective method in regional yield estimation. The methods based on cost function are powerless with crop dynamic growth simulation and state variable dynamic update. However, sequence assimilation method has more advantages to overcome these problems, this paper presents a method of assimilation of time series HJ-1 A/B Normalized Difference Vegetation Index (NDVI) into the coupled model (e.g. WOrld FOod STudies (WOFOST) crop growth model and A two layer Canopy Reflectance Model (ACRM) radiative transfer mode) for winter wheat yield estimates using Ensemble Kalman Filter (EnKF) at the regional scale. The WOFOST model was selected as the crop growth model and calibrated and validated by the field measured data in order to accurately simulate the state variables and the growing process of winter wheat. The theoretically optimal time series LAI profile was obtained with the EnKF algorithm to reduce the errors which existed in both time series HJ-1 CCD NDVI and WOFOST CRM model. Finally, the winter wheat yield at the county level was estimated based on the optimized WOFOST model running on the wheat planting pixel. The experiment illustrates that in the potential mode, the EnKF algorithm has significantly improved the regional winter wheat yield estimates (R2=0.51, RMSE=775 kg/ha) over the WOFOST simulation without assimilation (R2=0.25, RMSE=2168 kg/ha) at county level compared to the official statistical yield data. Meanwhile, in the water-limited mode the results showed a high correlation (R2=0.53, RMSE=3005 kg/ha) with statistical data. In general, our results indicate that EnKF is a reliable optimization method for assimilating remotely sensed data into the crop growth model for predicting regional winter wheat yield.
URL [本文引用: 2]
The approach of using multispectral remote sensing (RS) to estimate soil available nutrients (SANs) has been recently developed and shows promising results. This method overcomes the limitations of commonly used methods by building a statistical model that connects RS-based crop growth and nutrient content. However, the stability and accuracy of this model require improvement. In this article, we replaced the statistical model by integrating the World Food Studies (WOFOST) model and time series of remote sensing (T-RS) observations to ensure stability and accuracy. Time series of HJ-1 A/B data was assimilated into the WOFOST model to extrapolate crop growth simulations from a single point to a large area using a specific assimilation method. Because nutrient-limited growth within the growing season is required and the SAN parameters can only be used at the end of the growing season in the original model, the WOFOST model was modified. Notably, the calculation order was changed, and new soil nutrient uptake algorithms were implemented in the model for nutrient-limited growth estimation. Finally, experiments were conducted in the spring maize plots of Hongxing Farm to analyze the effects of nutrient stress on crop growth and the SAN simulation accuracy. The results confirm the differences in crop growth status caused by a lack of soil nutrients. The new approach can take advantage of these differences to provide better SAN estimates. In general, the new approach can overcome the limitations of existing methods and simulate the SAN status with reliable accuracy.
[本文引用: 3]
[本文引用: 3]
DOI:10.1016/j.agrformet.2015.10.013URL [本文引用: 1]
The scale mismatch between remotely sensed observations and crop growth models simulated state variables decreases the reliability of crop yield estimates. To overcome this problem, we used a two-step data assimilation phases: first we generated a complete leaf area index (LAI) time series by combining Moderate Resolution Imaging Spectroradiometer (MODIS) data and three Landsat TM images with a Kalman filter algorithm (the synthetic KF LAI series), and then to assimilate this series into the WOFOST crop growth model to generate an ensemble Kalman filter LAI time series (the EnKF-assimilated LAI series). It was found that the synthetic KF time series of LAI estimates resulted in a more realistic characterization of LAI phenological dynamics. The synthetic EnKF LAI series were used to drive the WOFOST model to simulate winter wheat yields at a 1-km resolution for pixels with wheat fractions of at least 50%, and aggregated to the county level to allow a comparison with official regional statistical yield. The results indicated that assimilating the synthetic KF LAI series produced more accurate estimates of regional winter wheat yield (determination coefficient (R2) = 0.43; root-mean-square error (RMSE) = 439 kg ha-1) than three other approaches: WOFOST without assimilation (R2 = 0.14; RMSE = 647 kg ha-1), assimilation of Landsat TM LAI (R2 = 0.37; RMSE = 472 kg ha-1), and assimilation of S-G filtered MODIS LAI (R2 = 0.49; RMSE = 1355 kg ha-1). Thus, assimilating the synthetic KF LAI series into the WOFOST model with the EnKF strategy provides a reliable and promising method for improving regional estimates of winter wheat yield.
[本文引用: 1]
[本文引用: 1]
[本文引用: 1]
[本文引用: 1]
[本文引用: 1]
[本文引用: 1]
URL [本文引用: 1]
61Observations of seasonal & interannual SSS changes in Mississippi and River plume61Interannual SSS can be as large as seasonal SSS anomalies in Mississippi River plume.61River discharge is the major forcing, evaporation–precipitation plays a minor role61Significant implications to ocean modeling/forecast and hypoxic zone monitoring
[本文引用: 1]
[本文引用: 1]
[本文引用: 1]
[本文引用: 1]
[本文引用: 1]
[本文引用: 1]
[本文引用: 1]
[本文引用: 1]
[本文引用: 1]
[本文引用: 1]
[本文引用: 1]
.
[本文引用: 1]
[D].
[本文引用: 1]
[D].
[本文引用: 1]
[本文引用: 1]
[本文引用: 1]
[本文引用: 1]
[本文引用: 1]
[本文引用: 1]
[本文引用: 1]
