 ,1, 余永亮1, 许兰杰1, 杨红旗1, 董薇1, 谭政伟1, 李磊1, 裴新涌2, 刘新梅1
Inheritance and QTL Mapping for α-Tocopherol in Soybean
LIANG HuiZhen,1, YU YongLiang1, XU LanJie1, YANG HongQi1, DONG Wei1, TAN ZhengWei1, LI Lei1, PEI XinYong2, LIU XinMei1第一联系人:
收稿日期:2018-06-25接受日期:2018-08-7网络出版日期:2019-01-01
| 基金资助: |
Received:2018-06-25Accepted:2018-08-7Online:2019-01-01

摘要
关键词:
Abstract
Keywords:
PDF (1974KB)元数据多维度评价相关文章导出EndNote|Ris|Bibtex收藏本文
本文引用格式
梁慧珍, 余永亮, 许兰杰, 杨红旗, 董薇, 谭政伟, 李磊, 裴新涌, 刘新梅. 大豆α-生育酚的遗传与QTL分析[J]. 中国农业科学, 2019, 52(1): 11-20 doi:10.3864/j.issn.0578-1752.2019.01.002
LIANG HuiZhen, YU YongLiang, XU LanJie, YANG HongQi, DONG Wei, TAN ZhengWei, LI Lei, PEI XinYong, LIU XinMei.
0 引言
【研究意义】大豆维生素E是脂溶性维生素,参与生物体内信号转导、基因表达调控、抗低温胁迫等多种代谢途径,具有提高机体免疫力、抗不育、抗癌及预防心血管疾病的作用[1,2,3]。天然维生素E中,只有α-生育酚能被人体很好地吸收和代谢[4],而且α-生育酚的生物活性高,因此维生素E主要以α-生育酚含量为指标[5]。近年来,天然维生素E以每年10%的需求增长,但是,中国国内产量较少,生产几乎被美国、德国、日本等国家垄断[6]。因此,选育富含高α-生育酚的大豆品种有重要意义。【前人研究进展】目前,α-生育酚QTL定位研究主要集中在玉米[7,8]、油菜[9]、大麦[10]、向日葵[11,12]和芥菜[13],大豆α-生育酚的遗传机制和QTL定位较少。DWIYANTI等[14]用SSR标记对大豆F2和F3群体中α-生育酚含量进行了遗传分析,发现K连锁群对α-生育酚含量影响较大。SHAW等[15]利用Bayfield×Shire重组自交系群体(RIL),检测到6个控制α-生育酚的QTL,分别定位在第1、2、4、5、12和20染色体上。LI等[16,17]利用Bayfield×Hefeng 25大豆RIL群体检测到4个控制α生育酚的QTL,分别定位在第2、6、8和20染色体上。张红梅等[18]利用Essex×ZDD2315大豆RIL群体分别检测到2个和4对控制大豆α-生育酚的加性和互作QTL。【本研究切入点】目前,关于大豆α-生育酚QTL被检测到的报道较少,由于遗传背景和环境条件的不同,表现稳定的更少,大豆α-生育酚分子标记辅助育种受到限制。【拟解决的关键问题】本研究以晋豆23×灰布支黑豆衍生的447个RIL为试验材料,利用WinQTLCart2.5[19]复合区间模型分析方法,对大豆α-生育酚进行QTL定位分析;采用主基因+多基因混合遗传分离分析方法[20],分析α-生育酚含量遗传规律,为高α-生育酚含量的大豆品种选育奠定遗传学基础。1 材料与方法
1.1 试验材料与设计
供试材料为山西省农业科学院经济作物研究所配制的晋豆23×灰布支黑豆杂交组合。该组合包含447个家系的重组自交系群体,即每一F2单株衍生成F2家系,每一F2家系再选株建成家系,至2011年是F14代。亲本晋豆23和灰布支黑豆分别来自山西省栽培大豆和农家品种。试验群体及亲本分别于2011年、2012年和2015年夏季在河南省农业科学院原阳试验基地种植,冬季在海南省三亚南繁基地种植。田间试验采取随机区组设计,2次重复,行长4.0 m,行距0.4 m。按照大田模式进行田间管理,四周分设保护行,一播全苗。1.2 α-生育酚含量测定及数据分析
分别从6个环境下每个重复、每个家系各选取15.00 g大小一致、籽粒饱满的大豆种子,用旋风磨(Retsch ZM100,Φ = 1.0 mm,Rheinische,Germany)磨粉。取样粉碎后的豆粉样品2.5 g,加入30 mL无水乙醇混合均匀,再加入5 mL浓度10%抗坏血酸溶液和10 mL氢氧化钾溶液,用恒温水浴皂化30 min;然后提取皂化液,采用100 mL正己烷分3次进行,弃去水层;最后,用无水硫酸钠过滤提取液,在旋转蒸发瓶中旋转蒸发,将残留液用氮气吹干,再用2.5 mL甲醇溶液进行溶解,通过0.45 μm滤膜,4℃保存备用。利用高效液相色谱技术(high performance liquid chromatography,HPLC),采用外标法对α-生育酚异构体进行定量分析。色谱柱为DIKMA公司产品,色谱柱填料为symmetry,钻石C18,5 μm,柱规格为250.0 mm×4.6 mm;荧光检测器激发波长290 nm,发射波长330 nm;选用甲醇为流动相,流速1.5 mL·min-1。柱温40℃,进样量20 μL,检测时间10 min。以α-生育酚(Alpha tocopherol,以下简称α-TOC)峰面积代入回归方程进行定量分析。α-生育酚含量的计量单位是:mg·(100 g)-1
利用SAS V9.2软件的PROC ANOVA程序对6种环境下α-生育酚含量进行联合方差分析和描述统计。遗传变异系数GCV(100%)=σg/μ×100。其中σg为遗传方差的标准差;μ为群体平均数,均由试验数据估计。遗传率h2 = σg2/[σg2+(σge2/n)+ (σ2/rn)],其中:σg2为遗传方差;σge2为基因型×年份(环境)方差;σ2为误差方差;r为重复数;n为年份数。
1.3 遗传连锁图谱的构建与QTL分析
利用Mapmaker/Exp 3.0构建连锁图谱,图谱总长度2 047.6 cM。包括27个连锁群、227个SSR标记,平均图距8.8 cM(该图谱在在H(Chr.12)染色体出现了1个间隙,在K(Chr.9)、F(Chr.13)和J(Chr.16)3条染色体上均出现了2个间隙,形成了27个连锁群)。经与SONG等[21]整合的图谱相比对,标记排序相对一致。引物信息、标记试验过程及作图过程见参考文献[22,23]。QTL定位软件为WinQTLCart 2.5,命名方式参照MCCOUCH等[24]方法。定位采用软件中复合区间作图法(CIM)Zmapqtl方法的Model 6,设置该窗口之外的5个标记作为余因子、步移速度2 cM,向前回归法全基因组扫描,以确定各性状QTL数目及其在染色体上的位置。选取临界阈值LOD=2.5(0.05显著水平),检测各环境下的QTL效应。当LOD≥2.5时,认为该位置上QTL存在,临近位点间图距小于5 cM时,认定为同一个QTL。
1.4 数量性状主基因+多基因混合遗传模型分析
采用主基因+多基因混合遗传分离分析法[20]中极大似然法和IECM估算晋豆23×灰布支黑豆及其衍生的RIL各世代、各成分分布的参数,,通过AIC准则和一组适合性测验,选择最适遗传模型;利用每一个成分的分布参数通过最小二乘法估计相应的遗传参数。主基因遗传率hmg2 (%) = σmg2/σp2,多基因遗传率hpg2 (%) = σpg2/σp2,环境遗传率he2 (%) = σe2/σp2。各遗传方差间的关系为σp2 = σmg2+σpg2+σe2。其中:σp2为群体表型方差;σmg2为主基因遗传方差;σpg2为多基因遗传方差;σe2为多环境遗传方差。2 结果
2.1 大豆α-生育酚含量的表型分析
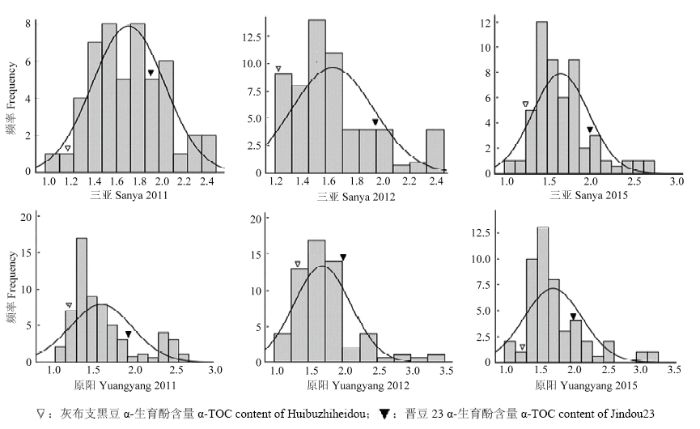
表1和图1列出了亲本和RIL群体中α-生育酚含量的表型变异情况。原阳和三亚2个地点3年试验中α-生育酚亲本差分别为-0.68和-0.72、-0.70和-0.64、-0.71和-0.79,平均差分别为-0.70和-0.72。经t值检测,双亲均值在各年度、各地点均差异显著。2个亲本在后代分离群体中表现出较大的分离程度,不同环境下,RIL群体的最小值和最大值之间差异明显,存在较大幅度超亲分离,表明亲本间位点互补,大豆α-生育酚遗传基因分布在双亲中,通过杂交可以得到超亲分离的株系。α-生育酚含量呈现出近似正态的连续分布。同一性状同一地点不同年份间遗传变异系数差别不大。α-生育酚3年间2点的遗传率为62.03%—77.35%。表2为3年联合方差分析结果。α-生育酚基因型在组分间存在显著差异,其余变异包括不同环境之间、重复间、年份×地点、年份×基因、地点×基因、年份×地点×基因差异不显著,表明大豆α-生育酚含量的表达主要受基因的影响,环境影响较小。Table 1
表1
表1RIL群体大豆α-生育酚含量表型变异
Table 1
| 年份 Year | 平均值Mean | 亲本差P2—P1 | t值t value | RIL变幅RIL range | GCV(%) | 遗传率h2 | ||||||
|---|---|---|---|---|---|---|---|---|---|---|---|---|
| 原阳 Yuanyang | 三亚 Sanya | 原阳 Yuanyang | 三亚 Sanya | 原阳 Yuanyang | 三亚 Sanya | 原阳 Yuanyang | 三亚 Sanya | 原阳 Yuanyang | 三亚 Sanya | 原阳 Yuanyang | 三亚 Sanya | |
| 2011 | 1.68 | 1.73 | -0.68 | -0.72 | 5.22** | 5.93** | 1.17—2.67 | 1.07—2.44 | 22.65 | 18.30 | 62.02 | 68.37 |
| 2012 | 1.71 | 1.68 | -0.70 | -0.64 | 6.17** | 4.97** | 1.02—3.47 | 1.27—2.47 | 24.44 | 18.25 | 67.21 | 77.35 |
| 2015 | 1.74 | 1.85 | -0.71 | -0.79 | 5.32** | 7.05** | 1.07—3.20 | 1.03—2.68 | 25.29 | 19.76 | 70.03 | 75.91 |
| 平均值Mean | 1.71 | 1.75 | -0.70 | -0.72 | 6.29** | 7.83** | 1.02—3.47 | 1.03—2.68 | 23.98 | 18.72 | 68.52 | 73.53 |
新窗口打开|下载CSV
Table 2
表2
表2大豆种子α-生育酚含量方差分析
Table 2
| 变异Variation | Df | SS | MS | F | F0.05 |
|---|---|---|---|---|---|
| 年份间Year | 2 | 0.0551 | 0.0551 | <1 | |
| 地点间Location | 1 | 0.0070 | 0.0035 | <1 | |
| 基因型Genotypes | 117 | 31.1280 | 0.2661 | 2.0034* | 1.871 |
| 年份×地点Year×Location | 2 | 0.1497 | 0.0749 | <1 | |
| 年份×基因Year×Genotypes | 234 | 55.4814 | 0.2371 | 1.7854 | 1.830 |
| 地点×基因Location×Genotypes | 117 | 16.5170 | 0.1412 | 1.0633 | 1.871 |
| 年份×地点×基因Year×Location×Genotypes | 234 | 22.9903 | 0.0982 | <1 | |
| 误差 Error | 702 | 93.2256 | 0.1328 |
新窗口打开|下载CSV
图1
 新窗口打开|下载原图ZIP|生成PPT
图1不同环境RILs群体α-生育酚含量分布图
Fig. 1Distribution of α-TOC among the two parents and the RILs population across six environments
2.2 α-生育酚的主基因+多基因混合遗传分析
分别选用2011年、2012年和2015年各环境下试验数据的平均值进行主基因+多基因混合遗传分析,根据AIC值和适合性测验(表3),α-TOC最适遗传模型符合4MG-AI,即4对具有加性上位性效应的主基因遗传模型。4对主基因间加性效应值中3对为正值,表明基因来源于母本晋豆23;1对为负值,表明基因来源于父本灰布支黑豆;4对主基因之间相互作用的上位性效应表现为正值和负值的各有3对,说明不同基因间上位性效应对α-TOC的影响方向并不完全一致。3年6个环境中均表现出较大的遗传力,达到95.95%—99.87%,没有检测到多基因效应。环境因素引起的变异为0.13%—4.05%,效应值较小。说明α-TOC的遗传主要受4对主基因影响,环境影响较小。Table 3
表3
表3α-生育酚最适模型及遗传参数估计结果
Table 3
| 参数 Parameter | α-生育酚α-TOC | 参数 Parameter | α-生育酚α-TOC | |||||
|---|---|---|---|---|---|---|---|---|
| 原阳Yuanyang | 三亚Sanya | 原阳Yuanyang | 三亚Sanya | |||||
| 最适模型Optimal model | 4MG-AI | 4MG-AI | ||||||
| 一阶参数1st order parameter | 二阶参数2nd order parameter | |||||||
| M | 2011 | 0.8822 | 0.8724 | σp2 | 2011 | 0.7701 | 0.8051 | |
| 2012 | 0.9814 | 1.6881 | 2012 | 0.8221 | 0.0937 | |||
| 2015 | 0.9917 | 0.8798 | 2015 | 0.8468 | 0.7472 | |||
| d(da) | 2011 | 0.8542 | 0.8727 | σmg2 | 2011 | 0.7684 | 0.8041 | |
| 2012 | 0.8786 | 0.1906 | 2012 | 0.8178 | 0.0899 | |||
| 2015 | 0.9900 | 0.8796 | 2015 | 0.8447 | 0.7455 | |||
| db | 2011 | 0.1392 | 0.1832 | σpg2 | 2011 | |||
| 2012 | 0.1792 | 0.0674 | 2012 | |||||
| 2015 | 0.2319 | 0.1563 | 2015 | |||||
| dc | 2011 | 0.0728 | 0.0852 | h2mg(%) | 2011 | 99.78 | 99.87 | |
| 2012 | 0.1864 | 0.0054 | 2012 | 99.48 | 95.95 | |||
| 2015 | 0.1722 | 0.1180 | 2015 | 99.75 | 99.77 | |||
| dd | 2011 | -0.0975 | -0.0446 | hpg2 (%) | 2011 | |||
| 2012 | -0.0835 | -0.0364 | 2012 | |||||
| 2015 | -0.1217 | -0.0772 | 2015 | |||||
| iab(i*) | 2011 | 0.1392 | 0.1832 | |||||
| 2012 | 0.1792 | 0.1679 | ||||||
| 2015 | 0.2319 | 0.1563 | ||||||
| iac | 2011 | 0.0728 | 0.0852 | |||||
| 2012 | 0.1864 | 0.0794 | ||||||
| 2015 | 0.1722 | 0.1180 | ||||||
| iad | 2011 | -0.0975 | -0.0446 | |||||
| 2012 | -0.0835 | -0.0967 | ||||||
| 2015 | -0.1217 | -0.0772 | ||||||
| ibc | 2011 | 0.0279 | 0.007 | |||||
| 2012 | 0.1083 | 0.0286 | ||||||
| 2015 | 0.0125 | 0.0085 | ||||||
| ibd | 2011 | -0.0658 | -0.0059 | |||||
| 2012 | -0.1309 | -0.0938 | ||||||
| 2015 | -0.0083 | -0.007 | ||||||
| icd | 2011 | -0.0276 | -0.0052 | |||||
| 2012 | -0.1028 | -0.0077 | ||||||
| 2015 | -0.0125 | -0.0034 | ||||||
新窗口打开|下载CSV
2.3 大豆α-生育酚的QTL定位
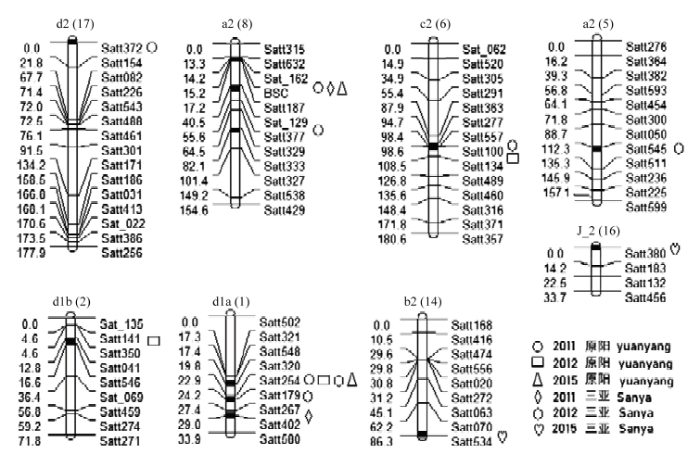
根据WinQTLCart 2.5的定位结果,共在8个连锁群上检测到17个α-生育酚的QTL(表4,图2),分别位于A1(Chr.5)、A2(Chr.8)、B2(Chr.14)、C2(Chr.6)、D1a(Chr.1)、D1b(Chr.2)、D2(Chr.17)和J_2(Chr.16)染色体上,解释的表型变异范围为8.35%—35.78%。位于A1(Chr.5)染色体Satt545—Satt511标记区间的qα-A1-1,表型贡献率为35.78%,解释的表型变异最大。其中,qα-D1a-1同时在2011年原阳、2012年原阳和三亚、2015年原阳4个环境下检测到,且均定位在D1a(Chr.1)染色体Satt320—Satt254标记区间19.79 cM处,解释的表型变异分别为12.55%、12.01%和11.89%、12.61%,说明这是一个能够稳定遗传的QTL。加性效应值0.119—0.132,增加α-TOC含量的等位基因来自母本晋豆23;同时,在qα-D1a-2和qα-D1a-3均被定位在D1a(Chr.1)染色体上,但2个QTL位置相距较远,应该不是同一个QTL,说明D1a(Chr.1)染色体上可能存在多个与α-TOC相关的基因。qα-A2-1同时在2011年原阳和三亚、2015年原阳3个环境下检测到,且均定位在A2(Chr.8)染色体Sat_129—Satt377标记区间44.53 cM处,解释的表型变异分别为23.18%和22.56%、23.01%,说明这是一个能够稳定遗传的QTL。加性效应值-0.195—-0.180,增加α-TOC含量的等位基因来自父本灰布支黑豆。加性效应值正负表现不一,加性效应值为正,说明该QTL对大豆α-生育酚含量起正向作用,等位基因来自于母本晋豆23;加性效应值为负,说明说明该QTL对大豆α-生育酚含量起负向作用,等位基因来自于父本灰布支黑豆。Table 4
表4
表4α-生育酚QTL位置及其参数
Table 4
| 年份 Year | 环境 Environment | QTL | 染色体 Chr. | 标记区间 Marker Interval | 位置 Position (cM) | LOD | 加性效应 Additive | R2 (%) |
|---|---|---|---|---|---|---|---|---|
| 2011 | 原阳Yuanyang | qα-A2-1 | A2(8) | Sat_129—Satt377 | 44.53 | 3.75 | -0.195 | 23.18 |
| qα-D2-1 | D2(17) | Satt372—Satt154 | 0.01 | 2.62 | 0.147 | 12.82 | ||
| qα-A2-2 | A2(7) | Satt333—Satt327 | 93.50 | 3.93 | 0.182 | 21.07 | ||
| qα-D1a-1 | D1a(1) | Satt320—Satt254 | 19.79 | 2.63 | 0.125 | 12.55 | ||
| 三亚Sanya | qα-D1a-3 | D1a(1) | Satt267—Satt402 | 28.98 | 4.11 | 0.140 | 17.05 | |
| qα-A2-1 | A2(8) | Sat_129—Satt377 | 44.53 | 3.71 | -0.190 | 22.56 | ||
| 2012 | 原阳Yuanyang | qα-D1b-1 | D1b(2) | Satt041—Satt546 | 14.84 | 2.52 | -0.736 | 8.35 |
| qα-C2-2 | C2(6) | Satt100—Satt134 | 100.60 | 3.05 | -0.143 | 21.10 | ||
| qα-D1a-1 | D1a(1) | Satt320—Satt254 | 19.79 | 2.70 | 0.131 | 12.01 | ||
| 三亚Sanya | qα-A1-1 | A1(5) | Satt545—Satt511 | 114.35 | 5.06 | -0.191 | 35.78 | |
| qα-C2-1 | C2(6) | Satt577—Satt100 | 98.36 | 4.10 | -0.129 | 17.07 | ||
| qα-D1a-1 | D1a(1) | Satt320—Satt254 | 19.79 | 2.53 | 0.119 | 11.89 | ||
| qα-D1a-2 | D1a(1) | Satt179—Satt267 | 24.23 | 2.88 | 0.120 | 12.33 | ||
| 2015 | 原阳Yuanyang | qα-D1a-1 | D1a(1) | Satt320—Satt254 | 19.79 | 2.72 | 0.132 | 12.61 |
| qα-A2-1 | A2(8) | Sat_129—Satt377 | 44.53 | 3.21 | -0.180 | 23.01 | ||
| 三亚Sanya | qα-B2-1 | B2(14) | Satt070—Satt534 | 86.20 | 3.18 | -0.964 | 20.46 | |
| qα-J_2-1 | J_2(16) | Satt380—Satt183 | 0.01 | 2.71 | -0.687 | 16.90 |
新窗口打开|下载CSV
图2
 新窗口打开|下载原图ZIP|生成PPT
图2检测到的QTL及加性效应QTL在连锁群上的分布
Fig. 2Distribution of main QTLs and additive QTLs on linkage groups
3 讨论
3.1 大豆α-生育酚的遗传机制
本研究采用混合遗传模型分离分析方法研究大豆α-生育酚在河南省和海南省2个地点3个年份共6个环境中的遗传;采用WinQTLCart 2.5软件中CIM方法进行QTL定位分析。研究表明,α-生育酚的遗传最适遗传模型符合4MG-AI,即4对具有加性上位性效应的主基因遗传模型。3年6个环境中的遗传力达95.95%—99.87%,环境因素引起的变异仅为0.13%—4.05%。说明α-TOC的遗传主要受到4对主基因影响,受环境因素影响较小。同时,本研究在8条染色体中检测到17个α-生育酚的QTL。2种分析结果相比较,发现QTL定位数目与遗传模型预测的数目并不完全一致。2011年原阳和2012年三亚各检测出4个QTL,与α-生育酚最适遗传模型4MG-AI一致,但是其余环境中检测出的QTL数目为2—3个,与遗传模型预测的数目不统一。出现这种现象的可能原因有:1)与QTL定位图谱有关。与标准图谱相比较,本研究选用的图谱本身还需要进一步完善;2)与混合遗传模型有关。本研究选用的是4对主基因+多基因混合遗传模型[25],该模型只分析了主基因间无连锁的情况,简化了主基因间的连锁作用。同时,该遗传模型成分分布数和待估参数比较多,分析过程受到限制,估算结果的准确性有待提高;3)控制α-生育酚含量的表达在时空上存在差异。因此,对于α-生育酚含量的遗传机理研究,在本研究的基础上尚需进一步深化。3.2 大豆α-生育酚含量的QTL分析及与前人定位结果的比较
为了提高QTL定位的精度,通常采取多年多点数据分析方法,增大QTL检测强度,进而挖掘出表现稳定的QTL[26]。本研究分析了3年2个地点共6个环境中α-生育酚含量,4个环境下在D1a(Chr.1)染色体Satt320—Satt254标记区间19.79 cM处均检测到qα-D1a-1,3个环境下在A2(Chr.8)染色体Sat_129—Satt377标记区间44.53 cM处均检测到qα-A2-1,表明qα-D1a-1和qα-A2-1为α-生育酚的稳定主效QTL,与之相对应的2个区间也是相对准确可靠。下一步研究将对该共位标记区间实施精细定位,通过将关联的目标区间内的主效QTL剖分为几个连锁的多效性QTL,搜索可能的候选基因,为高α-生育酚含量分子标记辅助育种奠定基础。生物的遗传和进化过程中,广泛存在多因一效和一因多效现象。这两种基因作用方式从不同角度共同促进生命活动的发现[27]。多因一效促成了生物多样性。不同的生物过程参与到同一种表型上,降低了单因素所带来的局限性,出现了多态性。一因多效将多种过程联系起来,共同参与基因表达过程,形成一系列生物轴,一方面促进行为的统一性,一方面形成正负反馈,避免生理生化过程的失稳。本研究发现,在8个连锁群上共检测到17个α-生育酚的QTL,加性效应值正负均有表现,这些等位基因一方面来自于母本晋豆23,一方面来自于父本灰布支黑豆,推测多因一效可能存在于α-生育酚的形成过程。同时也发现,本研究中稳定表达的与α-生育酚含量相关标记Sat_129和Satt377,在以往研究中,Sat_129与影响大豆生育期[28]脂肪含量[29]和染料木素[30]的基因位点位于同一区域;与影响大豆染料木苷[30]、生育期[31]和耐涝性[32]基因位点位于同一区域;Satt041与影响大豆侧根数[33]、Satt267与影响大豆茸毛[34]和侧根数[35]的基因位点位于同一区域。表明控制这些性状的基因可能存在一因多效现象。这些基因位点之间是否存在表达调控机制并通过QTL间的上位性反映出来的?不同研究中这些发挥作用的位点又如何影响到α-生育酚的差异呢?需要进行深入研究与探讨。
与以往研究相比,尽管各研究选用的群体、图谱和环境条件不同,仍有一部分α-生育酚定位结果相吻合。与SHAW等[15]相比较,均定位在A1、D1a和D1b染色体上,且在A1染色体上均定位在Satt545标记处;与LI等[16,17]相比较,均定位在B2、C2和D1b染色体上;与张红梅等[18]相比较,均定位在A1和C2染色体上;与李海燕[36]等相比较,均定位在A2、C2和D1b染色体上。但是,本研究中检测出的qα-D1a-1和qα-A2-1 2个稳定主效QTL,前人研究中虽然在这两条染色体上均检测出α-生育酚QTL,但是均不再同一个标记区间,分析其原因可能受到定位群体、定位图谱、遗传背景或环境差异等诸多因素影响。除此之外,本研究中定位出的其他QTL,均未见公开报道。
3.3 遗传图谱对QTL定位的影响
遗传图谱的构建在基因定位与图位克隆、遗传多样性及遗传标记辅助选择育种等方面都具有重要意义。遗传图谱的应用价值,与图谱的饱和度、标记数量的多少、标记在图谱上定位的准确性、标记在图谱上分布的均匀程度等有关。一个基本的连锁框架图要求标记间平均间距不超过20 cM。主基因定位时,其平均距离要求在10—20 cM或更小[37]。如果连锁群标记较少,图谱上标记的密度较低,会对QTL的检出效率造成影响,可能检测不到效应值较小的QTL,影响定位的准确性[38]。同时,从另一角度分析,此时依然能够被检测到的QTL,可能是效应较大的主效QTL,对数量性状基因的图位克隆和分子标记辅助选择更具实际价值。但是,因为前者降低了QTL定位的准确性,其价值与提高LOD的阈值来检测主效QTL相比依然不可同日而语。本研究图谱是由海南省热带农业资源开发利用研究所方宣钧研究员提供的(论文中致谢部分有说明),图谱总长度2 047.6 cM,平均图距8.8 cM[22],总体上看图谱平均间距尚能满足定位要求。下一步工作中,希望能进一步提高图谱分子标记密度和图谱饱和度,不断提高定位结果的精准度。尽管如此,利用该图谱定位了一批大豆数量性状的QTL,在国内外期刊发表,研究结果仍然具有一定的理论和现实意义。本研究所得定位结果与前人相比,多个QTL定位均在相同的染色体上,但定位的标记区间不尽相同,定位位置是否重叠尚不能确定。因为,不同研究中选用的图谱不尽相同,图谱不尽完善,所定位的标记区间是否重叠还需要随着研究手段和使用图谱的不断进步和完善逐步得到验证。LI等[39]认为,由于作图群体所用亲本不同,长期的遗传演化过程中,亲本材料染色体结构会发生变异,相同序列所处的区段在不同的亲本中发生改变,导致在不同的研究者之间即便采用相同的分子标记构建的连锁图谱之间,分子标记在连锁群上的排列顺序也不尽相同。分子标记用于遗传图谱构建是遗传学领域的重大进展之一,随着新的标记技术的发展,图谱上标记的密度也将越来越高。目前的工作可以为将来更加精细的定位提供参考
目前,国内外研究中,QTL定位结果精细程度依然不足。下一步科学研究工作的方向可以通过对大豆α-生育酚性状进行QTL精细作图定位,重点跟踪研究多环境、多分析方法均能检测到的QTL区域,发掘控制α-生育酚的功能基因。
4 结论
α-生育酚最适遗传模型符合4MG-AI,即4对具有加性上位性效应的主基因遗传模型。其遗传主要受4对主基因影响,受环境因素影响较小。检测到α-生育酚的2个稳定主效QTL,Satt320—Satt254和Sat_129—Satt377是共位标记区间。致谢:本研究连锁图谱和群体材料由海南省热带农业资源开发利用研究所方宣钧研究员和山西省农业科学院经济作物研究所刘学义研究员提供,在此表示感谢。
参考文献 原文顺序
文献年度倒序
文中引用次数倒序
被引期刊影响因子
DOI:10.3390/molecules15031746URL [本文引用: 1]

Vitamin E is an essential vitamin and a lipid soluble antioxidant, at least, under in vitro conditions. The antioxidant properties of vitamin E are exerted through its phenolic hydroxyl group, which donates hydrogen to peroxyl radicals, resulting in the formation of stable lipid species. Beside an antioxidant role, important cell signalling properties of vitamin E have been described. By using gene chip technology we have identified α-tocopherol sensitive molecular targets in vivo including christmas factor (involved in the blood coagulation) and 5α-steroid reductase type 1 (catalyzes the conversion of testosterone to 5α-dihydrotestosterone) being upregulated and γ-glutamyl-cysteinyl synthetase (the rate limiting enzyme in GSH synthesis) being downregulated due to a-tocopherol deficiency. α-Tocopherol regulates signal transduction cascades not only at the mRNA but also at the miRNA level since miRNA 122a (involved in lipid metabolism) and miRNA 125b (involved in inflammation) are downregulated by α-tocopherol. Genetic polymorphisms may determine the biological and gene-regulatory activity of a-tocopherol. In this context we have recently shown that genes encoding for proteins involved in peripheral α-tocopherol transport and degradation are significantly affected by the apoE genotype.
DOI:10.1104/pp.106.094771URLPMID:17293434 [本文引用: 1]
Tocopherols are lipophilic antioxidants that are synthesized exclusively in photosynthetic organisms. In most higher plants, α- and γ-tocopherol are predominant with their ratio being under spatial and temporal control. While α-tocopherol accumulates predominantly in photosynthetic tissue, seeds are rich in γ- tocopherol. To date, little is known about the specific roles of α- and γ-tocopherol in different plant tissues. To study the impact of tocopherol composition and content on stress tolerance, transgenic tobacco (Nicotiana tabacum) plants constitutively silenced for homogentisate phytyltransferase (HPT) and γ-tocopherol methyl transf erase (γ-TMT) activity were created. Silencing of HPT lead to an up to 98% reduction of total tocopherol accumulation compared to wild type. Knockdown of γ-TMT resulted in an up to 95% reduction of α-tocopherol in leaves of the transgenics, which was almost quantitatively compensated for by an increase in γ-tocopherol. The response of HPT and γ-TMT transgenics to salt and sorbitol stress and methyl viologen treatments in comparison to wild type was studied. Each stress condition imposes oxidative stress along with additional challenges like perturbing ion homeostasis, desiccation, or disturbing photochemistry, respectively. Decreased total tocopherol content increased the sensitivity of HPT:RNAi transgenics toward all tested stress conditions, whereas γ-TMT-silenced plants showed an improved performance when challenged with sorbitol or methyl viologen. However, salt tolerance of γ-TMT transgenics was strongly decreased. Membrane damage in γ-TMT transgenic plants was reduced after sorbitol and methyl viologen-mediated stress, as evident by less lipid peroxidation and /or electrolyte leakage. Therefore, our results suggest specific roles for α- and γ-tocopherol in vivo.
DOI:10.1016/j.febslet.2008.10.002URLPMID:18848546 [本文引用: 1]
Tocopherol (vitamin E) is widely recognized as a cellular antioxidant. It is essential for human and animal health, but only synthesized in photosynthetic organisms, where it is localized in chloroplast membranes. While many studies have investigated non-antioxidative effects of tocopherol on phospholipid membranes, nothing is known about its effects on membranes containing chloroplast glycolipids. Here, liposomes resembling plant chloroplast membranes were used to investigate the effects of α-tocopherol on vesicle stability during freezing and on lipid dynamics. α-Tocopherol had a pronounced influence on membrane dynamics and showed strong interactions in its effects on membrane stability during freezing with the cryoprotectant sucrose. α-Tocopherol showed maximal effects at low concentrations (around 2 mol%), close to its contents in chloroplast membranes.
DOI:10.1104/pp.104.054908URLPMID:15665245 [本文引用: 1]
Tocopherol belongs to the Vitamin E class of lipid soluble antioxidants that are essential for human nutrition. In plants, tocopherol is synthesized in plastids where it protects membranes from oxidative degradation by reactive oxygen species. Tocopherol cyclase (VTE1) catalyzes the penultimate step of tocopherol synthesis, and an Arabidopsis (Arabidopsis thaliana) mutant deficient in VTE1 (vte1) is totally devoid of tocopherol. Overexpression of VTE1 resulted in an increase in total tocopherol of at least 7-fold in leaves, and a dramatic shift from -tocopherol to -tocopherol. Expression studies demonstrated that indeed VTE1 is a major limiting factor of tocopherol synthesis in leaves. Tocopherol deficiency in vte1 resulted in the increase in ascorbate and glutathione, whereas accumulation of tocopherol in VTE1 overexpressing plants led to a decrease in ascorbate and glutathione. Deficiency in one antioxidant in vte1, vtc1 (ascorbate deficient), or cad2 (glutathione deficient) led to increased oxidative stress and to the concomitant increase in alternative antioxidants. Double mutants of vte1 were generated with vtc1 and cad2. Whereas growth, chlorophyll content, and photosynthetic quantum yield were very similar to wild type in vte1, vtc1, cad2, or vte1vtc1, they were reduced in vte1cad2, indicating that the simultaneous loss of tocopherol and glutathione results in moderate oxidative stress that affects the stability and the efficiency of the photosynthetic apparatus.
[本文引用: 1]
URL [本文引用: 1]
以合丰25和Bayfield两个大豆品种作试验材料,采用实时荧光定量PCR方法,测定不同生育时期大豆维生素E代谢过程相关酶基因(HPPD、HPT、MPBQ-MT、TC及TMT基因),并分析其表达模式,推测对大豆维生素E代谢过程合成起关键作用的基因。结果表明,五个基因中对大豆维生素E代谢过程合成起关键作用的可能为MPBQ-MT和TC基因。
URL [本文引用: 1]
以合丰25和Bayfield两个大豆品种作试验材料,采用实时荧光定量PCR方法,测定不同生育时期大豆维生素E代谢过程相关酶基因(HPPD、HPT、MPBQ-MT、TC及TMT基因),并分析其表达模式,推测对大豆维生素E代谢过程合成起关键作用的基因。结果表明,五个基因中对大豆维生素E代谢过程合成起关键作用的可能为MPBQ-MT和TC基因。
DOI:10.1007/s10681-013-0948-5URL [本文引用: 1]
Tocopherols have several beneficial effects in plants, and are indispensable micronutrients for humans. Sweet corn is a major source of tocopherols in high concentrations. In this investigation, tocopherol compounds in sweet corn were analyzed by high performance liquid chromatography. To detect quantitative trait loci (QTL) controlling accumulation of tocopherols at the milk stage in sweet corn, a F-2 population consisting of 229 F-2:3 lines was created from the cross between a high-total tocopherols line (A6) and a low-total tocopherols line (A57). A genetic map was constructed using 136 polymorphic molecular markers including one gene-targeted marker based on the tocopherol biosynthesis pathway (HPPD). Eleven putative QTLs for tocopherol content and composition were detected by composite interval mapping and located on Chr. 1, Chr. 2, Chr. 5, Chr. 6 and Chr. 10. Phenotypic variance explained by each QTL ranged from 4.74 to 41.16 %. Eight mapped QTLs were co-localized, suggesting that the same QTL affected the amounts of more than one tocopherol compound. One candidate gene-targeted marker (HPPD) showed co-localization with the major QTL for gamma-tocopherol and total tocopherols. Only one interval (umc1177-bnlg1429) on chromosome one exhibited a QTL for alpha, delta, gamma, and total tocopherols with high LOD and R-2 values. The primary conclusion of this work is that two major QTLs located on Chr. 1 and Chr. 5 can be used for improvement of sweet corn nutrition quality by marker-assisted selection.
DOI:10.1186/1471-2229-12-201URLPMID:23122295 [本文引用: 1]
pAbstract/p pBackground/p pTocopherols, which are vitamin E compounds, play an important role in maintaining human health. Compared with other staple foods, maize grains contain high level of tocopherols./p pResults/p pTwo Fsub2/sub populations (K22/CI7 and K22/Dan340, referred to as POP-1 and POP-2, respectively), which share a common parent (K22), were developed and genotyped using a GoldenGate assay containing 1,536 single nucleotide polymorphism (SNP) markers. An integrated genetic linkage map was constructed using 619 SNP markers, spanning a total of 1649.03 cM of the maize genome with an average interval of 2.67 cM. Seventeen quantitative trait loci (QTLs) for all the traits were detected in the first map and 13 in the second. In these two maps, QTLs for different traits were localized to the same genomic regions and some were co-located with candidate genes in the tocopherol biosynthesis pathway. Single QTL was responsible for 3.03% to 52.75% of the phenotypic variation and the QTLs in sum explained23.4% to 66.52% of the total phenotypic variation. A major QTL (itqc5-1/qd5-1/it) affecting -tocopherol ( T) was identified on chromosome 5 between the PZA03161.1 and PZA02068.1 in the POP-2. The QTL region was narrowed down from 18.7 Mb to 5.4 Mb by estimating the recombination using high-density markers of the QTL region. This allowed the identification of the candidate gene itVTE4/it which encodes -tocopherol methyltransferase, an enzyme that transforms -tocopherol ( T)to T./p pConclusions/p pThese results demonstrate that a few QTLs with major effects and several QTLs with medium to minor effects might contribute to the natural variation of tocopherols in maize grain. The high-density markers will help to fine map and identify the QTLs with major effects even in the preliminary segregating populations. Furthermore, this study provides a simple guide line for the breeders to improve traits that minimize the risk of malnutrition, especially in developing countries./p
DOI:10.1371/journal.pone.0050038URLPMID:23185526 [本文引用: 1]
Tocopherols are important antioxidants in vegetable oils; when present as vitamin E, tocopherols are an essential nutrient for humans and livestock. Rapeseed (Brassica napusL, AACC, 2 n = 38) is one of the most important oil crops and a major source of tocopherols. Although the tocopherol biosynthetic pathway has been well elucidated in the model photosynthetic organismsArabidopsis thalianaandSynechocystissp. PCC6803, knowledge about the genetic basis of tocopherol biosynthesis in seeds of rapeseed is scant. This project was carried out to dissect the genetic basis of seed tocopherol content and composition in rapeseed through quantitative trait loci (QTL) detection, genome-wide association analysis, and homologous gene mapping. We used a segregating Tapidor Ningyou7 doubled haploid (TNDH) population, its reconstructed F2(RC-F2) population, and a panel of 142 rapeseed accessions (association panel). Genetic effects mainly contributed to phenotypic variations in tocopherol content and composition; environmental effects were also identified. Thirty-three unique QTL were detected for tocopherol content and composition in TNDH and RC-F2populations. Of these, seven QTL co-localized with candidate sequences associated with tocopherol biosynthesis throughin silicoand linkage mapping. Several near-isogenic lines carrying introgressions from the parent with higher tocopherol content showed highly increased tocopherol content compared with the recurrent parent. Genome-wide association analysis was performed with 142B. napusaccessions. Sixty-one loci were significantly associated with tocopherol content and composition, 11 of which were localized within the confidence intervals of tocopherol QTL. This joint QTL, candidate gene, and association mapping study sheds light on the genetic basis of seed tocopherol biosynthesis in rapeseed. The sequences presented here may be used for marker-assisted selection of oilseed rape lines with superior tocopherol content and composition.
DOI:10.1371/journal.pone.0133767URLPMID:4514886 [本文引用: 1]
The Genome-Wide Association Studies approach was used to detect Quantitative Trait Loci associated with tocochromanol concentrations using a panel of 1,466 barley accessions. All major tocochromanol types- α-, β-, δ-, γ-tocopherol and tocotrienol- were assayed. We found 13 single nucleotide polymorphisms associated with the concentration of one or more of these tocochromanol forms in barley, seven of which were within 2 cM of sequences homologous to cloned genes associated with tocochromanol production in barley and/or other plants. These associations confirmed a prior report based on bi-parental QTL mapping. This knowledge will aid future efforts to better understand the role of tocochromanols in barley, with specific reference to abiotic stress resistance. It will also be useful in developing barley varieties with higher tocochromanol concentrations, although at current recommended daily consumption amounts, barley would not be an effective sole source of vitamin E. However, it could be an important contributor in the context of whole grains in a balanced diet.
DOI:10.1007/s11032-011-9585-7URL [本文引用: 1]
Abstract, , and genes showed co-localization with QTL for total phytosterol content. is also mapped on linkage group 17 near the QTL of total phytosterol content. Four candidate genes, , , and , and , could be used for alternation of the tocopherol and phytosterol content of sunflower seeds through the development of functional markers.
DOI:10.2135/cropsci2011.08.0406URL [本文引用: 1]
Abstract Tocopherols are natural antioxidants with vitamin E activity. Sunflower seeds contain predominantly alpha-tocopherol (>950 g kg(-1) tocopherols), which is the tocopherol form exhibiting the highest vitamin E activity. The objective of this research was to study the genetic basis of total seed tocopherol content in sunflower (Helianthus annuus L.). Quantitative trait loci (QTL) analysis was conducted in two mapping populations derived from crosses between lines with increased (IAST-413) and reduced (IAST-522) tocopherol content and the conventional sunflower line HA-89. Tocopherol content was measured in the F-2 and the F-3 generations. Linkage maps were constructed using simple sequence repeat and insertion-deletion polymorphism markers. Seven and six QTL determining increased and reduced seed tocopherol content, respectively, were identified. Of these, a major QTL on linkage group (LG) 10 was responsible for more than half the explained phenotypic variation for increased tocopherol content in the IAST-413 x HA-89 population, whereas a major QTL on LG 11 was responsible for more than half the explained phenotypic variation for reduced seed tocopherol content in the IAST-522 x HA-89 population. Three QTLs on LG 2, 4, and 17 were found in both mapping populations at overlapping support intervals. A 2-methyl-6-phytyl-1,4-benzoquinone/2-methyl- 6-solanyl-1,4-benzoquinonone methyltransferase (MT-2) locus was found co-locating with the OIL on LG 4. Quantitative trait loci information from this research will contribute to the development of marker-assisted selection tools for total tocopherol content in sunflower seeds.
DOI:10.1007/s10681-014-1204-3URL [本文引用: 1]
A recombinant inbred line (RIL) population was developed following hybridization between a low glucosinolate B. juncea genotype, NUDH-YJ-04 and a high glucosinolate cultivar, RL-1359. RILs differed for seed and leaf glucosinolates, total tocopherols and oil content. A linkage map of length covering 2346.902cM was constructed. It comprised 198 markers distributed across the 18 linkage groups. The linkage map facilitated analysis of quantitative trait loci (QTL) associated with phytonutrient compounds and the antioxidant molecules. The composite interval mapping helped to identify 21 QTLs on 11 linkage groups with R 2 values between 15–5302% at logarithmic of odd (LOD) scores of 3.1–8.6. For seed aliphatic glucosinolates, most significant QTL, explaining 5302% of the phenotypic variation was located on J9, for glucoiberin (IBE-S). QTLs were also identified for indole glucosinolate (NEO-S) (4402%) on J7 and aromatic glucosinolate (NAS-S) (3802%) on J4. Total leaf glucosinolates (TGLC-L) explaining 15–2102% phenotypic variance were mapped to three different genetic intervals on J6 and J14, and total seed glucosinolates (TGLC-S) explained 1702% of the variance on J18. Tocopherol (TOC) QTL was confined to chromosome no. J6 (2802%) and J12 (1902%) at LOD score of 4.8 and 3.1. QTL for Oil content was tagged on J9 at LOD score of 3.2. Candidate genes underlying SIN-S, NEO-S and NAS-S QTLs, were considered to be GSL-elong, MYB-76 and MYB-28 in A4, A7 and A10 respectively. Despite a lower coverage, this is a first linkage map in this crop based solely on SSR markers and can serve as a basic map.
DOI:10.1270/jsbbs.57.23URL [本文引用: 1]
DOI:10.1111/pbr.2017.136.issue-1URL [本文引用: 2]
DOI:10.1111/pbr.2016.135.issue-2URL [本文引用: 2]
DOI:10.1007/s00122-010-1264-2URLPMID:20069414 [本文引用: 2]
Vitamin E (VE) in soybean seed has value for foods, medicines, cosmetics, and animal husbandry. Selection for higher VE contents in seeds along with agronomic traits was an important goal for many soybean breeders. In order to map the loci controlling the VE content, F5-derived F6recombinant inbred lines (RILs) were advanced through single-seed-descent (SSD) to generate a population including 144 RILs. The population was derived from a cross between ‘OAC Bayfield’, a soybean cultivar with high VE content, and ‘Hefeng 25’, a soybean cultivar with low VE content. A total of 107 polymorphic simple sequence repeat markers were used to construct a genetic linkage map. Seed VE contents were analyzed by high performance liquid chromatography for multiple years and locations (Harbin in 2007 and 2008, Hulan in 2008 and Suihua in 2008). Four QTL associated with α-Toc (on four linkage groups, LGs), eight QTL associated with γ-Toc (on eight LGs), four QTL associated with δ-Toc (on four LGs) and five QTL associated with total VE (on four LGs) were identified. A major QTL was detected by marker Satt376 on linkage group C2 and associated with α-Toc (0.001202>P>020.0001, 5.0%02<R2<0217.0%, 25.102<02α-Toc02<0230.102μg02g611), total VE (P<020.0001, 7.0%02<R2<0210.0%, 118.202<02total VE02<02478.302μg02g611). A second QTL detected by marker Satt286 on LG C2 was associated with γ-Toc (0.000302>P>020.0001, 6.0%02<R2<0213.0%, 141.502<02γ-Toc02<02342.402μg02g611) and total VE (P<020.0001, 2.0%02<R2<029.0%, 353.902<02total VE02<02404.002μg02g611). Another major QTL was detected by marker Satt266 on LG D1b that was associated with α-Toc (0.000202>P>020.0001, 4.0%02<R2<026.0%, 27.702<02α-Toc02<0243.702μg02g611) and γ-Toc (0.003202>P>020.0001, 3.0%02<R2<0210.0%, 69.702<02γ-Toc02<02345.702μg02g611). Since beneficial alleles were all from ‘OAC Bayfield’, it was concluded that these three QTL would have great potential value for marker assisted selection for high VE content.
DOI:10.3724/SP.J.1006.2015.00187URLMagsci [本文引用: 2]
<p>维生素E (VE)具有提高人体免疫力、抗癌、预防心血管疾病等保健作用,从大豆中提取的VE安全性更高。本研究采用高效液相色谱技术(HPLC)检测大豆BIEX群体(Essex×ZDD2315)维生素E的α-生育酚、γ-生育酚和δ-生育酚含量。应用QTLNetwork 2.1软件分别检测到8个和12对控制大豆维生素E及组分含量的加性和互作QTL。α-生育酚含量加性和互作QTL累计贡献值分别为8.68% (2个)和15.57% (4对),γ-生育酚含量加性和互作QTL累计贡献值分别为8.59% (2个)和11.57% (2对),δ-生育酚含量加性和互作QTL累计贡献值分别为5.44% (1个)和17.61% (3对),维生素E总含量的加性和互作QTL累计贡献值分别为11.39% (3个)和9.48% (3对)。未检测到维生素E及组分含量和环境互作的QTL。未定位到的微效QTL累计贡献值为66.16%~75.32%,说明未定位到的微效基因的变异占2/3以上。各性状的遗传构成中,未检测出的微效QTL份额最大,加性QTL和互作QTL贡献相差不大。在育种中应考虑常规方法聚合微效QTL与标记辅助方法聚合主要QTL相结合。</p>
[本文引用: 1]
DOI:10.7685/j.issn.1000-2030.2013.06.001URL [本文引用: 2]
近十几年来,利用双亲分离群体数量性状表型观测值来鉴定数量性状主基因+多基因混合遗传模式的研究时有报道,其结果可指导作物育种实践。然而,随着计算机技术的进步,本课题组研制的软件操作性、算法和功能模块等方面都存在一定缺陷。在Microsoft Visual Studio 2010操作平台下,利用C++语言研制了Windows界面友好的植物数量性状分离分析(segregation analysis,SEA)软件包,其中采用了线性算法包Clapack V3.1.1解线性方程组并估计一阶遗传参数,更精确地计算适合性检验的概率,增加了结果输出模块和计算分离群体植株或家系的主基因型后验概率。新软件包计算更稳定,结果更全面,界面更友好。
DOI:10.1007/s00122-004-1602-3URLPMID:14991109 [本文引用: 1]
A total of 391 simple sequence repeat (SSR) markers designed from genomic DNA libraries, 24 derived from existing GenBank genes or ESTs, and five derived from bacterial artificial chromosome (BAC) end sequences were developed. In contrast to SSRs derived from EST sequences, those derived from genomic libraries were a superior source of polymorphic markers, given that the mean number of tandem repeats in the former was significantly less than that of the latter ( P<0.01). The 420 newly developed SSRs were mapped in one or more of five soybean mapping populations: "Minsoy" x "Noir 1", "Minsoy" x "Archer", "Archer" x "Noir 1", "Clark" x "Harosoy", and A81-356022 x PI468916. The JoinMap software package was used to combine the five maps into an integrated genetic map spanning 2,523.6 cM of Kosambi map distance across 20 linkage groups that contained 1,849 markers, including 1,015 SSRs, 709 RFLPs, 73 RAPDs, 24 classical traits, six AFLPs, ten isozymes, and 12 others. The number of new SSR markers added to each linkage group ranged from 12 to 29. In the integrated map, the ratio of SSR marker number to linkage group map distance did not differ among 18 of the 20 linkage groups; however, the SSRs were not uniformly spaced over a linkage group, clusters of SSRs with very limited recombination were frequently present. These clusters of SSRs may be indicative of gene-rich regions of soybean, as has been suggested by a number of recent studies, indicating the significant association of genes and SSRs. Development of SSR markers from map-referenced BAC clones was a very effective means of targeting markers to marker-scarce positions in the genome.
[D].
[本文引用: 2]
[D].
[本文引用: 2]
[D].
[本文引用: 1]
[D].
[本文引用: 1]
[本文引用: 1]
DOI:10.3724/SP.J.1006.2010.00191URLMagsci [本文引用: 1]
<p><span >主基因加多基因混合遗传模型分离分析方法是基于数量性状表型数据的统计遗传分析方法,该方法适于育种工作者利用杂种分离世代的数据对育种性状的遗传组成做出初步判断,制订相应的育种策略,也可用以校验</span><span lang="EN-US" >QTL</span><span >定位所揭示的性状遗传组成。重组自交家系群体</span><span lang="EN-US" >(RIL)</span><span >是一种永久性群体,可以进行有重复的比较试验,适合于环境影响较大的复杂性状的遗传研究。本研究以</span><span lang="EN-US" >RIL</span><span >群体为对象,将遗传模型拓展到</span><span lang="EN-US" >4</span><span >对主基因,建立相应的分离分析方法。新构建的模型共包括</span><span lang="EN-US" >4</span><span >对主基因和</span><span lang="EN-US" >4</span><span >对主基因加多基因两类共</span><span lang="EN-US" >15</span><span >个遗传模型,通过极大似然法和</span><span lang="EN-US" >IECM</span><span >算法估算各种模型的分布参数,由</span><span lang="EN-US" >AIC</span><span >值和一组适合性测验选取最佳遗传模型,再由最小二乘法估计模型的遗传参数。通过模拟实验对所建立的模型进行验证,模拟群体中一阶遗传参数的估计值与设定值之间有很好一致性。以大豆科丰</span><span lang="EN-US" >1</span><span >号</span><span lang="EN-US" >×</span><span >南农</span><span lang="EN-US" >1138-2</span><span >构成的</span><span lang="EN-US" >RIL</span><span >群体及其亲本棕榈酸含量的遗传</span><span lang="EN-US" >(I-1</span><span >模型,即</span><span lang="EN-US" >4</span><span >对加性</span><span lang="EN-US" >-</span><span >上位性主基因和加性</span><span lang="EN-US" >-</span><span >上位性多基因遗传模型</span><span lang="EN-US" >)</span><span >为例,说明该方法的应用效果。</span></p>
DOI:10.1007/BF00220855URLPMID:24169664 [本文引用: 1]
The interval mapping method is widely used for the genetic mapping of quantitative trait loci (QTLs), though true resolution of quantitative variation into QTLs is hampered with this method. Separation of QTLs is troublesome, because single-QTL is models are fitted. Further, genotype-by-environment interaction, which is of great importance in many quantitative traits, can only be approached by separately analyzing the data collected in multiple environments. Here, we demonstrate for the first time a novel analytic approach (MQM mapping) that accommodates both the mapping of multiple QTLs and genotype-by-environment interaction. MQM mapping is compared to interval mapping in the mapping of QTLs for flowering time in Arabidopsis thaliana under various photoperiod and vernalization conditions.
DOI:10.1007/s10681-006-9085-8URL [本文引用: 1]
It has been theoretically proposed that multiple linked quantitative trait loci (QTLs) play a role in the accumulation of hidden variation within and between populations. In this study, the genetic bases for grain characteristics were examined by comparing two accessions representing the two rice subspecies by QTL analysis. Grain dimensions are known to be quantitative traits and to be diagnostic between these two subspecies. To enhance the power to detect QTL with small effects, after transferring a segment of chromosome 6 from an Indica type into a Japonica type of rice by repeated backcrosses, the introgressed segment was dissected by making recombinant inbred lines (RILs) which were expected to have different sizes of the introgressed segment in the same genetic background. The resulting RILs showed distinct transgression of the grain characteristics examined. Multiple QTLs controlling each of the length and breadth of seeds were detected on the introgressed segment, and showed positive and negative additive effects as well as epistatic interactions. The present study confirmed that transgressive segregation resulted from a breakdown of linkage and that the detection of QTLs was highly dependent upon the genetic effects of the neighboring QTLs, indicating the need for caution in interpreting QTL effects.
DOI:10.1007/s10681-014-1209-yURL [本文引用: 1]
The total growth duration (TGD), the days from emergence to maturation of the soybean, can be divided into vegetative period (VP) and reproductive period (RP). The ratio of RP to VP (R/V) is an index to investigate evolutionary trends and understand the relationships between different growth periods. To increase our understanding of growth period traits with emphasis on R/V, four generation segregated populations, including P 1 , P 2 , F 1 , F 2 , and F 2:3 were constructed. Joint segregation analysis revealed that R/V was controlled through major genes plus polygenes. QTL mapping result showed that a total of 22 QTLs were associated with growth period traits. One major effect QTL for R/V, qR/V-1, was mapped on the C2 linkage group, and accounted for 46.90 and 33.72 % of the phenotypic variance under spring and summer sowing season conditions, respectively. The parent bands of the major gene were ubiquitous in the soybean germplasms. The chromosome adjacent interval of qR/V-1 was proved to be associated with VP, TGD, RP, and photo-thermal sensitivity of R/V. However, the QTL showed different effects on different growth period traits. In addition, the 2 minor-effect QTLs for R/V could not be detected repeatedly for others growth period traits. These results indicated that the R/V were controlled through differential pathways with other growth period traits, although one major effect QTL was mapped to the same region.
[D].
[本文引用: 1]
DOI:10.3724/SP.J.1006.2015.01372URLMagsci [本文引用: 2]
以栽培大豆晋豆23为母本, 以山西农家品种大豆灰布支黑豆为父本杂交衍生的447个RIL作为供试群体构建遗传图谱, 利用高效液相色谱法定性、定量测定样品中的异黄酮及其组分含量。采用主基因+多基因混合遗传分离分析法和WinQTLCart 2.5复合区间作图法, 对大豆异黄酮及其组分含量进行混合遗传分析和QTL定位。结果表明, 大豆苷、黄豆苷元、染料木素、染料木苷、大豆苷元和异黄酮总含量分别受4、4、2、3、2和2对主基因控制, 并有多基因修饰。检测到44个与大豆异黄酮及其组分含量相关的QTL, 与大豆苷、染料木素、黄豆苷元、大豆苷元、染料木苷和异黄酮总含量相关的QTL分别有10、9、4、7、8和6个。连续2年分别检测到与大豆苷、染料木苷、黄豆苷元和异黄酮关联, 分别位于标记区间satt430~satt359、satt038~satt570、satt197~sat_128和satt249~satt285的稳定表达QTL, 可尝试用于分子标记辅助育种。
DOI:10.1007/s10681-014-1209-yURL [本文引用: 1]
The total growth duration (TGD), the days from emergence to maturation of the soybean, can be divided into vegetative period (VP) and reproductive period (RP). The ratio of RP to VP (R/V) is an index to investigate evolutionary trends and understand the relationships between different growth periods. To increase our understanding of growth period traits with emphasis on R/V, four generation segregated populations, including P 1 , P 2 , F 1 , F 2 , and F 2:3 were constructed. Joint segregation analysis revealed that R/V was controlled through major genes plus polygenes. QTL mapping result showed that a total of 22 QTLs were associated with growth period traits. One major effect QTL for R/V, qR/V-1, was mapped on the C2 linkage group, and accounted for 46.90 and 33.72 % of the phenotypic variance under spring and summer sowing season conditions, respectively. The parent bands of the major gene were ubiquitous in the soybean germplasms. The chromosome adjacent interval of qR/V-1 was proved to be associated with VP, TGD, RP, and photo-thermal sensitivity of R/V. However, the QTL showed different effects on different growth period traits. In addition, the 2 minor-effect QTLs for R/V could not be detected repeatedly for others growth period traits. These results indicated that the R/V were controlled through differential pathways with other growth period traits, although one major effect QTL was mapped to the same region.
URL [本文引用: 1]
Sowing time of soybean (Glycine max [L.] Merr.) often coincides with the early onset of rainy season. Germinating seedsencounter a transient to prolonged period of water-logging that causes anoxia (absence of oxygen) and hypoxia (insufficientoxygen) resulting in poor germination. This reduces crop stability and yield. One of the factors responsible for flood tolerance isactivity of alcohol dehydrogenase (ADH) during flood. The effect of ADH activity during flooding and difference in floodtolerance level were investigated using two soybean cultivars, Peking and Tamahomare, and their F9 recombinant inbred lines(RILs). Tamahomare showed higher ADH activity than Peking. There was a great variation in ADH activity among the RILs.QTL analysis detected five QTLs for ADH activity (qAas1-5) on five linkage groups, LG_A2, D1a, F, K and L. The QTL qAas4was close to a QTL for shoot damage and conductivity of germinating seeds after flooding treatment.
DOI:10.3864/j.issn.0578-1752.2017.18.002URL [本文引用: 1]
【目的】主根长和侧根数是重要的根系性状。通过不同氮磷钾处理,发掘大豆苗期主根长和侧根数的基因资源、了解其遗传机制,定位其主效QTL,分析QTL间的上位性和环境互作效应,对生产提供理论指导。【方法】用以栽培大豆晋豆23为母本、山西农家品种灰布支黑豆(ZDD02315)为父本所衍生的447个RIL作为供试群体,取亲本及447个家系各30粒种子,用灭菌纸包裹后,2015年和2016年分别放置于CK(模拟种植不施肥)、NPK(模拟大田正常配施氮磷钾肥)和1.5NPK(模拟高肥田块)3种生长环境下进行水培试验,每组试验设置3次重复,环境温度20—28℃,幼苗长到V2期,对幼苗期相关根部性状数据进行测量。分别采用Win QTLCart 2.5和QTLNETwork 2.1 2种遗传模型检测QTL,分析QTL间的上位性和环境互作效应。【结果】基于复合区间作图(CIM)共检测到24个影响主根长和侧根数的QTL,分布于第2、3、5、6、7、8、9、10、11、12、13、14、16、17共14条染色体中,单个QTL的贡献率介于8.52%—43.62%,QTL主要表现为加性效应。基于混合线性模型(MCIM)检测到影响主根长和侧根数的QTL各1个,2个QTL均表现出加性效应和环境互作效应。另有2对主根长和2对侧根数均检测出加性×加性上位性互作QTL,主根长和侧根数各有1对表现出主效QTL与非主效QTL加性×加性上位性互作,各有1对表现出非主效QTL与非主效QTL加性×加性上位性互作,2对主根长互作QTL分别解释了1.53%和1.95%的表型变异率,2对侧根数互作QTL分别解释了2.47%和1.13%的表型变异率。2个QTL能在2种分析方法中同时检测到,9个QTL能在3种环境下同时检测到。第6染色体在2015年NPK、1.5NPK和2016年1.5NPK 3个环境下均检测到主根长QTL,第5染色体在2015年NPK和1.5NPK、2016年CK 3个环境下、第17染色体在2015年CK和NPK、2016年NPK 3个环境下均检测到侧根数QTL。【结论】苗期大豆主根长17
DOI:10.1016/S1671-2927(08)60243-6URL [本文引用: 1]
Trichomes (plant hairs) are present on nearly all land plants and are known to play important roles in plant protection, specifically against insect herbivory, drought, and UV radiation. The identification of quantitative trait loci (QTL) associated with trichome density should help to interpret the molecular genetic mechanism of soybean trichome density. 184 recombinant inbred lines (RILs), derived from a cross between soybean cultivars Kefeng 1 and Nannong 1138-2 were used as segregating population for evaluation of TDU (trichome density on the upper surface of leaf blade) and TDD (trichome density on the downer surface of leaf blade). A total of 15 QTL were detected on molecular linkage groups (MLG) A2, D1a, D1b, E and H by composite interval mapping (CIM) and among all the QTL, qtuA2-1, qtuD1a-1, qtuD1b-2, qtuH-2 qtuE-1, qtdD1b-2, and qtdH-2 were affirmed by multiple interval mapping (MIM). The contribution of phenotypic variance of qtuH-2 was 31.81 and 29.4% by CIM and MIM, respectively, suggesting it might be major gene Ps loci. Only 10 pairs of main QTL interactions for TDU were detected, explained a range of 0.2-5.1% of phenotypic variations for each pair for a total of 22.8%. The QTL on MLG D1b affecting trichome density were mapped near to Rsc-7 conditioning resistance to SMV (soybean mosaic virus). This study showed that the genetic mechanism of trichome density was the mixed major gene and polygene inheritance, and also suggested that the causal nature between trichome density and other agronomic traits.
DOI:10.3864/j.issn.0578-1752.2014.09.003URLMagsci [本文引用: 1]
【目的】研究幼苗期大豆根系性状的遗传规律并进行QTL定位,推进大豆品种选育进程。【方法】以栽培大豆晋豆23为母本,半野生大豆灰布支黑豆(ZDD2315)为父本及其所衍生的447个RIL作为供试群体,取亲本及447个家系各30粒种子,用灭菌纸包裹后分别于2013年5月27日、6月28日放置在清水培育,每组试验设置3次重复,环境温度20—28℃,幼苗长到V2期,分别于2013年6月8日、7月8日对幼苗期相关根部性状数据进行测量。采用主基因+多基因混合遗传分离分析法和复合区间作图法,对大豆幼苗期根系性状进行遗传分析和QTL定位。定位所用图谱全长2 047.6 cM,包括27个连锁群,232个标记位点。【结果】主根长、侧根数、根重、根体积和茎叶重各形状之间均呈现极显著正相关;下胚轴长和下胚轴重表现极显著正相关,与茎叶重表现出显著正相关。主根长受3对等效主基因控制,侧根数受2对重叠作用主基因控制,根重和根体积受4对等效主基因控制,下胚轴长受4对加性主基因控制,下胚轴重受4对加性-加性×加性上位性主基因控制,以上性状均没有检测到多基因效应。茎叶重受加性多基因控制,没有检测到主基因效应。共检测到24个与主根长、侧根数、根重、根体积、茎叶重、下胚轴长和下胚轴重相关的QTL,分别位于A1、A2、B1、B2、C2、D1b、F_1、G、H_1、H_2、I、K_2、L、M、N和O连锁群上。其中,主根长共检测到5个QTL,分布在B1、L、N、O连锁群上。解释的表型变异范围为7.05%—13.18%。侧根数共检测到4个QTL,分布在A1、D1b、I、L连锁群上。解释的表型变异范围为8.21%—16.43%。根重共检测到3个QTL,分布在F_1、G、N连锁群上。解释的表型变异范围为7.55%—10.85%。根体积,5月27日试验结果,共检测到3个QTL,分布在K_2和M连锁群上。解释的表型变异范围为8.44%-12.39%。6月28日试验结果,没有定位出主效QTL。茎叶重共检测到5个QTL,分布在A1、A2和N连锁群上。解释的表型变异范围为11.43%-38.91%。其中,qSW1-a2-1、qSW2-a2-1和qSW2-a2-1均定位在A2染色体上。下胚轴长,5月27日试验结果,共检测到1个QTL,分布在H_1连锁群上,表型贡献率为7.86%。6月28日试验结果,没有定位出主效QTL。下胚轴重共检测到3个QTL,分布在B2、C2、H_2连锁群上。解释的表型变异范围为7.70%—12.48%。【结论】幼苗期根系性状的遗传机制较复杂,茎叶重受多基因控制,其余性状主要受主基因控制。抗逆品种根系从幼苗期根系生长就表现出发根早、生长快、主根长、侧根多等特点,在实际育种过程中,需要对根系各性状间的关系进行综合考虑,确保根系整体健壮发达,协调统一。
[D].
[本文引用: 1]
[D].
[本文引用: 1]
[本文引用: 1]
[本文引用: 1]
DOI:10.1007/BF00220989URLPMID:24173777 [本文引用: 1]
Construction of a detailed RFLP linkage map of B. rapa (syn. campestris ) made it possible, for the first time, to study individual genes controlling quantitative traits in this species. Ninety-five F 2 individuals from a cross of Chinese cabbage cv ichihili by Spring broccoli were analyzed for segregation at 220 RFLP loci and for variation in leaf, stem, and flowering characteristics. The number, location, and magnitude of genes underlying 28 traits were determined by using an interval mapping method. Zero to five putative quantitative trait loci (QTL) were detected for each of the traits examined. There were unequal gene effects on the expression of many traits, and the inheritance patterns of traits ranged from those controlled by a single major gene plus minor genes to those controlled by polygenes with small and similar effects. The effect of marker locus density on detection of QTL was analyzed, and the results showed that the number of QTL detected did not change when the number of marker loci used for QTL mapping was decreased from 220 to 126; however, a further reduction from 126 to 56 caused more than 15% loss of the total QTL detected. The detection of putative minor QTL by removing the masking effects of major QTL was explored.
DOI:10.1007/BF00220902URLPMID:24169788 [本文引用: 1]
‘Lemont’ and ‘Teqing’ are both semidwarf rice varieties that differ in heading date by only 6 days. However, when ‘Lemont’ and ‘Teqing’ are crossed there is transgressive segregation for both heading date (HD) and plant height (PH). By testing 2418 F 4 lines with 113 well-distributed RFLP markers, we identified and mapped chromosomal regions that were largely responsible for this transgressive segregation. QHd3a , a QTL from ‘Lemont’ that gives 8 days earlier heading, was identified on chromosome 3 approximately 3 cM from the marker RG348. Another QTL with a large effect, QHd8a , which gives 7 days earlier heading, was identified on chromosome 8 of ‘Teqing’ between RG20 and RG1034. Along with a QTL, QHd9a with a phenotypic effect of 3.5 days, these genomic regions collectively explain 76.5% of the observed phenotypic variance in heading date. Four QTLs which altered plant height from 4 to 7 cm were also mapped; these collectively explain 48.8% of the observed phenotypic variation in plant height. None of the QTLs for plant height mapped to chromosome 1 , the location of the semidwarf gene sd-1 . All three of the HD loci mapped to approximately the same genomic locations as PH QTLs, and in all cases, there was a reduction in height of approximately 1 cm for every day of earlier heading. The correspondence between the HD and some of the PH loci suggests that genes at these chromosome locations may have pleiotropic effects on both HD and PH. The observed heterosis in the F 1 plants for HD can be largely explained by the dominance for earliness of the identified HD loci and distribution of earlier heading alleles in the parents. However, overdominance observed at one of the PH QTL may, at least in part, be responsible for the observed heterosis in PH.
