
福建农林大学农业部福建甘蔗生物学与遗传育种重点实验室, 福建福州 350002
Identification of Sugarcane Varieties by AFLP and SSR Markers and Its Application
WANGZhou-Tao, YOUQian, GAOShi-Wu, WANGChun-Feng, LIZhu, MAJing-Jing, QUEYou-Xiong, XULi-Ping, LUOJun通讯作者:
收稿日期:2017-10-13
接受日期:2018-03-15
网络出版日期:2018-03-16
版权声明:2018作物学报编辑部作物学报编辑部
基金资助:
展开
摘要
关键词:
Abstract
Keywords:
-->0
PDF (3046KB)元数据多维度评价相关文章收藏文章
本文引用格式导出EndNoteRisBibtex收藏本文-->
受人口增长、物质消费水平提高、气候变化、城市化侵占耕地和老龄化导致劳动力短缺等因素促使, 粮食安全与能源安全早已成为人类面临的严峻挑战[1,2,3,4]。甘蔗是最主要的糖料作物和重要的能源作物, 其需求量不断增长[5,6], 在耕地面积限制的情况下, 需要不断育成新的优良品种来提高甘蔗的产量。从水稻、玉米等粮食作物的生产发展过程可以看出, 粮食产量的每次重大提升都得益于关键种质资源的发掘与利用, 种质资源及其高效利用十分重要[7,8]。甘蔗种质资源十分丰富, 在我国云南国家甘蔗种质资源圃中, 保育近2200份, 美国和印度的世界甘蔗种质收集中心保育的分别为近6000和4000多份。如此庞大的种质资源群体蕴含着巨大的基因潜质, 对其鉴定和评价是育种工作的重要基础。形态标记、细胞标记、生化标记和分子标记等是近些年被广泛使用的植物种质资源鉴定方法, 在甘蔗种质鉴定工作中也发挥着重要作用[9,10,11,12]。如Praveen等[13]在2015年报道了SGDB (Sugarcane Germplasm Database), 该数据库便是根据形态特征、农艺性状、品质性状、抗病虫性等信息鉴定划分甘蔗种质资源的, 这些信息很大程度上提高了育种亲本的选择效率。在我国, 自“九五”以来, 育种工作者也主要应用形态学、细胞学或生理生化等方法完成了大量甘蔗种质资源鉴定评价工作, 获得一批优良特异的甘蔗种质[14]。这些鉴定工作对育种工作具有重要的实用价值, 不过这些方法也均存在较多的局限性, 如易受环境和植物生育时期影响、标记的位点有限等, 其鉴定结果的准确性和稳定性较差。DNA分子标记技术从基因水平寻找生物个体间的遗传差异, 不受环境等因素的干扰, 并且标记位点丰富[15]。目前, DNA分子标记技术已经成为鉴定和评价农作物种质资源最主要的方法, 得到广泛应用[16,17,18]。
在甘蔗种质资源的分子标记技术鉴定和评价等工作中, 目前主要涉及的标记技术有AFLP (Amplified Fragment Length Polymorphism)[19]、SSR (Simple Sequence Repeat)[20]、SNP (Single Nucleotide Polymorphisms) [21]和ISSR (Inter-simple Sequence Repeat)[22]等。AFLP和SSR标记相对于其他DNA分子标记, 具备检测成本低、多态性位点丰富、在植物基因组中分布广泛且均匀等优点, 已被众多****深入讨论[23,24,25,26]。利用AFLP标记和SSR标记开展甘蔗种质资源遗传多样性的研究已有诸多报道, 如刘新龙等[27]运用AFLP标记技术研究了41份甘蔗近缘属植物滇蔗茅(Erianthus rockii)无性系, 发现滇蔗茅的遗传多样性与地理分布有着明显的关系; Lima等[28]将基于AFLP标记获取的79个甘蔗品种的遗传相似系数对比甘蔗品种的系谱关系时发现, 前者能比后者提供更多的甘蔗品种间血缘的信息。这与先前Barret等[29]比较AFLP标记法和系谱法评价小麦遗传多样性效用的研究结论一致; Singh等[30]对印度亚热带地区割手密和商业种的SSR标记鉴定显示, 割手密的变异水平远高于商业种, 而这些高变异的割手密材料并未有效应用于甘蔗育种中, 该结果为目前甘蔗育种亲本的开拓提供了方向; 齐永文等[31]运用SSR标记技术对中美甘蔗品种的遗传距离评估表明, 中美种质间遗传基础差异较明显, 我们不仅要注重美国种质的引进, 也要重视中国种质的发掘利用, 协同拓宽中国甘蔗品种的遗传基础。另外, 利用分子标记技术构建甘蔗指纹身份证或指纹图谱也有诸多报道, 如刘新龙等[32]通过筛选多态性丰富、品种聚类区分率高、易统计的引物组成核心引物, 构建了云南自育的27个品种与10个蔗区主栽品种的分子身份证, 为品种间的区分提供了精准快捷的依据; 姚春雪等[33]利用SSR标记研究崖城89-9和昆明蔗茅及其67份杂交后代(F1、BC1和BC2)材料, 构建各份材料的DNA指纹图谱, 为追踪蔗茅野生种血缘在不同世代中的传递情况及其在甘蔗育种中的进一步利用提供科学依据。
农作物品种区域试验是新育成品系正式成为推广品种的关键环节[34]。目前, 新品种推广主要依据AMMI模型或GGE-Biplot分析生成的新品种丰产性、稳定性和适应性等指标[35,36], 还未见从分子水平为甘蔗新品种推广布局提供建议的报道。本研究主要应用9个AFLP和15个SSR标记分析来自三轮国家甘蔗品种区域试验(以下简称“区试”)的参试品种的遗传多样性并绘制SSR标记指纹图谱, 同时从分子水平的分析结果出发讨论甘蔗新品种的推广布局策略。本研究可以让我们了解38个新育成甘蔗栽培品种(系)的共祖度(遗传背景相似度), 从而间接评估目前甘蔗育种所用亲本的遗传基础; 区试品种(系)也是种质资源的重要部分, 今后可作为育种亲本的选用对象, 研究结果对今后育种的亲本选择有一定的参考价值; 同时, 本研究尝试从实际的品种推广工作出发, 从分子标记鉴定结果的角度, 讨论新品种(系)可能的推广策略, 为区试品种的推广工作提供参考; 通过品种(系)指纹图谱的绘制, 为品种身份鉴别及品种权保护等工作提供可靠依据。
1 材料与方法
1.1 实验材料及其DNA提取
38个供试甘蔗新品种(系)(附表1)由福建农林大学农业部福建甘蔗生物学与遗传育种重点实验室提供。其中10个来自第10轮区试, 10个来自第11轮区试, 17个来自第12轮区试, 以及参照品种ROC22 (全国推广面积最大的品种), 均属于栽培种。在福建农林大学大学城试验基地种植所有材料, 在甘蔗分蘖期选取每个品种(系) 3片无病虫健康完全展开叶片, 用保鲜袋包装后带回实验室, 液氮速冻后置-80℃低温冰箱保存, 用于提取DNA样品。使用天根DNA提取试剂盒提取甘蔗基因组DNA, Synergy HT多功能酶标仪检测DNA质量, 选择1.8<A260/ A280<2.0的DNA样品作为最终的实验样品, 最后将每份DNA样品统一稀释为50 ng μL-1。Supplementary table 1
附表1
附表138份来自3轮国家甘蔗品种区域试验的品种(系)
Supplementary table 1Thirty-eight sugarcane varieties (lines) from three rounds of national variety regional testings
| 编号 No. | 品种(系) Variety (line) | 亲本组合 Parent combination | 选育单位 Breeding institution | 参试轮次 Round | 系列 Series |
|---|---|---|---|---|---|
| 1 | 福农07-2020 Funong 07-2020 | 粤糖91-976 × LC 85-384 Yuetang 91-976 × LC 85-384 | 福建农林大学甘蔗综合研究所 SIFAFU | 10 | FN |
| 2 | 福农07-3206 Funong 07-3206 | 90-1211 × 77-797 | 福建农林大学甘蔗综合研究所 SIFAFU | 10 | FN |
| 3 | 福农40 Funong 40 | 福农93-3406 × 粤糖91-976 Funong 93-3406 × Yuetang 91-976 | 福建农林大学甘蔗综合研究所 SIFAFU | 10 | FN |
| 4 | 福农09-2201 Funong 09-2201 | ROC 22 × 桂糖00-122 ROC 22 × Guitang 00-122 | 福建农林大学甘蔗综合研究所 SIFAFU | 11 | FN |
| 5 | 福农09-7111 Funong 09-7111 | 桂糖96-44 × ROC 11 Guitang 96-44 × ROC 11 | 福建农林大学甘蔗综合研究所 SIFAFU | 11 | FN |
| 6 | 福农09-12206 Funong 09-12206 | CP 65-357 × 崖城97-40 CP 65-357 × Yacheng 97-40 | 福建农林大学甘蔗综合研究所 SIFAFU | 12 | FN |
| 7 | 福农11-2105 Funong 11-2105 | 川蔗89-103 × 云瑞05-770 Chuanzhe 89-103 × Yunrui 05-770 | 福建农林大学甘蔗综合研究所 SIFAFU | 12 | FN |
| 8 | 福农09-4095 Funong 09-4095 | 粤糖93-159 × 云蔗91-790 Yuetang 93-159 × Yunzhe 91-790 | 福建农林大学甘蔗综合研究所 SIFAFU | 12 | FN |
| 9 | 闽糖06-1405 Mintang 06-1405 | 闽糖92-649 × ROC 10 Mintang 92-649 × ROC 10 | 福建省农业科学院甘蔗研究所 SRIFAAS | 11 | MT |
| 10 | 闽糖07-2005 Mintang 07-2005 | 崖城73-512 × ROC 22 Yacheng 73-512 × ROC 22 | 福建省农业科学院甘蔗研究所 SRIFAAS | 12 | MT |
| 11 | 闽糖09-104 Mintang 09-104 | 桂糖90-420 × ROC 10 Guitang 90-420 × ROC 10 | 福建省农业科学院甘蔗研究所 SRIFAAS | 12 | MT |
| 编号 No. | 品种(系) Variety (line) | 亲本组合 Parent combination | 选育单位 Breeding institution | 参试轮次 Round | 系列 Series |
| 12 | 闽糖02-205 Mintang 02-205 | 崖城90-3 × ROC 10 Yacheng 90-3 × ROC 10 | 福建省农业科学院甘蔗研究所 SRIFAAS | 10 | MT |
| 13 | 云蔗08-2060 Yunzhe 08-2060 | 粤糖93-159 × Q 121 Yuetang 93-159 × Q 121 | 云南省农业科学院甘蔗研究所 SRIYAAS | 10 | YZ |
| 14 | 云蔗08-1095 Yunzhe 08-1095 | CP 84 -1198 × 科5 CP 84-1198 × Ke5 | 云南省农业科学院甘蔗研究所 SRIYAAS | 11 | YZ |
| 15 | 云蔗09-1028 Yunzhe 09-1028 | 云瑞15-178 × 闽糖86-2121 Yunrui 15-178 × Mintang 86-2121 | 云南省农业科学院甘蔗研究所 SRIYAAS | 12 | YZ |
| 16 | 云蔗09-1601 Yunzhe 09-1601 | CP 94-1100 × 川糖89-103 CP 94-1100 × Chuantang 89-103 | 云南省农业科学院甘蔗研究所 SRIYAAS | 12 | YZ |
| 17 | 云瑞09-315 Yunrui 09-315 | CL 69-52 × 云瑞05-285 CL 69-52 × Yunrui 05-285 | 云南省农业科学院甘蔗研究所 SRIYAAS | 12 | YZ |
| 18 | 云瑞07-1433 Yunrui 07-1433 | 云瑞99-155 × L 75-20 Yunrui 99-155 × L75-20 | 云南省农业科学院甘蔗研究所 SRIYAAS | 10 | YZ |
| 19 | 云瑞10-187 Yunrui 10-187 | ROC 20 × 云瑞05-282 ROC20 × Yunrui 05-282 | 云南省农业科学院甘蔗研究所 SRIYAAS | 12 | YZ |
| 20 | 云瑞10-701 Yunrui 10-701 | 云瑞08-18 × 云瑞05-704 Yunrui 08-18 × Yunrui 05-704 | 云南省农业科学院甘蔗研究所 SRIYAAS | 12 | YZ |
| 21 | 德蔗07-36 Dezhe 07-36 | 桂糖92-66 × CP 67-412 Guitang 92-66 × CP 67-412 | 云南德宏州甘蔗科学研究所 SRIDY | 11 | DZ |
| 22 | 德蔗09-78 Dezhe 09-78 | 桂糖94-119 × ROC 10 Guitang 94-119 × ROC 10 | 云南德宏州甘蔗科学研究所 SRIDY | 12 | DZ |
| 23 | 德蔗09-84 Dezhe 09-84 | 桂糖94-119 × ROC 10 Guitang 94-119 × ROC 10 | 云南德宏州甘蔗科学研究所 SRIDY | 12 | DZ |
| 24 | 粤甘43 Yuegan 43 | 粤糖93-213 × 粤糖93-159 Yuetang 93-213 × Yuetang 93-159 | 广州甘蔗糖业研究所 GSIRI | 10 | YG |
| 25 | 粤甘46 Yuegan 46 | 粤糖00-236 × 桂糖96-211 Yuetang 00-236 × Guitang 96-211 | 广州甘蔗糖业研究所 GSIRI | 10 | YG |
| 26 | 粤甘47 Yuegan 47 | 粤农73-204 × ROC 22 Yuenong 73-204 × ROC 22 | 广州甘蔗糖业研究所 GSIRI | 11 | YG |
| 27 | 粤甘48 Yuegan 48 | HOCP 95-988 × 粤糖97-76 HOCP 95-988 × Yuetang 97-76 | 广州甘蔗糖业研究所 GSIRI | 12 | YG |
| 28 | 粤甘50 Yuegan 50 | 粤糖96-86 × 粤糖99-66 Yuetang 96-86 × Yuetang 99-66 | 广州甘蔗糖业研究所 GSIRI | 12 | YG |
| 29 | 海蔗22 Haizhe 22 | 粤糖93-159 × ROC 22 Yuetang 93-159 × ROC 22 | 广州甘蔗糖业研究所 GSIRI | 11 | YG |
| 30 | 桂糖06-2081 Guitang 06-2081 | 桂糖00-122 × 崖城97-47 Guitang 00-122 × Yacheng 97-47 | 广西农业科学院甘蔗研究所 SRIGAAS | 11 | GT |
| 31 | 桂糖08-1180 Guitang 08-1180 | ROC 26 × ROC 22 | 广西农业科学院甘蔗研究所 SRIGAAS | 11 | GT |
| 32 | 桂糖06-1492 Guitang 06-1492 | CP 72-1210 × 湛蔗92-126 CP 72-1210 × Zhanzhe 92-126 | 广西农业科学院甘蔗研究所 SRIGAAS | 12 | GT |
| 33 | 桂糖09-12 Guitang 09-12 | ROC 24 × 粤农79-780 ROC 24 × Yuenong 79-780 | 广西农业科学院甘蔗研究所 SRIGAAS | 12 | GT |
| 编号 No. | 品种(系) Variety (line) | 亲本组合 Parent combination | 选育单位 Breeding institution | 参试轮次 Round | 系列 Series |
| 34 | 柳城07-500 Liucheng 07-500 | 粤糖92-1287 × CP 72-1210 Yuetang 92-1287 × CP 72-1210 | 柳城县甘蔗研究中心 SRCLC | 10 | LC |
| 35 | 柳城07-150 Liucheng 07-150 | 粤糖85-177 × ROC 22 Yuetang 85-177 × ROC 22 | 柳城县甘蔗研究中心 SRCLC | 11 | LC |
| 36 | 柳城07-506 Liucheng 07-506 | 粤糖85-177 × ROC 22 Yuetang 85-177 × ROC 22 | 柳城县甘蔗研究中心 SRCLC | 12 | LC |
| 37 | 赣蔗07-538 Ganzhe 07-538 | ROC 10 × CP 57-614 | 江西省甘蔗研究所 SRIJP | 10 | GZ |
| 38 | ROC 22 | 台湾糖业研究所 SPRIT | 参照 | ROC |
新窗口打开
1.2 AFLP标记
对Vos等[19]建立的AFLP标记方法进行部分调整优化, 以9对多态性良好、扩增条带清晰的AFLP引物组合(表1)扫描38个甘蔗新品种(系)基因组。甘蔗基因组DNA经内切酶Mse I和EcoR I在37℃水浴酶切10 h; 酶切产物在37℃水浴连接特定的Mse I和EcoR I接头, 反应时间为2 h, 将反应产物稀释10倍后作为预扩增模板; 使用含有1个选择性核苷酸的Mse I和EcoR I的引物在反应条件为94℃ 30 s, 56℃ 60 s, 72℃ 60 s, 20个循环下预扩增, 将预扩增产物稀释20倍作为选择性扩增的模板; 以含3个选择性核苷酸的Mse I和EcoR I引物进行选择性扩增, PCR条件分为3个阶段, 第1阶段94℃ 30 s, 65℃ 30 s, 72℃ 60 s, 1个循环; 第2阶段94℃ 30 s, 65℃ 30 s, 72℃ 60 s, 12个循环, 从第2个循环开始退火温度每循环降低0.7℃; 第3阶段以94℃ 30 s, 56℃ 30 s, 72℃ 60 s, 23个循环结束。Table 1
表1
表19对AFLP标记引物组合
Table 1Nine pairs of primers used in AFLP mark
| 组合 Combination | 引物名 Primer name | 序列 Sequence (5°-3°) | 引物名 Primer name | 序列 Sequence (5°-3°) |
|---|---|---|---|---|
| 1 | E-ACA | GACTGCGTACCAATTC ACA | M-CTG | GATGAGTCCTGAGTAA CTG |
| 2 | E-ACT | GACTGCGTACCAATTC ACT | M-CAA | GATGAGTCCTGAGTAA CAA |
| 3 | E-AAC | GACTGCGTACCAATTC AAC | M-CAC | GATGAGTCCTGAGTAA CAC |
| 4 | E-ACT | GACTGCGTACCAATTC ACT | M-CAG | GATGAGTCCTGAGTAA CAG |
| 5 | E-ACA | GACTGCGTACCAATTC ACA | M-CAC | GATGAGTCCTGAGTAA CTC |
| 6 | E-ACT | GACTGCGTACCAATTC ACT | M-CAC | GATGAGTCCTGAGTAA CAC |
| 7 | E-AAC | GACTGCGTACCAATTC AAC | M-CAG | GATGAGTCCTGAGTAA CAG |
| 8 | E-ACT | GACTGCGTACCAATTC ACT | M-CTC | GATGAGTCCTGAGTAA CTC |
| 9 | E-ACC | GACTGCGTACCAATTC ACC | M-CAG | GATGAGTCCTGAGTAA CAG |
新窗口打开
1.3 SSR标记
表2中, 15对SSR引物由两个主要途径获取, 一是根据潘永保等[37,38,39]从国际微卫星标记联盟设计的221对引物筛选出的21对应用于甘蔗研究的引物中, 选择7对(编号1~7)多态性好的引物; 二是根据闫学兵等[40]从National Center for Biotechnology Information网站下载的EST序列设计筛选的26对EST-SSR引物中选择8对(编号8~15)多态性好的引物。将15对SSR引物和38个甘蔗DNA样品送到北京阅微基因有限公司进行毛细管电泳分型。Table 2
表2
表215对SSR标记引物
Table 2Fifteen pairs of primers used in SSR mark
| 引物名 Primer name | 重复单元 Repeating unit | 引物序列(正/反) Primer sequence (Positive/Reverse) (5°-3°) | 退火温度 Tm (°C) |
|---|---|---|---|
| SMC334BS | (TG)36 | CAATTCTGACCGTGCAAAGAT/CGATGAGCTTGATTGCGAATG | 60 |
| SMC336BS | (TG)23(AG)19 | ATTCTAGTGCCAATCCATCTCA/CATGCCAACTTCCAAACAGAC | 62 |
| SMC286CS | (TG)43 | TCAAATGGGACCTTATTGGAG/TCCCTCGATCTCCGTTGTT | 58 |
| SMC569CS | (TG)37 | GCGATGGTTCCTATGCAACTT/TTCGTGGCTGAGATTCACACTA | 62 |
| SMC119CG | (TTG)12 | TTCATCTCTAGCCTACCCCAA/AGCAGCCATTTACCCAGGA | 58 |
| SMC31CUQ | (TC)10(AC)22 | CATGCCAACTTCCAATACAGACT/AGTGCCAATCCATCTCAGAGA | 62 |
| mSSCIR43 | (GT)3(AT)2(GT)29 | ATTCAACGATTTTCACGAG/AACCTAGCAATTTACAAGAG | 52 |
| SEP17 | (CCT)9 | ACCCTGCTGGTCTCCTCC/ACGTTCGACGTCGTGTAGTG | 60 |
| SEP23 | (AGA)9 | GTGTTCAGGCAGATGGTCCT/GTCGATGGCACCGATTTATT | 60 |
| SEP59 | (CGG)9 | TTCCATTTACTCCTCCGTGC/CTCCCCCTCCTCGTACTTGT | 60 |
| SEP6 | (GCA)5(ACA)13 | CAGCCCATTAACCAAGCAAT/GAAGCAGCTGTTGCTCACTG | 60 |
| SEP70 | (GCG)8 | AACTCACCCAACAAAGCGAC/AGACGAAGAGCTCGTGGATG | 60 |
| SEP8 | (CT)17 | CTTGCTTCCCCTTTACTCCC/GAGGCGCCTTACTGTTCTTG | 60 |
| SEP84 | (GGT)9 | AGAGACCGTAATGGTGACCG/ACCACCACCACCACCATACT | 60 |
| SEP89 | (CGT)10 | AGCTCTGATTTTTGGGGGTT/GGAAGACAGTGGACGAGGTC | 60 |
新窗口打开
1.4 数据统计与分析
使用Microsoft Excel 2016软件将变性聚丙烯酰胺电泳结果和毛细管电泳结果都统计成0/1矩阵格式。SSR标记的电泳结果以吸收峰的形式表示, 参考Cordeiro等[41]的指纹数据统计方式, 在某位点出现吸收峰记“1”, 未出现记“0”, 统计范围为100~350 bp; 对AFLP标记使用“参考线法”记带, 即在电泳图上从下到上逐步移动参考线, 当遇到条带立即停止, 所停止位置记为一个位点, 在该位点参考线上出现条带的品种即在其相应的统计单元格记“1”, 未出现记“0”, 统计范围为1~500 bp。在数据分析与可视化上, 使用NTSYS 2.10e和PowerMarker V3.25软件计算各品种间的遗传相似性系数[42]、多态性位点数以及引物多态信息含量(Polymorphism Information Content, PIC)[43], 并使用基于Nei氏遗传距离的非加权类平均法(UPGMA)绘制聚类图。
遗传相似系数$\text{GS}=1-\left[ \frac{2{{M}_{xy}}}{\left( {{M}_{x}}+{{M}_{y}} \right)} \right]$
多态信息含量$\text{PIC}=1-\sum\limits_{i=1}^{n}{P_{i}^{2}-\sum\limits_{i=1}^{n-1}{\sum\limits_{j=i+1}^{n}{2P_{i}^{2}P_{j}^{2}}}}$
式中, Mxy表示2个品种共有的条带数, Mx+My表示两个品种一共被扩增出来的条带数; Pi和Pj分别为第i个和第j个等位基因频率, n为等位基因数。使用R3.3.3绘制遗传相似性系数分布箱线图和甘蔗品种(系)的指纹图谱。
2 结果与分析
2.1 AFLP标记与SSR标记电泳结果
从图1可以清晰地辨识1~500 bp (统计区)内出现的变异位点。用AFLP标记的9对引物组合共扩增出348个位点, 多态性位点有248个, 多态性比率为71.26%。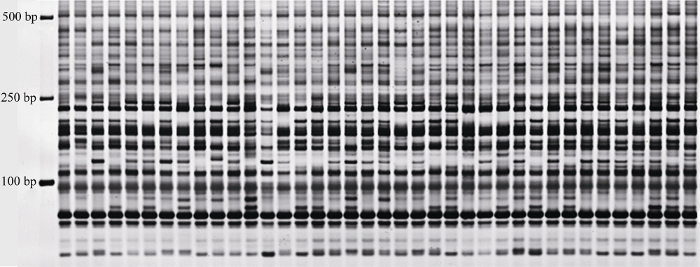 显示原图|下载原图ZIP|生成PPT
图1AFLP标记聚丙烯酰胺电泳图
-->Fig. 1Polyacrylamide gel electrophoresis profile of AFLP markers
-->
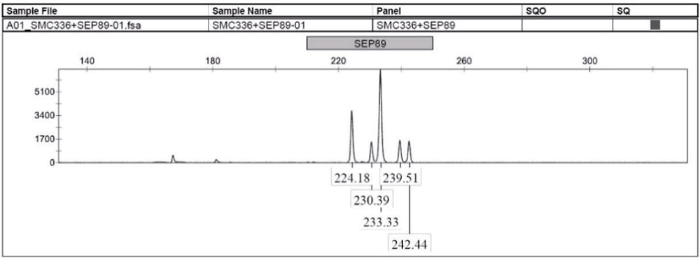
图2中每个吸收峰代表1个扩增片段, 共5个扩增片段, 吸收峰所在X轴位置显示了扩增片段的长度, 具体数值标明在吸收峰的底部; Y轴代表扩增片段的浓度, 由吸收峰的高度决定。用SSR标记的15对引物共扩增出180个位点, 多态性位点有176个, 多态性比率达到92.78%。
 显示原图|下载原图ZIP|生成PPT
图2SSR标记毛细管电泳图
-->Fig. 2Capillary electrophoresis profile of SSR markers
-->
2.2 引物的有效性
由表3可知, SSR标记中每对引物的多态性条带的比率都处于很高水平, 12对引物达到100%, 其中多态性条带的比率最低的引物SMC334BS也达到83.33%, 表明15对SSR的引物的多态性良好, 鉴别品种间遗传差异的能力较高。另外, 各引物的平均PIC值达到0.920, 引物SEP84的PIC值最低, 为0.695。组合2的扩增片段多态性较差, 低于60%。PIC值平均水平达到0.971, 且各个引物间的PIC值相差很小。在总体统计基础上, 可看出SSR标记和AFLP标记的效用都达到较高水平, 彼此相当。Table 3
表3
表324对引物的高效性评价
Table 3Effectiveness evaluation of 24 pairs of primers
| 标记类别 Marker sort | 引物名 Primer name | 多态性位点数 Number of polymorphic loci | 总扩增位点数 Total site number | 多态比例 Polymorphic percentage (%) | 引物多态信息含量 PIC | ||||||
|---|---|---|---|---|---|---|---|---|---|---|---|
| SSR标记 SSR marker (100-350 bp) | SEP6 | 9 | 9 | 100 | 0.964 | ||||||
| SPE8 | 13 | 14 | 92.86 | 0.959 | |||||||
| SEP17 | 10 | 10 | 100 | 0.961 | |||||||
| SEP23 | 22 | 22 | 100 | 0.979 | |||||||
| SEP59 | 10 | 11 | 90.91 | 0.920 | |||||||
| SEP70 | 8 | 8 | 100 | 0.895 | |||||||
| SEP84 | 5 | 5 | 100 | 0.695 | |||||||
| SEP89 | 12 | 12 | 100 | 0.896 | |||||||
| SMC334BS | 10 | 12 | 83.33 | 0.927 | |||||||
| SMC336BS | 12 | 12 | 100 | 0.967 | |||||||
| SMC286CS | 20 | 20 | 100 | 0.961 | |||||||
| SMC569CS | 9 | 9 | 100 | 0.779 | |||||||
| SMC119CG | 13 | 13 | 100 | 0.961 | |||||||
| SMC31CUQ | 11 | 11 | 100 | 0.967 | |||||||
| mSSCIR43 | 12 | 12 | 100 | 0.973 | |||||||
| 总数/平均数Total/average | 176 | 180 | 97.78 | ||||||||
| 标记类别 Marker sort | 引物名 Primer name | 多态性位点数 Number of polymorphic loci | 总扩增位点数 Total site number | 多态比例 Polymorphic percentage (%) | 引物多态信息含量 PIC | ||||||
| AFLP标记 AFLP marker (1-500 bp) | E-ACA/M-CTG | 37 | 58 | 63.79 | 0.974 | ||||||
| E-ACT/M-CAA | 24 | 42 | 57.14 | 0.968 | |||||||
| E-AAC/M-CAC | 26 | 36 | 72.22 | 0.968 | |||||||
| E-ACT/M-CAG | 24 | 32 | 75.00 | 0.971 | |||||||
| E-ACA/M-CAG | 22 | 27 | 81.48 | 0.968 | |||||||
| E-ACT/M-CAC | 19 | 25 | 76.00 | 0.972 | |||||||
| E-AAC/M-CAC | 29 | 37 | 78.38 | 0.972 | |||||||
| E-ACT/M-CTC | 36 | 51 | 70.59 | 0.974 | |||||||
| E-ACC/M-CAG | 31 | 40 | 77.50 | 0.974 | |||||||
| 总数/平均数Total/average | 248 | 348 | 71.26 | 0.971 |
新窗口打开
2.3 遗传相似性系数的分布特征
从图3可以看出, 着色部分为箱体, 箱体的上边框称为第三四分位数(Third Quartile), 下边框称为第一四分位数(First Quartile), 箱体内部靠近中部的线为中位数线(Median), 整个箱体部分表示数据的主要集中趋势。图中总体(ALL) 38个甘蔗新品种(系)和各系列(FN、MT、YZ、YG和GT)甘蔗品种(系)内部的遗传相似性系数都向0.725~0.770集中。虚线轴的最顶部为上限值(upper extreme), 最底部为下限值(lower extreme), 上下限值之间的范围就代表整个相似性系数的分布范围[44,45], 6组数据的分布范围都在0.680~0.830之间。FN系列品种(系)相似度水平的集中趋势和YZ系列接近, 并且与38个甘蔗品种总体的相似水平集中趋势接近; 另外, GT系列品种(系)的相似系数集中区域低于其他几个系列的品种, YG系列品种(系)的相似系数集中区域高于其他几个系列的品种。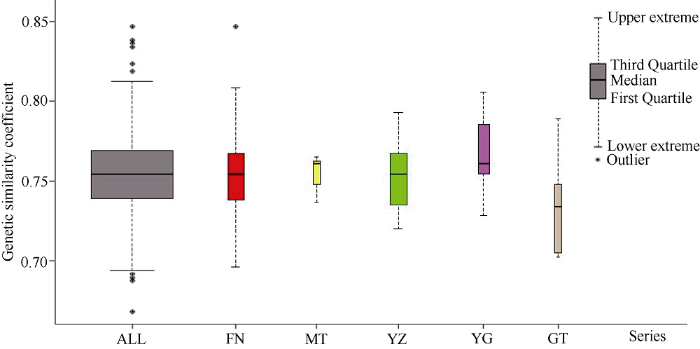 显示原图|下载原图ZIP|生成PPT
图3遗传相似性系数的分布特征
缩写同附
-->Fig. 3Distribution characteristics of genetic similarity coefficients
The abbreviations are the same as those given in Supplementary table 1.
-->
ALL系列和FN系列品种(系)的箱线图上下边缘外存在异常值(黑色实心小圆点, Outlier), 异常值代表该组品种内部存在遗传距离很近(异常值处于上限值上部)或很远(异常值处于下限值下部)的极端情况(相对于本组数据而言), 这是表现相似系数分布特征的重要方面。在总体品种中(ALL), 因为品种数量多, 出现高相似组合或低相似组合的可能性更大, 也因此比FN系列出现了更多异常值。箱线图在比较不同群体的遗传相似系数的分布范围时具有较强的简明性, 同时各个群体的遗传相似系数的分布特征也能得到很好的体现(图3)。
2.4 聚类分析
从图4可以看出, 38个甘蔗新品种(系)遗传基础较为狭窄, 彼此间遗传距离接近。在遗传相似性系数为0.732处可将38个甘蔗品种(系)分为A、B两个群体。群体A包含4 (福农09-2201)和32 (桂糖06-1492)两个品种(系), 这2个品种(系)最先被划分出来, 说明它们在整个群体中异质性较强; 群体B包含剩下的36个品种(系)。在相似性系数为0.770处分割群体B, 可获得一个小的子群体a, 该子群体含有参照品种38 (ROC22)、2 (福农07-3206)、3 (福农40)、29 (海蔗22)、33 (桂糖09-12)和35 (柳城07-150), 说明这些品种(系)与参照品种ROC22同质性较高。从附表1可知, 29 (海蔗22)和35 (柳城07-150)的亲本中包含品种ROC22, 但2 (福农07-3206)、3 (福农40)和33 (桂糖09-12)的亲本不包括品种ROC22。以不同的遗传相似系数水平划分38个甘蔗品种的群体可以得到不同的子群体或不同的划分类型, 在不同群体间或类型间选择亲本搭配的组合, 其血缘关系的同质性相对于同一群体内或同一划分类型内的品种(系)组合会相对减小, 因此更有可能选育出优良品种。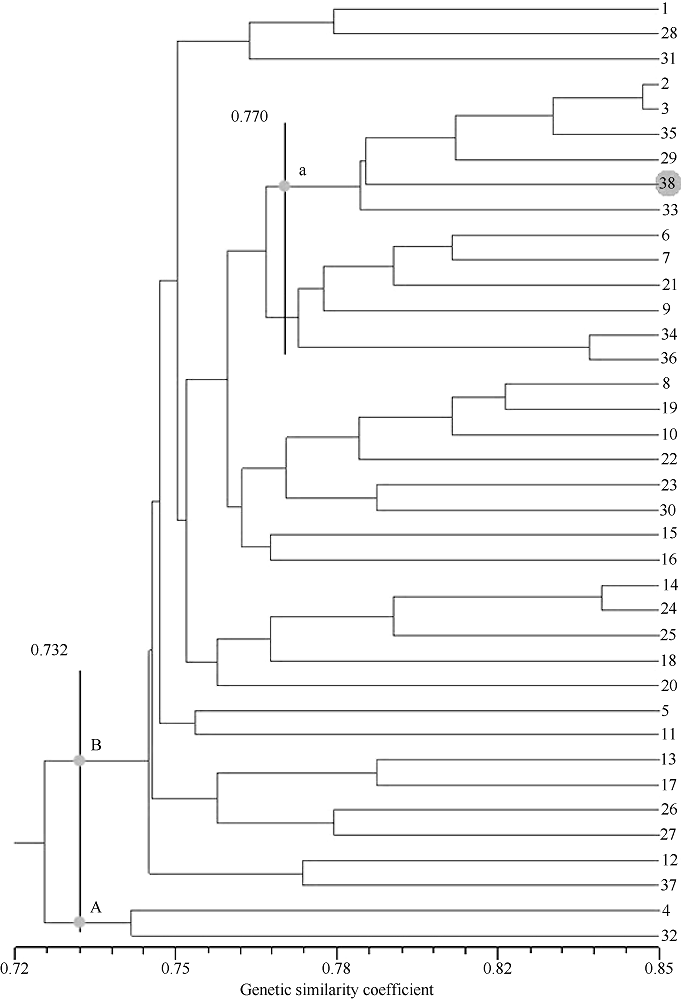 显示原图|下载原图ZIP|生成PPT
图438份甘蔗品种(系)的聚类分析
-->Fig. 4UPGMA dendrogram of 38 new sugarcane varieties (lines) based on genetic similarity
-->
2.5 主成分分析
从图5可以看出, MT系列、YZ系列和DZ系列甘蔗品种集中水平较高, 它们主要分布在主成分C中, 说明福建省农业科学院甘蔗研究所、云南省农业科学院甘蔗研究所、云南德宏州甘蔗科学研究所选用的甘蔗育种亲本具有较高的同质性, 也可能是育种者选择亲本时具有一定的偏好性。FN系列品种(系)分布在主成分A、C和D中, YG系列分布在B和C中, GT系列分布在B、C和D中, 它们的分散范围较广, 说明福建农林大学甘蔗综合研究所、广州甘蔗糖业研究所和广西农业科学院甘蔗研究所选用亲本的遗传范围较广, 育种者亲本的选择偏好性不强。总体来看, 各系列品种(系)的主成分区域都彼此靠近, 有些具有部分重合甚至完全重合, 可推测各个育种单位所选用的育种亲本的遗传背景接近, 不存在明显的差异性或者选择的偏向性。我们也可以依据图5进行亲本的选择, 依据分布距离与血缘同质性的关系, 图中距离较远(或分布于不同主成分中)的品种(系)都将是较为理想的亲本组合。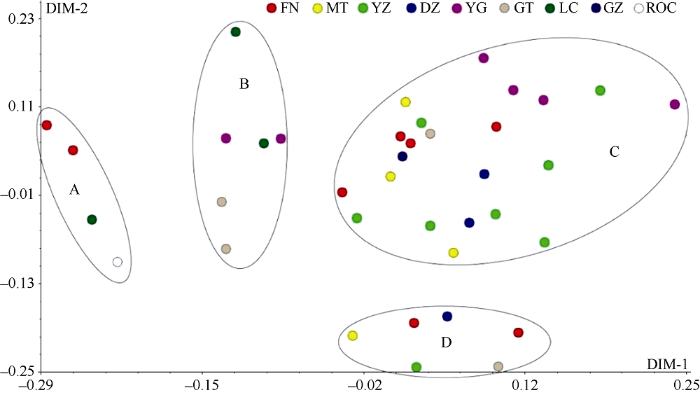 显示原图|下载原图ZIP|生成PPT
图538个甘蔗新品种(系)二维主成分分析
缩写同附
-->Fig. 5Principal component analysis of 38 new sugarcane varieties (lines)
The abbreviations are the same as those given in Supplementary table 1.
-->
2.6 甘蔗品种(系)指纹图谱绘制
从图6可以看出, 该图谱的指纹分布均匀, 并且品种(系)间都具有较为明显的差异, 说明构建图谱的位点选择恰当, 图谱的区分力度强。 显示原图|下载原图ZIP|生成PPT
图638份甘蔗品种(系)的指纹图谱
Y轴方向的左边代表高特异性的扩增位点名(共60个位点, 位点名的前半部分是引物名, 后半部分是扩增片段长度, 全部选自SSR标记的扩增位点), X轴顶部代表各品种(系); 黑色或深灰色(方便相邻2个品种间的区分)的长方格子代表某品种(系)在该位点处有条带, 白色表示没有。
-->Fig. 6Fingerprints of 38 new sugarcane varieties (lines)
On the left of the Y-axis direction, 60 names of amplification loci with high specificity were listed (Those loci came from the SSR mark. The first half of the locus name is the primer name, and another half corresponds to the length of the amplified fragment). The serial numbers of the varieties (lines) were enumerated on the top of the X-axis direction. Each black or gray rectangular (distinguishes between adjacent varieties) represents an amplification band, and the white indicates no amplification band.
-->
3 讨论
利用分子标记技术鉴定种质资源遗传多样性, 首先需要考虑标记方法和引物的选择问题。Creste等[46]对AFLP、SSR和TRAP鉴定的82个甘蔗品种遗传系数分布结果比较发现, 3种标记鉴定的遗传系数分布特征不同, 它们各有自己的正态分布区域, SSR标记对整体品种亲缘关系的鉴定效率最高, 而AFLP标记更擅长于亲缘关系相近甘蔗品种的鉴别, 这告诉我们分子标记的选择需要从研究目的考虑, 每种标记方法有其自身的特点和优势。Mohamed等[47]通过对比SSR、SRAP和CAPS-SNP标记对柑橘品种多样性的鉴定结果, 也指出不同的标记各有优缺点, 并提出不同标记的结合使用对柑橘品种多样性的研究更为客观。位点信息量是影响分子标记技术鉴定结果稳定性最主要的因素, 其次是引物数量。对引物位点信息量和数量的评价可以预估分析结果的准确性[48], 所用引物的多态信息含量高、数量足, 得到的品种指纹信息更加丰富, 由此深入探讨的结果才更加可信。本研究的38个甘蔗新品种(系)的遗传背景接近, 将AFLP标记和SSR标记结合使用, 在保证足够的引物数量的同时, 也可以结合两种标记优势, 减少单分子标记鉴定的误差。另外, 15对SSR和9对AFLP引物组合的位点信息量高, 由此得到的甘蔗品种DNA指纹数据为后续的分析提供了可靠基础。本研究首次使用箱线图分析各个品种(系)间的遗传相似性系数, 根据其分布特征判断和比较38个甘蔗新品种(系)以及各个系列甘蔗品种(系)的遗传基础。另外, 我们所拥有的种质资源群体越大, 越有可能找到极高或极低遗传差异的不同品种(系)组合, 这一点体现在箱线图的箱体宽度与异常值数量的关系上。38个甘蔗新品种(系)间相似度集中在0.725~ 0.780的水平, 说明第10、第11和第12轮甘蔗区试品种(系)遗传背景相似度都较高, 亲本的共祖度较高, 这也一定程度解释了为什么近些年来难有特别优异的新品种出现。在甘蔗生产中品种的单一化问题日渐严重, ROC系列品种在中国的种植面积超过80%, 种植时间已有20余年, 种质退化和减产等问题日益突出, 急需新的优良品种更新换代[49]。
亲本选择是育种的主要步骤, 亲本高效鉴定是杂交育种的基础工作, 对亲本的选择具有重要的指导作用[50,51]。育种中选择具有一定的遗传差异的种质资源作亲本, 可以提高杂种一代基因型的杂合性。对作物种质资源的遗传距离评估有利于鉴定和组合最佳亲本, 以产生遗传变异最大的子代群体和促进不同种质资源的优良基因渗透到新选育品系中, 达到获取理想杂种优势的目的[51,52]。前人研究表明, 亲本的遗传距离与F1的杂种优势呈正相关, 据此可以预先评估新育品系的杂种优势[53]。本研究的聚类分析中, 4 (福农09-2201)和32 (桂糖06-1492)最先被划分出来, 说明它们与剩下的36个品种(系)存在较大遗传差异, 在群体中的异质性最强, 育种工作中可作为重点选用材料。
新品种通过审定(鉴定、认定或登记)后如何推广布局, 丰产性、稳定性和地区适应性是首先考虑的几个因素, 这些因素可由GGE-biplot与AMMI模型分析[5,34,36,49]; 其次, 根据基因丰富度对自然环境变化适应能力的关系原理, 考虑新品种的遗传背景因素。遗传背景过于相似的品种搭配推广, 对丰富群体的遗传多样性贡献有限, 不利于品种的多系布局[54], 而遗传差异大的品种在同一地区推广, 可以增加作物群体的基因范围, 增强其抗病抗逆等潜力。即推广与某地区甘蔗主栽品种遗传差异较大的优良甘蔗新品种, 不仅可以提高该地区甘蔗产量, 也可以在一定程度上增加该地区甘蔗群体的基因丰富度、增强甘蔗抵抗不良环境的能力和控制病虫害流行等[55]。合理分布和推广这些优异新品种, 能使甘蔗生产效益和生产安全性得到显著提高。在评估新品种的推广潜力时, 我们应该考虑新育成品种与现有的广受种植户认可的推广品种的遗传相似度, 这种相似度越大, 新品种在适应性、高产高糖性上越可能与现有优良品种接近, 也越容易受到种植户的接受而增加推广的机会。在本研究中, 2 (福农07-3206)、3 (福农40)、29 (海蔗22)、33 (桂糖09-12)和35 (柳城07-150)的遗传背景跟ROC22接近, 与ROC22聚到非常小的子群中的品种(系), 大多含有ROC22的血缘, 遗传了ROC22的广适应性特性, 产量品质与ROC22相当或优于ROC22, 具有被大面积推广的潜质。关于新品种推广或布局的建议和讨论, 主要是从遗传多样性的角度出发, 在实际的推广中还需要结合区域试验结果、抗病性表现和遗传系谱图等信息综合考虑。在2 (福农07-3206)、3 (福农40)、29 (海蔗22)、33 (桂糖09-12)、35 (柳城07-150)等几个品种(系)中, 2 (福农07-3206)、3 (福农40)和33 (桂糖09-12)的亲本不包括ROC22, 但是它们在亲缘关系上比10 (闽糖07-2005)、26 (粤甘47)、36 (柳城07-506)等亲本组合中包含ROC22的品种(系)更接近ROC22, 其原因可能是甘蔗育种中所使用的亲本之间具有较强的血缘同质性, 具体还要结合系谱图进一步分析。
在品种权保护、种质资源管理、种苗销售和新品种试验等工作中都需要品种(系)真实性的鉴定, 甘蔗品种(系)指纹图谱的绘制在规范品种和种质资源管理、规范甘蔗种苗市场和保护品种权益上都有十分重要的作用[32]。
4 结论
将SSR和AFLP标记技术结合使用, 在获取丰富的甘蔗品种(系)指纹信息的同时, 互补了两种标记的优点。基于指纹信息利用箱线图研究各品种(系)间遗传相似性系数分布特征, 可清晰地展现出整个研究群体遗传基础的范围, 并可从中判断是否存在亲缘关系很远或很近的品种(系)组合。4 (福农09-2201)和32 (桂糖06-1492)等异质性较强的品种可作为重点利用的育种材料; 根据参照品种ROC22在聚类图中的位置, 可判定与其聚集到越小的群体中的品种(系)有较大可能拥有与其相似的田间优良性状(高产、稳产、高糖、抗病等), 从而更容易受到种植户的认可而具有更大的推广潜力。选择与参照品种异质性较强的品种与ROC22同时推广, 可一定程度上扩大甘蔗种植品种的多样性, 增强实际生产中甘蔗群体抵抗不良环境或病虫害等能力。本文在研究甘蔗遗传多样性的基础上讨论种质资源遗传基础的判定方法、种质资源的划分与利用方法、新品种的推广策略以及品种指纹图谱的构建与应用, 能给甘蔗育种等相关科研人员提供参考和借鉴。The authors have declared that no competing interests exist.
作者已声明无竞争性利益关系。
参考文献 原文顺序
文献年度倒序
文中引用次数倒序
被引期刊影响因子
| [1] | . No Abstract. |
| [2] | . |
| [3] | . [Article in Italian] |
| [4] | . Abstract This study investigates how energy structure and energy security in China will change in the future under climate mitigation policy scenarios using Representative Concentration Pathways in a computable general equilibrium model. The findings suggest that to reduce greenhouse gas emissions, China needs to shift its energy structure from fossil fuel dominance to renewables and nuclear. The lower the allowable emissions, the larger the shifts required. Among fossil fuels, coal use particularly must significantly decrease. Such structural shifts will improve energy self-sufficiency, thus enhancing energy security. Under the policy scenarios, energy-source diversity as measured by the Herfindahl Index improves until 2050, after which diversity declines because of high dependence on a specific energy source (nuclear and biomass). Overall, however, it is revealed that energy security improves along with progress in climate mitigation. These improvements will also contribute to the economy by reducing energy procurement risks. |
| [5] | . Knowing yield potential and yield stability of cultivars is of significance in guiding breeding and rationalising regional distribution of cultivars. In the present study, a heritability-adjusted genotype main effect genotype65×65environment (HA-GGE) biplot program was used to analyze the cane and yields of 44 newly released cultivars at eight pilot test sites. The cane and yields of nine cultivars were higher than those of the control cultivar ROC22. From the perspective of cane yield, cultivars FN 40 and YZ 06-407 were well adapted to a wider range of conditions and produced relatively high cane yields in several pilot sites. From the perspective of yield, cultivars LC 03-1137, FN 38, FN 41, MT 01-77 and LC 05-136 were well adapted to a wide range of conditions and produced relatively high yields. Based on these results, three high yielding and widely adapted cultivars, namely, FN 39, LC 05-136, and YZ 05-51 were recommended for production in three major Chinese planting areas. The results will provide a theoretical basis for recommending the effective use and rational regional distribution of cultivars in China. |
| [6] | . In-depth information on sugarcane germplasm is the basis for its conservation and utilization. Data on sugarcane molecular markers are limited for the Chinese sugarcane germplasm collections. In the present study, 20 start codon targeted (SCoT) marker primers were designed to assess the genetic diversity among 107 sugarcane accessions within a local sugarcane germplasm collection. These primers amplified 176 DNA fragments, of which 163 were polymorphic (92.85%). Polymorphic information content (PIC) values ranged from 0.783 to 0.907 with a mean of 0.861. Unweighted pair group method of arithmetic averages (UPGMA) cluster analysis of the SCoT marker data divided the 107 sugarcane accessions into six clusters at 0.674 genetic similarity coefficient level. Relatively abundant genetic diversity was observed among ROC22, ROC16, and ROC10, which occupied about 80% of the total sugarcane acreage in China, indicating their potential breeding value on Mainland China. Principal component analysis (PCA) partitioned the 107 sugarcane accessions into two major groups, the Domestic Group and the Foreign Introduction Group. Each group was further divided based on institutions, where the sugarcane accessions were originally developed. The knowledge of genetic diversity among the local sugarcane germplasm provided foundation data for managing sugarcane germplasm, including construction of a core collection and regional variety distribution and subrogation. |
| [7] | . . |
| [8] | . |
| [9] | . A survey of qualitative genetic variation at 3 morphological trait loci, 17 isozyme loci and a putative isozyme locus (amylase) was made for 105 lentil ( Lens culinaris Medikus) germplasm accessions from Chile, Greece and Turkey. New alleles were found for Lap-1, Me-2, Pgm-c, Pgm-p and 6-Pgd-c . The average proportion of polymorphic loci per population was 0.19, with a range of 0 to 0.42 over populations. Germplasm from Chile was equally variable to that from Greece and Turkey on the basis of individual loci and in a multilocus sense, despite its post-Columbus introduction to the New World. Evidence was found from associations between allelic states at different loci of a complex multilocus structure of lentil populations. A single multilocus genotype represented 10.2% of all plants sampled. The rate of outcrossing varied from 2.2% and 2.9% in Turkish and Greek landraces to 6.6% among Chilean populations. Using the survey data, a random sampling strategy for core collection formation was compared with two stratified sampling methods. The advantage of stratified sampling over random sampling was only significant at P =0.28. |
| [10] | . Ginger (Zingiber officinale Roscoe) is an economically important plant, valued all over the world. The existing variation among 16 promising cultivars as observed through differential rhizome yield (181.9 to 477.3 g) was proved to have a genetic basis using different genetic markers such as karyotype, 4C nuclear DNA content and random amplified polymorphic DNA (RAPD). The karyotypic analysis revealed a differential distribution of A, B, C, D and E type of chromosomes among different cultivars as represented by different karyotype formulas. A significant variation of 4C DNA content was recorded in ginger at an intraspecific level with values ranging from 17.1 to 24.3 pg. RAPD analysis revealed a differential polymorphism of DNA showing a number of polymorphic bands ranging from 26 to 70 among 16 cultivars. The RAPD primers OPC02, OPA02, OPD20 and OPN06 showing strong resolving power were able to distinguish all 16 cultivars. The extent of genetic diversity among these cultivars was computed through parameters of gene diversity, sum of allele numbers per locus and Shannon's information indices. Cluster analysis, Nei's genetic similarity and genetic distances, distribution of cultivars into special distance classes and principal coordinate analysis and the analysis of molecular variance suggested a conspicuous genetic diversity among different cultivars studied. The genetic variation thus detected among promising cultivars of ginger has significance for ginger improvement programs. |
| [11] | . |
| [12] | . The pomegranate (L.) is a species belonging to the family . Pomegranate has high economic, nutritional, medicinal and ornamental value and has been cultivated more than two thousand years up to now and has developed quickly in recent years in our country. With the rapid development of molecular biology, based on DNA level, biomarkers have been widely applied. Therefore, first of all, some types of molecular markers which have been widely applied such as RFLP, RAPD, AFLP, SSR and ISSR markers, their principle and characteristics and their application in pomegranate are reviewed, and the existing problems are analyzed. Besides further deep-going and systematic research on the above aspects, it is suggested that in the future more attention should be paid to the application of molecular markers to pomegranate research in such aspects as molecular linkage map, marker-assisted selection breeding, germplasm valuation and identification, etc., which provide a scientific basis for the conservation of pomegranate germplasm resources, identification of genetic relationship and selective breeding of elite cultivars. |
| [13] | . Collection, conservation, characterization, maintenance and utilization of plant genetic resources are essential components of crop improvement programs. Sugarcane Germplasm Database was developed for 45 descriptors on 131 germplasm accessions using MySQL 5.6 server, Dreamweaver web design tool, JAVA programming language and Apache Tomcat server to rationalize storage, retrieve, update, query and report data for multiuser environment. The information included data on 27 distinct, uniform and stable descriptors as described in PPV & FRA, India, 18 agronomic and quality descriptors and pictures in JPEG format on the most distinctive features. The database will be useful to sugarcane breeders to identify the accessions and in selecting parents for targeted traits in hybridization and crop improvement in sugarcane. |
| [14] | |
| [15] | |
| [16] | . Genetic diversity among rice genotypes, including 15 indica basmati advance lines and 5 basmati improved varieties were investigated by 28 SSR markers including one indel marker. The SSRs covered all the 12 chromosomes that distributed across the rice genomes. The mean number of alleles per locus was 3.60, showing average number of polymorphism information content was 0.48. A total of 101 alleles were also identified from the microsatellite marker loci. A number of SSR markers were also identified that could be utilized to differentiate between rice genotypes. Pair wise Nei鈥檚 genetic distance between rice genotypes ranged from 0.07 to 0.95. The dendrogram based on cluster analysis by using SSR polymorphism that grouped the 20 genotypes of rice in to five clusters based on their genetic similarity. The result could be useful for the identification and selection of the diverse genotypes for the future cross breeding program and development of new rice varieties. |
| [17] | . Genetic diversity among some important Syrian wheat cultivars was estimated using Amplified Fragment Length Polymorphism (AFLP) markers. Five Triticum aestivum L. and 10 Triticum turgidum ssp. durum were analyzed with 11 Eco RI Mse I primer pair combinations. Of the approximately 525 detected AFLP markers, only 46.67% were polymorphic. Cluster analysis with the entire AFLP data divided all cultivars into two major groups reflecting their origins. The first one contained T. aestivum L. cultivars, and the T. turgidum ssp. durum cultivars and landraces were grouped in the second. Narrow genetic diversity among all cultivars was detected with an average genetic similarity of 0.884. The lowest similarity index (0.9) was found between Cham5 and Hamary ( durum wheat), whereas this value was 0.93 between Salamony and Bouhouth 4 ( T. aestivum L.). The narrow genetic diversity level indicates that these genotypes could be originated from the same source. AFLP analysis provides crucial information for studying genetic variation among wheat cultivars and provides important information for plant improvement. |
| [18] | . ABSTRACT Genetic diversity of 49 maize inbreds was assessed using twelve ISSR primers. A wide variation in PCR products was revealed in terms of size (280 to 3000 bp), extent of polymorphism (94.87%) and number of bands (4-9). As a whole, 78 ISSR bands were produced (including four monomorphic bands) with an average of 6.5 bands per primer and the maximum number of bands (9) being produced by primer OUAT-8. Five ISSR primers (OUAT-8, OUAT-9, OUAT-15, OUAT 17 and OUAT-18) revealed higher PIC value (around 0.70) along with 100% polymorphism indicating better allelic diversity. While, ISSR primer OUAT-15 revealed higher number of polymorphic bands (8) with 100% polymorphism as well as considerably high PIC and Rp values. Thus, such an informative and discriminative primer is of immense value for the study of genetic diversity in a set of maize genotypes. The similarity index values ranged from 0.3 to 0.9 with an average of 0.522 and BQPM-1-14 maintained the highest genetic distance as revealed from its lowest average similarity coefficient value (0.393) with rest of the genotypes. BQPM 1-14, BQPM 1-8, BQPM 3-10, BQPM 6-8 and B 1110-7-2 were identified to be highly divergent among the test inbreds which could be sorted out as valuable materials for heterosis breeding for production of single cross hybrids. |
| [19] | . Abstract A novel DNA fingerprinting technique called AFLP is described. The AFLP technique is based on the selective PCR amplification of restriction fragments from a total digest of genomic DNA. The technique involves three steps: (i) restriction of the DNA and ligation of oligonucleotide adapters, (ii) selective amplification of sets of restriction fragments, and (iii) gel analysis of the amplified fragments. PCR amplification of restriction fragments is achieved by using the adapter and restriction site sequence as target sites for primer annealing. The selective amplification is achieved by the use of primers that extend into the restriction fragments, amplifying only those fragments in which the primer extensions match the nucleotides flanking the restriction sites. Using this method, sets of restriction fragments may be visualized by PCR without knowledge of nucleotide sequence. The method allows the specific co-amplification of high numbers of restriction fragments. The number of fragments that can be analyzed simultaneously, however, is dependent on the resolution of the detection system. Typically 50-100 restriction fragments are amplified and detected on denaturing polyacrylamide gels. The AFLP technique provides a novel and very powerful DNA fingerprinting technique for DNAs of any origin or complexity. |
| [20] | . Saccharum spontaneum L. plays a key role in the improvement of stress resistance and yield of sugarcane cultivars by serving as wild parent sources, especially lines of different ploidy. To better understand the genetic diversity and potential breeding value of S. spontaneum with different ploidy levels, 62 clones from four ploidy types (2 n =64, 72, 80, and 96) were screened using 30 pairs of SSR primers and with population genetics methods. The results showed that the decaploid and octaploid populations had a higher diversity than nonaploid and dodecaploid populations at 30 SSR loci with >98% percentage of polymorphic bands and >0.92 polymorphic information content. Both the octaploid and decaploid populations shared more common bands with commonly used parents than the nonaploid or dodecaploid populations. The analysis of Nei genetic distance and UPGMA tree indicates that the decaploid population had the closest genetic relationship with the octaploid population and that the two populations had a close genetic relationship with commonly used parents (controls). According to the population divergence analysis, the four different ploidy populations did not show an obvious genetic divergence (Gst) (0.0880), but clearly had large amounts of gene flow (Nm) (5.1840). Octaploid and decaploid populations appeared to have undergone more genetic exchange with commonly used parents, as indicated by the low Gst value (0.1254 and 0.1276) and high Nm value (3.4872 and 3.4186). These results may provide important insight into utilizing the diversity of clones with different ploidy levels in S. spontaneum for future sugarcane breeding. |
| [21] | . |
| [22] | . Abstract Simple sequence repeats (SSR), or microsatellites, are ubiquitous in eukaryotic genomes. Here we demonstrate the utility of microsatellite-directed DNA fingerprinting by polymerase chain reaction (PCR) amplification of the interrepeat region. No sequencing is required to design the oligonucleotide primers. We tested primers anchored at 3' or 5' termini of the (CA)n repeats, extended into the flanking sequence by 2 to 4 nucleotide residues [3'-anchored primers: (CA)8RG, (CA)8RY, and (CA)7RTCY; and 5'-anchored primers: BDB(CA)7C, DBDA(CA)7, VHVG(TG)7 and HVH(TG)7T]. Radioactively labeled amplification products were analyzed by electrophoresis, revealing information on multiple genomic loci in a single gel lane. Complex, species-specific patterns were obtained from a variety of eukaryotic taxa. Intraspecies polymorphisms were also observed and shown to segregate as Mendelian markers. Inter-SSR PCR provides a novel fingerprinting approach applicable for taxonomic and phylogenetic comparisons and as a mapping tool in a wide range of organisms. This application of (CA)n repeats may be extended to different microsatellites and other common dispersed elements. |
| [23] | . The aim of this study was to analyze the genetic similarity in commercial cultivars of sugarcane from the breeding program cultivars RB (Republic of Brazil), using SSR markers and coefficient of parentage. Eighteen microsatellite markers were used to estimate genetic similarity in 30 genotypes and coefficient of parentage was estimated in 28 accessions. Eighteen primer pairs produced an average of 3.2 alleles, the level of polymorphism (PIC value) ranged from 0.34 to 0.78 in SMC248CG and SCC2 primers, respectively. The parentage coefficient was high among cultivars, with a mean of 0.14, suggesting high relationship among the cultivars. The results here suggest that to analyzed accessions, there is a high genetic similarity which could reduce the genetic gain in breeding. However, crosses among genotypes of sugarcane produce a high variability in the progenies, suggesting a combination between the genomes of species that originated the current cultivars. |
| [24] | . RFLPs, AFLPs, RAPDs and SSRs were used to determine the genetic relationships among 18 cultivated barley accessions and the results compared to pedigree relationships where these were available. All of the approaches were able to uniquely fingerprint each of the accessions. The four assays differed in the amount of polymorphism detected. For example, all 13 SSR primers were polymorphic, with an average of 5.7 alleles per primer set, while nearly 54% of the fragments generated using AFLPs were monomorphic. The highest diversity index was observed for AFLPs (0.937) and the lowest for RFLP (0.322). Principal co-ordinate analysis (PCoA) clearly separated the spring types from the winter types using RFLP and AFLP data with the two-row winter types forming an intermediate group. Only a small group of spring types clustered together using SSR data with the two-row and six-row winter varieties more widely dispersed. Direct comparisons between genetic similarity (GS) estimates revealed by each of the assays were measured by a number of approaches. Spearman rank correlation ranked over 70% of the pairwise comparisons between AFLPs and RFLPs in the same order. SSRs had the lowest values when compared to the other three assays. These results are discussed in terms of the choice of appropriate technology for different aspects of germplasm evaluation. |
| [25] | . |
| [26] | . Microsatellites have been popular molecular markers ever since their advent in the late eighties. Despite growing competition from new genotyping and sequencing techniques, the use of these versatile and cost-effective markers continues to increase, boosted by successive technical advances. First, methods for multiplexing PCR have considerably improved over the last years, thereby decreasing genotyping costs and increasing throughput. Second, next-generation sequencing technologies allow the identification of large numbers of microsatellite loci at reduced cost in non-model species. As a consequence, more stringent selection of loci is possible, thereby further enhancing multiplex quality and efficiency. However, current practices are lagging behind. By surveying recently published population genetic studies relying on simple sequence repeats, we show that more than half of the studies lack appropriate quality controls and do not make use of multiplex PCR. To make the most of the latest technical developments, we outline the need for a well-established strategy including standardized high-throughput bench protocols and specific bioinformatic tools, from primer design to allele calling. |
| [27] | . 利用10对AFLP引物对来自国家甘蔗资源圃的41份滇蔗茅(Erianthus rockii)无性系进行扩增,获得860个片段,多态性条带629个,多态性条带比率0.73,特异片段54个。遗传相似性系数、UPGMA聚类和主效应分析表明,在相似系数0.52处做切割线,毛轴野古草、斑茅和滇蔗茅无性系分为3个类群;在相似系数0.715处做切割线时,又将41份滇蔗茅无性系划分为3个大类群,云滇07/23独自形成A类群,鉴于其叶鞘背毛,有待作进一步的分析;B类群3份无性系,主要来自云南西南部高海拔地区;C类群37份无性系,其中30份来自云南西南方向的保山、德宏地区,其他地区7份;在相似系数0.738处做切割时,将C类群37份无性系划分为4个亚类群,亚类群的划分反映出明显的地域分布规律,来自同一地区的无性系多聚为一类;在相似系数0.765处做切割可将C4亚类群划分为4个亚类群(C4-1,C4-2,C4-3,C4-4),其中C4-3亚类群中云滇07/9/1与云滇99/4分子聚类最为相似,可作为复份材料保存;C4-3亚类群在相似系数0.773处切割又可以分为3个分支类群,以上分析反映出同一地区无性系之间具有丰富的遗传变异;主效应分析反映的属间、种间、无性系之间的亲缘关系与分子聚类分析结果一致;由此可见,丰富的地理生态条件造就了滇蔗茅丰富的遗传多样性和明显的地域性分布规律。 . 利用10对AFLP引物对来自国家甘蔗资源圃的41份滇蔗茅(Erianthus rockii)无性系进行扩增,获得860个片段,多态性条带629个,多态性条带比率0.73,特异片段54个。遗传相似性系数、UPGMA聚类和主效应分析表明,在相似系数0.52处做切割线,毛轴野古草、斑茅和滇蔗茅无性系分为3个类群;在相似系数0.715处做切割线时,又将41份滇蔗茅无性系划分为3个大类群,云滇07/23独自形成A类群,鉴于其叶鞘背毛,有待作进一步的分析;B类群3份无性系,主要来自云南西南部高海拔地区;C类群37份无性系,其中30份来自云南西南方向的保山、德宏地区,其他地区7份;在相似系数0.738处做切割时,将C类群37份无性系划分为4个亚类群,亚类群的划分反映出明显的地域分布规律,来自同一地区的无性系多聚为一类;在相似系数0.765处做切割可将C4亚类群划分为4个亚类群(C4-1,C4-2,C4-3,C4-4),其中C4-3亚类群中云滇07/9/1与云滇99/4分子聚类最为相似,可作为复份材料保存;C4-3亚类群在相似系数0.773处切割又可以分为3个分支类群,以上分析反映出同一地区无性系之间具有丰富的遗传变异;主效应分析反映的属间、种间、无性系之间的亲缘关系与分子聚类分析结果一致;由此可见,丰富的地理生态条件造就了滇蔗茅丰富的遗传多样性和明显的地域性分布规律。 |
| [28] | . |
| [29] | . Abstract Comparing results of different genetic diversity estimation methods may be indicative of their utility as parental selection tools for plant breeders. Forty-three spring and winter wheat lines (Triticum aestivum L.) from the Pacific Northwest (PNW) were used to compare pedigree and amplified fragment length polymorphism (AFLP)-based genetic diversity estimates (GDE(PED) and GDE(AFLP), respectively). The mean of the 903 GDE(PED) pairwise comparisons was 0.96, and 89% of the values were >0.90. In contrast, GDE(AFLP) may have more utility than GDE(PED) for identifying parental combinations with maximum allelic variation. Despite the substantially different means and distributions of the two diversity measures, a moderate rank correlation (r, = 0.42, P < 0.001) was detected between the two GDE matrices. AFLP fragments from hypomethylated portions of the genome (generated with Pst I:MSE I) were more highly associated with GDE(PED) than were fragments generated with the methylation insensitive combination Eco RI:MSE I (r, = 0.44 and 0.28, respectively). Pedigree and AFLP-based GDEs detected a similar hierarchical patterns of genetic variation among individuals, it may be adequate for assessing overall patterns of genetic variation among regionally adapted germplasm. It remains to be determined which method, if either, provides predictive estimates of heterosis or genetic variance among progeny from specific parental combinations. |
| [30] | . |
| [31] | . 美国种质是中国甘蔗育种中重要的亲本材料,在中国甘蔗育种中具有重要的地位。本试验应用18对SSR引物对来自美国的12份种质和中国选育的36份种质进行分析,比较中、美甘蔗种质间的遗传多样性差异。48份材料在18对引物上共检测到257条多态性条带,平均每对引物上的多态性条带数为16.8,试验材料间的Jaccard遗传相似性系数介于0.3 913~0.7 246之间,平均为0.5 383。以Jaccard遗传相似性系数进行UPGMA聚类,在阀值约0.5时,48份材料可划分为3类,第一类包括34份中国材料和4份美国材料;第二类包括8份美国材料;第三类为具有热带种越南牛蔗血缘的两份中国材料。分析结果表明,美国种质和中国种质间具明显的遗传差异,继续加强美国种质的引进和应用有助于拓宽中国甘蔗品种的遗传基础;越南牛蔗的后代和其他材料之间具有明显的遗传差异,育种时应加强热带种的创新利用。 . 美国种质是中国甘蔗育种中重要的亲本材料,在中国甘蔗育种中具有重要的地位。本试验应用18对SSR引物对来自美国的12份种质和中国选育的36份种质进行分析,比较中、美甘蔗种质间的遗传多样性差异。48份材料在18对引物上共检测到257条多态性条带,平均每对引物上的多态性条带数为16.8,试验材料间的Jaccard遗传相似性系数介于0.3 913~0.7 246之间,平均为0.5 383。以Jaccard遗传相似性系数进行UPGMA聚类,在阀值约0.5时,48份材料可划分为3类,第一类包括34份中国材料和4份美国材料;第二类包括8份美国材料;第三类为具有热带种越南牛蔗血缘的两份中国材料。分析结果表明,美国种质和中国种质间具明显的遗传差异,继续加强美国种质的引进和应用有助于拓宽中国甘蔗品种的遗传基础;越南牛蔗的后代和其他材料之间具有明显的遗传差异,育种时应加强热带种的创新利用。 |
| [32] | . 以云南27份甘蔗自育品种为材料,从国际微卫星协会提供的120对SSR引物中筛选出8对多态性丰富、品种聚类区分率高、易统计的引物组成核心引物。8对SSR引物共产生129条带,123个为多态带,多态条带比例为95.35%,多态信息量平均为0.9445,品种相似性系数在0.269~0.767之间,其中引物SMC1047HA,MSSCIR21不仅多态性丰富,而且单个引物就可区分所有品种,是最有效的核心引物。8对核心引物两两组合的效率分析表明,MSSCIR36/MSSCIR2、MSSCIR16/MSSCIR36和MSSCIR36/SMC336BS是高效引物组合,可以完全有效区分所有品种,且品种相似性系数较低;同时使用蔗区种植面积较大的10个主栽品种验证3个高效引物组合,结果表明,MSSCIR16/MSSCIR36是最佳引物组合,不仅能有效区分所有云南甘蔗自育品种,而且能将云南甘蔗自育品种与10个主栽品种最有效地区分开。使用品种的国圃号、国家地区代码、育种单位英文缩写、核心引物名称和分子数据组成云南甘蔗自育品种的DNA指纹身份证,不仅包含了品种的重要信息,而且其中的分子数据可用于品种的真伪鉴定和遗传关系分析,为品种的知识产权保护提供有效的科学依据。 . 以云南27份甘蔗自育品种为材料,从国际微卫星协会提供的120对SSR引物中筛选出8对多态性丰富、品种聚类区分率高、易统计的引物组成核心引物。8对SSR引物共产生129条带,123个为多态带,多态条带比例为95.35%,多态信息量平均为0.9445,品种相似性系数在0.269~0.767之间,其中引物SMC1047HA,MSSCIR21不仅多态性丰富,而且单个引物就可区分所有品种,是最有效的核心引物。8对核心引物两两组合的效率分析表明,MSSCIR36/MSSCIR2、MSSCIR16/MSSCIR36和MSSCIR36/SMC336BS是高效引物组合,可以完全有效区分所有品种,且品种相似性系数较低;同时使用蔗区种植面积较大的10个主栽品种验证3个高效引物组合,结果表明,MSSCIR16/MSSCIR36是最佳引物组合,不仅能有效区分所有云南甘蔗自育品种,而且能将云南甘蔗自育品种与10个主栽品种最有效地区分开。使用品种的国圃号、国家地区代码、育种单位英文缩写、核心引物名称和分子数据组成云南甘蔗自育品种的DNA指纹身份证,不仅包含了品种的重要信息,而且其中的分子数据可用于品种的真伪鉴定和遗传关系分析,为品种的知识产权保护提供有效的科学依据。 |
| [33] | . 本研究采用12对引物对67份"崖城89/9×昆明蔗茅"杂种不同世代(F1,BC1,BC2)及其亲本材料进行SSR多态性分析,扩增的总条带数为234条,其中多态性带为216条,多态率为92.31%,表明崖城89/9与蔗茅野生种杂交后代材料间存在较大差异;各后代材料与原始亲本"崖城89/9"及"昆明蔗茅"间的平均遗传相似系数分别为0.75和0.47,且从聚类结果来看,各子代材料均与"崖城89/9"聚为一类,说明原始母本的遗传物质在后代材料中占绝对优势;供试材料的同源关系分析表明,YAU01/68和YAU01/108间的同源性高达94%,而其母本"崖城89/9"与父本"昆明蔗茅"间仅为50%;利用234个SSR标记片段组合构建供试材料的指纹图谱数据库,为追踪蔗茅野生种血缘在不同世代中的传递情况及这些后代材料在甘蔗育种中的进一步利用提供科学依据。 . 本研究采用12对引物对67份"崖城89/9×昆明蔗茅"杂种不同世代(F1,BC1,BC2)及其亲本材料进行SSR多态性分析,扩增的总条带数为234条,其中多态性带为216条,多态率为92.31%,表明崖城89/9与蔗茅野生种杂交后代材料间存在较大差异;各后代材料与原始亲本"崖城89/9"及"昆明蔗茅"间的平均遗传相似系数分别为0.75和0.47,且从聚类结果来看,各子代材料均与"崖城89/9"聚为一类,说明原始母本的遗传物质在后代材料中占绝对优势;供试材料的同源关系分析表明,YAU01/68和YAU01/108间的同源性高达94%,而其母本"崖城89/9"与父本"昆明蔗茅"间仅为50%;利用234个SSR标记片段组合构建供试材料的指纹图谱数据库,为追踪蔗茅野生种血缘在不同世代中的传递情况及这些后代材料在甘蔗育种中的进一步利用提供科学依据。 |
| [34] | . 对甘蔗区域试验数据进行基因型与环境互作分析,有利于全面了解参试品种的丰产性和各试点的代表性,对优良新品种的推广和品种的区域分布也有着重要意义。本文综合利用AMMI模型和HA-GGE双标图对2014年国家甘蔗第10轮区域试验11个品种和13个试点的蔗茎产量和蔗糖产量数据进行产量稳定性和丰产性分析,评价试点的代表性和分辨力。结果表明:蔗茎产量和蔗糖产量在不同品种和试点间存在极显著差异,品种和试点存在极显著互作效应。‘福农40号’综合表现最佳,是产量高、丰产性好且蔗茎产量和蔗糖产量的稳定性均较强的品种;‘云蔗08-2060’的产量略低于‘福农40号’,但蔗茎产量和蔗糖产量的稳定性强于‘福农40号’;与对照品种‘ROC22’相比,‘粤甘43号’、‘粤甘46号’和‘闽糖02-205’的蔗茎产量和蔗糖产量较高,稳定性中等,‘福农40号’、‘粤甘43号’、‘粤甘46号’和‘云蔗08-2060’均具有较强的适应性,可在适宜蔗区推广应用。综合AMMI和HA-GGE双标图分析结果表明,广东遂溪、云南开远和福建福州具有较高的地点分辨力和试点代表性。因此,AMMI和HA-GGE双标图的综合运用,可更准确直观地评价出各品种的丰产性、稳定性和适应性以及各试点的分辨力和代表性。本研究可为甘蔗新品种的鉴定与推广提供有价值的理论参考。 . 对甘蔗区域试验数据进行基因型与环境互作分析,有利于全面了解参试品种的丰产性和各试点的代表性,对优良新品种的推广和品种的区域分布也有着重要意义。本文综合利用AMMI模型和HA-GGE双标图对2014年国家甘蔗第10轮区域试验11个品种和13个试点的蔗茎产量和蔗糖产量数据进行产量稳定性和丰产性分析,评价试点的代表性和分辨力。结果表明:蔗茎产量和蔗糖产量在不同品种和试点间存在极显著差异,品种和试点存在极显著互作效应。‘福农40号’综合表现最佳,是产量高、丰产性好且蔗茎产量和蔗糖产量的稳定性均较强的品种;‘云蔗08-2060’的产量略低于‘福农40号’,但蔗茎产量和蔗糖产量的稳定性强于‘福农40号’;与对照品种‘ROC22’相比,‘粤甘43号’、‘粤甘46号’和‘闽糖02-205’的蔗茎产量和蔗糖产量较高,稳定性中等,‘福农40号’、‘粤甘43号’、‘粤甘46号’和‘云蔗08-2060’均具有较强的适应性,可在适宜蔗区推广应用。综合AMMI和HA-GGE双标图分析结果表明,广东遂溪、云南开远和福建福州具有较高的地点分辨力和试点代表性。因此,AMMI和HA-GGE双标图的综合运用,可更准确直观地评价出各品种的丰产性、稳定性和适应性以及各试点的分辨力和代表性。本研究可为甘蔗新品种的鉴定与推广提供有价值的理论参考。 |
| [35] | . 应用AMMI模型对参加国家甘蔗第七轮区域试验的11个甘蔗品种的蔗产量和糖产量进行丰产性及稳定性分析,以期为品种的合理布局和推广应用提供依据.结果表明,参试品种蔗茎产量、公顷含糖量存在品种间、年份间和地点间的显著差异,品种、年份与地点的互作效应差异显著;参试品种中MT96-1027、YT03-393、C1-2003、YZ03-194、YT03-373、FN04-3504的蔗茎产量和公顷含糖量比对照ROC16显著增产.FN04-3504、YZ03-194两个品种的蔗茎产量稳定性好;YT03-393、YT03-373两个品种的平均蔗茎产量高,但产量表现不够稳定;上述4个品种可根据生产需要选择,并进行合理布局在适宜地区推广应用. . 应用AMMI模型对参加国家甘蔗第七轮区域试验的11个甘蔗品种的蔗产量和糖产量进行丰产性及稳定性分析,以期为品种的合理布局和推广应用提供依据.结果表明,参试品种蔗茎产量、公顷含糖量存在品种间、年份间和地点间的显著差异,品种、年份与地点的互作效应差异显著;参试品种中MT96-1027、YT03-393、C1-2003、YZ03-194、YT03-373、FN04-3504的蔗茎产量和公顷含糖量比对照ROC16显著增产.FN04-3504、YZ03-194两个品种的蔗茎产量稳定性好;YT03-393、YT03-373两个品种的平均蔗茎产量高,但产量表现不够稳定;上述4个品种可根据生产需要选择,并进行合理布局在适宜地区推广应用. |
| [36] | . Test environments and classification of regional ecological zones into environments are the two key components in regional testing of cultivars. This study aims to provide the theoretical basis for test environment evaluation and ecological zone division for cultivars. In the present study, yield data from a three-year nationwide field trial involving 21 cultivars and 14 pilot test locations were analysed using both analysis of variance (ANOVA) and heritability adjusted-genotype main effect genotype-environment interaction (HA-GGE) biplot. The results showed that among the interactive factors, the GE interaction had the greatest impact, while the genotype and year interaction showed the lowest impact. Kaiyuan, Lincang and Baoshan of Yunnan, Zhangzhou and Fuzhou of Fujian, and Hechi, Liuzhou and Chongzuo of Guangxi, and Lingao of Hainan were ideal test environments with a demonstrated high efficiency in selecting new cultivars with a wide adaptability, whereas Baise of Guangxi was not. Based on HA-GGE biplot analysis, there are three ecological production zones in China, the Southern China Inland Zone, the Southwestern Plateau Zone, and the Southern Coastal Zone. The HA-GGE biplot analysis here presents the ideal test environments and also identifies the -environment for cultivars in China. |
| [37] | . Twenty-five Florida sugarcane varieties were fingerprinted with three microsatellites, namely, SMC334BS, SMC336BS, and MCSA068G08, using a capillary electrophoresis system. Multiple alleles were detected from each microsatellite that exhibited a high level of polymorphism. There were six alleles for SMC334BS, five for SMC336BS, and seven for MCSA068G08 with a total of 18 alleles. A putative genotype is assigned to each variety by an arbitrary nucleotide sequence of A (if a particular allele is present) or C (if the same allele is absent). The genetic similarity among these varieties was assessed with a DNA sequence analysis software, DNAMAN庐, to produce a pairwise homology matrix and a homology tree. Only two pairs of varieties, CP 70-1133/CP 92-1213 and CP 81-1384/CP 98-1462, shared an identical genotype. The 25 varieties were clustered into three groups, with genetic similarities greater than 70% with each group. Group I included CP 98-1462, CP 81-1384, CP 92-1666, CP 98-1119, CP 92-1641, CP 72-2086, CP 89-2143, CP 96-1602, CP 81-1254, and CP 94-1340. Group II included CP 92-1213, CP 70-1133, CP 73-1547, CP 93-1309, CP 86-1633, CP 82-1592, CP 72-1210, CP 94-1100, CP 98-1840, CP 95-1039, CP 88-1762, CP 80-1743, and CP 94-1591. Group III included CP 85-1308 and CP 84-1198. The availability of microsatellite fingerprints allowed the sugarcane breeders to identify and discard two mis-labeled sugarcane varieties from field trials that also produced distinct RAPD fingerprints. In addition, the microsatellite fingerprints helped sugarcane breeders evaluate the efficiency of the current conventional breeding methods and clarify the genetic pedigree of commercial sugarcane varieties. |
| [38] | . Abstract Sugarcane propagates asexually through vegetative cuttings. To ensure the genetic identity during shipping and handling, 116 Louisiana commercial sugarcane clones were genotyped with 21 microsatellite (SSR) markers. A total of 184 leaf samples were collected from locations CP, H, L, and Q, including 20 samples of five quadric clones from all locations, 30 samples of 10 triplicate clones from three locations, 66 samples of 33 duplicate clones from two locations, and 68 samples of stand-alone clones from single location. DNA was extracted using a high throughput (HT) procedure. PCR amplification and capillary electrophoresis (CE) were processed semi-automatically using a liquid-handling station, 384-well reaction plates, and fluorescence-labeled SSR primers. Resulting genotyping files were analyzed using the GeneMapper software and a total of 144 distinctive SSR alleles were scored. The distribution of these 144 SSR alleles in a sugarcane clone was scored as a DNA sequence of A (presence) or C (absence) to represent clone's SSR genotype. Alignment of all 184 genotypes by the DNAMAN庐 software produced homology and phylogenetic trees that demonstrated that all but three clones shared a 70% or greater genetic similarity. In addition, samples of nine commercial clones (Ho 95-988, L 03-374, Ho 02-653, HoCP 02-652, HoCP 03-703, L 03-364, TucCP 77-42, HoCP 85-845, and HoCP 02-639) that grew at different geographic locations showed different genetic identities from those grew at their original locations. These clones were considered to be mis-labeled due to transportational errors during shipping and handling and therefore were removed from the parental list before the crossing season started. The SSR genotypes were stored in a local molecular database for future use in clone identity verification, cross fidelity assessment, and polycross paternity determination. |
| [39] | . This paper reports the development of the first SSR marker-based sugarcane (Saccharum spp.) molecular identity database in the world. Since 2005, 1,025 sugarcane clones were genotyped, including 811 Louisiana, 45 Florida, 39 Texas, 130 foreign, and eight consultant/seed company clones. Genotyping was done on a fluorescence-capillary electrophoresis detection platform involving 21 highly polymorphic SSR markers that could potentially amplify 144 distinctive DNA fragments. Genotyping data were processed with the GeneMapper? software to reveal electrophoregrams that were manually checked against the 144 fragments. The presence (A) or absence (C) of these 144 fragments in any sugarcane clone was recorded in an affixed sequence order as a DNAMAN file to represent its molecular identity being achieved into a local molecular identity database. The molecular identity database has been updated annually by continued genotyping of newly assigned sugarcane clones. The database provides molecular descriptions for new cultivar registration articles, enables sugarcane breeders to identify mis-labeled sugarcane clones in crossing programs and determine the paternity of cross progeny, and ensures the desired cultivars are grown in farmers fields. |
| [40] | . . |
| [41] | . The ability of microsatellite or simple sequence repeat (SSR) markers to determine the level of genetic diversity between members of the genera Saccharum ( S. officinarum , S. sponfaneum , S. sinense ), Old World Erianthus Michx. sect. Ripidium , North American E. giganteus ( S. giganteum ), Sorghum and Miscanthus were assessed. Six SSR markers were tested on 66 accessions and produced a total of 187 distinct alleles. Where available, results were compared against published data from other molecular marker systems such as RFLPs, RAPDs, AFLPs and 5S rRNA intergenic spacers. Similarity coefficient calculations and clustering revealed a genetic structure for Saccharum and Erianthus sect. Ripidium that reflected closely the relationship previously identified using other marker systems. The results indicated that SSRs will be an ideal means for the identification of the genetic constitution of modern sugarcane cultivars of interspecific origins. |
| [42] | . Sugarcane varieties are complex polyploids carrying in excess of 100 chromosomes and are derived from interspecific hybridisation between the domesticated Saccharum officinarum and the wild relative S. spontaneum . A map was constructed in , an Australian cultivar, from a segregating F 1 population, using 40 amplified fragment length polymorphism (AFLP) primer combinations, five randomly amplified DNA fingerprints (RAF) primers and 72 simple sequence repeat (SSR) primers. Using these PCR-based marker systems, we generated 1,365 polymorphic markers, of which 967 (71%) were single-dose (SD) markers. Of these SD 967 markers, 910 were distributed on 116 linkage groups (LGs) with a total map length of 9,058.3 cM. Genome organisation was significantly greater than observed in previously reported maps for Saccharum spp. With the addition of 123 double-dose markers, 36 (3:1) segregating markers and a further five SD markers, 1,074 markers were mapped onto 136 LGs. Repulsion phase linkage detected preferential pairing for 40 LGs, which formed 11 LG pairs and three multi-chromosome pairing groups. Using SSRs, double-dose markers and repulsion phase linkage, we succeeded in forming 127 of the 136 LGs into eight homo(eo)logy groups (HG). Two HGs were each represented by two sets of LGs. These sets of LGs potentially correspond to S. officinarum chromosomes, with each set aligning to either end of one or two larger LGs. The larger chromosomes in the two HGs potentially correspond to S. spontaneum chromosomes. This suggestion is consistent with the different basic chromosome number of the two species that are hybridised to form sugarcane cultivars, S. spontaneum ( x =8) and S. officinarum ( x =10), and illustrates the structural relationship between the genomes of these two species. The discrepancy of coverage between HGs highlights the difficulty in mapping large parts of the genome. |
| [43] | . The application of AFLPs, RAPDs and SSRs to examine genetic relationships in the primary northwestern European cultivated potato gene pool was investigated. Sixteen potato cultivars were genotyped using five AFLP primer combinations, 14 RAPD primers, and 17 database-derived SSR primer pairs. All three approaches successfully discriminated between the 16 cultivars using a minimum of one assay. Similarity matrices produced for each marker type on the basis of Nei and Li coefficients showed low correlations when compared with different statistical tests. Dendrograms were produced from these data for each marker system. The usefulness of each system was examined in terms of number of loci revealed (effective multiplex ratio, or EMR) and the amount of polymorphism detected (diversity index, or DI). AFLPs had the highest EMR, and SSRs the highest DI. A single parameter, marker index (MI), which is the product of DI and EMR, was used to evaluate the overall utility of each marker system. The use of these PCR-based marker systems in potato improvement and statutory applications is discussed. Abbreviations: PCR, polymerase chain reaction; AFLP, amplified fragment length polymorphism; RAPD, randomly amplified polymorphic DNA; DNA, deoxyribonucleic acid; EMR, effective multiplex ratio; DI, diversity index; MI, marker index; RFLP, restriction fragment length polymorphism. |
| [44] | . Streit M, Gehlenborg N. |
| [45] | . The results of neuraminidase inhibitor (NAI) enzyme inhibition assays are commonly expressed as 50% inhibitory concentration (IC50) fold-change values and presented graphically in box plots (box-and-whisker plots). An alternative and more informative type of graph is the kernel density plot, which we propose should be the preferred one for this purpose. In this paper we discuss the limitations of box plots and the advantages of the kernel density plot, and we present NAIplot, an opensource web application that allows convenient creation of density plots specifically for visualizing the results of NAI enzyme inhibition assays, as well as for general purposes. |
| [46] | . |
| [47] | . The present study was to assess informativeness and efficiency of three different molecular markers for genetic diversity among 24 Citrus and its relative species. Sixty one SSR, 33 SRAP and 24 CAPS-SNP markers were used to evaluate the level of polymorphism and discriminating capacity. A total of 596, 656 and 135 polymorphic amplicons were observed in SSR, SRAP and CAPS-SNP markers with average polymorphism information content (PIC) of 0.97, 0.98 and 0.89, respectively. High levels of polymorphism were recorded for SSR and SRAP compared with CAPS-SNP markers. The highest correlations ( r = 0.930) were obtained between SSR and SRAP markers, whereas SSR and CAPS-SNP were poorly correlated ( r = 0.833). Cluster analysis was performed to construct dendrograms using UPGMA. And the dendrogram from SSR data was most congruent with the general dendrogram. These findings provide basis for future efficient use of these molecular markers in the genetic analysis of Citrus and its relatives. |
| [48] | . 利用SSR标记分析陆地棉野生种系的遗传多样性,对材料间相似系数的变异系数进行显著性测验和矩阵相关性测验,探讨引物和多态性位点数对研究结果准确性的影响。90对多态性引物在42份供试材料间共检测出530个等位位点,其中多态性位点440个,占83.01%。多态信息含量范围为0.046~0.888,平均为0.649;Shannon多样性指数在0.113~2.289之间变动,平均为1.248。显著性测验显示,当引物按PIC值降序排列时,利用25对引物或者150个多态性位点即可获得较准确的结果;升序排列时,至少需要50对引物或200个多态性位点才能获得较准确的结果。矩阵相关性测验显示,降序时20对、升序时50对引物或者达到150个多态性位点聚类即可达到90对引物时的精度。此外,在引物量较少时,扩增位点数较多的引物所提供的信息量更大,随着引物量的增加,这种差距趋于不明显;等位位点总数较少时,引物数量更重要,随着位点数的增加,引物信息含量的重要性已高于引物数起主导作用。综上,若要客观反映出42份陆地棉野生种系的遗传关系,有必要选用多态性引物30对,扩增多态性位点150个以上,增加引物到50对以上为佳。 . 利用SSR标记分析陆地棉野生种系的遗传多样性,对材料间相似系数的变异系数进行显著性测验和矩阵相关性测验,探讨引物和多态性位点数对研究结果准确性的影响。90对多态性引物在42份供试材料间共检测出530个等位位点,其中多态性位点440个,占83.01%。多态信息含量范围为0.046~0.888,平均为0.649;Shannon多样性指数在0.113~2.289之间变动,平均为1.248。显著性测验显示,当引物按PIC值降序排列时,利用25对引物或者150个多态性位点即可获得较准确的结果;升序排列时,至少需要50对引物或200个多态性位点才能获得较准确的结果。矩阵相关性测验显示,降序时20对、升序时50对引物或者达到150个多态性位点聚类即可达到90对引物时的精度。此外,在引物量较少时,扩增位点数较多的引物所提供的信息量更大,随着引物量的增加,这种差距趋于不明显;等位位点总数较少时,引物数量更重要,随着位点数的增加,引物信息含量的重要性已高于引物数起主导作用。综上,若要客观反映出42份陆地棉野生种系的遗传关系,有必要选用多态性引物30对,扩增多态性位点150个以上,增加引物到50对以上为佳。 |
| [49] | . The discrepancies across test sites and years, along with the interaction between cultivar and environment, make it difficult to accurately evaluate the differences of the sugarcane cultivars. Using a genotype main effect plus genotype-environment interaction (GGE) Biplot software, the yield performance data of seven sugarcane cultivars in the 8th Chinese National Sugarcane Regional Tests were analyzed to identify cultivars recommended for commercial release. Fn38 produced a high and stable sugar yield. Gn02-70 had the lowest cane yield with high stability. Yz06-407 was a high cane yield cultivar with poor stability in sugar yield. Yz05-51 and Lc03-1137 had an unstable cane yield but relatively high sugar yield. Fn39 produced stable high sugar yield with low and unstable cane production. Significantly different sugar and cane yields were observed across seasons due to strong cultivar-environment interactions. Three areas, Guangxi Chongzuo, Guangxi Baise, and Guangxi Hechi, showed better representativeness of cane yield and sugar content than the other four areas. On the other hand, the areas Guangxi Chongzuo, Yunnan Lincang, and Yunnan Baoshan showed strong discrimination ability, while the areas Guangxi Hechi and Guangxi Liuzhou showed poor discrimination ability. This study provides a reference for cultivar evaluation and essential test locations identification for sugarcane breeding in China. |
| [50] | . Abstract We estimated the genetic distances among 10 spring wheat genotypes based on pedigree data, morphological traits and AFLP markers, used individually and combined with morphological traits, to find the best predictors of general- and specific-combining abilities among parental genotypes. Ten wheat parents were crossed in a diallel form, disregarding reciprocal hybrids, totaling 45 combinations. The F69 hybrids, F60 populations and parents were evaluated in the field in 2007. The experimental plots consisted of 20 plants for F69 hybrids and 40 plants for parental and F60 populations. All methods (pedigree data, AFLP markers and morphological traits, used individually and combined) were found to be useful for the assessment of genetic diversity. The significant coefficient correlations ranged from low (0.45) to moderate (0.67) between the distance measures and hybrid performance. There was significant agreement between the distance measures based on AFLP markers vs morphological traits + AFLP markers (r = 0.47) and between pedigree data vs morphological traits + AFLP markers (r = 0.43). The pedigree distance was positively associated with traits 100-kernel weight and grain yield per plant in F69 (correlations of 0.67 and 0.62, respectively) and F60 (correlations of 0.62 and 0.59, respectively) generations. These correlation values indicate that the genetic distance, based on pedigree data, could replace diallel crosses for the selection of parents with higher combining ability and with moderate reliability. |
| [51] | . Parent-pair selection is one of crucial factors that generate progenies with strong heterosis in tree cross-breeding programmes. In our Liriodendron breeding programme, we conducted a very effective s |
| [52] | . ABSTRACT Choice of crosses is crucial for a successful and sustainable management of breeding programs. Our objectives were to (1) investigate the association between the Rogers' distances among parents and the genetic variance within their crosses ( 2within) in elite maize breeding germplasm, (2) study whether this association can be improved selecting trait-specific markers, and (3) evaluate the consequences to implement the usefulness criterion based on Rogers' distances on the optimum choice of crosses. Testcross performance of eleven segregating crosses with a total of 930 progenies was evaluated in six environments for grain yield (GY) and grain moisture content (GMC). Moreover, the 930 genotypes were fingerprinted with 425 polymorphic SNP markers. Our findings revealed that working within a heterotic group, 2within increased with increasing Rogers' distances among the parents. This was more pronounced for GY (r P = 0.55 P < 0.1) compared to GMC (r P = 0.17). Selecting trait specific markers, which were associated with putative QTL affecting these traits, led for GY to a decrease in the association between 2within and Rogers' distances among the parents. Consequently, using for GY a regression model based on Rogers' distances estimated with an unselected set of markers allows a rough implementation of the usefulness criterion in maize breeding programs. Our model calculations suggested that implementing the usefulness criterion will facilitate a broadening of the diversity of elite maize breeding pools by counterbalancing a reduction in parental performance with an increase in 2within. |
| [53] | . Genetic distance analysis among quality protein maize (QPM) inbred lines and the correlation of genetic distance with heterosis would help to design breeding strategy and predict hybrid performance. This study was carried out to determine the amount of genetic diversity among QPM inbred lines using SSR markers and morphological distances; to classify the inbred lines according to their relationships; and to estimate the correlations of SSR markers and morphological distances with hybrid performance, heterosis and specific combining ability (SCA). One-hundred and five hybrids generated by diallel crossing of 15 QPM inbred lines were evaluated with the 15 parents for 17 morphological traits at Harare, Zimbabwe and Bako, Ethiopia and also examined for DNA polymorphism using 40 SSR markers. SSR markers and morphological methods of genetic distance estimates showed moderately high genetic distance among the inbred lines studied. Cluster analysis based on the two distance measures grouped the 15 parental lines differently. The SSR marker-based genetic distance was positively and highly significantly correlated with grain yield (r02=020.37), and negatively and highly significantly with days to anthesis (r02=02610.40) and days to silking (r02=02610.42). These relationships suggest that high grain yield and earliness of QPM hybrids can be predicted from SSR marker determined distances of the parents, although the correlation values were not very high. The correlations of SSR marker distance with heterosis were too low to be of predictive value except for the case of plant height. Morphological distances were of less importance in predicting hybrid performance and SCA effects of hybrids. |
| [54] | |
| [55] |
