 , 徐莎莎
, 徐莎莎Correcting the Response of Maximum Leaf Photosynthetic Rate to Temperatures in Crop Models
YANGShen-Bin, XUSha-Sha收稿日期:2017-11-15
接受日期:2018-03-15
网络出版日期:2018-03-16
版权声明:2018作物学报编辑部作物学报编辑部
基金资助:
作者简介:
-->
展开
摘要
关键词:
Abstract
Keywords:
-->0
PDF (973KB)元数据多维度评价相关文章收藏文章
本文引用格式导出EndNoteRisBibtex收藏本文-->
温度是影响作物光合作用进程的主导因素[1]。研究显示, 作物光合作用速率的温度依存性主要表现为单峰型曲线, 即从下限温度至最适温度为加速上升, 从最适温度到上限温度则相反。这种光合作用速率的温度依存性还与作物种类、所处生长环境密切相关[2]。因此, 针对特定品种, 研究其光合作用速率与温度的依存性, 并将其定量化用于作物生长量的模拟及温度影响分析具有重要的意义。
Medlyn等[1]曾结合多种植被类型的光合观测数据和Farquhar等[3]提出的机理性光合作用模型, 探讨了C3作物光合作用的温度依存性, 并建立了针对不同类型植物的最大羧化速率和RuBP再生速率的温度影响函数。类似的还有Warren和Dreyer[4]有关光合作用的温度影响研究。该研究采用10°C到35°C之间6个温度梯度下的叶片光合作用数据, 结合Arrhenius方程[5]反推了最大羧化速率和RuBP再生速率温度影响方程参数值。Leuning[6]通过类似的研究发现, 当叶片温度<30°C时, 最大羧化速率和RuBP再生速率随温度的变化品种间差异微小, 而当高于该温度后, 两者的温度依存性表现出明显的品种差异。同样基于Farquhar等[3]提出的光合作用模型, Borjigidai等[7]利用开放式CO2增效试验, 研究了水稻光合作用温度依存性的季节性特征, 并通过重建光合作用与温度的响应关系确定了最大光合作用速率的最适温度。从上述研究可以看出, 结合机理性光合作用模型可以针对特定品种建立光合作用生物学参数的温度依存函数, 并利用该函数评估温度变化对光合作用的影响。然而, 机理性光合作用模型参数众多, 实现过程复杂, 在作物模型中较少得到采用[3,8]。
现有的作物模型, 如AquaCrop[9]、CERES[10]、WOFOST[11]、APSIM[12]、ORYZA2000[13]等, 在模拟作物光合作用时多采用基于双曲线方程、指数方程的光效率模型[14]。该类模型不但简单易用, 还考虑了温度、叶片氮素含量、叶片水分等因素的影响, 并通过建立这些因素的影响方程计算作用系数, 以乘积形式作用于潜在速率变量上, 定量表示这些因素对光合作用的影响程度。模型中温度对光合作用速率的影响主要作用在最大光合作用速率和表观量子效率上, 其影响系数值通常来自参数文件中定义的温度影响系数查找表。从已有研究看, 鲜有介绍该温度影响系数查找表来源或构建方法的报道。因此, 在实际应用中, 一般默认模型中已有的参数值, 使其应用于整个生育期和所有品种。何亮等[15]通过WOFOST作物模型参数敏感性分析发现, 生育期为1.5时的最大光合速率参数敏感性较高。刘建栋等[16]曾对FAO (Food and Agriculture Organization)生产力模型中的光合作用参数验证显示, 该模型默认的光合作用模式参数值在特定区域作物生长模拟上存在较大偏差, 因此, 对参数值进行修订有助于提高模拟精度和模拟结果的针对性。
由于温度是影响作物光合作用速率的主导因素, 在气候变化日益凸显的情况下, 温度对作物生产潜力的影响备受关注[17,18]。为了更好地模拟温度变化对作物光合作用的影响, 本文拟以ORYZA2000模型[13]为例, 结合两年的水稻温度梯度控制实验, 验证该模型中最大光合作用速率模拟模块的温度影响参数, 提出针对特定品种的参数修订方法。通过这项研究, 将为作物模型中光合作用温度影响参数的本地化提供方法参考。
1 数据与方法
1.1 ORYZA2000模型中单叶光合作用速率的模拟
ORYZA2000模型是由国际水稻研究所与荷兰瓦赫宁根大学联合开发的、具有较强机理性的一种水稻作物模型, 已在亚洲的大多数水稻种植国家得到广泛应用[13,18-20]。与其他同类水稻作物模型相似, ORYZA2000模型能够模拟潜在生产、水分胁迫和氮素胁迫下的水稻生育期进程、干物质积累和分配、叶面积和产量形成, 并估算出最终产量。在模拟水稻干物质积累方面, 该模型首先计算到达水稻冠层上方的光合有效辐射(PAR); 然后采用高斯积分法将冠层在垂直方向上划分为3层, 并根据光在冠层内的传输和分布, 分别计算各层阳叶和阴叶比例以及各自吸收的PAR; 随后, 应用基于负指数方程的光效率模型, 分别计算瞬时阴、阳叶总CO2同化速率, 并积分得到整个冠层瞬时的总CO2同化量; 最后, 在时间上同样采用高斯积分法, 将瞬时冠层总CO2同化量按权重系数累积求和, 再与当日天文日长求积得出一天整个冠层的总CO2同化量。在上述计算过程中, 瞬时单叶总光合作用速率的推算采用了公式(1)。${{A}_{\text{L}}}={{A}_{\text{m}}}\left[ 1-\exp (-\varepsilon {{I}_{\text{a}}}/{{A}_{\text{m}}}) \right]$ (1)
式中, AL为单叶瞬时总CO2同化速率(kg CO2 hm-2 leaf h-1), Am为光饱和条件下的单叶最大总CO2同化速率(kg CO2 hm-2 leaf h-1), ε表示初始光能利用率, Ia为吸收的PAR (W m-2 leaf)。对于Am的计算, 在ORYZA2000模型中考虑了环境CO2浓度、叶片氮含量和白天平均温度的影响。当叶片氮含量≥0.5 g N m-2 leaf时, 模型采用公式(2)推算不同温度和CO2浓度下的Am。
$\begin{align}& {{A}_{\text{m}}}=9.5+(22\times {{S}_{\text{N}}})\times f({{T}_{\text{d}}})\times {{A}_{\max \text{C}{{\text{O}}_{\text{2}}}}} \\& {{A}_{\text{maxC}{{\text{O}}_{\text{2}}}}}=\max (0,49.57/34.26\times \\& \left\{ 1-\exp \left[ -0.208\times ({{C}_{\text{C}{{\text{O}}_{\text{2}}}}}-60)/49.57 \right] \right\}) \\\end{align}$ (2)
式中, SN表示单位叶片面积含氮量(g N m-2 leaf), f(Td)为温度影响函数, Td表示白天平均温度, CCO2表示环境CO2浓度(μmol mol-1)。当叶片氮含量低于0.5 g N m-2 leaf时, 采用公式(3)推算Am。
${{A}_{\text{m}}}=\max (0,68.33\times ({{S}_{\text{N}}}-0.2)\times f({{T}_{\text{d}}})\times {{A}_{\max \text{C}{{\text{O}}_{\text{2}}}}})$(3)
式中, AmaxCO2的计算同公式(2)。在公式(2)和(3)中, f(Td)取值来自ORYZA2000的作物参数文件(CROP.DAT), 参数名为REDFTT, 该参数值以类似查找表的形式列出, 默认取值如图1所示, 在20~37°C之间f(Td)=1, 表明该温度区间为最适温度, 即该区间内单叶光合作用不受温度变化的影响, 而10~20°C之间f(Td)从0到1线性增加, 37~43°C之间则从1到0线性减少。低于10°C或高于43°C时单叶光合作用受到彻底抑制。
 显示原图|下载原图ZIP|生成PPT
图1ORYZA2000模型中REDFTT默认参数取值
-->Fig. 1Default parameter values of REDFTT in ORYZA2000
-->
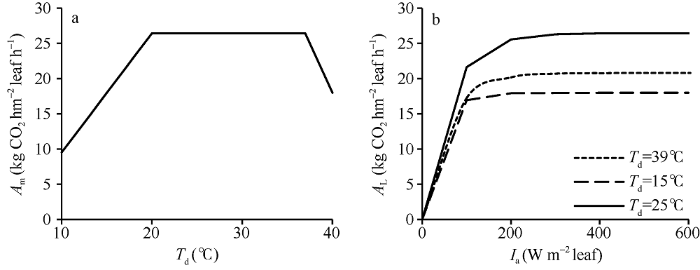
从公式(2)可以看出, Amax CO2仅是环境CO2浓度的函数。在固定CCO2后, Am的变化仅与SN和f(Td)有关。假设水稻叶片氮含量在一段时期内的变化可以忽略, 那么Am随温度的变化曲线线型与f(Td)的线型一致, 即在20~37°C之间的温度变化不会导致Am的增减。图2分别显示了Am随温度的变化曲线和不同温度下AL随Ia的变化曲线。其中, 图2-a假设Ia=1000 W m-2 leaf, SN=0.7, CCO2=400 μmol mol-1。图2-b则设置3个不同温度水平, 模拟了各水平下Ia从0到600 W m-2 leaf下AL的变化。在绘制AL曲线时, ε的取值来自作物参数文件中的EFFTB默认值, 即在10°C至40°C之间随温度升高从0.54线性降至0.36。从图中可以看出, Am与f(Td)线型一致。与Am相似, AL同样表现出对温度变化的敏感。尽管在39°C的ε=0.37, 低于15°C时的0.51, 但15°C时的光合作用水平依旧低于39°C, 表明低温对单叶总CO2同化速率的影响较高温段明显。
 显示原图|下载原图ZIP|生成PPT
图2Am随温度的变化(a)和不同温度下AL随Ia的变化(b)曲线
假设Ia=1000 W m-2 leaf, SN=0.7 g N m-2 leaf, CCO2=400 μmol mol-1。
-->Fig. 2Curves of Am with the change of temperatures (a) and AL with the change of Ia under different temperatures (b)
It is assumed that Ia=1000 W m-2 leaf, SN=0.7 g N m-2 leaf, CCO2=400 μmol mol-1.
-->
1.2 光合作用参数与温度的依存性
ORYZA2000模型在模拟瞬时单叶光合作用速率时, 从两个方面引入了温度影响, 一个是在模拟单叶最大总光合作用速率Am时引入了参数REDFTT, 另一个是在单叶总光合作用速率AL模拟方程中, 作为参数之一的初始光能利用率ε与温度存在一定关系, 并在作物参数文件中以参数名EFFTB列出相关系数值。尽管ORYZA2000模型没有明确这些参数值的确立依据, 但在实际应用中已被广泛采纳。为了明确这些参数值的确立依据, 将结合Farquhar等[3]提出的机理性光合作用模型和观测数据, 从实验资料中获取模型中光合作用参数与温度的函数关系, 最终从理论上推算出叶片光合作用速率随温度的变化关系。Farquhar等[3]提出了针对C3植物的光合作用模型。该模型从Rubisco活性限制和RuBP再生能力限制两方面解释光合作用过程。Rubisco活性限制描述的是受CO2浓度制约时光合作用速率Ac与胞间CO2浓度(Ci)的关系。
${{A}_{\text{c}}}=\frac{{{V}_{\text{cmax}}}({{C}_{\text{i}}}-{{\Gamma }^{*}})}{{{C}_{\text{i}}}+{{K}_{\text{c}}}(1+{{O}_{\text{i}}}/{{K}_{\text{o}}})}$ (4)
当描述光合作用速率(Aj)受RuBP再生的制约时, 其关系表达为:
${{A}_{j}}=\frac{J({{C}_{\text{i}}}-{{\Gamma }^{*}})}{4{{C}_{\text{i}}}+8{{\Gamma }^{*}}}$ (5)
式中, Vcmax表示最大羧化速率(μmol m-2 s-1), J表示RuBP再生速率(μmol m-2 s-1), Kc(μmol mol-1)和Ko(mmol mol-1)分别表示羧化作用和加氧作用的Michaelis-Menten常数, Γ*为不含暗呼吸的CO2补偿点(μmol mol-1), Oi表示胞间O2浓度, 一般为稳定值210 mmol mol-1。在实际条件下, 公式(5)中J与入射光合有效辐射Q存在如下关系:
$\theta {{J}^{2}}-(\alpha Q+{{J}_{\text{max}}})J+\alpha Q{{J}_{\text{max}}}=0$ (6)
式中, Jmax表示最大RuBP再生速率(μmol m-2 s-1), θ表示为表现量子效率, α表示量子产量(mol mol-1)。最后, 实际净光合作用速率An (μmol m-2 s-1)表达为:
${{A}_{\text{n}}}=\min \left\{ {{A}_{\text{c}}},{{A}_{\text{j}}} \right\}-{{R}_{\text{d}}}$ (7)
式中, Rd表示暗呼吸速率(μmol m-2 s-1)。
经研究表明[1,3,6], 该模型中的Kc、Ko、Vcmax、Jmax、Rd、Γ*等参数与叶温存在一定的关系。其中, Kc(μmol mol-1)、Ko(mmol mol-1)与叶温的变化关系可采用Arrhenius方程表达:
$\begin{align}& {{K}_{\text{c}}}={{a}_{1}}\exp \left[ \frac{{{b}_{1}}({{T}_{\text{L}}}-{{T}_{\text{k}}})}{{{T}_{\text{k}}}R{{T}_{\text{L}}}} \right] \\& {{K}_{\text{o}}}={{a}_{2}}\exp \left[ \frac{b{}_{2}({{T}_{\text{L}}}-{{T}_{\text{k}}})}{{{T}_{\text{k}}}R{{T}_{\text{L}}}} \right] \\\end{align}$ (8)
式中, a1、b1和a2、b2分别为方程系数, 其中a1和a2分别代表参考温度Tk下的Kc和Ko值, 这里参考温度Tk设置为298(K), TL为叶片温度(K), R为气体常数8.3143 (J mol-1 K-1)。
对于Vcmax、Jmax和Rd则采用Peaked方程表示:
$f({{T}_{\text{L}}})={{k}_{25}}\exp \left[ \frac{{{E}_{\text{a}}}({{T}_{\text{L}}}-{{T}_{\text{k}}})}{{{T}_{\text{k}}}R{{T}_{\text{L}}}} \right]\frac{1+\exp \left( \frac{{{T}_{\text{k}}}\Delta S-{{H}_{\text{d}}}}{{{T}_{\text{k}}}R} \right)}{1+\exp \left( \frac{{{T}_{\text{L}}}\Delta S-{{H}_{\text{d}}}}{{{T}_{\text{L}}}R} \right)}$ (9)
式中, k25为参考温度25°C时的最大速率, Ea、ΔS和Hd分别为方程系数。Hd描述了在最适温度以上时的衰减率, ΔS代表了熵, Ea为方程系数。
Γ*与叶温变化的关系主要通过如下表达式反映:
${{\Gamma }^{*}}=\frac{{{K}_{\text{c}}}{{V}_{\text{omax}}}{{O}_{\text{i}}}}{2{{K}_{\text{o}}}{{V}_{\text{cmax}}}}$ (10)
式中, Vomax为最大氧气羧化速率。由于Vomax/Vcmax≈ max气, 与温度无关, 因此, Г*与叶温度的变化关系主要由Kc和Ko的关系决定。
在上述生物学参数中, Kc和Ko与叶温之间的关系属于Rubisco酶的本质属性, 因此水稻品种间该特征的差异不明显, 但不同水稻品种Vcmax、Jmax、Rd与温度的关系存在差别, 因此在实际应用中需要针对特定品种获取这些生物学参数的值[1-3,5]。
1.3 实验数据
本文以2012年和2013年水稻品种两优培九的分播期大田试验资料和人工气候控制实验数据为依据, 分析该品种的单叶光合作用速率与温度的关系, 并确定该品种Kc、Ko、Vcmax、Jmax、Rd与温度的函数关系, 绘制单叶光合作用速率与温度的变化曲线。2012年和2013年水稻大田试验情况见文献[21,22]所述。在2年各7个播期的大田试验中, 主要观测了水稻生育期进程、生物量、叶面积、茎蘖动态、籽粒灌浆进程、产量结构和产量。在大田试验期间, 还开展了人工气候控制实验。2012年分别于5月31日和6月10日, 2013年于5月30日和6月6日移栽秧苗至PVC塑料盆钵中, 移栽时秧龄均为4.5叶。盆钵长和宽均为28 cm, 高为30 cm, 下部封底。移栽前1周向盆钵装土至4/5高度, 并随后灌水静置。在移栽前, 搅拌土壤使中上层土壤松软。每盆栽种2穴, 每穴1株。移栽后, 将盆钵放入大田, 使盆钵内土层顶部与大田土层表面大体平齐。盆钵灌水、施肥、喷药等处理与大田管理保持一致。
待水稻生长至抽穗开花期, 将盆钵从大田移至4个人工气候箱内进行控温处理。每批3~4个处理, 每个处理在气候箱内放置5盆。温度处理采用平均温度15~45°C, 每5°C为一个梯度, 白天12 h和夜间12 h温度为平均温度±温度°C。人工气候箱内采用的是红白光源, 在空箱时测得的平均光强为530 μmol m-2 s-1。每个处理持续5 d, 从第3天开始, 陆续从每个处理中挑选3~5片剑叶, 使用3台LI-6400光合仪对叶片的光响应曲线和CO2响应曲线进行了观测。测量时根据所处的温度梯度控制样本室叶片温度, 另外, 在光响应曲线测定中, 参考CO2浓度固定在395 μmol mol-1, 光强梯度设置为1800、1600、1400、1200、1000、800、600、400、300、200、100、80、60、30、0 μmol m-2 s-1。在CO2响应曲线测定时, 光强固定在1400 μmol m-2 s-1, 参考CO2浓度梯度设定为400、300、200、60、200、300、400、600、800、1000、1300、1600 μmol mol-1。
1.4 研究方案
针对特定的水稻品种, 以图3显示的技术方案对ORYZA2000模型中单叶最大总光合作用速率与温度的关系f(Td)进行修订。首先, 采用PHOTOSYNTHESIS.EXE程序[23], 从观测的不同温度梯度下各条光响应曲线和CO2响应曲线中提取各自的特征参数值; 在此基础上, 分析该品种光合作用的生物学特性, 并结合公式(8)和(9), 对Kc、Ko、Vcmax、Jmax和Rd的温度关系进行拟合, 获取各自函数中的参数值。将这些参数值代入到Farquhar等[3]提出的光合作用机制模型中, 模拟单叶总光合作用速率随叶温的变化曲线。然后, 根据空气温度与叶温的关系, 对曲线进行修订, 并对修订后的曲线进行归一化, 替换ORYZA2000模型作物参数文件中的REDFTT参数值。最后, 采用2012年和2013年两优培九的分播期地上部分生物量观测数据对修订后的光合作用模型进行验证, 通过比较修订前后生物量模拟值与观测值的差异, 确认修订方案的有效性。 显示原图|下载原图ZIP|生成PPT
图3修订方案
-->Fig. 3Scheme for parameter value correction
-->
2 结果与分析
2.1 不同温度下叶片的光合作用速率曲线
图4显示了不同温度处理下两优培九剑叶的光响应曲线和CO2响应曲线。从图中可以看出, 两类曲线都表现出明显的温度响应特征。如图4-a显示, 平均温度30°C下的净光合作用水平最高, 其次为平均温度35°C处理下的, 而15°C处理下的净光合作用水平最低, 在光强1200 μmol m-2 s-1处, 比30°C下相应位置净光合速率低约60%, 表明该低温水平在较大程度上已影响到叶片的光合作用能力。对于其他温度处理下的, 其在接近光饱和点的净光合作用速率, 相比30°C处理下的平均低30%~50%。图4-b则显示了各温度处理水平下, 净光合作用速率随胞间CO2浓度的变化。从图中可以看出, 平均温度15°C和20°C处理下的叶片净光合作用速率水平较低, 其中15°C处理下的处于最低水平, 其最大净光合作用水平低于16.1 μmol m-2 s-1。在所有温度处理中, 平均温度35°C和40°C处理下的叶片净光合作用速率水平最高, 其次为45°C处理, 30°C和25°C处理下的净光合作用速率水平相当, 但低于45°C处理下的结果。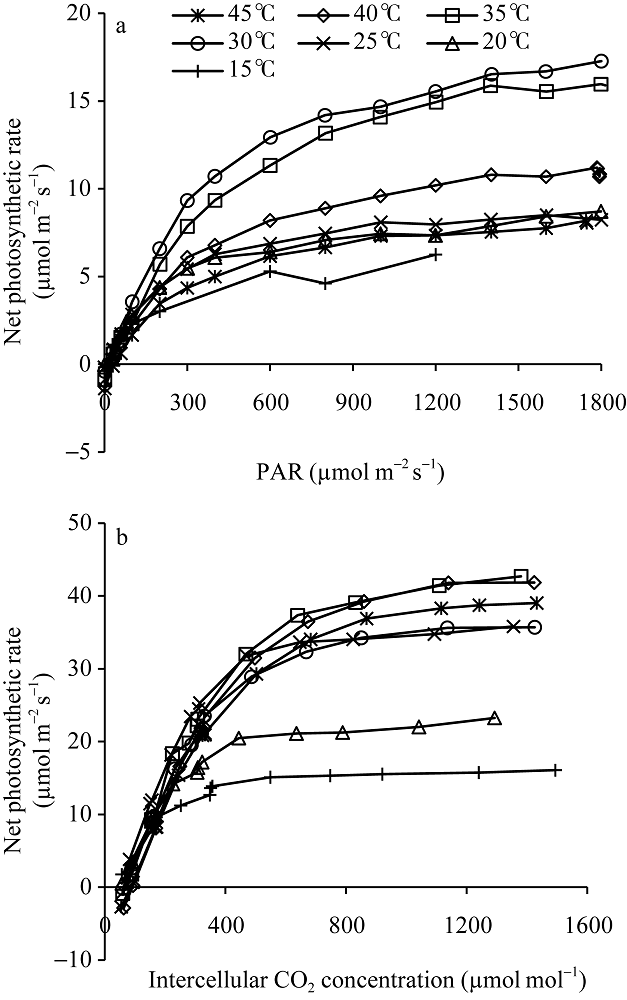 显示原图|下载原图ZIP|生成PPT
图4不同温度梯度下两优培九在抽穗开花期剑叶的光响应曲线(a)和CO2响应曲线(b)
-->Fig. 4Light response curve (a) and CO2 response curve of green leaf (b) of Liangyoupeijiu at heading stage under different temperature treatments
-->
2.2 叶片光合作用特征与温度的关系
根据不同温度梯度下两优培九剑叶光响应曲线和CO2响应曲线的观测结果, 采用PHOTOSYNTHESIS.EXE从曲线中提取了光合作用特征参数值。从图5可以看出, 光饱和点随着温度处理水平的增加, 呈现逐步增加再降低的趋势, 在35°C处理下, 光饱和点达到最大, 平均超过1500 μmol m-2 s-1, 而在15°C处理下, 平均光饱和点低于1250 μmol m-2 s-1, 且标准差最大。该结果表明, 两优培九对强光的利用能力在35°C左右达到最大。相比光饱和点, 光补偿点随温度处理水平的变化未表现出明显的趋势, 但大体上, 光补偿点在一定范围内随着温度升高而升高。15°C处理下光补偿点最低, 平均低于2 μmol m-2 s-1。40°C处理下光补偿点最高, 平均达到14.4 μmol m-2 s-1。从最大光合作用速率随温度处理水平的变化看, 25°C、30°C和35°C处理水平下的平均最大光合作用速率相近, 达到24 μmol m-2 s-1左右, 且明显高于其他温度处理。15°C处理下的最大光合作用速率低于13 μmol m-2 s-1。由于最大光合作用速率表示的是叶片潜在的最大光合能力, 可见低温对叶片的光合作用不利。表观量子效率是在弱光条件下光量子的转化效率, 一般取值在0.03~0.05之间[1]。 显示原图|下载原图ZIP|生成PPT
图5从光响应曲线中提取的水稻光合作用特征参数值随温度处理的变化
(a)为光饱和点; (b)为光补偿点; (c)为最大光合作用速率; (d)为表现量子效率; (e) Rd。图中柱状图数值为平均值, 竖线表示标准差。
-->Fig. 5Changes of characteristic values retrieved from light response curves of rice with different temperature treatments
(a) Light saturation point; (b) Light compensation point; (c) Maximum photosynthesis rate; (d) Apparent quantum efficiency; (e) Rd. Mean values with standard deviations (vertical bars) are shown in the bar charts.
-->
从图5-d可以看出, 表观量子效率随着温度处理水平的提升, 呈现逐步下降的变化趋势, 表明高温环境会抑制低光下光量子的转化效率。图5-e显示Rd在所有温度处理下其平均值均小于0.8 μmol m-2 s-1。但其值随温度处理水平的升高, 主要呈增加趋势。在35°C水平及以上处理时, Rd降低。研究显示, Rd对温度变化敏感, 在温度水平较低时, 呼吸作用酶活性下降, 代谢变慢, 因此暗呼吸速率降低, 但随着温度的升高, 呼吸消耗呈非线性增大。
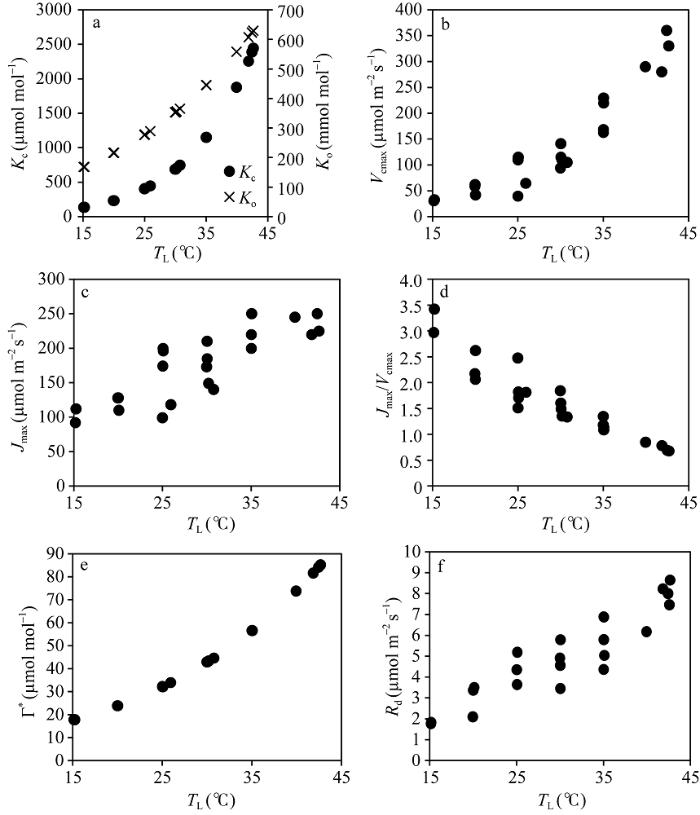
从图6中可以看出, Kc、Ko和Γ*与TL的散点关系完全符合各自特定的函数, 这主要是由于Kc和Ko与TL的关系与观测品种无关, 属于Rubisco酶的本质属性, 同时Γ*与TL的关系又主要由Kc和Ko决定, 因此, 上述散点关系符合各自特定函数。Vcmax和Jmax与TL的散点关系各自表现出不同的特征。Vcmax与TL的散点关系表现出随TL的增加而近似线性增加, Jmax与TL的散点关系表现为随TL的增加而增加, 但当TL接近35°C后, Jmax几乎不再增加。尽管两者与TL的变化表现出不同的规律, 但两者比值(Jmax/Vcmax)与TL呈现出几乎线性的关系, 即随TL的增加而减小, 变化在0.5~3.5间, 其斜率为-0.0813, 表明Vcmax与Jmax之间存在显著的相关性。图6-f显示了Rd随TL的变化, 两者散点关系相对离散, 但大体呈现出非线性的变化特征, 即随TL的增加而非线性增加。当TL在约42°C时, 叶片Rd几乎约为15°C下TL的5倍。
 显示原图|下载原图ZIP|生成PPT
图6从CO2响应曲线中提取的水稻光合作用特征参数值随叶温的变化
-->Fig. 6Changes of characteristic values retrieved from CO2 response curves of rice with leaf temperatures
(a) Kc and Ko; (b) Vcmax; (c) Jmax; (d) Jmax/Vcmax; (e) Γ*; (f) Rd.
-->
2.3 叶片光合作用速率的温度响应
依据公式(8)和(9), 采用最小二乘法确定了Kc、Ko、Vcmax、Jmax、Rd与TL的关系, 获取了如表1所列的各方程参数值。将确定的各参数温度关系方程代入Farquhar等[3]光合作用机理模型, 模拟了PAR达到1400 μmol m-2 s-1, 胞间CO2浓度为340 μmol mol-1下An和An+Rd随TL的变化(图7)。同时还模拟了PAR为1400 μmol m-2 s-1, 胞间CO2浓度从320 μmol mol-1到400 μmol mol-1, 每20 μmol mol-1一个间隔下的An和An+Rd随TL的变化(图8)。Table 1
表1
表1光合作用特征参数的温度影响方程参数值
Table 1Parameter values in temperature response functions for photosynthetic parameters
| 光合作用参数 Photosynthetic parameter | 方程参数 Function parameter | 参数值 Parameter value | R2 |
|---|---|---|---|
| Kc | a1 | 406.3 μmol m-2 s-1 | 1.0 |
| b1 | 79.48 kJ mol-1 | ||
| Ko | a1 | 277.2 mmol m-2 s-1 | 1.0 |
| b1 | 36.31 kJ mol-1 | ||
| Vcmax | k25 | 115.0 μmol m-2 s-1 | 0.93 |
| Ea | 65.1 kJ mol-1 | ||
| ΔS | 607.4 J mol-1 | ||
| Hd | 200 kJ mol-1 | ||
| Jmax | k25 | 230 μmol m-2 s-1 | 0.89 |
| Ea | 35.44 kJ mol-1 | ||
| ΔS | 626.3 J mol-1 | ||
| Hd | 198.7 kJ mol-1 | ||
| Rd | k25 | 3.25 μmol m-2 s-1 | 0.92 |
| Ea | 39.35 kJ mol-1 | ||
| ΔS | 0.084 J mol-1 | ||
| Hd | 33.3 J mol-1 |
新窗口打开
 显示原图|下载原图ZIP|生成PPT
图7An、Rd和An+Rd随TL的变化
模拟设定光合有效辐射(PAR)为1400 μmol m-2 s-1, 胞间CO2浓度(Ci)为340 μmol mol-1。
-->Fig. 7Changes of An, Rd, and An+Rd with TL
Assuming PAR=1400 μmol m-2 s-1, Ci=340 μmol mol-1.
-->
 显示原图|下载原图ZIP|生成PPT
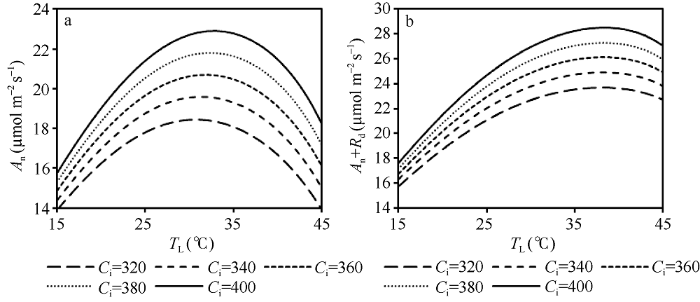
图8不同Ci浓度下An、Rd和An+Rd随TL的变化
模拟设定光合有效辐射(PAR)为1400 μmol m-2 s-1。
-->Fig. 8Changes of An, Rd, and An+Rd with TL under different concentration of Ci
Assuming PAR=1400 μmol m-2 s-1.
-->
从图7可以看出, An随TL的变化呈先增大后减小的“钟型”曲线, 最适温度出现在约31°C, 此时An约为19.6 μmol m-2 s-1。当An曲线叠加Rd曲线后, 得到An+Rd随TL的变化曲线, 即总光合作用速率随叶温的变化曲线, 其曲线线型类似于An, 但其最适温度向更高的方向偏移, 约在38°C, 此时An+Rd的值约为24.9 μmol m-2 s-1。可见随着TL的升高呼吸增加的速率比净光合作用速率快, 使得总光合作用速率的最适温度高于净光合作用速率。从图8可以看出, An和An+Rd的曲线水平都随着Ci的增加而增加, 但仅An的最适温度出现随Ci的增加向后推移的现象, 即在对应的Ci浓度下, An的最适温度分别出现在约31°C、31°C、32°C、32°C和33°C, 而An+Rd的最适温度在各Ci浓度下均约为38°C, 未表现出明显的变化。
2.4 参数订正及验证
在图7中显示了An+Rd随TL的变化, 即单叶在饱和光强下总光合作用速率随叶温的变化规律。然而, ORYZA2000模型为总光合同化速率Am与Td建立了函数关系。这里Td为白天平均温度, 其计算方法为日最高温度与日平均温度的平均。考虑到在固定环境CO2浓度和叶片氮含量SN条件下, 公式(2)可简化为Am与Td的线性函数关系: Am=k×f(Td) + 9.5, 其中k为斜率。因此, 根据观测时叶温TL与空气温度Ta的经验关系(图9), 对TL进行了转换, 获取An+Rd与Ta的曲线关系, 并对其进行归一化, 替换由f(Td)表示的温度影响系数表。图9-b显示了归一化后的f(Ta)。在Ta接近40°C时, f(Ta)达到1.0。当Ta为13.9°C时, f(Ta)为0。 显示原图|下载原图ZIP|生成PPT
图9从观测中获取的叶温TL与空气温度Ta的关系曲线(a)和随空气温度Ta变化的温度影响系数曲线(b)
-->Fig. 9Relationship between leaf temperature TL and air temperature Ta (a) and Change of temperature effect coefficient with air temperature Ta (b)
-->
将归一化后的f(Td)从14°C开始至44°C, 每隔2°C生成温度影响系数列表赋值给参数REDFTT。为了验证参数修订的有效性, 对REDFTT参数值替换前后地上部分生物量的模拟结果进行了比较。验证数据为2012年和2013年两优培九地上部分生物量(WAGT)观测数据。在验证前, 对两优培九的生育期参数、干物质分配系数、相对叶面积增长速率、茎秆存留系数、比叶面积系数等均进行了标定[21,22]。然后, 利用定标后的ORYZA2000模型, 以潜在生长模式模拟了逐日WAGT, 最后用与观测日期对应的模拟值(WAGTsim)和实测值(WAGTobs)计算相对误差re, 公式为:
${{r}_{\text{e}}}=\frac{WAG{{T}_{\text{sim}}}-WAG{{T}_{\text{obs}}}}{WAG{{T}_{\text{obs}}}}$ (11)
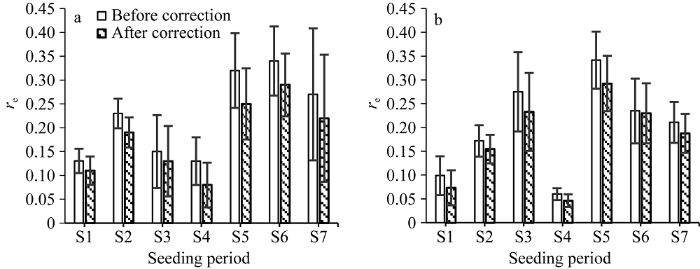
图10显示了REDFTT参数值替换前后WAGT模拟值与实测值的对比。从图10可以看出, 修改前各播期的re平均值都高于修改后的, 表明对REDFTT参数值进行订正能够有效降低CO2同化量的模拟误差, 且修订前后所有播期WAGT的模拟误差在配对样本T检验中均表现出0.05水平的显著性差异。据统计, 2012年所有播期re平均降低约4%, 2013年则平均降低约2.5%。尽管降低的幅度相对较小, 但依旧说明对光合作用模型的温度影响参数进行调整有助于改进模型模拟的精度。
 显示原图|下载原图ZIP|生成PPT
图10REDFTT参数值修改前后WAGT模拟值与实测值的相对误差
(a) 2012年; (b) 2013年。竖线表示标准偏差。
-->Fig. 10Relative errors of simulated WAGT with observations before and after the modification of parameter values of REDFTT
(a) for 2012; (b) for 2013. Vertical bar is standard deviation.
-->
3 讨论
温度影响光合作用中的最大羧化速率、RuBP再生速率、暗呼吸速率等生物学参数, 建立这些参数的温度影响函数对定量分析和模拟单叶光合作用速率随温度的变化具有重要意义, 同时还可以通过该方法确立特定水稻品种单叶最大光合作用速率的“三基点温度”。从本文的研究结果看, 在当前大气CO2浓度水平下, 两优培九单叶最大净光合作用速率在饱和光强下的最适温度约为31°C, 且随胞间CO2浓度的增加有微小的增高; 同样环境下, 最大总光合作用速率的最适温度约为38°C, 与胞间CO2浓度变化关系不明显。依据最大总光合作用速率与温度的关系, 修订了ORYZA2000模型中最大光合作用速率温度影响参数的参数值。从修订前后地上部分生物量模拟结果对比看, 提出的修订方法对干物质积累的模拟精度有一定的提高。然而, 值得提出的是, 本文仅对抽穗开花期的情况进行了分析, 对于其他生育期的情况缺乏相应的观测数据。有文献显示[24], 叶片光合作用速率随叶片生理年龄的变化而变化, 因此, 在ORYZA2000模型中, 对全生育期采用一套相同的温度影响参数, 潜在增加了模拟结果的不确定性, 可能是导致修订后相对误差re减小幅度有限的主要原因。考虑到不同生育期光合作用速率对温度变化的响应不同, 因此, 增加其他关键生育期叶片光合作用的观测有助于完善作物模型中的光合作用模拟模块。另外, 在结合机理性光合作用模型建立最大总光合作用速率与温度的关系时, 暗呼吸速率的计算方程不同于ORYZA2000模型中维持性呼吸速率的计算方程[25]。在ORYZA2000模型中, 维持性呼吸速率的计算采用的是幂指数函数, 且用于整个水稻冠层呼吸速率的计算, 不同于单叶暗呼吸速率的计算方程。从两个方程归一化后的曲线线型看, 也存在一定的差异。因此, 潜在影响了参数修订后模拟结果的精度。
后续研究将尝试在作物模型中引入机理性光合作用模型。例如, 采用耦合方法将双叶大叶模型替换作物模型中的光效率模型, 替换后不但能够从机制上模拟叶片到冠层的光合作用速率, 还能够更准确地模拟环境因子, 如温度、湿度、风和CO2浓度等对作物光合作用的影响。因此, 本文提出的叶片光合作用数据分析方法和温度影响参数修订方法, 为后续研究提供了重要的基础。另外, 本研究所选水稻品种单一, 未考虑不同水稻品种的差异, 因此在后续研究中, 还将针对更多代表性品种进行光合作用参数的定标。
4 结论
结合不同温度梯度下的水稻光合作用数据和机理性光合作用模型, 建立了针对特定水稻品种单叶最大光合作用速率的温度影响曲线, 并利用该曲线关系对水稻作物模型ORYZA2000中相应的参数值进行了订正。本文提出的修订方法具有一定的有效性。尽管修订后的相对误差减小幅度平均低于5%, 但对基于光效率模型的温度影响参数本地化处理提供了重要的技术参考, 也为分析和提取不同品种光合作用的温度依存性特征提供了依据。The authors have declared that no competing interests exist.
作者已声明无竞争性利益关系。
参考文献 原文顺序
文献年度倒序
文中引用次数倒序
被引期刊影响因子
| [1] | . |
| [2] | . 综述了植物光合作用与温度响应模型研究的进展,围绕光合作用生化 模型的4个主要参数:胞间CO2浓度、RuBP最大碳同化速率(Vc max)的活化能、RuBP最大再生速率(Jmax)的活化能和Jmax/Vc max,讨论了影响光合作用-温度响应曲线的内在机理.随着生长温度的升高,所有物种的Vx max活化能均呈增加趋势,而其他参数的变化因物种不同而存在明显差异,说明Vmax的活化能可能是决定光合作用温度依存性的首要参数.最后分析了研究中 存在的问题并提出研究展望,认为应整合叶片与群落水平的光合作用模型,从叶面积、太阳辐射、冠层结构、冠层小气候和光合能力等方面研究植物群落对全球变化 的响应机理.这对于人们理解和准确估算植物生长、群落碳收支和生态系统初级生产力具有重要意义. . 综述了植物光合作用与温度响应模型研究的进展,围绕光合作用生化 模型的4个主要参数:胞间CO2浓度、RuBP最大碳同化速率(Vc max)的活化能、RuBP最大再生速率(Jmax)的活化能和Jmax/Vc max,讨论了影响光合作用-温度响应曲线的内在机理.随着生长温度的升高,所有物种的Vx max活化能均呈增加趋势,而其他参数的变化因物种不同而存在明显差异,说明Vmax的活化能可能是决定光合作用温度依存性的首要参数.最后分析了研究中 存在的问题并提出研究展望,认为应整合叶片与群落水平的光合作用模型,从叶面积、太阳辐射、冠层结构、冠层小气候和光合能力等方面研究植物群落对全球变化 的响应机理.这对于人们理解和准确估算植物生长、群落碳收支和生态系统初级生产力具有重要意义. |
| [3] | . |
| [4] | . Abstract The internal conductance to CO(2) transfer from intercellular spaces to chloroplasts poses a major limitation to photosynthesis, but few studies have investigated its temperature response. The aim of this study was to determine the temperature response of photosynthesis and internal conductance between 10 degrees C and 35 degrees C in seedlings of a deciduous forest tree species, Quercus canariensis. Internal conductance was estimated via simultaneous measurements of gas exchange and chlorophyll fluorescence ("variable J method"). Two of the required parameters, the intercellular photocompensation point (C(i)*) and rate of mitochondrial respiration in the light (R(d)), were estimated by the Laisk method. These were used to calculate the chloroplastic photocompensation point (Gamma*) in a simultaneous equation with g(i). An independent estimate of internal conductance was obtained by a novel curve-fitting method based on the curvature of the initial Rubisco-limited portion of an A/C(i) curve. The temperature responses of the rate of Rubisco carboxylation (V(cmax)) and the RuBP limited rate of electron transport (J(max)) were determined from chloroplastic CO(2) concentrations. The rate of net photosynthesis peaked at 24 degrees C. C(i)* was similar to reports for other species with a C(i)* of 39 micromol mol(-1) at 25 degrees C and an activation energy of 34 kJ mol(-1). Gamma* was very similar to the published temperature response for Spinacia oleracea from 20 degrees C to 35 degrees C, but was slightly greater at 10 degrees C and 15 degrees C. J(max) peaked at 30 degrees C, whereas V(cmax) did not reach a maximum between 10 degrees C and 35 degrees C. Activation energies were 49 kJ mol(-1) for V(cmax) and 100 kJ mol(-1) for J(max). Both methods showed that internal conductance doubled from 10 degrees C to 20 degrees C, and then was nearly temperature-independent from 20 degrees C to 35 degrees C. Hence, the temperature response of internal conductance could not be fitted to an Arrhenius function. The best fit to estimated g(i) was obtained with a three-parameter log normal function (R(2)=0.98), with a maximum g(i) of 0.19 mol m(-2) s(-1) at 29 degrees C. |
| [5] | |
| [6] | . The temperature dependence of the photosynthetic parameters V-cmax, the maximum catalytic rate of the enzyme Rubisco, and J(max), the maximum electron transport rate, were examined using published datasets. An Arrehenius equation, modified to account for decreases in each parameter at high temperatures, satisfactorily described the temperature response for both parameters. There was remarkable conformity in V-cmax and J(max) between all plants at T-leaf 30 degreesC. For both normalized V (cmax) and J (max) , the maximum fractional error introduced by assuming a common temperature response function is 30 degreesC. The ratio J(max) /V-cmax varies with temperature, but analysis of the ratio at T-leaf = 25 degreesC using the fitted mean temperature response functions results in J (max0)/V-cmax0 = 2.00 +/- 0.60 (SD, n = 43). |
| [7] | . 61 Background and Aims Influences of rising global CO60 concentration and temperature on plant growth and ecosystem function have become major concerns, but how photosynthesis changes with CO60 and temperature in the field is poorly understood. Therefore, studies were made of the effect of elevated CO60 on temperature dependence of photosynthetic rates in rice (Oryza sativa) grown in a paddy field, in relation to seasons in two years. 61 Methods Photosynthetic rates were determined monthly for rice grown under free-air CO60 enrichment (FACE) compared to the normal atmosphere (570 vs 370 08mol mol6301). Temperature dependence of the maximum rate of RuBP (ribulose-1, 5-bisphosphate) carboxylation (Vcmax) and the maximum rate of electron transport (Jmax) were analysed with the Arrhenius equation. The photosynthesis-temperature response was reconstructed to determine the optimal temperature (Topt) that maximizes the photosynthetic rate. 61 Key Results and Conclusions There was both an increase in the absolute value of the light-saturated photosynthetic rate at growth CO60 (Pgrowth) and an increase in Topt for Pgrowth caused by elevated CO60 in FACE conditions. Seasonal decrease in Pgrowth was associated with a decrease in nitrogen content per unit leaf area (Narea) and thus in the maximum rate of electron transport (Jmax) and the maximum rate of RuBP carboxylation (Vcmax). At ambient CO60, Topt increased with increasing growth temperature due mainly to increasing activation energy of Vcmax. At elevated CO60, Topt did not show a clear seasonal trend. Temperature dependence of photosynthesis was changed by seasonal climate and plant nitrogen status, which differed between ambient and elevated CO60. |
| [8] | . 在已建立的土壤-植被-大气传输(SVAT)模型中,冠层光合作 用/气孔导度耦合子模型可区分遮荫叶和受光叶光合作用强度的差异;作物生长子模型考虑了作物生长呼吸和维持呼吸.模拟与实测结果对比发现,日总蒸散量实测 和模拟的根均方差(RMSD)为0.65mm,平均绝对差(MAPD)为14%;对冠层上部净光合作用率日变化过程而言,实测和模拟结果具有较好的一致 性.利用模型模拟了冬小麦全生育期净光合作用率和蒸散的演变过程.最后,分析了冬小麦蒸散和水分利用效率对不同最大叶面积指数、大气CO2浓度和叶片N含 量的响应. . 在已建立的土壤-植被-大气传输(SVAT)模型中,冠层光合作 用/气孔导度耦合子模型可区分遮荫叶和受光叶光合作用强度的差异;作物生长子模型考虑了作物生长呼吸和维持呼吸.模拟与实测结果对比发现,日总蒸散量实测 和模拟的根均方差(RMSD)为0.65mm,平均绝对差(MAPD)为14%;对冠层上部净光合作用率日变化过程而言,实测和模拟结果具有较好的一致 性.利用模型模拟了冬小麦全生育期净光合作用率和蒸散的演变过程.最后,分析了冬小麦蒸散和水分利用效率对不同最大叶面积指数、大气CO2浓度和叶片N含 量的响应. |
| [9] | . |
| [10] | . Rice–wheat (RW) systems are critical to food security and livelihoods of rural and urban poor in south Asia and China, and to regional economies in southeast Australia. The sustainability of RW systems in south Asia is, however, threatened by yield stagnation or decline, and declining partial factor productivity, soil organic C and water availability. Crop models potentially offer a means to readily explore management options to increase yield, and to determine trade-off between yield, resource-use efficiency and environmental outcomes. This paper reviews the performance of CERES-Rice and CERES-Wheat in Asia and Australia in relation to their potential application towards increasing resource use efficiency and yield of RW systems. The performance of the models was evaluated using simulated and observed data on anthesis and maturity dates, in-season LAI and growth, final grain yield and its components, and soil water and N balances from published studies across Asia and Australia, and then by computing the statistical parameters for the major characters. Over the four data sets examined for anthesis and six for maturity dates, CERES-Rice predicted those dates fairly well (normalised RMSE = 4–5%; D-index = 0.94–0.95), but over the 11 sets for grain and 4 for biomass yield, the predictions were more variable (normalised RMSE = 23% for both; D-index 0.90 and 0.76, for grain and biomass, respectively). Model performance was poorer under conditions of low N, water deficit, and low temperatures during the reproductive stages. Over the three data sets examined, CERES-Wheat predicted the anthesis and maturity dates quite well (normalised RMSE = 4–5%; D-index = 0.94–0.99), and over eight sets for grain and two sets for biomass yield the model predicted them also reasonably well (RMSE = 13–16%; D-index = 0.86–0.97). Only one study evaluated the DSSAT RW sequence model with fairly satisfactory predictions of rice and wheat yields over 20 years with adequate N, but not the long-term change in soil organic C and N. Predictions of in-season LAI and crop growth, and soil and water processes were quite limited to investigate the robustness of model processes. Application of models to evaluate options to increase water and N use efficiency requires the ability to perform well at the margin where deficit stress begins. While both models generally perform satisfactorily under water and N non-limiting conditions, the little evidence available suggests that they do not perform well under resource-limiting situations. We recommend that the models’ key processes under the water and N limiting conditions be further evaluated urgently. The DSSAT sequence model also needs to be further evaluated against observations for a range of locations and management using data from long-term experiments in RW systems. |
| [11] | . |
| [12] | . 61APSIM is an agricultural modelling framework used extensively worldwide.61It can simulate a wide range of agricultural systems.61It begins its third decade evolving into an agro-ecosystem framework. |
| [13] | . Various crop growth simulation models exist for rice but thorough validation and evaluation reports are scarce. We present the model ORYZA2000, which simulates the growth and development of rice under conditions of potential production and water and nitrogen limitations. The model was evaluated against a data set of five field experiments with irrigated rice performed at IRRI between 1991 and 1993, with nitrogen levels varying from 0 to 400 kg ha 611 in different splits and timings of application. We compared simulated and measured leaf area index (LAI) and biomass of leaves, stems, panicles, and total aboveground biomass by graphics; by the slope, intercept, and adjusted coefficient of correlation; by Student’s t test of means; and by absolute and normalized root mean square errors (RMSE). On average, RMSE was 690–1280 kg ha 611 for total biomass, 350–380 kg ha 611 for leaf biomass, 460–790 kg ha 611 for stem biomass, and 380–580 kg ha 611 for panicle biomass. Yield was simulated with an RMSE of 840–850 kg ha 611 and a normalized RMSE of 11–13%. For these crop variables, normalized RMSE values were 65–84% higher than the typical coefficients of variation associated with their measurements. Simulated LAI generally exceeded measured values, especially at low levels of nitrogen application. We can use ORYZA2000 to support N field experiments and investigate optimum N application regimes with quantified errors of simulation. The developed database and quantitative goodness-of-fit parameters serve as references for future model improvements. |
| [14] | . 光响应曲线是判定植物光合效率的重要方法,通过曲线可以获得植物光合特性的相关生理参数,但不同模型提取的光响应参数和指标存在差异.本文选择直角双曲线、非直角双曲线和两种指数曲线模型,分别对3个品系常绿杨光响应数据进行拟合,提取了各光响应曲线模型的主要特征参数,对比分析了各模型参数间的差异,并对光饱和点(LSP)的不同计算方法进行了讨论.最后用巨尾桉光响应数据对分析结果作了进一步验证.结果表明,直角和非直角双曲线模型拟合的最大净光合速率(P'max)、表观量子效率(a)及暗呼吸速率(Rd)值高于指数模型拟合值,且直角双曲线拟合的各参数均比非直角双曲线拟合的各参数的值大,而两指数模型各参数拟合值基本一致;在LSP计算方法中,用光通量 200 μmol·m-2·s-1以下的点拟合的Pn-I直线与其它模型相结合得到光饱和点的方法不可靠,会使计算结果明显偏小,用接近最大总光合速率Pmax一定比例的方法估计LSP也存在较大偏差,而P'max由于消除了Rd的影响,计算光饱和点时各模型的估计比例相对固定,是一个比较理想的LSP估计方法,初步得出直角、非直角及指数模型用P'max来估计光饱和点时应选取的比例分别为(78±1)%、*82±1)%及(96±1)%. . 光响应曲线是判定植物光合效率的重要方法,通过曲线可以获得植物光合特性的相关生理参数,但不同模型提取的光响应参数和指标存在差异.本文选择直角双曲线、非直角双曲线和两种指数曲线模型,分别对3个品系常绿杨光响应数据进行拟合,提取了各光响应曲线模型的主要特征参数,对比分析了各模型参数间的差异,并对光饱和点(LSP)的不同计算方法进行了讨论.最后用巨尾桉光响应数据对分析结果作了进一步验证.结果表明,直角和非直角双曲线模型拟合的最大净光合速率(P'max)、表观量子效率(a)及暗呼吸速率(Rd)值高于指数模型拟合值,且直角双曲线拟合的各参数均比非直角双曲线拟合的各参数的值大,而两指数模型各参数拟合值基本一致;在LSP计算方法中,用光通量 200 μmol·m-2·s-1以下的点拟合的Pn-I直线与其它模型相结合得到光饱和点的方法不可靠,会使计算结果明显偏小,用接近最大总光合速率Pmax一定比例的方法估计LSP也存在较大偏差,而P'max由于消除了Rd的影响,计算光饱和点时各模型的估计比例相对固定,是一个比较理想的LSP估计方法,初步得出直角、非直角及指数模型用P'max来估计光饱和点时应选取的比例分别为(78±1)%、*82±1)%及(96±1)%. |
| [15] | . 作物模型参数的敏感性分析、标定和验证可以提高模型的效率和精准度,进而为模型应用做好准备工作。该研究结合参数全局敏感性分析方法以及贝叶斯后验估计理论的马尔科夫蒙特卡洛(Markov Chain Monte Carlo,MCMC)方法,以华北栾城站三年的冬小麦观测数据(叶面积和地上生物量)为参照,对WOFOST模型的55个品种参数进行了敏感性分析、筛选和优化。发现:1)对叶面积影响较大的参数为:生育期为0、0.5、0.6和0.75时的比叶面积、生育期为1.5时的最大光合速率、叶面积指数最大增长率;对地上干物质影响较大的参数为:生育期为1.5时的最大光合速率、生育期为0时的比叶面积、35℃时叶面积的生命周期、生育期为0时的散射消光系数、生育期为1.8时的最大光合速率、储存器官的同化物转换效率。2)潜在和雨养产量水平下,最大叶面积和地上生物量对参数的敏感性差异不大。3)马尔科夫蒙特卡洛方法(MCMC)可以对WOFOST模型品种参数较好地优化;设计的3种校正-验证方案中,第1种方案(用1998-1999年作为校正年份,1999-2000年,2000-2001年作为验证年份)模拟效果最好。4)优化后的参数,模型对潜在产量水平模拟较好,一致性指数均大于0.9,相对均方根误差小于20%;而对有水分胁迫的雨养情况下比潜在产量水平的模拟结果差,表明模型对水分胁迫的模拟不足。该研究为WOFOST模型区域应用和模型调整优化提供科学理论依据。 . 作物模型参数的敏感性分析、标定和验证可以提高模型的效率和精准度,进而为模型应用做好准备工作。该研究结合参数全局敏感性分析方法以及贝叶斯后验估计理论的马尔科夫蒙特卡洛(Markov Chain Monte Carlo,MCMC)方法,以华北栾城站三年的冬小麦观测数据(叶面积和地上生物量)为参照,对WOFOST模型的55个品种参数进行了敏感性分析、筛选和优化。发现:1)对叶面积影响较大的参数为:生育期为0、0.5、0.6和0.75时的比叶面积、生育期为1.5时的最大光合速率、叶面积指数最大增长率;对地上干物质影响较大的参数为:生育期为1.5时的最大光合速率、生育期为0时的比叶面积、35℃时叶面积的生命周期、生育期为0时的散射消光系数、生育期为1.8时的最大光合速率、储存器官的同化物转换效率。2)潜在和雨养产量水平下,最大叶面积和地上生物量对参数的敏感性差异不大。3)马尔科夫蒙特卡洛方法(MCMC)可以对WOFOST模型品种参数较好地优化;设计的3种校正-验证方案中,第1种方案(用1998-1999年作为校正年份,1999-2000年,2000-2001年作为验证年份)模拟效果最好。4)优化后的参数,模型对潜在产量水平模拟较好,一致性指数均大于0.9,相对均方根误差小于20%;而对有水分胁迫的雨养情况下比潜在产量水平的模拟结果差,表明模型对水分胁迫的模拟不足。该研究为WOFOST模型区域应用和模型调整优化提供科学理论依据。 |
| [16] | . . |
| [17] | . |
| [18] | . 选择长江中下游平原作为研究区域,按照政府间气候变化专业委员会(IPCC)排放情景特别报告(SRES)中的A2和B2方案,将基于区域气候模式PRECIS构建的气候变化情景文件与水稻生长模型ORYZA2000结合,模拟基准时段(1961—1990)气候(Baseline)和2021—2050时段A2、B2情景下的水稻产量,分析未来气候变化对长江中下游水稻产量的影响。构建两种影响评估方法,重点分析增温和大气CO2肥效作用对水稻产量的影响。结果表明,不考虑CO2肥效作用时,随着温度升高,水稻生育期缩短,产量下降。A2情景下水稻生育期平均缩短4.5d,产量减少15.2%;B2情景下平均缩短3.4d,产量减少15%。其中,减产达到20%以上的区域集中在安徽中南部、湖北东南部和湖南东部地区。当考虑CO2肥效作用后,A2情景下水稻平均产量减少5.1%,B2情景平均减少5.8%。减产区域缩小且幅度降低,江西和浙江部分地区则呈现一定程度增产,但增幅10%。大气CO2肥效作用一定程度上可提高水稻产量,使晚稻在增温的不利影响下仍呈现不同程度的增产态势,但对单季稻和早稻的增产贡献仍不足以抵消升温的负面影响。另外,大气CO2肥效作用可有利于提高未来气候变化下水稻的稳产性。 . 选择长江中下游平原作为研究区域,按照政府间气候变化专业委员会(IPCC)排放情景特别报告(SRES)中的A2和B2方案,将基于区域气候模式PRECIS构建的气候变化情景文件与水稻生长模型ORYZA2000结合,模拟基准时段(1961—1990)气候(Baseline)和2021—2050时段A2、B2情景下的水稻产量,分析未来气候变化对长江中下游水稻产量的影响。构建两种影响评估方法,重点分析增温和大气CO2肥效作用对水稻产量的影响。结果表明,不考虑CO2肥效作用时,随着温度升高,水稻生育期缩短,产量下降。A2情景下水稻生育期平均缩短4.5d,产量减少15.2%;B2情景下平均缩短3.4d,产量减少15%。其中,减产达到20%以上的区域集中在安徽中南部、湖北东南部和湖南东部地区。当考虑CO2肥效作用后,A2情景下水稻平均产量减少5.1%,B2情景平均减少5.8%。减产区域缩小且幅度降低,江西和浙江部分地区则呈现一定程度增产,但增幅10%。大气CO2肥效作用一定程度上可提高水稻产量,使晚稻在增温的不利影响下仍呈现不同程度的增产态势,但对单季稻和早稻的增产贡献仍不足以抵消升温的负面影响。另外,大气CO2肥效作用可有利于提高未来气候变化下水稻的稳产性。 |
| [19] | . Because of the possibility of plant stress at critical stages known to be sensitive to water deficit (panicle initiation (PI) and flowering (FL)), treatments with additional irrigations were superimposed for 2 weeks at one or both of these stages within the 10, 20 and 3002kPa AWD treatments. Ponding for two weeks at FL was more effective in reducing the yield penalty with AWD than ponding at PI, but the biggest improvement was with ponding at both stages. This reduced the average yield loss from 9% (0.802t02ha 611 ) to 5% (0.502t02ha 611 ) for AWD with thresholds of 10 and 2002kPa. However, maximum WP I (1.102g02kg 611 ) was achieved with an irrigation threshold of 2002kPa combined with more frequent irrigation at FL only, but with a greater yield penalty (8%). Thus the optimum irrigation schedule depends on whether the objective is to maximise yield, WP ET or WP I , which depends on whether land or water are most limiting. Furthermore, the optimum irrigation schedule to meet the short term needs of individual farmers may differ from that needed for sustainable water resource management. |
| [20] | . The worldwide usage of and increasing citations for ORYZA2000 has established it as a robust and reliable ecophysiological model for predicting the growth and yield of rice in an irrigated lowland ecosystem. Because of its focus on irrigated lowlands, its computation ability is limited to the representation of the effects of the highly dynamic environments of upland, rainfed, and aerobic ecosystems on rice growth and yield. Additional modules and routines to quantify daily variations in soil temperature, carbon, nitrogen, and environmental stresses were then developed and integrated into ORYZA2000 to capture their effects on primary production, assimilate allocation, root growth, and water and nitrogen uptake. The newest version has been renamed “ORYZA version 3 (v3)”. Case studies have shown that the root mean square errors (RMSE) between simulated and measured values for total biomass and yields ranged from 11.2% to 16.6% across experiments in non-drought and drought and/or nitrogen-deficient environments. ORYZA (v3) showed a significant reduction of the RMSE by at least 20%, thereby improving the model’s capability to represent values measured under extreme conditions. It has also been significantly improved in representing the dynamics of soil water and crop leaf nitrogen contents. With an enhanced capability to simulate rice growth and development and predict yield in non-stressed, water-stressed and nitrogen-stressed environments, ORYZA (v3) is a reliable successor of ORYZA2000. |
| [21] | . . |
| [22] | . . |
| [23] | . Abstract The principles, equipment and procedures for measuring leaf and canopy gas exchange have been described previously as has chlorophyll fluorescence. Simultaneous measurement of the responses of leaf gas exchange and modulated chlorophyll fluorescence to light and CO2 concentration now provide a means to determine a wide range of key biochemical and biophysical limitations on photo synthesis in vivo. Here the mathematical frameworks and practical procedures for determining these parameters in vivo are consolidated. Leaf CO2 uptake (A) versus intercellular CO2 concentration (Ci) curves may now be routinely obtained from commercial gas exchange systems. The potential pitfalls, and means to avoid these, are examined. Calculation of in vivo maximum rates of ribulose-1,5-bisphosphate (RuBP) carboxylase/oxygenase (Rubisco) carboxylation (Vc,max), electron transport driving regeneration of RuBP (Jmax), and triose-phosphate utilization (VTPU) are explained; these three parameters are now widely assumed to represent the major limitations to light-saturated photosynthesis. Precision in determining these in intact leaves is improved by the simultaneous measurement of electron transport via modulated chlorophyll fluorescence. The A/Ci response also provides a simple practical method for quantifying the limitation that stomata impose on CO2 assimilation. Determining the rate of photorespiratory release of oxygen (Rl) has previously only been possible by isotopic methods, now, by combining gas exchange and fluorescence measurements, Rl may be determined simply and routinely in the field. The physical diffusion of CO2 from the intercellular air space to the site of Rubisco in C3 leaves has long been suspected of being a limitation on photosynthesis, but it has commonly been ignored because of the lack of a practical method for its determination. Again combining gas exchange and fluorescence provides a means to determine mesophyll conductance. This method is described and provides insights into the magnitude and basis of this limitation. |
| [24] | |
| [25] | . Abstract Abstract Plant growth is the balance of photosynthetic gains and respiratory losses, and it is therefore essential to consider respiration in analyses of plant productivity. The partitioning of dark respiratory losses into two functional components, a growth component and a maintenance component, has proved useful. The growth loss is that associated with synthesis of new biomass while the maintenance loss is that associated with maintenance of existing biomass. Experimental evidence indicates that the respiratory cost of maintenance in herbaceous plants is about equal to the cost of growth over a growing season, with daily maintenace expenditures less important in the small, rapidly growing plant but increasing in significance as plant size increases and the relative growth rate decreases. Because it is such a large fraction of the total carbon budget of a plant, any variations in maintenance requirements may result in significant alterations in productivity. In the present work the theoretical and empirical bases of maintenance respiration are described: magnitudes of maintenance expenditures are summarized; and applications to models of plant growth and productivity are discussed. It is concluded that the costs of maintenance should be included in analyses of plant growth. |
