 , 刘佳, 杨福刚, 杨玲波, 姚保民, 王小龙
中国农业科学院农业资源与农业区划研究所, 北京100081
Acguisition of Winter Wheat Area in the Beijing-Tianjin-Hebei Region with GF-1 Satellite Data
WANGLi-Min, LIUJia, YANGFu-Gang, YANGLing-Bo, YAOBao-Min, WANGXiao-Long通讯作者:
收稿日期:2017-06-14
接受日期:2018-01-8
网络出版日期:2018-01-26
版权声明:2018作物学报编辑部作物学报编辑部
基金资助:
展开
摘要
关键词:
Abstract
Keywords:
-->0
PDF (35534KB)元数据多维度评价相关文章收藏文章
本文引用格式导出EndNoteRisBibtex收藏本文-->
大宗农作物的播种面积空间分布数据的准确获取是国家、省级政府制定粮食政策, 保证粮食安全的重要依据[1]。北京市(京)、天津市(津)、河北省(冀)冬小麦面积占全国冬小麦总面积的10.3%[2], 其变化对中国冬小麦生产形势具有显著影响。采用遥感技术在省级尺度上开展冬小麦面积的全覆盖监测, 是中国农情遥感监测的主要目标之一[3]。
按照遥感数据使用时相的差别、重要性程度来划分, 农作物面积遥感监测研究可以区分为基于单时相数据分类技术研究、多时相数据分类技术研究以及遥感数据辅助的遥感抽样技术研究3类。单一时相法主要通过选取作物关键物候期的单景遥感影像, 利用目视解译[4]、监督分类[5]、非监督分类[6]、面向对象分类[7]、人工神经网络分类[8]、基于专家知识的图像分类[9]、混合像元分解[10]等方法, 基于地物的光谱、纹理特征等信息, 对目标作物进行识别及面积提取, 其优势是处理数据量小、效率高、时效性强, 相比多时相方法, 无需作物完整物候期的所有遥感影像即可进行, 便于提取当年度作物即时播种面积等[11,12]。Chellasamy等[13]利用WorldView-2卫星1.8 m分辨率的多光谱影像, 使用自动选择训练样本的方法, 研究丹麦Vennebjerg地区650 hm2农田的作物分类, 对油菜、冬小麦和果树的分类精度分别达91.2%、88.4%和96.5%。一般认为, 不同分辨率的遥感影像进行作物面积识别, 空间分辨率越高则更容易获得更高的分类精度[14]。多时相数据能够覆盖作物发育的关键时期, 可以基于不同发育时期波谱差异对作物类型进行有效识别, 因而在农作物面积提取研究方面得到广泛应用[15,16,17]。中低空间分辨率的多时相遥感数据相对容易获取, 这类研究以NOAA/AVHRR和EOS/MODIS等类似数据研究较多, 如Brian等[18]利用MODIS的250 m分辨率影像制作NDVI (Normalized Difference Vegetation Index)时序影像数据进行美国中央大平原大范围作物面积制图研究, 其精度达80%以上。随着中高空间分辨率遥感数据的增多, 以LandSat、HJ、SPOT和Rapideye卫星数据的研究逐渐增多, 如Zheng等[19]利用Landsat/TM卫星30 m分辨率的数据制作NDVI时序影像, 并用支持向量机的方法对美国凤凰城的各种作物类型进行识别, 分类总体精度达到86%以上; 刘佳等[20]基于HJ-1A/B卫星时间序列数据, 针对河北省衡水市冬小麦、夏玉米、春玉米、棉花、花生、大豆等主要作物类型进行决策树分类识别研究, 总体分类总体精度达到90.9%; Suzuki等[21]利用RapidEye的5 m分辨率影像制作时序NDVI数据, 对日本北海道平原小麦、马铃薯、甜菜、红小豆等旱地作物识别的总体精度达到90%以上。
针对区域尺度上全覆盖遥感影像获取困难、分类技术难以标准化的现状, 样方内作物类型遥感识别辅助的空间抽样研究成为大尺度农作物数量获取的主要方法[22]。焦险峰等[23]利用分层抽样的方法对中国水稻种植面积进行遥感调查, 以1∶5万比例尺标准地形图图幅为抽样单元, 设计了中国水稻种植面积抽样框架。但是, 分层抽样方法同传统的统计调查方法一样, 都无法获取作物的空间分布, 因而无法得到广泛的应用。
与利用单景影像识别作物容易出现异物同谱及同物异谱现象相比, 利用多时相影像识别作物可结合作物物候特征分类, 具有明显优势。然而, 受限于数据预处理能力、云雾遮挡, 以及缺乏自动化程度高的识别技术, 目前基于多时相、中高分辨率影像开展区域农作物遥感识别的研究还比较少。GF-1卫星是中国2013年4月成功发射的高分系列卫星, 其所携带的WFV (wide field view)传感器空间分辨率为16 m, 观测幅宽达800 km, 标称回访周期为4 d, 观测能力大幅度提升, 对区域农作物面积遥感监测具有独特优势。本文基于GF-1/WFV数据, 通过获取小麦生长期内每月1期晴空NDVI数据, 在冬小麦分类单元划分与面积指数(winter wheat area index, WWAI)构建基础上, 设计了自动化运行能力较高的省级冬小麦遥感监测技术, 建立适合于时间序列影像的快速、直观的分类方法, 以提高业务运行效率。实现了京津冀范围内的年度冬小麦种植面积提取, 并在中国农情遥感监测业务中得到应用。
1 研究区域
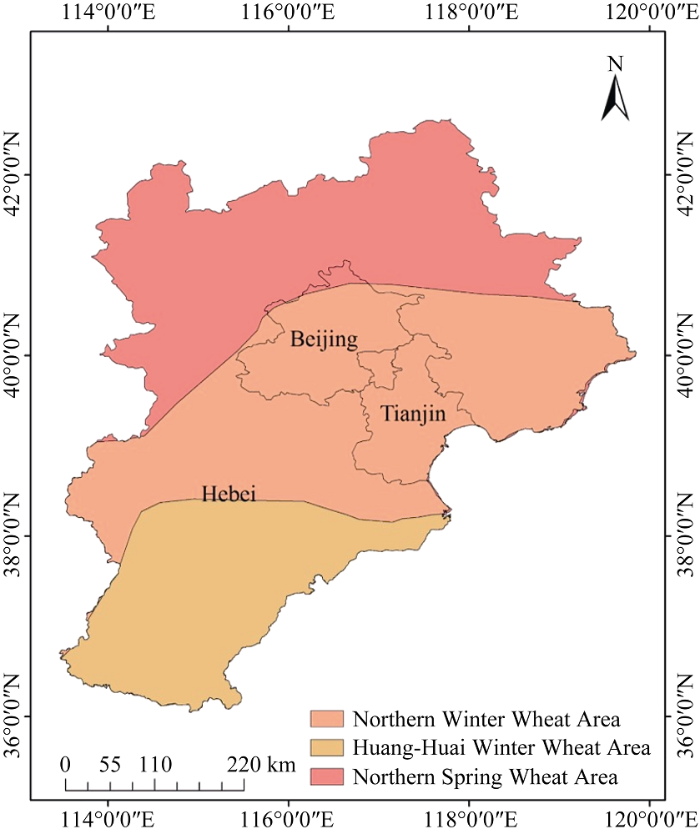
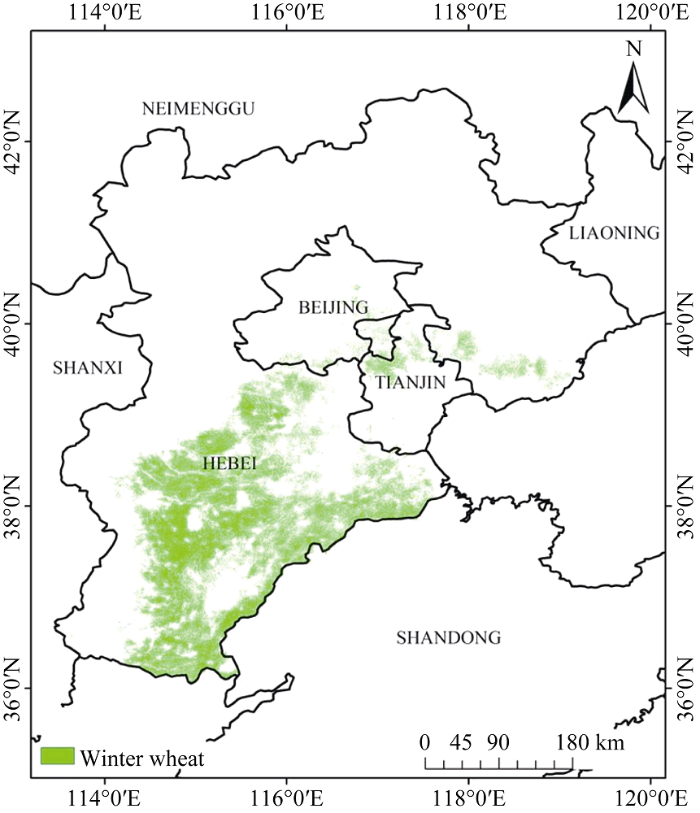
京津冀地处华北平原北部(36°05′~42°40′ N, 113°27′~119°50′ E), 总面积21.7万公顷。地貌复杂多样, 高原、山地、丘陵、盆地、平原类型完整, 地势由西北向东南倾斜。其中, 中南部平原区是冬小麦适宜种植区, 按其成因可分为山前冲洪积平原、中部湖积平原区和滨海平原区3种地貌类型, 占京津冀区域总面积的43.4%。该区跨中温带和南温带, 属温带大陆性季风气候, 四季分明。年日照时数2303.1 h, 无霜期81~204 d; 年均降水量484.5 mm, 分布不均, 呈东南多、西北少的趋势, 且夏季降水多, 占全年降水量的65%~80%。1月平均气温低于3℃, 7月平均气温18~27℃, 年平均气温由北向南逐渐升高。中南部平原区≥0℃积温在3000~4800℃之间, 能够满足农作物一年二熟的需要。该区耕地面积938.82万公顷, 占全区总土地面积的43.2%, 粮食播种面积占耕地总面积的72.4%以上, 是中国重要粮棉产区。主要粮食作物有小麦、玉米、高粱、谷子、薯类等, 经济作物以油料作物为主, 与棉花、麻类、甜菜、烟叶并称本区五大经济作物。京津冀地区冬小麦总播种面积占全国第4位, 占全国总播种面积的10.1% [2], 分为北部春麦区、北部冬麦区和黄淮冬麦区(图1)。
 显示原图|下载原图ZIP|生成PPT
图1京津冀地区小麦区划
-->Fig. 1Wheat regionalization in Beijing-Tianjin-Hebei region
-->
2 数据获取与数据处理
2.1 卫星影像预处理
GF-1卫星搭载有4个WFV传感器WFV1、WFV2、WFV3和WFV4, 单传感器幅宽200 km, 同时成像时幅宽可达800 km。影像具备蓝(0.45~0.52 μm)、绿(0.52~0.59 μm)、红(0.63~0.69 μm)和近红外(0.77~0.89 μm) 4个波段, 重访周期4 d, 空间分辨率16 m。采用云量低于10%的GF-1卫星WFV影像984景进行京津冀地区冬小麦种植面积提取研究, 2013年10月至2014年6月每月依次使用118、123、145、148、104、81、92、92和81景, 保证冬小麦生长期内每月至少获取一次晴空合成影像。经过系统几何和辐射校正的WFV影像1级产品由中国资源卫星中心提供。在此基础上, 采用6S模型对所有影像进行大气校正; 以同期Landsat8 OLI 15 m数据作为参考影像, 利用影像的RPC (rational polynomial coefficient)参数和ASTER GDEM高程数据, 对影像进行区域网平差和几何精校正; 分别计算影像的归一化植被指数NDVI, 作为冬小麦面积指数构建的基础。
$\text{NDVI}=\frac{\text{Re}{{\text{f}}_{\text{4}}}-\text{Re}{{\text{f}}_{s}}}{\text{Re}{{\text{f}}_{4}}+\text{Re}{{\text{f}}_{s}}}$ (1)
式中, Ref3和Ref4分别是WFV影像红光波段和近红外波段的反射率。
2.2 基于图幅单元的NDVI合成
采用国家标准的1∶10万地形图图幅框作为基本分类单元, 按照1∶10万标准分幅对监测区进行裁切分割, 每幅的经度差为30′, 纬度差为20′, 每个分类单元的平均面积为16.3万公顷, 本研究区域内共179个图幅单元, 其中98个属于冬小麦分布区, 是进行冬小麦识别与面积提取的区域。将研究区域划分为标准单元进行分类, 有利于编程实现; 单元内冬小麦发育时期更趋于一致, 可以保证算法参数相对一致。在标准图幅框对NDVI影像裁切基础上, 对每个图幅框单元逐月最大值合成, 获取每月NDVI最大值影像, 以去除云、雾霾等的干扰。图2是研究区冬小麦遥感监测图幅单元分布, 以及廊坊市所在单元的放大图。 显示原图|下载原图ZIP|生成PPT
图2研究区冬小麦遥感监测图幅单元分布及高分影像示例
A: 京津冀WFV晴空影像及图幅单元分布; B: 廊坊市所在图幅单元WFV晴空影像; C: 廊坊市所在图幅单元4月份NDVI最大值合成
-->Fig. 2Winter wheat remote sensing monitoring map unit distribution in the study area and high resolution image examples
A: Beijing-Tianjin-Hebei WFV clear sky image and image unit distribution; B: WFV clear sky images of Langfang city; C: NDVI maximum value composition of Langfang image unit of April.
-->
2.3 样本点的选择与获取
提取冬小麦面积时包括训练样本和验证样本两类样本, 训练样本又包括权值构建和类型确认两种样本数据, 验证样本也包括规则样本和随机样本两种。所选择的样本点类型是否为冬小麦, 是根据目视解译、专家知识判断及地面调查实际验证等方式确认的。训练样本的选择是在每个图幅单元内制作10×10个网格, 在研究区内格网大小平均为4 km × 4 km, 每个网格再划分为4个子格网, 以100个左上角的子网格中心点作为权值构建样本, 以100个右下角的子网格中心点作为类型确认样本。本研究区内共有19 600个训练样本点。规则验证样本点的选择是在冬小麦初步提取结果基础上叠加5 km × 5 km网格, 共获取1159个网格中心点作为规则验证样本, 其中1027个样本位于冬小麦种植区, 132个样本位于非冬小麦种植区, 该类验证点主要分布在冬小麦种植区域内。随机验证样本点是在冬小麦图幅单元中按照等距原则随机选择320个点, 其中43个样本是冬小麦, 277个是非冬小麦, 该类样本主要以非冬小麦类型为主。采用上述方案进行样本点选择, 具有样点分布随机性、区域覆盖均匀性、冬小麦样本率高的特点。图3为研究区内各类样本点的分布, 以及位于保定市内J50D004004图幅框的放大显示。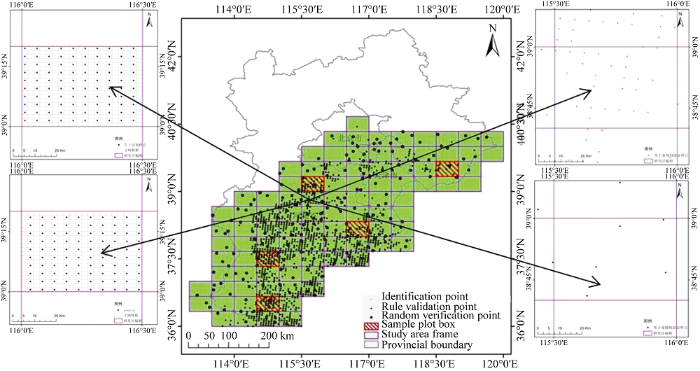 显示原图|下载原图ZIP|生成PPT
图3研究区样本点及示例图幅的分布
A: 权值构建样本; B: 类型确认样本; C: 规则验证样本; D: 随机验证样本。
-->Fig. 3Distribution of sample points in study area and sample maps
A: weights build samples; B: type confirmation samples; C: rule verification samples; D: random verification samples.
-->
2.4 样方数据选择与获取
选取研究区1∶10万地形图图幅框中编号J50D006006作为样方数据选取的范围, 将图幅单元再分成15×15个格网作为样方数据的基本单元, 将单元格网内作物面积比例作为抽样参数, 采用等概率原则进行地面样方抽样。覆盖图幅单元的网格共225个。基于监督分类方法获得图幅单元内冬小麦初步分类结果, 计算每个网格中的冬小麦面积, 从小到大排序, 最小为0, 最大98.6%, 按10%的级差分级, 统计每个级别中的频数, 等概率抽取10个网格作为监督分类的训练样方、抽取10个网格作为监督分类结果的验证样方。结合研究区地面调查获取的解译标志, 采用目视解译的方法获得20个样方内冬小麦及其他2种类别分布结果, 训练及验证样方如图4所示。 显示原图|下载原图ZIP|生成PPT
图4监督分类方案实施区域(图幅编号J50D006006)与样本分布
-->Fig. 4Supervised classification implementation regions (map No. J50D006006) and sample distribution
-->
3 技术路线及算法原理
3.1 技术路线
本研究区冬小麦面积空间制图包括数据预处理、标准分类单元的NDVI合成、样本点选择、WWAI构建、冬小麦作物类型确认、省域范围制图及精度验证等7项内容(图5)。本文对98个有冬小麦分布的单元依次进行NDVI合成、样本点选择、WWAI指数构建、冬小麦类型确认等过程, 获取每个分类单元的冬小麦面积空间分布, 并对提取结果进行拼接, 拼接结果就是研究区内的冬小麦空间分布结果, 最后利用混淆矩阵方法进行精度验证。WWAI构建是该项技术的核心, 主要思路是根据冬小麦种植期间与其他在田作物的物候特征差异, 在各时相赋予NDVI不同权重的方式, 扩大冬小麦指数与其他地物的差异, 达到准确提取冬小麦种植面积的目的。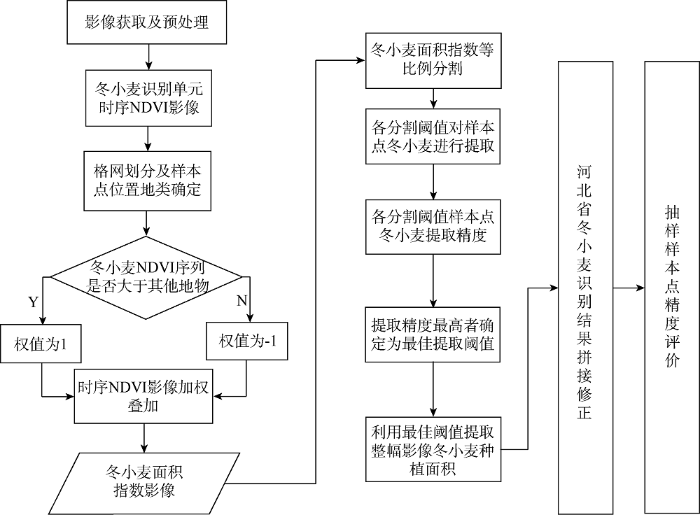 显示原图|下载原图ZIP|生成PPT
图5冬小麦面积提取处理流程
-->Fig. 5Winter wheat area extraction and processing steps
-->
3.2 基于NDVI时序的冬小麦识别原理
本研究区内冬小麦的生育期从每年10月到次年6月, 经历播种、出苗、分蘖、越冬、返青、起身、拔节、挑旗、抽穗、开花、灌浆、成熟12个阶段, 南北、东西不同地理位置冬小麦物候会有10~15 d的差异。选取10月初至次年6月底的卫星影像, 可以覆盖研究区内不同区域的全冬小麦生育期。分别选择位于河北省唐山市、保定市、沧州市、邢台市、邯郸市的5个图幅单元J50D002010、J50D003004、J50D006006、J50D008002、J50D011002作为示例, 统计5个图幅单元内冬小麦和其他地物以月为时间节点的NDVI平均值谱曲线(图6-A)。利用ASD FieldSpec地物光谱仪, 于2013年10月30日、11月4日、12月28日以及2014年3月4日、4月12日、4月21日、5月12日、5月20日、6月10日和6月23日进行10期地面观测, 得到冬小麦和其他两种地物NDVI变化曲线(图6-B), 以进一步明确NDVI对物候的直观反映。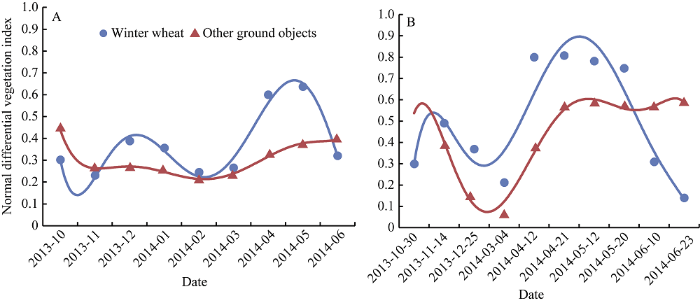 显示原图|下载原图ZIP|生成PPT
图6基于影像数据(A)和地面观测数据(B)的冬小麦和其他地物类型NDVI曲线
-->Fig. 6NDVI curves of winter wheat and other ground objects based on image data (A) and ground observation data (B)
-->
尽管本研究区内冬小麦物候有一定的差异, 但是从影像获取或者地面光谱观测的NDVI谱曲线表现是类似的, 即10月上旬播种期最低, 11月上旬出苗后开始逐步增加, 11月末至12月中旬达到冬前的最大值, 12月下旬进入越冬期后明显下降, 2月下旬返青后开始快速增长, 至4月下旬达到最大值, 5月下旬乳熟后逐渐下降, 6月下旬收获后, 随着玉米等其他作物的出苗, NDVI又开始上升(图6-A, B)。这主要是由于NDVI月度合成将掩盖物候的差异, 是该技术能够在不同种植区域应用的前提。
3.3 冬小麦面积指数构建及阈值确定
针对每个图幅单元, 提取权值构建样本点的各期NDVI值, 计算冬小麦、非冬小麦样本点的NDVI均值; 若当期冬小麦NDVI平均值大于其他地物NDVI平均值, 则判定该时期为冬小麦生长优势期, 其权值设定为1; 若当期冬小麦NDVI平均值小于其他地物的NDVI平均值, 则判定该时期为冬小麦生长劣势期, 其权值设定为-1。各期的NDVI值与权值相乘得到该期NDVI影像加权值, 各时相NDVI加权值相加并除以影像期数, 得到的结果即为“冬小麦面积指数WWAI”影像。${{P}^{i}}\left\{ \begin{align}& 1\ \ \ \ \ \ \left( \overline{\text{NDVI}}_{\text{w}}^{i}>\overline{\text{NDVI}}_{\text{O}}^{i} \right) \\& -1\ \ \ \ \left( \overline{\text{NDVI}}_{\text{w}}^{i}>\overline{\text{NDVI}}_{\text{O}}^{i} \right) \\\end{align} \right.$ (2)
$\text{WWAI}=\frac{1}{n}\sum\limits_{i=0}^{n}{\left( \text{NDV}{{\text{I}}^{i}}\times {{P}^{i}} \right)}$ (3)
式中, P为权值, i表示第i期影像, 下标w表示冬小麦, 下标O表示其他。确定WWAI阈值是类型识别的基础, 是根据类型确定样本判定的。具体是将冬小麦面积指数以1%的比例等分, 从0开始至100%结束, 循环迭代101次, 以各比例节点的WWAI值为阈值, 将所有101个冬小麦面积提取结果依次与类型确定样本比较, 正确率最高的阈值即为最优的WWAI提取阈值。该方法的优势是无需人工干预, 最大程度降低了人为误差, 只要样本点的冬小麦识别结果准确, 即可获取一致的冬小麦面积识别阈值。
在获取各图幅单元最优冬小麦面积指数提取阈值后, 应用到整幅WWAI影像中, 就是各单元内冬小麦作物种植分布结果。将研究区内所有图幅单元分类成果拼接修正, 即可获取研究区内监测年度的冬小麦种植面积。
3.4 监督分类算法
最大似然分类算法(maximum likelihood, ML)是一种具有理论性的点估计法, 最大似然分类法是最常用的监督分类方案, 算法假设每个波段中各类数据分布为高斯分布, 各个波峰则可能代表唯一的类别。采用训练样本的方式获取正态分布的统计量, 然后计算每个像元属于不同正态分布的概率(距离), 像元将归属于概率最大的类别。该算法的分类结果具稳定可靠、精度较高的优势[24]。本文以GF-1多时相反射率数据作为输入, 采用上述的10个格网单元作为训练样本, 以最大似然分类算法进行分类, 获取冬小麦、其他两种地物类型的空间分布。3.5 精度验证
基于验证样本点对应的冬小麦识别结果, 采用混淆矩阵、Kappa系数、总体分类精度、制图精度、用户精度5种方式, 对研究区域内冬小麦面积遥感监测结果进行精度验证。总体分类精度指的是所有被正确分类的像元总和除以总像元数。制图精度指正确分为A类的像元数与A类真实参考总数的比率。用户精度是指正确分到A类的像元总数与分类器将整个影像的像元分为A类的像元总数(混淆矩阵中A类的总和)比率。4 结果与分析
4.1 基于面积指数的识别结果
根据中国小麦种植区划, 研究区内包括北部春麦区、北部冬麦区和黄淮冬麦区3个区域, 冬小麦分布的北部边界在燕山山脉与平原的交汇处, 冬小麦的实际分布也是如此(图1)。研究中将这一边界与1︰10万标准图幅单元叠加, 去除没有冬小麦分布的北部春麦区的图幅单元, 仅对有冬小麦分布的98个图幅单元进行冬小麦面积的识别与提取, 以避免数据冗余。为便于叙述, 以冬小麦生长和生产代表性较强的河北省保定市(J50D003004)、沧州市(J50D006006)、邯郸市(J50D011002)、唐山市(J50D002010)、邢台市(J50D008002)的5个图幅单元为例, 基于本文提出的WWAI提取技术, 分别提取这5个图幅单元的冬小麦种植面积。根据冬小麦面积指数影像计算流程, 统计研究区每一时期影像所有网格左上中心点的NDVI值, 并结合该点目视分类结果, 分别统计冬小麦地类和其他地类的平均NDVI值, 若冬小麦NDVI平均值大于其他地类, 则将其NDVI乘以权值1, 否则就乘以权值-1, 并将各期影像NDVI加权值叠加并除以影像的期数, 即可得到最终的冬小麦面积指数影像(图7-A)。在获取得到冬小麦面积指数影像后, 通过最优WWAI提取阈值自适应确定方法, 设置最合适的WWAI提取阈值, 提取冬小麦种植区域。在本研究区, 冬小麦面积指数提取阈值设定为0.16时, 样本点具有最高的总体识别精度94.0%, 其中冬小麦的识别精度为95.5%。利用自适应选取的冬小麦面积指数提取阈值, 进行冬小麦分类工作, 提取结果如图7-B所示。分别统计左上样本点冬小麦WWAI值、NDVI均值及非冬小麦区域的WWAI、NDVI均值(表1), 可见WWAI值相比NDVI均值指数, 显著扩大了冬小麦地类和非冬小麦地类之间的差异, 差异绝对值从0.1626增加到0.2191, 差异倍数更是从1.62增加到2.69, 相比传统的NDVI阈值法, 利用冬小麦面积指数将更有利于进行冬小麦的面积提取工作。
Table 1
表 1
表 1NDVI均值结果与冬小麦面积指数的比较
Table 1Comparison between NDVI mean value result and winter wheat area index
| 地表物 Ground objective | NDVI平均值 Average NDVI | 冬小麦面积指数 Winter wheat area index |
|---|---|---|
| 冬小麦 Winter wheat | 0.4250 | 0.3489 |
| 其他地表物 Other ground objectives | 0.2624 | 0.1298 |
| 差异绝对值 Difference value | 0.1626 | 0.2191 |
| 差异倍数 Difference multiple | 1.62 | 2.69 |
新窗口打开
 显示原图|下载原图ZIP|生成PPT
图7不同地理位置冬小麦面积指数(A)及分类结果(B)
A1B1: 保定市(J50D003004); A2B2: 沧州市(J50D006006); A3B3: 邯郸市(J50D011002); A4B4: 唐山市(J50D002010); A5B5: 邢台市(J50D008002)。
-->Fig. 7Winter wheat area indexes (A) of different locations and their classification results (B)
A1B1: Baoding city (J50D003004); A2B2: Cangzhou city (J50D006006); A3B3: Handan city (J50D011002); A4B4: Tangshan city (J50D002010); A5B5: Xingtai city (J50D008002).
-->
由实际分布结果(图7)和统计值(表1)可以看出, 通过设定正负权值, 扩大了冬小麦优势期NDVI值, 缩小了非冬小麦优势期NDVI值, 可以使冬小麦类别像元WWAI值最大化, 能够直观地通过设定WWAI提取阈值的方式, 剔除掉非冬小麦区域。另外, 冬小麦种植区域的WWAI值显著大于非冬小麦区域(图7)。
4.2 研究区冬小麦面积制图精度
省域范围内的制图是将上述方法逐一应用于98个图幅单元, 每个图幅单元建立1 km的缓冲区, 并对提取结果拼接, 拼接结果就是研究区内的冬小麦空间分布结果, 最终得到2013—2014年度的研究区冬小麦种植范围(图8)。利用在研究区获取的1479验证样本点对区域内的冬小麦空间分布精度进行验证, 可以看出, 总体识别精度达到89.6%, 用户精度达到89.8%, 制图精度96.5%, Kappa系数0.72 (表2)。这表明使用冬小麦面积指数方法进行京津冀区域冬小麦种植范围提取具有较高的精确性, 该方法是切实可行的。Table 2
表 2
表 2冬小麦提取结果验证样本点混淆矩阵
Table 2Confusion matrix of validation sample points of national scale winter wheat extraction result
| 地表物 Ground objective | 冬小麦 Winter wheat | 其他地表物 Other ground objectives | 总计 Total | 用户精度 User accuracy (%) | 制图精度 Mapping accuracy (%) | 总体精度 Overall accuracy (%) | Kappa系数 Kappa coefficient |
|---|---|---|---|---|---|---|---|
| 冬小麦 Winter wheat | 1033 | 37 | 1070 | 89.8 | 96.5 | 89.6 | 0.72 |
| 其他地表物 Other ground objectives | 117 | 292 | 409 | 88.8 | 71.4 | ||
| 总计 Total | 1150 | 329 | 1479 |
新窗口打开
 显示原图|下载原图ZIP|生成PPT
图8本研究区2013-2014年度冬小麦种植空间分布
-->Fig. 8Spatial distribution of annual winter wheat area (2013-2014 growing season) in this study
-->
本研究区域内冬小麦主要有3个集中分布区域, 即北部、中部与南部集中分布区, 北部集中分布区包括北京市、天津市、河北省唐山市行政区域, 中部集中分布区包括河北省保定市、廊坊市、沧州市行政区域, 南部的石家庄市、衡水市、邢台市和邯郸市行政区域(图8)。总体上空间分布结果与实际相符。
4.3 基于监督分类的提取结果
采用基于最大似然分类器的监督分类方法, 利用10个训练样方对研究区中编号J50D006006的图幅单元进行冬小麦面积识别(图9)。采用混淆矩阵的方式, 通过10个验证样方对监督分类结果进行精度评价, 与通过冬小麦面积指数提取的结果精度进行对比(表3)。监督分类和WWAI冬小麦提取的总体精度分别为91.46%和90.64%, Kappa系数分别为0.83和0.81, 用户精度分别为87.88%和87.35%, 制图精度分别为95.11%和90.34%, 除制图精度相差4.77%以外, 其他都在1.00%以内。WWAI冬小麦识别效果与常规监督分类方法具有较高的一致性, 同时也具有较高的精度, 考虑到监督分类需要大量的样方, 在实际区域应用中具有实际的不可操作性, 显然WWAI指数算法更加简洁高效, 人为干预少, 具有更强的区域适用性。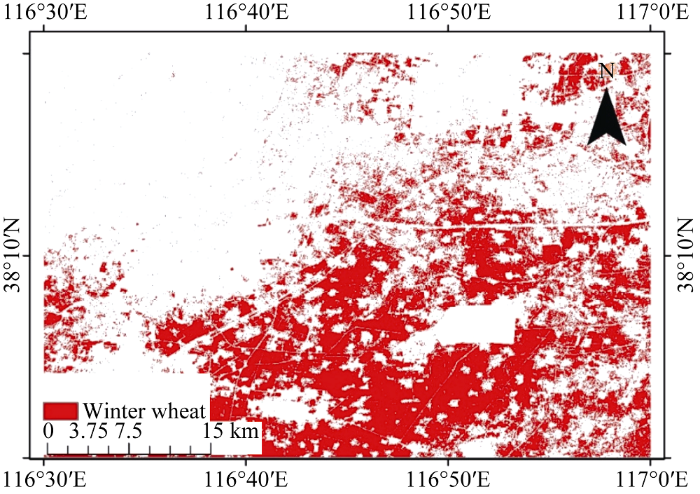 显示原图|下载原图ZIP|生成PPT
图9图幅编号J50D006006区域冬小麦监督结果
-->Fig. 9Winter wheat monitoring results in the map No. J50D006006 region
-->
Table 3
表3
表3监督分类方案与WWAI算法精度比较
Table 3Comparison on accuracy between supervised classification method and WWAI algorithm
| 指标 Index | 最大似然监督分类 Maximum likelihood | 冬小麦面积指数 Winter wheat area index | ||
|---|---|---|---|---|
| 冬小麦 Winter wheat | 其他地表物 Other ground objectives | 冬小麦 Winter wheat | 其他地表物 Other ground objectives | |
| 用户精度 User accuracy (%) | 87.88 | 95.24 | 87.35 | 93.08 |
| 制图精度 Mapping accuracy (%) | 95.11 | 88.18 | 90.34 | 90.85 |
| 总体精度 Overall accuracy (%) | 91.46 | 90.64 | ||
| Kappa系数 Kappa coefficient | 0.83 | 0.81 | ||
新窗口打开
5 讨论
标准化的分类单元构建、规范化的样本选择技术, 以及机理明确的算法选择, 是区域尺度农作物面积遥感自动识别精度与效率的主要影响因素。当前的研究重点更为注重算法选择[25], 而对标准化分类单元的构建、规范化的样本选择技术研究关注不足, 但这两个因素恰恰是区域性业务监测研究能够顺利进行的保证。该文将轨道覆盖范围变化较大的GF-1/WFV影像重新标准化到地形图分幅单元中, 等同于对WFV数据进行标准化分幅处理, 便于后续的业务分工、软件编程等研究工作的开展。采用规则化格网结合随机选择的方式获取训练和验证样本, 实现了样本选择可操作性, 也增强了样方的选择均匀性, 避免了由于样本选择聚集性带来的精度误差。从农作物面积识别的研究方法来分析, 多时相数据一维压缩的算法已经开始得到重视, 如王利民等[26]基于WFV数据, 采用与WWAI指数类似的权重值被指数算法开展了冬小麦识别研究; Bargiel [27]基于VV和VH极化的Sentinel-1A数据, 以每种作物在6个时相中出现概率的累加值作为参数, 实现了多源数据的一维压缩, 提取了玉米、冬小麦、马铃薯、甜菜等8种作物识别。更多研究的重点仍然是决策树原理的多维影像数据的多层次识别[28], 这虽然完善了遥感影像作物识别能力的研究, 但仍需进行深入研究才能在区域范围内推广应用。该文提出的WWAI以NDVI时序数据为基础, 能够充分利用每一个时期的NDVI, 增加冬小麦识别优势期NDVI的比重, 降低非优势期NDVI的影响, 实现冬小麦与非冬小麦种植区的区分, 是降维算法在省级尺度农情遥感监测业务运行中的具体应用。
6 结论
利用GF-1/WFV遥感数据, 基于时序NDVI物候权重不同的原理, 结合标准化地图分幅单元构建、格网化样本选择技术, 开发了区域尺度冬小麦遥感识别算法, 实现了京津冀地区2013—2014年度冬小麦种植区的空间分布制图, 总体精度达到89.6%, 是大范围冬小麦面积监测业务化运行较为可行的方法。The authors have declared that no competing interests exist.
作者已声明无竞争性利益关系。
参考文献 原文顺序
文献年度倒序
文中引用次数倒序
被引期刊影响因子
| [1] | . 本文介绍了中国农情遥感速报系统的建设情况,系统内容包括农作物长势监测、农作物种植面积监测、农作物单产预测与粮食产量估算、作物时空结构监测和粮食供需平衡预警等。并简要介绍了1998年以来中国农情遥感速报系统在监测内容与监测范围、监测频率、技术发展以及质量控制与过程检验体系建立等方面的进展,并就中国农情遥感速报系统的发展方向提出了展望。 . 本文介绍了中国农情遥感速报系统的建设情况,系统内容包括农作物长势监测、农作物种植面积监测、农作物单产预测与粮食产量估算、作物时空结构监测和粮食供需平衡预警等。并简要介绍了1998年以来中国农情遥感速报系统在监测内容与监测范围、监测频率、技术发展以及质量控制与过程检验体系建立等方面的进展,并就中国农情遥感速报系统的发展方向提出了展望。 |
| [2] | |
| [3] | . . |
| [4] | . Land cover identification and area quantification are key aspects of implementing the European Common Agriculture Policy. Legitimacy of support provided to farmers is monitored using the Land Parcel Identification System (LPIS), with land cover identification performed by visual image interpretation. While the geometric orthoimage quality required for correct interpretation is well understood, little is known about the photometric quality needed for LPIS applications. This paper analyzes the orthoimage quality characteristics chosen by authors as being most suitable for visual identification of agricultural fields. We designed a survey to assess users preferred brightness and contrast ranges for orthoimages used for LPIS purposes. Survey questions also tested the influence of a background color on the preferred orthoimage brightness and contrast, the preferred orthoimage format and color composite, assessments of orthoimages with shadowed areas, appreciation of image enhancements and, finally, consistency of individuals preferred brightness and contrast settings across multiple sample images. We find that image appreciation is stable at the individual level, but preferences vary across respondents. We therefore recommend that LPIS operators be enabled to personalize photometric settings, such as brightness and contrast values, and to choose the displayed band combination from at least four spectral bands. |
| [5] | . 61We synthesize results from numerous studies of image classification methods.61Meta-analysis is used to quantify improvements in accuracy of methods.61Including texture information provided greatest improvement in accuracy.61Support vector machines achieved highest accuracy among classification algorithms.61Index creation and feature extraction offered minor improvements. |
| [6] | |
| [7] | . This paper presents results of object-oriented classification of Landsat ETM+ satellite image conducted using eCognition software. The classified image was acquired on 7 May 2000. In this particular study, an area of 423 km2 within the borders of Legionowo Community near Warsaw is considered.Prior to classification, segmentation of the Landsat ETM+ image is performed using panchromatic channel, fused multispectral and panchromatic data. The applied methods of classification enabled the identification of 18 land cover and land use classes. After the classification, generalization and raster to vector conversion, verification and accuracy assessment are performed by means of visual interpretation. Overall accuracy of the classification reached 94.6%. The verification and classification results are combined to form the final database.This is followed by comparing the object-oriented with traditional pixel-based classification. The latter is performed using the so-called hybrid classification based on both supervised and unsupervised classification approaches. The traditional pixel-based approach identified only 8 classes. Comparison of the pixel-based classification with the database obtained using the object-oriented approach revealed that the former reached 72% and 61% accuracy, according to the applied method. This paper presents results of object-oriented classification of Landsat ETM+ satellite image conducted using eCognition software. The classified image was acquired on 7 May 2000. In this particular study, an area of 423 km2 within the borders of Legionowo Community near Warsaw is considered. Prior to classification, segmentation of the Landsat ETM+ image is performed using panchromatic channel, fused multispectral and panchromatic data. The applied methods of classification enabled the identification of 18 land cover and land use classes. After the classification, generalization and raster to vector conversion, verification and accuracy assessment are performed by means of visual interpretation. Overall accuracy of the classification reached 94.6%. The verification and classification results are combined to form the final database. This is followed by comparing the object-oriented with traditional pixel-based classification. The latter is performed using the so-called hybrid classification based on both supervised and unsupervised classification approaches. The traditional pixel-based approach identified only 8 classes. Comparison of the pixel-based classification with the database obtained using the object-oriented approach revealed that the former reached 72% and 61% accuracy, according to the applied method. |
| [8] | . The Resourcesat-2 is a highly suitable satellite for crop classification studies with its improved features and capabilities. Data from one of its sensors, the linear imaging and self-scanning (LISS IV), which has a spatial resolution of 5.8 m, was used to compare the relative accuracies achieved by support vector machine (SVM), artificial neural network (ANN), and spectral angle mapper (SAM) algorithms for the classification of various crops and non-crop covering a part of Varanasi district, Uttar Pradesh, India. The separability analysis was performed using a transformed divergence (TD) method between categories to assess the quality of training samples. The outcome of the present study indicates better performance of SVM and ANN algorithms in comparison to SAM for the classification using LISS IV sensor data. The overall accuracies obtained by SVM and ANN were 93.45% and 92.32%, respectively, whereas the lower accuracy of 74.99% was achieved using the SAM algorithm through error matrix analysis. Results derived from SVM, ANN, and SAM classification algorithms were validated with the ground truth information acquired by the field visit on the same day of satellite data acquisition. |
| [9] | . |
| [10] | . . |
| [11] | . . |
| [12] | . A method for estimating crop areas based on first decomposing the mixture distribution for all pixels in a scene into component distributions and then labeling these component distributions, is defined. The theoretical advantages of this approach over usual classification-based inventories are discussed. Results of applying the mixture model approach to measurements derived from Landsat data for 18 sample segments in the northern U.S. Great Plains are presented. Mixture model estimates of the proportion of spring small grains in the sample segments are compared to similar estimates obtained from a classification-based approach. |
| [13] | . |
| [14] | . 不同空间分辨率农作物面积识别精度是农情遥感监测数据源选择的依据。该文采用WFV(wide field view)、MODIS(moderate-resolution imaging spectroradiometer)、OLI(operational land imager)、GoogleEarth影像,在天津市武清区选择了12 km×14 km的冬小麦种植区作为研究区域,采用目视识别的方法,分析了2、5、10、15、30、100、250 m共7个空间分辨率尺度下冬小麦面积识别精度与遥感数据分辨率、农田景观破碎度之间的关系。结果表明,随着空间分辨率由2 m变化到250 m,冬小麦面积识别的总体精度逐步由98.6%降低到70.1%,精度降低28.5%;面积数量比例由5.5%扩大到110.6%,误差增加105.1个百分点;面积精度呈明显下降趋势,数量误差呈明显增加趋势,数量误差的增加速度高于精度下降的趋势。高、中、低3个景观破碎度条件下,随着分辨率由2 m降低到250 m,作物识别精度分别降低了72.8、63.2和47.0个百分点,破碎度的增加导致面积识别精度下降速度更快;同等分辨率下,破碎度越高的地区面积识别精度越低。像元内冬小麦占比与可识别能力密切相关,像元占比达到45.0%以上时才能够被正确识别为冬小麦类型,像元尺度降低导致细小斑块丢失是造成面积识别与数量精度降低的主要原因。像元空间分辨率越高,冬小麦像元的光谱一致性越强,越有利于冬小麦分类精度的提高。针对农情遥感监测业务运行的需要,上述研究结果可以作为区域范围不同用户精度要求前提下遥感数据源选择的依据。 . 不同空间分辨率农作物面积识别精度是农情遥感监测数据源选择的依据。该文采用WFV(wide field view)、MODIS(moderate-resolution imaging spectroradiometer)、OLI(operational land imager)、GoogleEarth影像,在天津市武清区选择了12 km×14 km的冬小麦种植区作为研究区域,采用目视识别的方法,分析了2、5、10、15、30、100、250 m共7个空间分辨率尺度下冬小麦面积识别精度与遥感数据分辨率、农田景观破碎度之间的关系。结果表明,随着空间分辨率由2 m变化到250 m,冬小麦面积识别的总体精度逐步由98.6%降低到70.1%,精度降低28.5%;面积数量比例由5.5%扩大到110.6%,误差增加105.1个百分点;面积精度呈明显下降趋势,数量误差呈明显增加趋势,数量误差的增加速度高于精度下降的趋势。高、中、低3个景观破碎度条件下,随着分辨率由2 m降低到250 m,作物识别精度分别降低了72.8、63.2和47.0个百分点,破碎度的增加导致面积识别精度下降速度更快;同等分辨率下,破碎度越高的地区面积识别精度越低。像元内冬小麦占比与可识别能力密切相关,像元占比达到45.0%以上时才能够被正确识别为冬小麦类型,像元尺度降低导致细小斑块丢失是造成面积识别与数量精度降低的主要原因。像元空间分辨率越高,冬小麦像元的光谱一致性越强,越有利于冬小麦分类精度的提高。针对农情遥感监测业务运行的需要,上述研究结果可以作为区域范围不同用户精度要求前提下遥感数据源选择的依据。 |
| [15] | . . |
| [16] | . The discrimination of land cover types by means of satellite remotely sensed data is a very challenging task in extremely complex and heterogeneous environments where the surfaces are hardly spectrally identifiable. In these cases the use of multitemporal acquisitions could be expected to enhance substantially classification performance with respect to single scenees, when inserted in procedures which exploit all the information available. The present work discusses this hypothesis and employs three TM scenes of gently undulated terrain in Tuscany (central Italy) from different seasons of one year (February, May and August). The three phenological stages of the vegetated surfaces provided additional statistical information with respect to single scenes. Classification was tested with gaussian maximum likelihood classifiers, both separately on each of the three TM passages and, suitably adapted, on the whole multitemporal set. An iterative process using probabilities estimated from the error matrices of previous single image classifications was also tested. Results of tests show that multitemporal information greatly improves classification performance, particularly when using the statistical procedure described. |
| [17] | . 及时准确地获取区域和国家尺度的作物种植面积和空间分布具有重要意义。针对目前中低分辨率遥感数据相结合方法的局限,提出一种新的作物类型识别方法。首先基于MODIS NDVI数据的时间优势,提取研究区各类植被的NDVI时间序列曲线,从而分析冬小麦在季相节律上的识别特征,构建冬小麦识别模型。再将MODIS像元分类处理,纯耕地像元利用冬小麦的季相节律特征识别;耕地与其他植被的混合像元利用混合像元分解的思想提取耕地组分的NDVI时间序列,从而进行识别,进一步根据空间关系将识别结果重新定位到中分辨率尺度上;冬小麦与其他作物的混合像元覆盖区则利用TM遥感影像的光谱差异加以区分。在伊洛河流域主要农业区,以冬小麦为识别对象,结果表明识别精度达到96.3%。该方法为作物种植信息的提取提供了新的解决问题的途径,也对其他类型作物的识别也具有重要的参考价值。 . 及时准确地获取区域和国家尺度的作物种植面积和空间分布具有重要意义。针对目前中低分辨率遥感数据相结合方法的局限,提出一种新的作物类型识别方法。首先基于MODIS NDVI数据的时间优势,提取研究区各类植被的NDVI时间序列曲线,从而分析冬小麦在季相节律上的识别特征,构建冬小麦识别模型。再将MODIS像元分类处理,纯耕地像元利用冬小麦的季相节律特征识别;耕地与其他植被的混合像元利用混合像元分解的思想提取耕地组分的NDVI时间序列,从而进行识别,进一步根据空间关系将识别结果重新定位到中分辨率尺度上;冬小麦与其他作物的混合像元覆盖区则利用TM遥感影像的光谱差异加以区分。在伊洛河流域主要农业区,以冬小麦为识别对象,结果表明识别精度达到96.3%。该方法为作物种植信息的提取提供了新的解决问题的途径,也对其他类型作物的识别也具有重要的参考价值。 |
| [18] | . Improved and up-to-date land use/land cover (LULC) data sets that classify specific crop types and associated land use practices are needed over intensively cropped regions such as the U.S. Central Great Plains, to support science and policy applications focused on understanding the role and response of the agricultural sector to environmental change issues. The Moderate Resolution Imaging Spectroradiometer (MODIS) holds considerable promise for detailed, large-area crop-related LULC mapping in this region given its global coverage, unique combination of spatial, spectral, and temporal resolutions, and the cost-free status of its data. The objective of this research was to evaluate the applicability of time-series MODIS 250 m normalized difference vegetation index (NDVI) data for large-area crop-related LULC mapping over the U.S. Central Great Plains. A hierarchical crop mapping protocol, which applied a decision tree classifier to multi-temporal NDVI data collected over the growing season, was tested for the state of Kansas. The hierarchical classification approach produced a series of four crop-related LULC maps that progressively classified: 1) crop/non-crop, 2) general crop types (alfalfa, summer crops, winter wheat, and fallow), 3) specific summer crop types (corn, sorghum, and soybeans), and 4) irrigated/non-irrigated crops. A series of quantitative and qualitative assessments were made at the state and sub-state levels to evaluate the overall map quality and highlight areas of misclassification for each map. The series of MODIS NDVI-derived crop maps generally had classification accuracies greater than 80%. Overall accuracies ranged from 94% for the general crop map to 84% for the summer crop map. The state-level crop patterns classified in the maps were consistent with the general cropping patterns across Kansas. The classified crop areas were usually within 1 5% of the USDA reported crop area for most classes. Sub-state comparisons found the areal discrepancies for most classes to be relatively minor throughout the state. In eastern Kansas, some small cropland areas could not be resolved at MODIS' 250 m resolution and led to an underclassification of cropland in the crop/non-crop map, which was propagated to the subsequent crop classifications. Notable regional areal differences in crop area were also found for a few selected crop classes and locations that were related to climate factors (i.e., omission of marginal, dryland cropped areas and the underclassification of irrigated crops in western Kansas), localized precipitation patterns (overclassification of irrigated crops in northeast Kansas), and specific cropping practices (double cropping in southeast Kansas). |
| [19] | . Site-specific information of crop types is required for many agro-environmental assessments. The study investigated the potential of support vector machines (SVMs) in discriminating various crop types in a complex cropping system in the Phoenix Active Management Area. We applied SVMs to Landsat time-series Normalized Difference Vegetation Index (NDVI) data using training datasets selected by two different approaches: stratified random approach and intelligent selection approach using local knowledge. The SVM models effectively classified nine major crop types with overall accuracies of >86% for both training datasets. Our results showed that the intelligent selection approach was able to reduce the training set size and achieved higher overall classification accuracy than the stratified random approach. The intelligent selection approach is particularly useful when the availability of reference data is limited and unbalanced among different classes. The study demonstrated the potential of utilizing multi-temporal Landsat imagery to systematically monitor crop types and cropping patterns over time in arid and semi-arid regions. |
| [20] | . 通过对长时间序列遥感影像的波谱变化特征分析,可以有效地进行农作物种类识别与信息提取,提高农作物种植面积的遥感监测精度。中空间分辨率多光谱遥感影像适合于中国大范围大宗农作物面积监测,也是能够提供稳定时间序列遥感数据源之一。该研究以河北省衡水市为研究区域,采用2011年10月3日-2012年10月24日期间,16景30 m空间分辨率的HJ-1A/B卫星CCD(电荷耦合元件,charge-coupled device)影像月度NDVI(归一化植被指数,normalized difference vegetation index)时间序列数据,针对冬小麦、夏玉米、春玉米、棉花、花生和大豆等主要作物类型,在全生育期波谱特征曲线分析基础上,提取主要作物类型的曲线特征,采用基于NDVI阈值的决策分类技术,进行了农作物种植面积遥感识别,以15个规则的2 km×2 km的地面实测GPS(全球定位系统,global positioning system)样方进行了精度验证。考虑到大豆和花生2种作物的NDVI时间序列特征相似性较高,将这2种作物合并为一类进行分类,并命名为小宗作物。结果表明,冬小麦、夏玉米、春玉米、棉花和小宗作物等5类目标可以有效识别,分类总体精度达到90.9%,制图精度分别为94.7%、94.7%、82.4%、86.9%和81.2%,其他未分类类别精度为85.9%。利用中高分辨率遥感时间序列卫星影像,在大宗农作物时间序列的变化规律分析基础上,可以准确地提取大宗农作物种植面积,在农作物面积资源调查中具有较大的应用潜力。 . 通过对长时间序列遥感影像的波谱变化特征分析,可以有效地进行农作物种类识别与信息提取,提高农作物种植面积的遥感监测精度。中空间分辨率多光谱遥感影像适合于中国大范围大宗农作物面积监测,也是能够提供稳定时间序列遥感数据源之一。该研究以河北省衡水市为研究区域,采用2011年10月3日-2012年10月24日期间,16景30 m空间分辨率的HJ-1A/B卫星CCD(电荷耦合元件,charge-coupled device)影像月度NDVI(归一化植被指数,normalized difference vegetation index)时间序列数据,针对冬小麦、夏玉米、春玉米、棉花、花生和大豆等主要作物类型,在全生育期波谱特征曲线分析基础上,提取主要作物类型的曲线特征,采用基于NDVI阈值的决策分类技术,进行了农作物种植面积遥感识别,以15个规则的2 km×2 km的地面实测GPS(全球定位系统,global positioning system)样方进行了精度验证。考虑到大豆和花生2种作物的NDVI时间序列特征相似性较高,将这2种作物合并为一类进行分类,并命名为小宗作物。结果表明,冬小麦、夏玉米、春玉米、棉花和小宗作物等5类目标可以有效识别,分类总体精度达到90.9%,制图精度分别为94.7%、94.7%、82.4%、86.9%和81.2%,其他未分类类别精度为85.9%。利用中高分辨率遥感时间序列卫星影像,在大宗农作物时间序列的变化规律分析基础上,可以准确地提取大宗农作物种植面积,在农作物面积资源调查中具有较大的应用潜力。 |
| [21] | . We developed the method for crop classification of upland crops at a plain in Hokkaido, Japan through examining seasonal changes in NDVI of multi-temporal RapidEye satellite data. We classified crops into wheat, potato, sugar beet, adzuki bean, soybean and other crops using several combinations of RapidEye data. The plot based accuracies on each combination are evaluated through comparing error matrixes. Results indicate that the overall accuracies on the combinations of less than one-month interval imageries become higher. The proposed method obtained the overall accuracy of nearly 90% on all plots over the study area. |
| [22] | . Summary Remote sensing can be a valuable tool for agricultural statistics when area frames or multiple frames are used. At the design level, remote sensing typically helps in the definition of sampling units and the stratification, but can also be exploited to optimise the sample allocation and size of sampling units. At the estimator level, classified satellite images are generally used as auxiliary variables in a regression estimator or for estimators based on confusion matrixes. The most often used satellite images are LANDSAT-TM and SPOT-XS. In general, classified or photo-interpreted images should not be directly used to estimate crop areas because the proportion of pixels classified into the specific crop is often strongly biased. Vegetation indexes computed from satellite images can give in some cases a good indication of the potential crop yield. |
| [23] | . 及时准确的统计水稻种植面积对国家和区域的粮食生产、贸易及粮食安全预警有重要意义。传统的按行政单元逐级上报和农业产量抽样调查方法在数据获取过程中受人为因素的干扰,难以避免的出现诸如错报、漏报、空报等问题。遥感技术具有及时、准确、客观的特点,对于农作物种植面积监测具有其他方法不可替代的优势。但是,一般的作物面积遥感监测是全覆盖或典型地区调查。在大尺度农作物遥感调查时,全面普查(卫星遥感数据全覆盖)的方法在时间和经费方面是不可行的,以典型调查代替总体的方法缺乏科学依据。科学合理的抽样方法是可运行的大尺度作物面积监测的关键因素。研究在背景数据库的支持下,以土地利用数据库为辅助变量,设计了基于分层抽样的中国水稻种植面积遥感监测方法。以全国稻田面积为总体,采用1∶5万比例尺标准地形图幅为分层抽样的抽样单元。以遥感与地面调查相结合的方法监测样本的当年和上一年水稻种植面积,在给定精度条件下估算水稻种植面积年际变化率。结合上年统计部门发布的水稻种植面积统计数据,推算当年水稻种植面积。该项研究为农业部全国水稻遥感监测提供了可行的大尺度水稻遥感监测的运行方案。 . 及时准确的统计水稻种植面积对国家和区域的粮食生产、贸易及粮食安全预警有重要意义。传统的按行政单元逐级上报和农业产量抽样调查方法在数据获取过程中受人为因素的干扰,难以避免的出现诸如错报、漏报、空报等问题。遥感技术具有及时、准确、客观的特点,对于农作物种植面积监测具有其他方法不可替代的优势。但是,一般的作物面积遥感监测是全覆盖或典型地区调查。在大尺度农作物遥感调查时,全面普查(卫星遥感数据全覆盖)的方法在时间和经费方面是不可行的,以典型调查代替总体的方法缺乏科学依据。科学合理的抽样方法是可运行的大尺度作物面积监测的关键因素。研究在背景数据库的支持下,以土地利用数据库为辅助变量,设计了基于分层抽样的中国水稻种植面积遥感监测方法。以全国稻田面积为总体,采用1∶5万比例尺标准地形图幅为分层抽样的抽样单元。以遥感与地面调查相结合的方法监测样本的当年和上一年水稻种植面积,在给定精度条件下估算水稻种植面积年际变化率。结合上年统计部门发布的水稻种植面积统计数据,推算当年水稻种植面积。该项研究为农业部全国水稻遥感监测提供了可行的大尺度水稻遥感监测的运行方案。 |
| [24] | . 通过对最大似然分类算法的研究,并将其与马氏距离分类法在相同情况下进行对比试验,结果表明,最大似然分类方法对于光谱特性呈正态分布的遥感影像能提供较高的分类精度,而对于光谱特性呈非正态分布或偏离正态分布总体的遥感影像,最大似然分类法的实际分类效果并不理想,进而分析最大似然分类法的适用性. . 通过对最大似然分类算法的研究,并将其与马氏距离分类法在相同情况下进行对比试验,结果表明,最大似然分类方法对于光谱特性呈正态分布的遥感影像能提供较高的分类精度,而对于光谱特性呈非正态分布或偏离正态分布总体的遥感影像,最大似然分类法的实际分类效果并不理想,进而分析最大似然分类法的适用性. |
| [25] | . Rice is one of the staple foods for more than three billion people worldwide. Rice paddies accounted for approximately 11.5% of the World arable land area during 2012. Rice provided ~19% of the global dietary energy in recent times and its annual average consumption per capita was ~65 kg during 2010 2011. Therefore, rice area mapping and forecasting its production is important for food security, where demands often exceed production due to an ever increasing population. Timely and accurate estimation of rice areas and forecasting its production can provide invaluable information for governments, planners, and decision makers in formulating policies in regard to import/export in the event of shortfall and/or surplus. The aim of this paper was to review the applicability of the remote sensing-based imagery for rice area mapping and forecasting its production. Recent advances on the resolutions (i.e., spectral, spatial, radiometric, and temporal) and availability of remote sensing imagery have allowed us timely collection of information on the growth and development stages of the rice crop. For elaborative understanding of the application of remote sensing sensors, following issues were described: the rice area mapping and forecasting its production using optical and microwave imagery, synergy between remote sensing-based methods and other developments, and their implications as an operational one. The overview of the studies to date indicated that remote sensing-based methods using optical and microwave imagery found to be encouraging. However, there were having some limitations, such as: (i) optical remote sensing imagery had relatively low spatial resolution led to inaccurate estimation of rice areas; and (ii) radar imagery would suffer from speckles, which potentially would degrade the quality of the images; and also the brightness of the backscatters were sensitive to the interacting surface. In addition, most of the methods used in forecasting rice yield were empirical in nature, so thus it would require further calibration and validation prior to implement over other geographical locations. |
| [26] | . . |
| [27] | . Abstract Agricultural land cover is characterized by strong variations within relatively short time intervals. These dynamics are challenging for land cover classifications on the one hand, but deliver crucial information that can be used to improve the classifiers performance on the other hand. Since up to date mapping of crops is crucial to assess the impact of agricultural land use on the ecosystems, an accurate and complete classification of crop types is of high importance. In the presented study, a new multitemporal data based classification approach was developed that incorporates knowledge about the phenological changes on crop lands. It identifies phenological sequence patterns (PSP) of the crop types based on a dense stack of Sentinel-1 data and accurate information about the plant's phenology. The performance of the developed methodology has been tested for two different vegetation seasons using over 200 ground truth fields located in northern Germany. The results showed that a dense time series of Sentinel-1 images allowed for high classification accuracies of grasslands, maize, canola, sugar beets and potatoes (F1-score above 0.8) using PSP as well as standard (Random Forest and Maximum Likelihood) classification method. The PSP approach clearly outperformed standard methods for cereal crops, especially for spring barley where the F1-score varied between zero and 0.43 for standard approaches, while PSP achieved values as high as 0.74 and 0.79 for both vegetation seasons. The PSP based approach also outperformed for oat, winter barley and rye. Furthermore, the PSP classification is more resilient to differences in farming management and conditions of growth since it takes information about each crop types' growing stage and its growing period into consideration. The results also indicate, that the PSP approach was more sensitive to subtle changes such as the proportion of weeds within a field. |
| [28] | . Abstract Innovative, open, and rapid methods to map crop types over large areas are needed for long-term cropland monitoring. We developed two novel and automated decision tree classification approaches to map crop types across the conterminous United States (U.S.) using MODIS 250 m resolution data: 1) generalized, and 2) year-specific classification. The classification approaches use similarities and dissimilarities in crop type phenology derived from NDVI time-series data for the two approaches. The year-specific approach uses the training samples from one year and classifies crop types for that year only, whereas the generalized classification approach uses above-average, average, and below-average precipitation years for training to produce crop type maps for one or multiple years more robustly. We produced annual crop type maps using the generalized classification approach for 2001 2014 and the year-specific approach for 2008, 2010, 2011 and 2012. The year-specific classification had overall accuracies > 78%, while the generalized classifier had accuracies > 75% for the conterminous U.S. for 2008, 2010, 2011, and 2012. The generalized classifier enables automated and routine crop type mapping without repeated and expensive ground sample collection year after year. The resulting crop type maps for years prior to 2007 are new and especially important for long-term cropland monitoring and food security analysis because no other map products are currently available for 2001 2007. (Access Link: http://www.sciencedirect.com/science/article/pii/S0034425717302924) |
