 ,*, 武晓玲,*四川农业大学农学院 / 四川省作物带状复合种植工程技术研究中心, 四川成都 611130
QTL analysis for relative contents of glycinin and β-conglycinin fractions from storage protein in soybean seeds under monoculture and relay intercropping
LIU Dai-Ling, XIE Jun-Feng, HE Qian-Rui, CHEN Si-Wei, HU Yue, ZHOU Jia, SHE Yue-Hui, LIU Wei-Guo, YANG Wen-Yu,*, WU Xiao-Ling,*College of Agronomy, Sichuan Agricultural University / Sichuan Engineering Research Center for Crop Strip Intercropping System, Chengdu 611130, Sichuan, China通讯作者:
收稿日期:2019-05-20接受日期:2019-09-26网络出版日期:2020-03-12
| 基金资助: |
Received:2019-05-20Accepted:2019-09-26Online:2020-03-12
| Fund supported: |
作者简介 About authors
E-mail:

摘要
关键词:
Abstract
Keywords:
PDF (3380KB)元数据多维度评价相关文章导出EndNote|Ris|Bibtex收藏本文
本文引用格式
刘代铃, 谢俊锋, 何乾瑞, 陈四维, 胡跃, 周佳, 佘跃辉, 刘卫国, 杨文钰, 武晓玲. 净作和套作下大豆贮藏蛋白11S、7S组分相对含量的QTL分析[J]. 作物学报, 2020, 46(3): 341-353. doi:10.3724/SP.J.1006.2020.94076
LIU Dai-Ling, XIE Jun-Feng, HE Qian-Rui, CHEN Si-Wei, HU Yue, ZHOU Jia, SHE Yue-Hui, LIU Wei-Guo, YANG Wen-Yu, WU Xiao-Ling.
大豆(Glycine max L.)是重要的粮、油、饲兼用作物[1]。在我国大豆供给严重不足的局面下[2], 保障和提高我国食用大豆品质已成为当务之急。大豆籽粒中含有约40%~50%的蛋白质, 其中7S组分和11S组分占大豆蛋白质总量的70%左右, 二者的相对含量与大豆种子的加工品质[3]、营养品质[4]及功能特性[5]密切相关。
大豆贮藏蛋白质含量是数量性状, 借助分子标记技术进行QTL定位分析是研究数量性状的常用方法。根据大豆数据库(www.soybase.org), 目前已报道29个与贮藏蛋白7S、11S组分含量相关的QTL[6,7]。除此之外, 刘顺湖等[8]以科丰1号×南农1138-2构建重组自交系群体为材料, 用复合区间作图法、多区间作图法和完备区间作图法定位到28个与11S、7S组分含量相关的QTL。简爽等[9]运用线性回归的方法进行表型和标记的关联分析, 2年均检测到的且与蛋白11S、7S组分相关联的SSR位点有14个。
根据罗庆明[10]、蒋涛等[11]、蔡凌等[12]对玉米-大豆带状套作中大豆蛋白质含量的研究结果, 套作大豆贮藏蛋白的11S、7S组分相对含量会受到气象因子不同程度的影响, 不同品质类型的大豆品种在净作和套作下受到的影响不同。因此, 可根据大豆在不同环境下的蛋白质含量的表现, 选择适合用于套作的大豆品种。
为了明确大豆贮藏蛋白组分含量对带状套作的响应及其遗传机制, 本研究利用南豆12和九月黄所构建的重组自交系群体(RILs), 对净作和套作下控制贮藏蛋白11S、7S组分的相对含量的QTL进行定位, 并筛选出相关候选基因, 为进一步探究大豆蛋白质遗传机制奠定基础。
1 材料与方法
1.1 试验材料
由栽培大豆品种南豆12为母本、地方品种九月黄为父本杂交衍生而来的含有200个家系的RIL群体(F9~10)为材料。带状套作所用玉米品种为半紧凑型的正红505。1.2 试验设计
采用随机区组设计, 分别于E1 (2017年仁寿)、E2 (2017年雅安)和E3 (2016年仁寿) 3个环境中进行净作和套作种植。玉米在每年的4月6日播种、8月上旬收获, 大豆在每年的6月17日播种。净作大豆行长2.5 m, 行距0.5 m, 穴距0.1 m, 每穴留单株。带状套作采用2︰2宽窄行模式, 玉米行间距0.4 m, 玉米行与大豆行间距0.55 m, 套作大豆的行长、行距、穴距与净作大豆相同, 玉米密度为60,000株 hm-2。重复2次, 管理同一般大田。1.3 试验方法
大豆贮藏蛋白的提取及电泳参照王显生等[13]的方法。利用Bradford法[14]测定样品蛋白质浓度。SDS-PAGE选用5%的浓缩胶和12%的分离胶, 蛋白质上样量为30 μg。胶片在电泳结束后用考马斯亮蓝R-250染色, 乙醇和冰乙酸脱色, 利用EPSON LA2400扫描仪扫描成像。利用Quantity One v4.6.2软件, 根据亚基条带光密度占该泳道总光密度的百分率[14], 分别计算11S组分和7S组分及其各亚基的相对含量、11S组分与7S组分相对含量之和以及11S组分与7S组分相对含量之比(11S/7S)。在11S组分中, Acid亚基相对含量等于A1a、A1b、A2和A4亚基含量之和, Basic亚基相对含量等于B1a、B1b、B2、B3和B4亚基含量之和, A3、A5亚基含量单独计算。结果取3次重复的平均值。
1.4 QTL定位与候选基因筛选
利用SLAF-seq技术, 采用HighMap软件绘制了1张大豆遗传连锁图谱, 包括6366个分布于20个连锁群的SNP标记, 图谱总长度为2818.67 cM, 两标记之间的平均遗传图距为0.44 cM。结合该遗传连锁图谱[15], 利用QTL IciMapping v4.1软件的完备区间作图法(ICIM), 以1000次随机排列计算出LOD=3.2为阈值, 进行QTL定位。QTL的命名参照McCouch[16]的方法, 略有改动。例如, qAcid-6-131, q指QTL, Acid是性状英文简写, 6即该QTL所在的染色体, 131即该QTL所在染色体上的位置。根据简化基因组测序结果, 将QTL两端SNP标记的物理位置与大豆基因组数据库的全部基因物理位置进行比对, 结合各种功能数据库(NR、Swiss- Prot、GO、KOG、KEGG), 对QTL区段中的编码基因进行功能注释。
1.5 数据处理
使用Microsoft Excel 2010统计数据。利用IBM SPSS Statistics 22对贮藏蛋白质含量相关性状进行正态性检验和方差分析。2 结果与分析
2.1 亲本的表型分析及方差分析
对亲本的贮藏蛋白11S、7S组分及其各亚基的相对含量分析的结果如表1、图1、图2所示。南豆12在E1、E2、E3中分别有5个、2个、2个贮藏蛋白11S、7S组分含量相关性状的表型在不同种植方式中的差异显著或极显著; 九月黄在E1、E2、E3中均分别有3个贮藏蛋白11S、7S组分相对含量相关性状的表型在不同种植方式中差异显著或极显著。在E1净作下, 南豆12和九月黄之间的10个贮藏蛋白11S、7S组分相对含量相关性状的表型差异显著或极显著; 在套作下, 两亲本间的A5亚基相对含量差异显著。在E2净作下, 两亲本间11S/7S比值差异极显著; 在套作下, 两亲本间11S组分含量、11S与7S含量之和、A3亚基含量差异显著。在E3中, 两亲本间净作下的11S组分含量、11S/7S比值、α'亚基含量以及套作下的11S/7S比值、β亚基含量、Acid亚基含量差异显著或极显著。Table 1
表1
表1不同环境及种植方式下亲本的贮藏蛋白11S、7S组分相对含量
Table 1
| 性状 Trait | 种植方式 Planting pattern | E1 | E2 | E3 | ||||||
|---|---|---|---|---|---|---|---|---|---|---|
| 南豆12 ND12 | 九月黄 JYH | Sig. | 南豆12 ND12 | 九月黄 JYH | Sig. | 南豆12 ND12 | 九月黄 JYH | Sig. | ||
| 7S (%) | M | 20.18±0.22 b | 24.47±0.30 a | ** | 21.77±1.28 a | 21.55±0.63 a | NS | 22.84±0.20 a | 22.96±0.47 a | NS |
| RI | 23.42±1.40 a | 25.25±2.05 a | NS | 23.36±1.64 a | 21.25±1.16 a | NS | 22.43±2.21 a | 22.21±1.45 a | NS | |
| 11S (%) | M | 33.74±0.29 a | 42.47±0.31 A | ** | 36.80±2.06 a | 38.05±0.97 a | NS | 37.99±0.69 a | 36.08±0.76 a | * |
| RI | 35.57±1.64 a | 36.63±0.30 B | NS | 38.09±1.37 a | 35.35±1.02 b | * | 33.30±3.60 a | 38.12±2.03 a | NS | |
| 11S+7S (%) | M | 53.92±0.51 b | 66.94±0.27 a | ** | 58.58±3.33 a | 59.60±1.59 a | NS | 60.84±0.88 a | 59.04±1.18 a | NS |
| RI | 58.99±3.04 a | 61.88±2.16 b | NS | 61.45±1.01 a | 56.60±2.15 a | * | 55.73±5.80 a | 60.33±3.48 a | NS | |
| 11S/7S | M | 1.67±0.00 a | 1.74±0.03 A | * | 1.69±0.01 a | 1.77±0.01 a | ** | 1.66±0.02 A | 1.57±0.02 B | ** |
| RI | 1.52±0.02 b | 1.46±0.11 B | NS | 1.64±0.16 a | 1.67±0.05 b | NS | 1.48±0.02 B | 1.72±0.02 A | ** | |
| α' (%) | M | 6.67±0.03 B | 8.35±0.06 a | ** | 7.06±0.22 a | 7.12±0.17 a | NS | 7.08±0.54 a | 8.01±0.16 A | * |
| RI | 7.66±0.26 A | 8.84±0.96 a | NS | 7.29±0.83 a | 6.74±0.83 a | NS | 7.68±0.94 a | 6.90±0.36 B | NS | |
| Α (%) | M | 6.84±0.18 a | 9.49±0.28 a | ** | 7.92±0.75 a | 7.63±0.69 a | NS | 8.38±0.50 a | 8.14±0.81 a | NS |
| RI | 8.29±0.93 a | 9.89±0.89 a | NS | 8.50±0.92 a | 7.25±0.15 a | NS | 8.45±0.92 a | 7.72±0.72 a | NS | |
| Β (%) | M | 6.67±0.20 B | 6.63±0.42 a | NS | 6.80±0.38 b | 6.81±0.12 b | NS | 7.39±0.91 a | 6.81±0.30 b | NS |
| RI | 7.47±0.23 A | 6.52±0.66 a | NS | 7.57±0.27 a | 7.26±0.19 a | NS | 6.30±0.60 a | 7.59±0.37 a | * | |
| A3 (%) | M | 5.27±0.15 a | 7.43±0.76 a | ** | 5.04±0.71 a | 4.79±0.11 a | NS | 5.61±0.23 a | 5.28±1.24 a | NS |
| RI | 4.71±0.61 a | 6.52±1.07 a | NS | 5.47±0.21 a | 4.65±0.31 a | * | 5.37±0.15 a | 6.00±0.46 a | NS | |
| Acid (%) | M | 13.01±0.88 a | 17.17±0.78 a | ** | 15.79±2.58 a | 14.68±1.07 a | NS | 17.46±1.65 a | 15.77±1.65 a | NS |
| RI | 14.14±0.65 a | 16.35±2.29 a | NS | 16.98±1.68 a | 14.56±1.20 a | NS | 13.72±1.33 b | 17.39±0.44 a | ** | |
| Basic (%) | M | 8.65±0.44 a | 12.48±1.28 a | ** | 8.93±0.08 B | 9.82±0.57 a | NS | 8.27±0.47 a | 8.66±0.11 a | NS |
| RI | 9.36±1.42 a | 9.45±2.24 a | NS | 9.90±0.15 A | 9.24±0.96 a | NS | 8.95±0.71 a | 9.13±0.45 a | NS | |
| A5 (%) | M | 6.81±0.34 a | 5.39±0.66 a | * | 7.04±0.91 a | 8.75±1.31 a | NS | 6.71±2.71 a | 6.37±1.59 a | NS |
| RI | 7.36±0.92 a | 4.42±1.10 a | * | 5.74±0.58 a | 6.9±0.94 a | NS | 5.27±2.86 a | 5.60±1.65 a | NS | |
新窗口打开|下载CSV
2.2 RIL群体的表型分析、方差分析及相关性分析
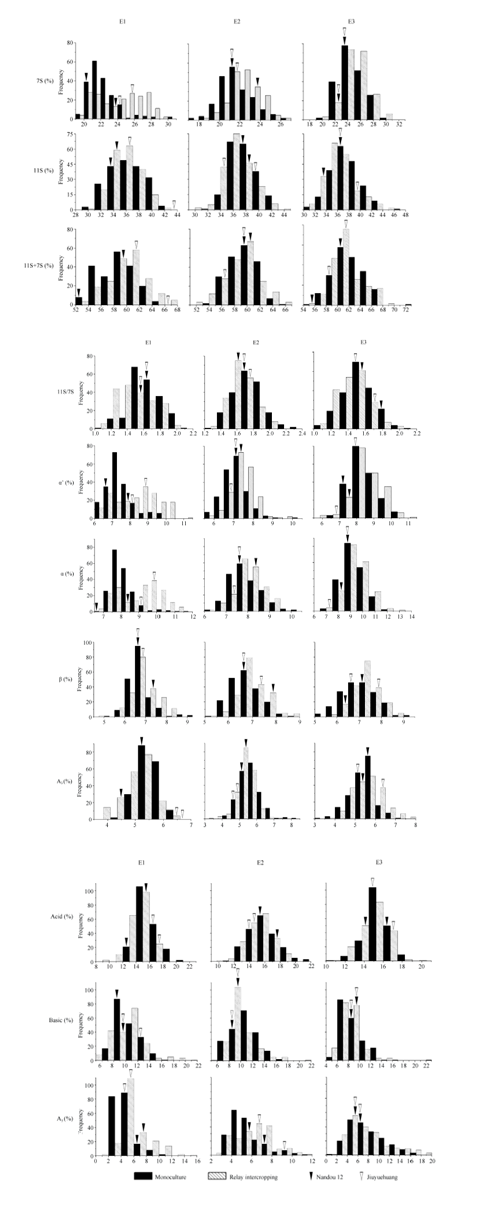
如表2、图1、图2所示, 各性状的极差总体在E3条件下较高, E1条件次之。RIL群体的贮藏蛋白质含量的偏度、峰度绝对值多数小于1且服从正态分布。表明贮藏蛋白11S、7S组分含量相关性状分离符合数量性状遗传特点, 该群体可用于QTL定位。图 1
 新窗口打开|下载原图ZIP|生成PPT
图 1大豆贮藏蛋白亚基的SDS-PAGE图谱
1: 南豆12; 2: 九月黄; 3: 158号家系材料; 4: 104号家系材料。缩写同
Fig. 1SDS-PAGE results of storage protein subunits in soybean seeds
1: Nandou 12; 2: Jiuyuehuang; 3: RIL158; 4: RIL104. Abbreviations are the same as those given in
图2
 新窗口打开|下载原图ZIP|生成PPT
图2RIL群体贮藏蛋白亚基含量频数分布图
缩写同
Fig. 2Frequency distribution profiles of glycinin and β-conglycinin from seed storage protein in RILs population
Abbreviations are the same as those given in
Table 2
表2
表2RIL群体贮藏蛋白11S、7S组分相对含量基本统计量分析
Table 2
| 性状 Trait | 环境 E | 种植方式 Planting pattern | 平均数±标准差 Mean±SD | 最大值 Max. | 最小值 Min. | 极差 Range | 变异系数 CV (%) | 偏度 Skew. | 峰度 Kurt. | P (S-W) |
|---|---|---|---|---|---|---|---|---|---|---|
| 7S (%) | E1 | M | 22.34±1.81 | 30.03 | 19.73 | 10.30 | 8.11 | 1.73 | 4.07 | 0.00 |
| RI | 24.30±2.67 | 29.35 | 19.17 | 10.18 | 10.99 | -0.10 | -1.30 | 0.00 | ||
| E2 | M | 21.74±1.63 | 26.88 | 17.49 | 9.39 | 7.52 | 0.49 | 0.33 | 0.01 | |
| RI | 22.44±1.45 | 26.24 | 18.16 | 8.08 | 6.45 | 0.03 | 0.06 | 0.74 | ||
| E3 | M | 24.67±1.92 | 29.92 | 19.60 | 10.32 | 7.78 | 0.23 | -0.37 | 0.21 | |
| RI | 25.22±1.92 | 30.18 | 19.89 | 10.29 | 7.60 | 0.14 | -0.04 | 0.35 | ||
| 11S (%) | E1 | M | 36.16±2.68 | 42.62 | 30.03 | 12.59 | 7.42 | 0.14 | -0.79 | 0.01 |
| RI | 35.65±2.27 | 41.83 | 29.24 | 12.59 | 6.37 | 0.15 | -0.17 | 0.75 | ||
| E2 | M | 37.73±2.05 | 42.69 | 32.39 | 10.30 | 5.43 | 0.26 | -0.35 | 0.05 | |
| RI | 36.57±2.30 | 44.09 | 29.91 | 14.18 | 6.28 | 0.25 | 0.52 | 0.20 | ||
| E3 | M | 37.47±2.62 | 46.31 | 30.46 | 15.85 | 6.99 | 0.14 | 0.01 | 0.34 | |
| RI | 36.22±2.74 | 44.36 | 30.87 | 13.49 | 7.56 | 0.81 | 0.48 | 0.00 | ||
| 11S+7S (%) | E1 | M | 58.50±2.81 | 65.08 | 52.05 | 13.03 | 4.80 | -0.03 | -0.79 | 0.00 |
| RI | 59.95±2.85 | 67.16 | 53.25 | 13.91 | 4.76 | -0.01 | -0.30 | 0.59 | ||
| E2 | M | 59.46±2.23 | 65.27 | 54.60 | 10.67 | 3.75 | 0.05 | -0.74 | 0.04 | |
| RI | 59.01±2.59 | 65.31 | 51.99 | 13.32 | 4.39 | -0.04 | 0.01 | 0.30 | ||
| E3 | M | 62.15±2.65 | 72.35 | 55.68 | 16.67 | 4.27 | 0.21 | 0.28 | 0.10 | |
| RI | 61.45±2.76 | 69.69 | 55.35 | 14.34 | 4.49 | 0.66 | 0.08 | 0.00 | ||
| 11S/7S | E1 | M | 1.63±0.19 | 2.10 | 1.10 | 1.00 | 11.67 | -0.17 | 0.01 | 0.11 |
| RI | 1.49±0.22 | 2.03 | 1.06 | 0.97 | 14.67 | 0.29 | -0.99 | 0.00 | ||
| E2 | M | 1.75±0.18 | 2.37 | 1.32 | 1.05 | 10.36 | 0.26 | 0.35 | 0.06 | |
| RI | 1.64±0.16 | 2.08 | 1.26 | 0.82 | 9.46 | 0.31 | -0.13 | 0.22 | ||
| E3 | M | 1.53±0.18 | 2.17 | 1.10 | 1.07 | 12.07 | 0.22 | 0.19 | 0.47 | |
| RI | 1.45±0.18 | 1.93 | 1.09 | 0.84 | 12.32 | 0.30 | -0.42 | 0.03 | ||
| α' (%) | E1 | M | 7.45±0.79 | 9.99 | 6.10 | 3.89 | 10.59 | 1.19 | 1.71 | 0.00 |
| RI | 8.35±1.22 | 11.12 | 6.02 | 5.10 | 14.61 | -0.07 | -1.06 | 0.00 | ||
| E2 | M | 7.10±0.65 | 10.01 | 5.61 | 4.40 | 9.09 | 0.57 | 1.79 | 0.00 | |
| RI | 7.43±0.61 | 9.87 | 5.81 | 4.06 | 8.18 | 0.24 | 1.72 | 0.00 | ||
| E3 | M | 8.39±0.77 | 10.46 | 6.66 | 3.80 | 9.21 | 0.42 | -0.32 | 0.00 | |
| RI | 8.53±0.85 | 11.05 | 5.98 | 5.07 | 9.95 | 0.01 | 0.41 | 0.14 | ||
| α (%) | E1 | M | 8.12±0.73 | 11.71 | 6.81 | 4.90 | 9.00 | 1.91 | 5.37 | 0.00 |
| RI | 9.03±1.17 | 11.33 | 6.73 | 4.60 | 12.94 | -0.17 | -1.10 | 0.00 | ||
| E2 | M | 7.92±0.72 | 10.24 | 6.20 | 4.04 | 9.09 | 0.60 | 0.36 | 0.00 | |
| RI | 8.04±0.63 | 9.81 | 6.32 | 3.49 | 7.87 | -0.03 | -0.02 | 0.61 | ||
| E3 | M | 9.28±0.89 | 11.93 | 6.81 | 5.12 | 9.59 | 0.22 | -0.27 | 0.13 | |
| RI | 9.43±0.94 | 12.60 | 6.97 | 5.63 | 9.98 | 0.29 | 0.47 | 0.14 | ||
| β (%) | E1 | M | 6.77±0.58 | 9.48 | 5.31 | 4.17 | 8.54 | 1.72 | 5.30 | 0.00 |
| RI | 6.92±0.61 | 8.33 | 4.97 | 3.36 | 8.78 | 0.07 | 0.08 | 0.02 | ||
| E2 | M | 6.72±0.61 | 8.73 | 5.46 | 3.27 | 9.13 | 0.30 | 0.02 | 0.11 | |
| RI | 6.97±0.60 | 8.95 | 5.49 | 3.46 | 8.63 | 0.46 | 0.80 | 0.01 | ||
| E3 | M | 7.01±0.76 | 9.37 | 5.23 | 4.14 | 10.85 | 0.11 | -0.05 | 0.75 | |
| RI | 7.26±0.59 | 8.71 | 5.54 | 3.17 | 8.15 | 0.03 | 0.09 | 0.64 | ||
| A3 (%) | E1 | M | 5.50±0.38 | 6.48 | 4.25 | 2.23 | 6.92 | -0.28 | 0.39 | 0.21 |
| RI | 5.06±0.55 | 6.25 | 3.71 | 2.54 | 10.89 | -0.41 | -0.24 | 0.00 | ||
| E2 | M | 5.64±0.61 | 8.20 | 4.30 | 3.90 | 10.86 | 0.77 | 1.84 | 0.00 | |
| RI | 5.35±0.54 | 7.02 | 3.16 | 3.86 | 10.11 | -0.37 | 1.65 | 0.00 | ||
| E3 | M | 5.42±0.62 | 7.15 | 3.45 | 3.70 | 11.35 | -0.36 | 0.34 | 0.04 | |
| RI | 5.60±0.72 | 7.56 | 3.94 | 3.62 | 12.85 | 0.33 | -0.14 | 0.10 |
新窗口打开|下载CSV
Table 2
Table 2Statistic analysis of the glycinin and β-conglycinin relative content of seed storage protein in RILs population (续表2)
| 性状 Trait | 环境 E | 种植方式 Planting pattern | 平均数±标准差 Mean±SD | 最大值 Max | 最小值 Min | 极差 Range | 变异系数 CV (%) | 偏度 Skew. | 峰度 Kurt. | P (S-W) |
|---|---|---|---|---|---|---|---|---|---|---|
| Acid (%) | E1 | M | 15.64±1.54 | 20.78 | 12.51 | 8.27 | 9.83 | 0.69 | 0.11 | 0.00 |
| RI | 14.38±1.52 | 17.99 | 8.70 | 9.29 | 10.57 | -0.60 | 0.90 | 0.00 | ||
| E2 | M | 15.86±1.92 | 21.60 | 11.33 | 10.27 | 12.10 | 0.50 | 0.26 | 0.01 | |
| RI | 15.16±1.68 | 19.19 | 9.57 | 9.62 | 11.08 | -0.07 | 0.07 | 0.43 | ||
| E3 | M | 15.38±1.25 | 18.93 | 10.92 | 8.01 | 8.15 | -0.29 | 0.98 | 0.04 | |
| RI | 14.90±1.38 | 19.04 | 11.33 | 7.71 | 9.26 | -0.19 | -0.19 | 0.22 | ||
| Basic (%) | E1 | M | 10.36±1.95 | 16.15 | 6.46 | 9.69 | 18.79 | 0.56 | -0.26 | 0.00 |
| RI | 10.18±2.83 | 20.32 | 5.35 | 14.97 | 27.78 | 0.84 | 1.50 | 0.00 | ||
| E2 | M | 10.77±2.21 | 16.66 | 6.33 | 10.33 | 20.52 | 0.16 | -0.62 | 0.03 | |
| RI | 9.89±2.25 | 20.84 | 5.37 | 15.47 | 22.75 | 1.78 | 4.17 | 0.00 | ||
| E3 | M | 8.82±2.31 | 23.59 | 4.81 | 18.78 | 26.24 | 1.90 | 7.63 | 0.00 | |
| RI | 8.09±1.79 | 15.48 | 4.50 | 10.98 | 22.09 | 0.96 | 2.47 | 0.00 | ||
| A5 (%) | E1 | M | 4.66±1.53 | 11.43 | 2.88 | 8.55 | 32.86 | 1.95 | 4.15 | 0.00 |
| RI | 6.02±2.32 | 15.45 | 0.88 | 14.57 | 38.44 | 1.21 | 1.57 | 0.00 | ||
| E2 | M | 5.45±1.63 | 11.61 | 3.01 | 8.60 | 29.84 | 1.22 | 1.56 | 0.00 | |
| RI | 6.17±1.76 | 11.42 | 2.83 | 8.59 | 28.56 | 0.30 | -0.21 | 0.00 | ||
| E3 | M | 7.85±3.36 | 17.74 | 1.09 | 16.65 | 42.85 | 0.65 | -0.13 | 0.00 | |
| RI | 7.64±3.94 | 18.83 | 1.75 | 17.08 | 51.52 | 1.03 | 0.31 | 0.00 |
新窗口打开|下载CSV
表3显示, 除11S组分与7S组分相对含量之和在不同种植方式下差异不显著外, 其余性状在三因素及三因素交互作用下的差异均显著或极显著。
Table 3
表3
表3大豆贮藏蛋白11S、7S组分相对含量的方差分析
Table 3
| 性状 Trait | 变异来源 Variability source | ||||||
|---|---|---|---|---|---|---|---|
| E | P | G | E×P | E×G | P×G | E×P×G | |
| 7S (%) | 2719.17** | 1130.16** | 16.35** | 198.05** | 12.31** | 15.24** | 9.05** |
| 11S (%) | 232.79** | 390.23** | 9.34** | 22.11** | 9.01** | 8.57** | 6.90** |
| 11S+7S (%) | 577.47** | 1.81 | 5.13** | 90.72** | 4.71** | 4.39** | 4.42** |
| 11S/7S | 3509.46** | 3081.43** | 34.63** | 68.89** | 29.83** | 35.37** | 20.09** |
| α' (%) | 1534.95** | 670.80** | 10.08** | 169.27** | 6.65** | 8.86** | 6.62** |
| α (%) | 1726.56** | 423.291** | 8.68** | 181.27** | 6.97** | 7.90** | 5.07** |
| β (%) | 131.30** | 162.88** | 6.03** | 4.20* | 4.76** | 4.04** | 3.80** |
| A3 (%) | 60.23** | 91.30** | 3.89** | 93.41** | 3.23** | 2.47** | 2.70** |
| Acid (%) | 43.73** | 324.46** | 5.05** | 26.16** | 3.87** | 3.09** | 4.02** |
| Basic (%) | 490.46** | 116.33** | 7.57** | 14.65** | 5.40** | 5.82** | 4.28** |
| A5 (%) | 541.06** | 97.84** | 5.93** | 52.02** | 6.24** | 5.73** | 4.71** |
新窗口打开|下载CSV
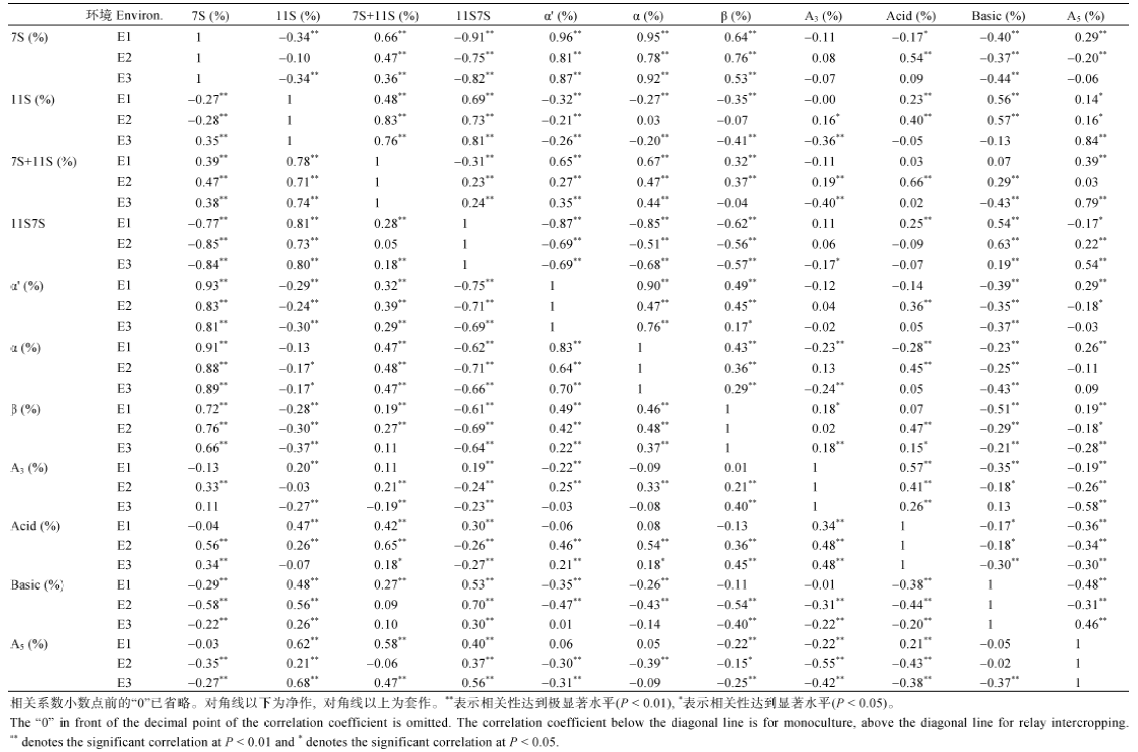
在E1、E2、E3中, 各性状在净作和套作下的相关性基本一致(表4)。11S及其各亚基相对含量、11S/7S比值和7S及其各亚基相对含量之间基本呈显著或极显著负相关; 7S与11S相对含量之和、11S/7S比值和11S及其各亚基相对含量之间基本呈显著或极显著正相关。
Table4
Table4Correlation analysis of the relative contents of glycinin and β-conglycinin from seed storage protein under disserent planting patterns in E1,E2,and E3
新窗口打开|下载CSV
2.3 QTL分析
共检测到10个控制大豆贮藏蛋白11S、7S组分含量相关的QTL (表5), 在净作和套作下各检测到5个, 分布于9条染色体, 解释了5.63%~9.68%的表型变异。在E1定位到5个QTL, 分布于6号、10号、14号、18号、19号染色体, 除qAcid-6-131和qGpC-18-85外, 其余QTL加性效应均为负, 增效等位基因来自亲本南豆12; 在E2定位到3个QTL, 分布于1号、8号染色体, 除qAlpha-8-27外, 其余QTL加性效应为负; 在E3定位到2个QTL, 分布于4号、20号染色体。Table 5
表5
表5贮藏蛋白11S、7S组分相对含量相关QTL
Table 5
| 环境 Environ. | 种植方式 Planting pattern | QTL | 标记区间 Marker interval | LOD | 贡献率 PVE(%) | 加性效应 Add. effect | 置信区间 Confidence interval |
|---|---|---|---|---|---|---|---|
| E1 | M | qAcid-6-131 | Marker359561-Marker361355 | 5.63 | 8.06 | 0.53 | 130.5-131.5 |
| qAcid-10-80 | Marker584033-Marker584037 | 4.03 | 5.63 | -0.46 | 79.5-80.5 | ||
| qAcid-14-155 | Marker713356-Marker710168 | 4.06 | 5.81 | -0.47 | 153.5-158.0 | ||
| RI | qGpC-18-85 | Marker1158309-Marker1157431 | 5.61 | 6.62 | 1.06 | 84.5-85.5 | |
| qBeta-19-5 | Marker1175558-Marker1175562 | 4.03 | 9.01 | -0.18 | 4.5-5.5 | ||
| E2 | M | qBeta-1-135 | Marker69562-Marker69768 | 3.21 | 7.49 | -0.18 | 134.5-135.5 |
| RI | qAlpha-8-27 | Marker460291-Marker460320 | 4.40 | 9.68 | 0.20 | 26.5-27.5 | |
| qBeta-1-13 | Marker2130-Marker2656 | 3.22 | 7.14 | -0.17 | 11.5-15.5 | ||
| E3 | M | qAcid-4-67 | Marker270606-Marker271196 | 3.68 | 8.20 | -0.40 | 66.5-70.5 |
| RI | qGpC-20-110 | Marker1242459-Marker1242433 | 3.65 | 8.60 | 0.82 | 109.5-110.5 |
新窗口打开|下载CSV
2.4 候选基因的筛选
在控制贮藏蛋白11S、7S组分相对含量的QTL区段内总共注释到229个基因, 在净作中有138个, 在套作中有91个。如表6所示, 与贮藏蛋白11S、7S组分含量相关的候选基因共有65个, 按GO注释结果将其分为5组, 在净作中有34个, 在套作中有31个。第一组有30个基因, 与植物激素(生长素、脱落酸、乙烯)调节相关, 影响贮藏蛋白的合成与运输。第二组是19个与氨基酸合成相关的基因。第三组是14个与蛋白质磷酸化相关基因, 蛋白质磷酸化会影响蛋白质功能特性。第四组包含22个基因, 这些基因控制与蛋白质合成和加工相关的细胞器(液泡、内质网)所涉及的生物过程。第五组含有19个与种子发育相关的基因。Table 6
表6
表6贮藏蛋白含量相关的候选基因分类
Table 6
| 分组 Group | 生物过程 Biological process | 基因ID (净作/套作) Gene ID (Monoculture/Relay intercropping) | 注释信息 Annotation description |
|---|---|---|---|
| I | 激素调节 Regulation of hormone | Glyma.01G179900; Glyma.14G193800, 060300, 195200, 195300, 196000, 196600, 197100, 197200, 197500, 197600, 198000, 198100, 198300, 198600, 199200, 200200, 202000, 202600, 202700, 203000 / Glyma.01G025300, 025400, 025500, 025600, 027400; Glyma.18G251800, 252200, 252300, 252400 | 脱落酸激活的信号通路、激素介导的信号通路、乙烯激活的信号通路、生长素反应、脱落酸反应 Abscisic acid-activated signaling pathway, hormone-mediated signaling pathway, ethylene-activated signaling pathway, response to auxin, response to abscisic acid |
| II | 氨基酸合成 Amino acid synthesis | Glyma.01G180100; Glyma.04G211400; Glyma.06G243800; Glyma.14G195300, 196600, 197100, 198700, 202000, 202700, 203000, 203700 / Glyma.01G025600, 027100, 027400, 028100, 028700; Glyma.08G210500; Glyma.18G250600, 251800 | 蛋白丝氨酸/苏氨酸激酶活性、丝氨酸家族氨基酸代谢过程 Protein serine/threonine kinase activity, serine family amino acid metabolic process |
| III | 蛋白质磷酸化 Protein phosphorylation | Glyma.06G243800; Glyma.14G195200, 196600, 202700, 203000 / Glyma.01G027100, 028000, 028700; Glyma.18G249400, 249700, 249900, 250500, 250600, 251800 | 蛋白质磷酸化、蛋白质丝氨酸/苏氨酸磷酸酶活性、蛋白质脱磷酸 Protein phosphorylation, protein serine/threonine phosphatase activity, protein dephosphorylation |
| IV | 细胞器生物过程 Organelle biological process | Glyma.04G212200, 212400; Glyma.14G194300, 194500, 196600, 197600, 198000, 198100, 198600, 199000, 202000, 202400, 203000 / Glyma.01G025200, 026000, 026200, 026700, 028100; Glyma.18G248400, 251300, 251800, 253200 | 内质网、液泡、内质网膜 E ndoplasmic reticulum, vacuole, endoplasmic reticulum membrane |
| V | 种子发育 Seed development | Glyma.01G179800; Glyma.14G197100, 197500, 199000, 202100 / Glyma.01G025200, 025300, 025400, 026200, 027400; Glyma.18G249400, 249700, 249800, 250000, 250100, 250600, 250700, 251200, 251800 | 子叶发育、以种子休眠结束的胚胎发育 Cotyledon development, embryo development ending in seed dormancy |
新窗口打开|下载CSV
3 讨论
11S的含硫氨基酸含量较7S高, 所以11S/7S比值是衡量大豆营养品质的一个重要指标, 但环境因素对贮藏蛋白11S/7S比值影响的研究少见报道。RIL群体的11S/7S比值呈E2>E1>E3的趋势, 且均在净作下显著高于套作。结合气象资料分析(表7), 大豆苗期(6月中旬至6月下旬)和成熟期(10月上旬至10月中旬)的日均温差呈E3>E2>E1的趋势, 结合卢为国等[17]研究可知苗期和成熟期较低的日均温差有利于11S/7S比值提高, 因此本研究的11S/7S比值与前人结论一致; 而在苗期的日均温度为E3>E2>E1, 由于苗期较高的日均温度利于11S/7S比值提高[17], 本研究的11S/7S比值与前人结论相反; 据此推测, RIL群体在净作下的11S/7S比值较高的原因可能是苗期套作大豆行间温度较净作低, 不利于套作下11S/7S比值的提高。Table 7
表7
表73个环境6月至10月气象资料
Table 7
| 月 Month | 旬 Ten-day periods | 日平均温度 Daily mean temperature | 日最高温度 Daily maximum temperature | 日最低温度 Daily minimum temperature | ||||||
|---|---|---|---|---|---|---|---|---|---|---|
| E1 | E2 | E3 | E1 | E2 | E3 | E1 | E2 | E3 | ||
| 6月 June | 上旬 The first ten days | 25.40 | 23.13 | 25.80 | 30.47 | 28.02 | 31.86 | 21.59 | 19.87 | 20.99 |
| 中旬 The middle ten days | 23.94 | 22.68 | 27.40 | 28.07 | 26.92 | 32.54 | 21.12 | 19.82 | 22.43 | |
| 下旬 The last ten days | 25.77 | 24.24 | 25.90 | 30.39 | 29.45 | 30.41 | 22.08 | 20.61 | 22.53 | |
| 7月 July | 上旬 The first ten days | 27.83 | 26.09 | 27.20 | 33.93 | 31.38 | 31.26 | 23.67 | 22.73 | 23.57 |
| 中旬 The middle ten days | 29.23 | 27.78 | 27.80 | 35.00 | 34.31 | 32.80 | 24.45 | 23.50 | 23.20 | |
| 下旬 The last ten days | 30.41 | 28.08 | 27.90 | 36.13 | 35.23 | 32.84 | 25.88 | 24.15 | 24.23 | |
| 8月 August | 上旬 The first ten days | 29.41 | 28.11 | 27.00 | 35.17 | 34.20 | 31.98 | 25.55 | 24.43 | 23.79 |
| 中旬 The middle ten days | 27.71 | 26.10 | 30.40 | 32.25 | 31.20 | 35.66 | 24.23 | 23.24 | 26.33 | |
| 下旬 The last ten days | 26.16 | 24.36 | 28.20 | 29.99 | 28.63 | 33.05 | 23.40 | 21.88 | 24.72 | |
| 9月 September | 上旬 The first ten days | 23.95 | 22.54 | 23.10 | 27.66 | 27.38 | 27.12 | 21.31 | 19.81 | 20.43 |
| 中旬 The middle ten days | 23.68 | 22.29 | 22.00 | 27.40 | 26.03 | 25.40 | 21.22 | 20.30 | 19.82 | |
| 下旬 The last ten days | 23.04 | 21.55 | 22.30 | 26.43 | 25.89 | 25.95 | 20.94 | 19.24 | 19.88 | |
| 10月 October | 上旬 The first ten days | 19.97 | 18.77 | 22.00 | 23.73 | 23.03 | 25.59 | 17.70 | 16.85 | 19.47 |
| 中旬 The middle ten days | 17.07 | 15.75 | 18.30 | 19.41 | 18.36 | 20.94 | 15.65 | 14.28 | 16.55 | |
| 下旬 The last ten days | 16.02 | 14.97 | 17.70 | 18.60 | 17.70 | 20.75 | 14.33 | 13.58 | 15.76 | |
新窗口打开|下载CSV
通过对不同环境、不同种植方式下贮藏蛋白亚基相关性状间相关性分析(表4), 表明7S相对含量与11S相对含量之间呈现“此消彼长”的关系, 这与前人研究结果中7S组分和11S组分之间存在含量补偿机制相符[18,19,20]。因此, 通过调节11S/7S比值可降低7S相对含量, 进而达到改善大豆蛋白制品的加工和营养品质的目的[21]。
在大豆数据库(www.soybase.org)中, 与贮藏蛋白11S、7S组分含量相关的QTL主要分布于1号、4号、6号、10号、17号染色体; 刘顺湖等[8]利用ICIM法定位到控制11S、7S组分含量的QTL主要分布于1号、2号、15号染色体; 本研究定位到的QTL主要分布于1号染色体, 且共有5个QTL分布于1号、4号、6号、10号染色体。与前人结果比较, 发现在1号染色体上的qβ-1-135的物理区段(51,558,983~51,642,998 bp)与Ma等[7]定位到的QTL物理区段(49,734,098~54,121,486 bp)重合。本研究在E1、E2、E3的不同种植方式下没有检测到稳定的QTL, 可能是因为蛋白质含量相关性状容易受环境因素的影响, 如E3和E2在苗期(6月中旬至6月下旬)及成熟期(10月上旬至10月中旬)的日平均温度均有差异, 从而造成各环境下蛋白质合成与积累的不同。
根据基因注释以及拟南芥数据库(www. arabidopsis.org)信息, 在与贮藏蛋白11S、7S组分含量相关性状的65个候选基因中筛选出2个可能相关的候选基因。Glyma.06G243800在拟南芥中的同源基因AT1G29720的产物为富半胱氨酸受体激酶, 是酪氨酸激酶的一种; 酪氨酸激酶在拟南芥种子中参与脱落酸的转导[22], 高浓度的(3.8 μmol L-1)脱落酸会减少土豆所有器官中硝酸盐还原酶的活性[23], 在转基因小麦中过表达烟草硝酸盐还原酶基因会使小麦籽粒蛋白质含量增加[24]。Glyma.01G026700在拟南芥中的同源基因AT1G70580编码的谷氨酰胺转肽酶(GGT2), 是目前唯一一种能在谷胱甘肽中裂解谷氨酸和半胱氨酸之间肽键的酶[25], 而谷胱甘肽会影响大豆种子贮藏蛋白质亚基的积累[26]。
4 结论
在不同的环境和种植方式下, 亲本与RIL群体的贮藏蛋白组分含量及比值差异显著或极显著。与贮藏蛋白11S、7S组分含量相关的10个QTL贡献率为5.63%~9.68%, 主要分布于1号染色体, 增效等位基因多来自于南豆12。在QTL区段中筛选出65个与贮藏蛋白质含量相关的候选基因。参考文献 原文顺序
文献年度倒序
文中引用次数倒序
被引期刊影响因子
[本文引用: 1]
[本文引用: 1]
[本文引用: 1]
[本文引用: 1]
[本文引用: 1]
[本文引用: 1]
[本文引用: 1]
[本文引用: 1]
[本文引用: 1]
[本文引用: 2]
[本文引用: 2]
[本文引用: 2]
[本文引用: 1]
[本文引用: 1]
[本文引用: 1]
[本文引用: 1]
[本文引用: 1]
[本文引用: 1]
[本文引用: 1]
[本文引用: 1]
[本文引用: 1]
[本文引用: 1]
[本文引用: 2]
[本文引用: 1]
[本文引用: 1]
[本文引用: 2]
[本文引用: 2]
[本文引用: 1]
[本文引用: 1]
[本文引用: 1]
[本文引用: 1]
[本文引用: 1]
[本文引用: 1]
[本文引用: 1]
[本文引用: 1]
[本文引用: 1]
[本文引用: 1]
