 ,1,2, 范金平2, 张伯桥2, 高德荣2, 王慧2, 刘业宇2, 吴素兰2, 程凯2, 王秀娥,1,*1
 2
Comparison of different mathematical models describing flag leaf senescence process of wheat and characteristics of leaf senescence process
LYU Guo-Feng,1,2, FAN Jin-Ping2, ZHANG Bo-Qiao2, GAO De-Rong2, WANG Hui2, LIU Ye-Yu2, WU Su-Lan2, CHENG Kai2, WANG Xiu-E,1,*1 2
通讯作者:
第一联系人:
收稿日期:2018-02-3接受日期:2018-10-8网络出版日期:2018-11-07
| 基金资助: |
Received:2018-02-3Accepted:2018-10-8Online:2018-11-07
| Fund supported: |

摘要
关键词:
Abstract
Keywords:
PDF (423KB)元数据多维度评价相关文章导出EndNote|Ris|Bibtex收藏本文
本文引用格式
吕国锋, 范金平, 张伯桥, 高德荣, 王慧, 刘业宇, 吴素兰, 程凯, 王秀娥. 小麦旗叶衰老过程不同数学模型拟合比较及衰老特征分析[J]. 作物学报, 2019, 45(1): 144-152. doi:10.3724/SP.J.1006.2019.81014
LYU Guo-Feng, FAN Jin-Ping, ZHANG Bo-Qiao, GAO De-Rong, WANG Hui, LIU Ye-Yu, WU Su-Lan, CHENG Kai, WANG Xiu-E.
小麦籽粒产量的70%都来自开花后冠层光合器官碳水化合物的积累, 延缓和延迟叶片衰老, 延长叶片的绿色叶面积持续期对增加籽粒产量[1,2,3,4]有重要作用, 同时还可提高小麦对低氮[5,6]、水分供应不足[7,8]、高温[9,10]等逆境胁迫的抗性。准确描述小麦叶片衰老过程有助于加深对该生理过程的认识, 通过叶片衰老过程的合理调控, 可达到提高产量的目的。
生物体生长速度通常呈现慢-快-慢的“S”型曲线变化特点, 小麦籽粒灌浆过程亦然[11,12,13,14,15]。Logistic[11,12,13,14,15]和Richards模型[16,17,18]被广泛用于定量描述籽粒灌浆过程和灌浆特性。叶片衰老是与籽粒灌浆并行的生物学过程, 与籽粒灌浆过程明显不同的是, 衰老随日龄增加而负增长。对于利用“S”型曲线模型描述作物叶片衰老过程尚缺乏深入研究。Logistic模型的$y=a{{\text{e}}^{b-cx}}/(\text{1+}{{\text{e}}^{b-cx}})$方程被用于拟合高粱[19,20,21]和玉米[22,23]的叶片衰老过程, 而对小麦叶片衰老过程则以Logistic模型另一方程形式$y=a/(\text{1+}{{\text{e}}^{b+cx}})$进行描述, 并以拟合曲线的特征参数作为品种延绿性的评价指标[24]; 此外, Gompertz模型方程$y=a[\text{1}-{{\text{e}}^{-b(x-c)}}]$ [25]和$y=a{{\text{e}}^{-b{{\text{e}}^{-cx}}}}$ [26]被用于小麦叶片衰老过程拟合, 拟合曲线的特征参数作为延绿指标被用于小麦延绿性状QTL的定位研究。以上研究仅是单个模型在作物叶片衰老研究中的应用, 缺少Logistic和Gompertz模型对小麦叶片衰老过程拟合适用性的比较分析, 以及同一模型不同方程拟合效果差异的比较, 而小麦籽粒灌浆中常用的Richards模型能否用于描述小麦叶片衰老过程未见文献报道。本研究用“S”型曲线模型中应用最广泛的Logistic、Gompertz和Richards模型对不同小麦品种开花后旗叶衰老过程进行拟合, 拟阐明小麦叶片衰老过程的特征, 筛选描述小麦旗叶衰老过程的最适数学模型, 为小麦种质延绿性评价、延绿的遗传研究提供方法。
1 材料与方法
1.1 试验设计
以2010—2011年度和2011—2012年度我国黄淮冬麦区、北方冬麦区、长江中下游冬麦区、西南冬麦区新育成的91和105个新品种(系)为试验材料, 其中第2年的试验材料包括第1年已初步鉴定表现为延绿或中等延绿的36个品种(系)。两年(本文按收获年份分别称为2011年和2012年)均在江苏里下河地区农业科学研究所万福试验基地进行田间试验, 随机区组设计, 重复3次。每小区种5行, 行长1.33m, 行距0.23m, 小区面积1.84 m2, 折合基本苗120万株 hm-2。播种日期分别为2010年10月25日和2011年10月28日, 为长江下游地区小麦生产的适播期。施肥以及病、虫、草害防除等栽培农艺措施同大田生产。
1.2 延绿性状调查和分级
以小区50%穗的中部小穗开花记为该小区的开花期, 选择每个小区开花期相同的4个主茎穗挂牌标记。从开花后第10天起, 采用目测估计法记录标记单株旗叶绿色面积的百分比(percent of green leaf area, %GLA), 每隔4 d调查一次。选择数据完整的3个单株同一日龄的%GLA计算算术平均值, 作为小区此日龄下的%GLA; 3个重复的算术平均值作为该品种此日龄下的%GLA。参照Pask和Pietragalla[27]的旗叶衰老分级标准, 开花期旗叶的%GLA为100%, 完全黄化时旗叶的%GLA为0, 每10%为一个等级, 共10级。
1.3 建模数据处理
采用Matlab2010b (MathWorks, Inc)统计分析数据。以品种开花后10、15、20、25和30 d旗叶的%GLA为变量, 采用Matlab中的fcm函数对品种的延绿性进行聚类分析。采用Matlab中的anova1和mutlcompare函数分别对品种的延绿性进行方差分析和多重比较。以品种开花后日龄为自变量(x), 对日龄进行标准正态化处理, 相应日龄下的%GLA为依变量(y), 利用Matlab中的cftool工具箱以稳健拟合方式对品种或不同延绿品种类型总体旗叶的衰老过程进行曲线拟合。分3步建立旗叶衰老过程数学模型。首先对2011和2012年试验品种采用模糊聚类的方法进行延绿性分类; 其次, 用Logistic、Gompertz和Richards模型的通用方程分别对不同延绿品种类型总体旗叶%GLA的衰减过程进行拟合, 初步确定描述小麦旗叶衰老过程的模型; 最后, 用确定模型对2011年和2012年试验品种的单个品种旗叶%GLA的衰减过程进行拟合, 以确定模型在年度和品种间的适合性。
用决定系数R2和均方根误差(root mean squared error, RMSE)作为检验拟合方程拟合优度的统计量。R2为回归平方和占总平方和的比例, 表示拟合方程曲线对观测值的吻合程度。RMSE是衡量拟合方程精确度的指标, 表示拟合方程预测值与观测值的偏离程度。
$\text{RMSE}=\sqrt{\frac{\sum{_{i=1}^{n}{{({{O}_{i}}-{{S}_{i}})}^{2}}}}{n}}$
式中, Oi为观测值; Si为模型预测值; n为样本容量, i为观测值和预测值的样本序号。
1.4 小麦叶片衰老模型及参数意义
小麦旗叶%GLA的衰减过程用Gompertz模型的通用方程[28]进行拟合。式中, y为某日龄下旗叶的绿色叶面积百分比(%GLA), x为开花后天数。a、b和c为方程系数, 其中a为旗叶%GLA的理论初始值, 亦即旗叶%GLA的最大值; b与旗叶衰老的速度有关, c为旗叶达到最大衰老速度的时间。对方程(1)求一阶导数, 得旗叶%GLA的衰减速率(R)方程。
对Gompertz方程(1)求二阶导数, 得旗叶%GLA衰减速率变化率R’方程。
当R’=0时, x值为旗叶衰老速率达到最大值的时间(time of maximum rate of senescence, TMRS)。
将TMRS带入方程(1)和(2), 分别得到最大衰老速率时旗叶的GLA% (ymax)和旗叶衰老的最大速率(maximum rate of senescence, MRS)。
对方程(2)求二阶导数, 令该二阶导数为零, 可得到衰老速率方程的2个拐点相应的X1和X2。
叶片快速衰老开始日期${{X}_{1}}=c-1\text{g}(\frac{3}{2}-\frac{\sqrt{5}}{2})/b$, 此时旗叶%GLA为${{P}_{1}}=a{{\text{e}}^{-{{\text{e}}^{-b({{x}_{1}}-c)}}}}$; 旗叶快速衰老结束日期${{X}_{2}}=c-1\text{g}(\frac{3}{2}+\frac{\sqrt{5}}{2})/b$, 此时旗叶%GLA为${{P}_{2}}=a{{\text{e}}^{-{{\text{e}}^{-b({{x}_{_{2}}}-c)}}}}$。
假定旗叶%GLA为理论最大值的1%时为叶片完全衰老, 此时日龄为叶片衰老的终止期X3, 由方程(1)解得。
设定旗叶开花期日龄X0 = 0, 则X3与X0的差值为旗叶绿色叶面积的持续期(green leaf area duration, GLAD)。
设定开花期旗叶的%GLA为理论最大值, 则旗叶衰老平均速度(average rate of senescence, ARS)为方程(10)。
旗叶衰老起始期持续时间T1 = X1-X0, 此期旗叶%GLA减少量P1 = P1-a, 旗叶平均衰老速度V1 = P1/T1; 旗叶快速衰老期持续时间T2 = X2-X1, 此期旗叶%GLA减少量P2 = P2-P1, 旗叶平均衰老速度V2=P2/T2; 旗叶衰老结束期持续时间T3 = X3-X2, 衰老结束期旗叶%GLA减少量P3 = 1-P2, 此期旗叶平均衰老速度V3 = P3/T3。
用Gompertz模型相同的推导过程, 可分别得到Logistic和Richards模型对小麦旗叶衰老过程拟合方程的特征参数(表1)。
Table 1
表1
表1Gompertz、Logistic和Richards模型拟合方程的特征参数
Table 1
| 模型 Model | 数学式 Equation | 最大衰老速度时间 TMRS | 最大衰老速度时的% GLA ymax | 最大衰老速度 MRS | 绿色叶面积持续期 GLAD | 平均衰老速度 ARS |
|---|---|---|---|---|---|---|
| Gompertz | $y=a{{\text{e}}^{-{{\text{e}}^{-b(x-c)}}}}$ | $c$ | $\frac{a}{\text{e}}$ | $\frac{ab}{e}$ | $c-\frac{\ln (-\ln 0.01)}{b}$ | $\frac{-99a}{\text{GLAD}}$ |
| Logistic | $y=\frac{a}{1+{{\text{e}}^{-b(x-c)}}}$ | $c$ | $\frac{a}{2}$ | $\frac{ab}{4}$ | $c-\frac{\ln 99}{b}$ | $\frac{-99a}{\text{GLAD}}$ |
| Richards | $y=\frac{a}{{{[1+{{\text{e}}^{-}}^{b(x-c)}]}^{\frac{1}{d}}}}$ | $c-\frac{\lg d}{b}$ | $\frac{a}{{{(d+1)}^{\frac{1}{d}}}}$ | $\frac{ab}{{{(d+1)}^{(\frac{1}{d}+1)}}}$ | $c-\frac{\ln ({{100}^{d}}-1)}{b}$ | $\frac{-99a}{\text{GLAD}}$ |
新窗口打开|下载CSV
2 结果与分析
2.1 小麦旗叶的衰老过程
以品种开花后10~30 d旗叶不同日龄下%GLA为变量, 通过模糊聚类法2年试验品种均可被分成4类。不同类型品种旗叶的%GLA从开花至花后20 d都呈缓慢下降, 不同类型品种间旗叶%GLA差异较小, 随着生育进程, 旗叶%GLA加速下降, 不同类型品种旗叶的%GLA的差异加大, 并达到显著水平(表2)。Table 2
表2
表2不同延绿类型品种旗叶的%GLA衰减的过程
Table 2
| 类型 Type | 品种数 Variety number | DAA10 | DAA15 | DAA20 | DAA25 | DAA30 | ||||||
|---|---|---|---|---|---|---|---|---|---|---|---|---|
| 2011 | 2012 | 2011 | 2012 | 2011 | 2012 | 2011 | 2012 | 2011 | 2012 | 2011 | 2012 | |
| 延绿 SG | 10 | 22 | 99.2 a | 96.6 a | 98.7 a | 91.7 a | 95.6 a | 82.3 a | 89.0 a | 56.5 a | 53.0 a | 11.4 a |
| 中等延绿 MSG | 21 | 32 | 98.0 ab | 96.3 a | 95.7 b | 90.0 a | 91.5 ab | 75.1 b | 74.5 b | 37.8 b | 9.8 b | 3.7 b |
| 中等早衰 MNSG | 28 | 40 | 97.5 b | 94.6 b | 95.0 b | 85.8 b | 89.7 b | 64.4 c | 45.9 c | 13.2 c | 0.8 c | 0.7 c |
| 早衰 NSG | 32 | 11 | 98.3 ab | 92.7 c | 95.2 b | 81.5 c | 85.6 c | 26.9 d | 11.6 d | 0.5 d | 0 c | 0 c |
新窗口打开|下载CSV
2年试验品种旗叶%GLA衰减过程不同, 2012年4种类型品种旗叶%GLA快速下降均早于2011年相应类型的试验品种(表2)。延绿类型品种灌浆后期旗叶%GLA均显著高于其他类型品种; 中等延绿类型灌浆后期的旗叶%GLA均显著高于中等早衰和早衰类型品种, 但低于延绿类型品种; 中等早衰类型品种在花后30 d旗叶的%GLA与早衰类型品种差异不显著, 但花后25 d的旗叶%GLA显著高于早衰类型品种; 早衰类型品种在花后30 d已丧失光合作用功能, 且在花后20 d和25 d时, 旗叶的%GLA均显著低于其他类型品种。
2.2 小麦旗叶衰老模型的建立
2.2.1 “S”型曲线中的不同模型对小麦品种旗叶衰老过程的拟合 Logistic、Gompertz和Richards模型是“S”型曲线中应用最为广泛的3个模型。用其通用方程对2年不同延绿类型品种总体旗叶%GLA衰减过程进行拟合, 效果存在差异。2年Gompertz模型拟合方程的R2均大于Logistic模型对相应延绿类型拟合方程的R2, 同时RMSE小于Logistic模型对相应延绿类型的拟合结果(表3), 表明Gompertz模型对小麦旗叶衰老过程的拟合效果优于Logistic模型。Richards模型对2011年延绿和早衰类型品种的拟合效果低于Logistic模型, 但对其他2类品种拟合效果优于Logistic模型, 接近于Gompertz模型的拟合效果, 对2012年早衰类型品种的拟合效果低于Logistic模型, 但对其他3类品种拟合效果优于Logistic模型, 并与Gompertz模型的拟合效果相近, 2年结果表明, Richards模型与Gompertz模型对小麦旗叶衰老过程的拟合相近, 优于Logistic模型的拟合效果。Table 3
表3
表3Logistic、Gompertz和Richards模型对不同延绿类型品种拟合结果
Table 3
| 类型 Type | 品种数 No. of varieties | 模型 Model | 方程 Equation | 方程系数Coefficients | 模型适合性 Fitness of model | ||||||||||||||
|---|---|---|---|---|---|---|---|---|---|---|---|---|---|---|---|---|---|---|---|
| a | b | c | d | R2 | RMSE | ||||||||||||||
| 2011 | |||||||||||||||||||
| 延绿 Stay green | 10 | Logistic | $y=a/1+{{\text{e}}^{-b(x-c)}}$ | 98.40 | -3.67 | 1.35 | 0.9536 | 4.149 | |||||||||||
| Gompertz | $y=a{{\text{e}}^{-{{\text{e}}^{-b(x-c)}}}}$ | 98.53 | -3.15 | 1.48 | 0.9577 | 3.961 | |||||||||||||
| Richards | $y=a/{{[1+{{\text{e}}^{-b(x-c)}}]}^{\frac{1}{d}}}$ | 99.20 | -1.97 | 6.30 | 1.57×10⁻⁴ | 0.9426 | 4.662 | ||||||||||||
| 中等延绿 Moderately stay green | 21 | Logistic | $y=a/1+{{\text{e}}^{-b(x-c)}}$ | 95.59 | -4.93 | 0.93 | 0.9646 | 6.436 | |||||||||||
| Gompertz | $y=a{{\text{e}}^{-{{\text{e}}^{-b(x-c)}}}}$ | 96.71 | -2.95 | 1.09 | 0.9710 | 5.798 | |||||||||||||
| Richards | $y=a/{{[1+{{\text{e}}^{-b(x-c)}}]}^{\frac{1}{d}}}$ | 97.05 | -2.62 | 7.40 | 6.85×10⁻⁸ | 0.9713 | 5.858 | ||||||||||||
| 中等早衰 Moderately non-stay green | 28 | Logistic | $y=a/1+{{\text{e}}^{-b(x-c)}}$ | 95.43 | -5.39 | 0.72 | 0.9846 | 4.760 | |||||||||||
| Gompertz | $y=a{{\text{e}}^{-{{\text{e}}^{-b(x-c)}}}}$ | 96.91 | -3.12 | 0.86 | 0.9893 | 3.976 | |||||||||||||
| Richards | $y=a/{{[1+{{\text{e}}^{-b(x-c)}}]}^{\frac{1}{d}}}$ | 97.10 | -3.07 | 5.76 | 2.98×10⁻⁷ | 0.9887 | 4.098 | ||||||||||||
| 早衰 Non-stay green | 32 | Logistic | $y=a/1+{{\text{e}}^{-b(x-c)}}$ | 97.39 | -7.58 | 0.33 | 0.9948 | 3.167 | |||||||||||
| Gompertz | $y=a{{\text{e}}^{-{{\text{e}}^{-b(x-c)}}}}$ | 97.47 | -5.07 | 0.50 | 0.9949 | 3.124 | |||||||||||||
| Richards | $y=a/{{[1+{{\text{e}}^{-b(x-c)}}]}^{\frac{1}{d}}}$ | 97.36 | -3.86 | 3.54 | 8.40×10⁻⁶ | 0.9880 | 4.832 | ||||||||||||
| 2012 | |||||||||||||||||||
| 延绿 Stay green | 22 | Logistic | $y=a/1+{{\text{e}}^{-b(x-c)}}$ | 94.31 | -2.84 | 0.78 | 0.9516 | 7.150 | |||||||||||
| Gompertz | $y=a{{\text{e}}^{-{{\text{e}}^{-b(x-c)}}}}$ | 96.29 | -1.95 | 0.98 | 0.9609 | 6.424 | |||||||||||||
| Richards | $y=a/{{[1+{{\text{e}}^{-b(x-c)}}]}^{\frac{1}{d}}}$ | 96.29 | -2.04 | 6.01 | 3.62×10⁻⁵ | 0.9596 | 6.564 | ||||||||||||
| 中等延绿 Moderately stay green | 32 | Logistic | $y=a/1+{{\text{e}}^{-b(x-c)}}$ | 94.81 | -2.79 | 0.52 | 0.9735 | 5.808 | |||||||||||
| Gompertz | $y=a{{\text{e}}^{-{{\text{e}}^{-b(x-c)}}}}$ | 98.08 | -1.78 | 0.73 | 0.9797 | 5.075 | |||||||||||||
| Richards | $y=a/{{[1+{{\text{e}}^{-b(x-c)}}]}^{\frac{1}{d}}}$ | 98.07 | -1.78 | 3.52 | 7.01×10⁻³ | 0.9795 | 5.118 | ||||||||||||
| 类型 Type | 品种数 No. of varieties | 模型 Model | 方程 Equation | 方程系数Coefficients | 模型适合性 Fitness of model | ||||||||||||||
| a | b | c | d | R2 | RMSE | ||||||||||||||
| 中等早衰 Moderately non-stay green | 40 | Logistic | $y=a/1+{{\text{e}}^{-b(x-c)}}$ | 93.31 | -3.42 | 0.20 | 0.9809 | 5.367 | |||||||||||
| Gompertz | $y=a{{\text{e}}^{-{{\text{e}}^{-b(x-c)}}}}$ | 96.30 | -2.12 | 0.39 | 0.9840 | 4.917 | |||||||||||||
| Richards | $y=a/{{[1+{{\text{e}}^{-b(x-c)}}]}^{\frac{1}{d}}}$ | 95.96 | -2.16 | 4.57 | 1.17×10⁻⁴ | 0.9836 | 4.992 | ||||||||||||
| 早衰 Non-stay green | 11 | Logistic | $y=a/1+{{\text{e}}^{-b(x-c)}}$ | 93.46 | -4.30 | -0.23 | 0.9916 | 3.783 | |||||||||||
| Gompertz | $y=a{{\text{e}}^{-{{\text{e}}^{-b(x-c)}}}}$ | 94.44 | -3.17 | -0.08 | 0.9917 | 3.768 | |||||||||||||
| Richards | $y=a/{{[1+{{\text{e}}^{-b(x-c)}}]}^{\frac{1}{d}}}$ | 94.03 | -3.65 | 0.02 | 0.50 | 0.9898 | 4.216 | ||||||||||||
新窗口打开|下载CSV
利用3个模型拟合旗叶衰老过程, 拟合方程的R2表现为早衰>中等早衰>中等延绿>延绿类型(表3), 表明3种模型对早衰类型品种旗叶衰老过程拟合的适合性较好, 而延绿类型品种适合性较低。
2.2.2 Gompertz模型对不同品种旗叶衰老过程的拟合
利用Gompertz模型通用方程对2011年和2012年单个试验品种的旗叶衰老过程分别进行拟合, 由R2和RMSE均值可以看出其较好的拟合效果, 但2年度拟合方程的R2和RMSE均有较大变幅, 表明Gompertz模型对不同品种的拟合效果存在差异(表4)。
Table 4
表4
表4Gompertz模型对试验品种旗叶衰老过程的拟合度
Table 4
| 年份 Year | 品种数 Number of varieties | R2均值 Mean of R2 | R2变幅 Range of R2 | RMSE均值 Mean of RMSE | RMSE变幅 Range of RMSE |
|---|---|---|---|---|---|
| 2011 | 91 | 0.997 | 0.948-1.000 | 2.062 | 0.007-10.640 |
| 2012 | 105 | 0.996 | 0.964-1.000 | 2.546 | 0-8.750 |
新窗口打开|下载CSV
2.2.3 不同延绿类型品种旗叶衰老过程的阶段特征
对试验品种旗叶衰老过程用Gompertz模型的通用方程进行拟合, 根据衰老速度曲线的拐点可把小麦旗叶衰老过程分为衰老起始期、快速衰老期和衰老结束期3个阶段。2年度不同延绿类型品种各阶段持续时间(T)均以起始期>快速期>结束期, 衰老起始期所占时间最长; 平均衰老速度(V)以快速期>结束期>起始期, 表现为“慢-快-慢”的变化特点; 旗叶%GLA下降的幅度(P)均以快速期>起始期>结束期, 其下降主要发生在快速衰老期(表5)。
Table 5
表5
表5不同延绿类型品种旗叶3个衰老阶段的参数
Table 5
| 类型 Type | 衰老起始期Initial senescence stage | 快速衰老期Rapid senescence stage | 衰老结束期Terminal senescence stage | ||||||
|---|---|---|---|---|---|---|---|---|---|
| T1 (d) | P1 (%) | V1 (% d-1) | T2 (d) | P2 (%) | V2 (% d-1) | T3 (d) | P3 (%) | V3 (% d-1) | |
| 2011 | |||||||||
| 延绿 SG | 28.9 a | -31.4 a | -1.1 a | 5.9 a | -60.3 a | -11.4 a | 1.7 a | -6.2 a | -4.0 a |
| 中等延绿 MSG | 25.8 b | -30.8 a | -1.2 b | 4.5 ab | -59.1 a | -15.1 a | 1.3 ab | -6.1 a | -5.3 a |
| 中等早衰 MNSG | 23.6 c | -30.8 a | -1.3 c | 4.2 b | -59.1 a | -14.8 a | 1.2 b | -6.1 a | -5.2 a |
| 早衰 NSG | 21.9 d | -31.0 a | -1.4 d | 3.4 b | -59.6 a | -19.5 b | 1.0 b | -6.2 a | -6.9 b |
| 2012 | |||||||||
| 延绿 SG | 23.7 a | -30.6 a | -1.3 a | 7.1 ab | -58.8 a | -9.0 a | 2.1 ab | -6.0 a | -3.1 a |
| 中等延绿 MSG | 21.3 b | -31.3 a | -1.5 b | 7.7 a | -60.1 a | -8.6 a | 2.2 a | -6.2 a | -3.0 a |
| 中等早衰 MNSG | 19.7 c | -30.5 a | -1.6 b | 6.3 bc | -58.6 a | -10.2 a | 1.8 bc | -6.0 a | -3.6 a |
| 早衰 NSG | 17.3 d | -30.0 a | -1.7 c | 4.4 c | -57.5 a | -13.6 b | 1.3 c | -5.9 a | -4.7 b |
新窗口打开|下载CSV
2年不同延绿类型品种衰老起始期的持续时间和平均衰老速度存在显著差异, 持续时间均值以延绿>中等延绿>中等早衰>早衰, 衰老速度均值以早衰>中等早衰>中等延绿>延绿; 快速衰老期持续时间均以早衰类型最短, 衰老速度以早衰类型品种最大, 并显著高于其他类型; 衰老结束期持续时间在4种类型间差异较小, 但均以早衰类型最短, 衰老速度以早衰类型最大, 显著大于其他3种类型品种(表5)。
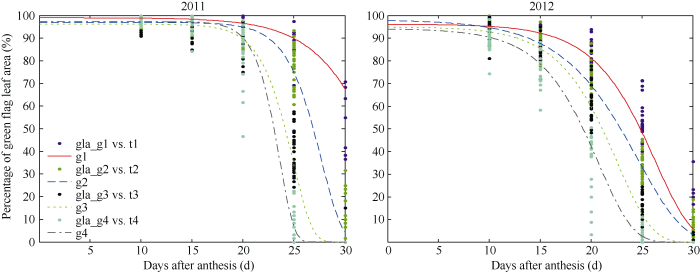
2011年和2012年不同延绿类型品种旗叶衰老过程不同。2012年不同延绿类型品种衰老起始期的持续时间短于2011年相应类型品种, 快速衰老期平均衰老速度均小于2011年相应类型品种(表5)。2年拟合曲线表现为2012年不同类型品种进入快速衰老时间早于2011年相应类型品种, 且旗叶衰老曲线平缓(图1)。
图1
 新窗口打开|下载原图ZIP|生成PPT
图1Gompertz方程对4种延绿类型品种旗叶衰老过程的拟合曲线
g1~g4分别代表延绿、中等延绿、中等早衰和早衰类型Gompertz拟合的曲线; gla_g1 vs t1、gla_g2 vs t2、gla_g3 vs t3和gla_g4 vs t4分别代表这4种延绿类型品种不同日龄下的%GLA。
Fig. 1Curve fitting flag leaf senescence process by Gompertz model for four types of stay green varieties
g1 to g4 represent curves fitted by Gompertz model for SG, MSG, MNSG, and NSG types, and gla_g1 vs t1, gla_g2 vs t2, gla_g3 vs t3, and gla_g4 vs t4 represent %GLA values of the four variety types, respectively.
2.3 不同延绿类型品种旗叶衰老特征参数
2年不同延绿类型品种旗叶的衰老过程特征不同, 达到最大衰老速度时间(TMRS)以延绿>中等延绿>中等早衰>早衰类型, 差异显著; 最大衰老速度(MRS) 2年不同延绿类型品种表现不同, 但均以早衰类型最大, 中等延绿和中等早衰类型品种间无显著差异; 绿色叶面积持续期(GLAD)以延绿>中等延绿>中等早衰>早衰类型, 差异显著; 平均衰老速度(ARS)以早衰>中等早衰>中等延绿>延绿类型, 差异显著, 表明衰老方程参数TMRS、MRS、ARS和GLAD可反映品种延绿性差异(表6)。Table 6
表6
表6不同延绿类型品种的旗叶衰老过程参数
Table 6
| 类型 Type | TMRS | MRS | GLAD | ARS | ||||
|---|---|---|---|---|---|---|---|---|
| 2011 | 2012 | 2011 | 2012 | 2011 | 2012 | 2011 | 2012 | |
| 延绿SG | 32.14 a | 26.71 a | -16.64 a | -13.09 a | 37.60 a | 32.08 a | -2.67 a | -3.00 a |
| 中等延绿MSG | 27.92 b | 24.55 b | -24.20 b | -11.74 a | 31.04 b | 31.10 a | -3.14 b | -3.15 a |
| 中等衰老MNSG | 25.27 c | 22.63 c | -22.53 b | -13.90 a | 28.57 c | 27.65 b | -3.38 c | -3.42 b |
| 早衰NSG | 23.34 d | 19.94 d | -29.44 c | -15.29 b | 25.90 d | 24.67 c | -3.78 d | -3.85 c |
新窗口打开|下载CSV
2012年不同延绿类型品种TMRS均小于2011年, GLAD短于2011年, MRS小于2011年, ARS与2011年相近, 表明2012年旗叶开始衰老早, 旗叶衰老变化平缓。
3 讨论
籽粒灌浆和叶片衰老是同时发生的与小麦粒重直接相关的2个生物学过程。小麦粒重是随日龄增加的正增长过程, 灌浆过程中灌浆速率的变化具有“S”型曲线的变化特点。本研究结果表明, 小麦旗叶衰老过程中衰老速度表现为快速衰老期>衰老起始期>衰老结束期, 与“S”型曲线描述的速度变化过程相似, 因此“S”型曲线可以用于小麦叶片衰老过程的描述。3.1 描述小麦叶片衰老过程的数学模型
Richards模型描述的是可变形状的曲线, Richards方程曲线形状参数d的不同取值, 不仅包含Mitseherlieh、Brody、Bertalanffy、Gompertz、Logistic等生长方程, 而且包含其中间过渡类型, 因而对生物的多样性生长过程具有广泛的适用性[29]。对小麦[17,18]、水稻[30]和玉米[31]籽粒灌浆以及花生油分积累[32]过程的研究表明, Richards方程对正增长过程的拟合优于Logistic模型。本研究表明, Richards模型适合度高于Logistic模型, 更接近Gompertz方程。当Richards方程$y=a/{{[1+{{\text{e}}^{-b(x-c)}}]}^{\frac{1}{d}}}$的曲线形状参数d = 1时, 为Logistic方程, 当d→0时, 即为Gompertz方程。本试验对不同类型品种总体旗叶衰老过程拟合方程参数d都趋近于0, 这是Richards方程拟合度接近于Gompertz方程, 而大于Logistic方程的原因。Logistic和Gompertz模型描述的都是固定形状的曲线。Logistic方程描述的曲线是以达到最大增长速度时间为拐点的对称曲线, 此时y的累积量为总量的1/2; Gompertz方程是非对称曲线, 达到最大增长速度的时间, 即曲线的拐点, 此时y的累积量为总量的36.7%, Gompertz曲线y增量主要在拐点后区间[33]。本研究表明, 不同延绿类型品种旗叶%GLA的衰减主要出现在旗叶衰老过程的中后期, 这与Gompertz模型描述曲线y增量主要在拐点后区间相似, 同时Gompertz模型对不同延绿类型品种旗叶衰老过程的拟合效果优于Logistic模型, 表明Gompertz模型能更好地反映小麦开花后旗叶衰老动态变化过程, 对小麦叶片衰老过程的描述更准确。
对Logistic和Gompertz方程参数的准确估计是获得正确结果的重要方面。Logistic和Gompertz方程通过变量变换可分别得到线性化表达式$\ln [(a-y)/y]=-b(x-c)$和$\ln (\ln a-\ln y)=-b(x-c)$, 通过线性回归的最小二乘法易估计方程参数, 同时曲线特征参数的推导过程已有大量研究[17-18,33-34], 可以直接利用Microsoft Excel计算特征参数, 避免统计软件复杂的曲线拟合和特征参数的计算过程。Richards方程是纯非线性方程, 无法用线性化方法估计参数, 参数的获得较为复杂, Gompertz模型是Richards模型的特殊类型, 两者对小麦叶片衰老过程拟合效果相近, 从使用角度讲, Gompertz模型较Richards更易利用。
3.2 Gompertz和Logistic模型的不同方程对小麦叶片衰老过程的拟合
梁增浩[26]用Gompertz方程$y=a{{\text{e}}^{-b{{\text{e}}^{-cx}}}}$对旱选10号×鲁麦14组合DH群体在雨养和灌溉环境下叶片衰老过程进行拟合, 本研究所用方程表达形式上与其有所不同。我们采用的Gompertz模型的通用方程$y=a{{\text{e}}^{-{{\text{e}}^{-b(x-c)}}}}$描述小麦旗叶衰老过程, 此方程可以写成$y=a{{\text{e}}^{-{{\text{e}}^{bc-bx}}}}$和$y=a{{\text{e}}^{-{{\text{e}}^{bc}}{{\text{e}}^{-bx}}}}$2种形式, 进一步又可分别简写成$y=a{{\text{e}}^{-{{\text{e}}^{b-cx}}}}$和$y=a{{\text{e}}^{-b{{\text{e}}^{-cx}}}}$, 其中$y=a{{\text{e}}^{-b{{\text{e}}^{-cx}}}}$与梁增浩[26]应用的Gompertz方程相同, 也是Gompertz模型对增长过程研究中最常见的方程形式。Vijyalakshmi等[25]用Gompertz方程$y=a[1-{{\text{e}}^{-b(x-c)}}]$对Ventnor×Karl92的DH群体在热胁迫和正常环境下的叶片衰老过程进行描述, 此方程对本研究试验品种的旗叶衰老过程不能拟合, 而此方程与其引用Seber和Wild[28]的Gompertz模型的通用方程$y=a{{\text{e}}^{-{{\text{e}}^{-k(x-\text{ }\!\!\gamma\!\!\text{ })}}}}$方程形式不同, 可能是书写错误。本研究用Logistic模型的通用方程$y=a/[1+{{\text{e}}^{-b(x-c)}}]$对小麦叶片的衰老过程取得较好的拟合效果。Logistic模型的变形方程$y=a{{\text{e}}^{b-cx}}/(1+{{\text{e}}^{b-cx}})$多用于对高粱[19,20,21]和玉米[22,23]叶片衰老过程的描述。本试验利用此方程对2011年不同延绿类型品种旗叶衰老过程进行拟合, 拟合曲线与Logistic模型通用方程$y=a/[1+{{\text{e}}^{-b(x-c)}}]$拟合曲线重合, 方程系数相同, 拟合方程的R2和RMSE相同, 表明这2个方程实际是同一模型的不同方程表达形式。Logistic模型的变形方程$y=a{{\text{e}}^{b-cx}}/(1+{{\text{e}}^{b-cx}})$通过简化可表述为$y=a/(1+1/{{\text{e}}^{b-cx}})$, 而此式又可以写成$y=a/$ $(1+{{\text{e}}^{-b+cx}})$。本研究所用Logistic模型的通用方程$y=a/[1+{{\text{e}}^{-b(x-c)}}]$可以写成$y=a/(1+{{\text{e}}^{b-cx}})$和$y=a/(1+b{{\text{e}}^{-cx}})$2种方程形式, 其中$y=a/(1+{{\text{e}}^{b-cx}})$与高粱和玉米叶片衰老过程描述所用方程$y=a{{\text{e}}^{b-cx}}$ $/(1+{{\text{e}}^{b-cx}})$的简化形式之一$y=a/(1+{{\text{e}}^{-b+cx}})$只是方程系数b和c的正负号相反, 应为同一方程, 因此拟合结果相同。此外, 薛晖等[24]用Logistic模型的变形方程$y=a/(1+{{\text{e}}^{b+cx}})$对小麦叶片衰老过程进行拟合, 此方程与本研究所用Logistic模型通用方程的变形方程之一$y=a/(1+{{\text{e}}^{b-cx}})$仅方程系数c的正负号相反, 应为同一模型的不同方程形式。
3.3 Gompertz模型对小麦不同延绿类型品种叶片衰老过程拟合的差异
本研究利用Gompertz模型的通用方程对2年试验品种的不同延绿类型品种旗叶衰老过程进行拟合, 拟合度均以早衰>中等早衰>中等延绿>延绿。其原因主要是, 延绿类型品种在成熟时旗叶尚未完全黄化, 存在一定比例的绿色叶面积, 测定的旗叶衰老过程只是Gompertz曲线描述的部分过程, 而其他类型品种的衰老过程都完成或基本完成完整Gompertz曲线描述的过程, 因此其旗叶衰老过程拟合方程的R2低于其他3种延绿类型品种。2012年延绿类型品种旗叶进入快速衰老期早, 生理成熟期品种旗叶%GLA低于2011年, 基本完成衰老过程, 因而延绿和中等延绿类型品种旗叶衰老过程拟合方程的R2高于2011年。参考文献 原文顺序
文献年度倒序
文中引用次数倒序
被引期刊影响因子
DOI:10.1093/jxb/erg150URLPMID:12709488 [本文引用: 1]

Four mutants with delayed leaf senescence were selected from seed of durum wheat mutagenized with ethylmethane sulphonate. Changes in net photosynthetic rate, efficiency of photosystem II and chlorophyll concentration during the maturation and senescence of the flag leaves of both mutant and parental plants were determined under glasshouse conditions. The four mutant lines maintained photosynthetic competence for longer than the parental line and are therefore functionally 'stay green'. The mutant lines also had higher seed weights and grain yields per plant than the parental line.
DOI:10.3969/j.issn.1001-4829.2008.05.005URL [本文引用: 1]
探明持绿型小麦品种川农18(CN18)、川农12(CN12)、川农17(CN17)和常规品种绵阳11(MY11)之间的差异,采用了在抽穗后不同时期剪去旗叶的方法,测定了在开花后不同时期小麦旗叶、倒二叶、倒三叶叶绿素含量、超氧化物歧化酶活性、过氧化氢酶活性、丙二醛含量并且测定了在各处理下植株的千粒重。结果表明,持绿型小麦品种植株抗衰老,光合作用时间长,籽粒具有较高的生长率,因此具有较高的千粒重,除旗叶外,倒二叶、倒三叶对子粒重也具有很强的补偿作用。"库"的强度很可能是限制持绿型小麦超高产的主要原因。
DOI:10.1071/AR07193URL [本文引用: 1]
URL [本文引用: 1]
选用4个小麦品种对其开花后绿叶面积、色素含量、丙二醛(MDA)含量及旗叶叶绿素荧光参数进行了测定分析。结果表明:持绿型小麦的绿叶面积显著高于非持绿型小麦,且生育后期下降缓慢;生育后期持绿型小麦叶片色素含量降低缓慢;随着生育进程推进,小麦叶片丙二醛(MDA)含量都呈上升趋势,与非持绿型小麦比较,持绿型小麦MDA上升缓慢且维持较低水平;生育后期持绿型小麦叶片的Fv/Fm、Fv/Fo、qP、PSⅡ、ETR明显高于非持绿型小麦,而qN明显低于非持绿型小麦;持绿型小麦产量较高,收获指数大。总之,持绿型小麦生育后期叶片衰老缓慢,光合功能维持时间长,光合产物积累多,具有较好的增产优势。
DOI:10.1016/j.fcr.2011.05.010URL [本文引用: 1]
Nitrogen (N) fertilizer represents a significant cost for the grower and may also have environmental impacts through nitrate leaching and N 2O (a greenhouse gas) emissions associated with denitrification. The objectives of this study were to analyze the genetic variability in N-use efficiency (grain dry matter (DM) yield per unit N available from soil and fertilizer; NUE) in winter wheat and identify traits for improved NUE for application in breeding. Fourteen UK and French cultivars and two French advanced breeding lines were tested in a 2 year/four site network comprising different locations in France and in the UK. Detailed growth analysis was conducted at anthesis and harvest in experiments including DM and N partitioning. Senescence of either the flag leaf or the whole leaf canopy was assessed from a visual score every 3–4 days from anthesis to complete canopy senescence. The senescence score was fitted against thermal time using a five parameters monomolecular-logistic equation allowing the estimation of the timing of the onset and the rate of post-anthesis senescence. In each experiment, grain yield was reduced under low N (LN), with an average reduction of 2.2 t ha 611 (29%). Significant N × genotype level interaction was observed for NUE. Crop N uptake at harvest on average was reduced from 227 kg N ha 611 under high N (HN) to 109 kg N ha 611 under LN conditions while N-utilization efficiency (grain DM yield per unit crop N uptake at harvest; NUtE) increased from 34.0 to 52.1 kg DM kg 611 N. Overall genetic variability in NUE under LN related mainly to differences in NUtE rather than N-uptake efficiency (crop N uptake at harvest per unit N available from soil and fertilizer; NUpE). However, at one site there was also a positive correlation between NUpE and NUE at LN in both years. Moreover, across the 2 year/four site network, the N × genotype effect for NUpE partly explained the N × genotype effect for grain yield and NUE. Averaging across the 16 genotypes, the timing of onset of senescence explained 86% of the variation in NUtE amongst site-season-N treatment combinations. The linear regression of onset of senescence on NutE amongst genoytpes was not significant under HN, but at three of the four sites was significant under LN explaining 32–70% of the phenotypic variation amongst genotypes in NutE. Onset of senescence amongst genotypes was negatively correlated with the efficiency with which above-ground N at anthesis was remobilized to the grain under LN. It is concluded that delaying the onset of post-anthesis senescence may be an important trait for increasing grain yield of wheat grown under low N supply.
DOI:10.1111/j.1744-7909.2012.01144.xURLPMID:22788746 [本文引用: 1]
Increasing photosynthetic capacity by extending canopy longevity during grain filling using slow senescing stay-green genotypes is a possible means to improve yield in wheat. Ethyl methanesulfonate (EMS) mutated wheat lines (Triticum aestivum L. cv. Paragon) were screened for fast and slow canopy senescence to investigate the impact on yield and nitrogen partitioning. Stay-green and fast-senescing lines with similar anthesis dates were characterised in detail. Delayed senescence was only apparent at higher nitrogen supply with low nitrogen supply enhancing the rate of senescence in all lines. In the stay-green line 3 (SG3), on a whole plant basis, tiller and seed number increased whilst thousand grain weight (TGW) decreased; although a greater N uptake was observed in the main tiller, yield was not affected. In fast-senescing line 2 (FS2), yield decreased, principally as a result of decreased TGW. Analysis of N-partitioning in the main stem indicated that although the slow-senescing line had lower biomass and consequently less nitrogen in all plant parts, the proportion of biomass and nitrogen in the flag leaf was greater at anthesis compared to the other lines; this contributed to the grain N and yield of the slow-senescing line at maturity in both the main tiller and in the whole plant. A field trial confirmed senescence patterns of the two lines, and the negative impact on yield for FS2 and a positive impact for SG3 at low N only. The lack of increased yield in the slow-senescing line was likely due to decreased biomass and additionally a possible sink limitation.
DOI:10.1023/B:EUPH.0000013255.31618.14URL [本文引用: 1]
[本文引用: 1]
DOI:10.3724/SP.J.1258.2011.00769URL [本文引用: 1]
试验选用持绿型冬小麦(Triticum aestivum)‘豫麦66'(‘Ym66')和‘潍麦8号'(‘Wm8')为研究材料,以当地生产上起主导作用的冬小麦品种‘小偃 22'(‘XY22')和‘小偃6号'(‘XY6')为对照。花后用塑料薄膜搭建成增温棚进行高温处理,测定各品种绿叶数目、叶绿素和丙二醛(MDA)含 量及叶片细胞膜透性,并研究籽粒灌浆成熟期高温对持绿型小麦籽粒淀粉合成相关酶及粒重的影响。结果表明,高温处理后,各品种的绿叶数目和叶绿素含量都减 少,MDA含量和膜透性都增加,说明高温加速了小麦叶片衰老。同时,各品种籽粒中与淀粉合成相关的酶(蔗糖合成酶(SS)和腺苷二磷酸葡萄糖焦磷酸化酶 (AGPP)、可溶性淀粉合酶(SSS))活性都低于正常生长下的籽粒中的酶活性,其中高温对籽粒SS和AGPP活性的影响不显著,而对籽粒SSS活性的 影响显著(p=0.015)。品种间比较,持绿型小麦在两种处理下,都表现出较多的绿叶数目和较高的叶绿素含量,且3种与淀粉合成相关的酶活性也都高于非 持绿型小麦,说明持绿型小麦酶活性受高温抑制程度较小。相关性分析表明,所有品种籽粒SS、AGPP、SSS活性都与籽粒灌浆速率成极显著的正相关(相关 系数r分别为0.905、0.419和0.801)。因而,持绿型小麦不仅具有较好的持绿特性,而且籽粒中与淀粉合成相关的3种酶活性都较高,这有利于其 籽粒淀粉的合成,从而增加籽粒产量。
DOI:10.1007/s10681-012-0780-3URL [本文引用: 1]
The presence or absence of the staygreen trait was screened for 3 consecutive years in 963 wheat lines from various sources, including Indian and CIMMYT germplasm. Staygreen was assessed at the late dough stage by visual scoring (0-9 scale) and the leaf area under greenness (LAUG) measurement. Around 5.5 % of the lines were staygreen, 10.5 % were moderately staygreen, and the remaining lines showed little or no expression of the trait. One hundred lines showing diversity for the staygreen trait were sown under three different sowing dates (timely, late and very late) for 3 consecutive years in three replications to determine the association of staygreen with heat tolerance. There was a decline in yield, biomass, grain filling duration (GFD) and 1,000 grain weight (TGW) under late and very late sowing conditions owing to terminal stress at anthesis and later stages. However, the decline was relatively less in staygreen genotypes compared to the non-staygreen (NSG) ones. The correlation study showed that LAUG and canopy temperature depression (CTD) were strongly correlated. LAUG and CTD were also significantly associated with grain yield, GFD and biomass. To further confirm the association of the staygreen trait with terminal heat stress, individual F-2-derived F-7 progenies from the cross of the 'staygreen' lines with NSG were evaluated for yield and yield traits at the three sowing dates. In each cross, the staygreen progenies showed a significantly smaller decline in yield and TGW under heat stress than the NSG progenies. These results appear to suggest an association between the staygreen trait and terminal heat stress and, thereby, that the staygreen trait could be used as a morphological marker in wheat to screen for heat tolerance.
URL [本文引用: 2]
本文据1992-1995年试验结果,以Logistic方程拟合贵州高原不同夏秋麦品种的籽粒灌浆过程并计算出有关籽粒灌浆参数,发现不同夏秋小麦品种灌浆特性有所不同。通径分析灌浆参数与千粒重的表明,籽粒平均灌浆速度和最大灌浆速度是影响夏秋麦千粒重的两个主要因素。且两因素间有极显著相关。进一步分析发现,缓增期和渐增期日数以及快增灌浆速率对千粒重作用显著;缓增期日数与渐增期日数间有极显著负相关,快增期灌浆
URL [本文引用: 2]
本文据1992-1995年试验结果,以Logistic方程拟合贵州高原不同夏秋麦品种的籽粒灌浆过程并计算出有关籽粒灌浆参数,发现不同夏秋小麦品种灌浆特性有所不同。通径分析灌浆参数与千粒重的表明,籽粒平均灌浆速度和最大灌浆速度是影响夏秋麦千粒重的两个主要因素。且两因素间有极显著相关。进一步分析发现,缓增期和渐增期日数以及快增灌浆速率对千粒重作用显著;缓增期日数与渐增期日数间有极显著负相关,快增期灌浆
DOI:10.7606/j.issn.1009-1041.2009.04.019URL [本文引用: 2]
In order to achieve high yield and offer evidence for selecting new varieties, the grain filling processes of ten different wheat varieties were studied. The results showed that grain dry weights showed "S" curve at grain filling period. Wheat grain filling stage can be divided into gradual increase stage he rapid increase stage, and increasing period. Correlation analysis showed grain weight were decided by rapid increase stage and grain filling rate and was not obvious with the entire grain filling period. In rapid increase stage, faster grain filling rate, longer duration, more dry matter accumulation quantity and higher grain weight. The differences of Grain Filling Characteristics between varieties were obvious; Comprehensive analysis showed that the grain filling rate of Xiangmai 29 and BN AK58 1 were faster, the grain weight were higher.
URL [本文引用: 2]
选择23个小麦品种(系),在大田条件下测定了小麦花后旗叶叶绿素含量、颖壳叶绿素含量、籽 粒重量、籽粒饱满度等与早衰有关的形态和生理指标,并分别对其花后旗叶叶绿素含量、花后旗叶与颖壳的叶绿素含量比值、粒重比和饱满度以及综合4项指标进行 聚类分析,以建立科学的早衰鉴定指标。结果显示:(1)23份小麦材料以花后旗叶叶绿素含量变化可分为4个类型:下降迟且幅度小型、下降早而幅度较大型、 下降早且幅度小型、下降早且幅度大型,除第2类型外,其花后旗叶叶绿素含量下降幅度依次增大。(2)以花后旗叶和颖壳叶绿素含量比值变化将其分为3种类 型:穗黄叶绿型、同步转黄型、穗绿叶黄型,其比值依次减小。(3)以粒重比可分为3种类型:灌浆充实型、灌浆相对不充实型、灌浆不充实型,其比值依次减 小。(4)以饱满度可分为4个类型:饱满型、相对饱满型、相对瘪瘦型和瘪瘦型,其饱满度依次减小。(5)综合以上4项指标可分为4种类型:穗黄叶绿型、正 常落黄成熟型、轻度早衰型和典型早衰型;而以饱满度为鉴定指标最接近综合鉴定分析结果。研究发现,籽粒饱满度(干籽粒体积与其充分吸涨后的体积的比值)可 作为鉴定小麦早衰的简单、快捷指标,旗叶和颖壳叶绿素含量比较分析可作为田间的初步鉴定指标。
DOI:10.7668/hbnxb.2010.S2.019URL [本文引用: 2]
选取安徽省淮北地区7个小麦高产品种,对其籽粒灌浆过程进行了研究。结果表明,小麦籽粒灌浆进程呈"慢-快-慢"的"S"型曲线,籽粒灌浆期可分为渐增期、快增期、缓增期三个阶段。灌浆过程可以用Logistic方程拟合,方程的相关系数均大于0.980 1,达到显著水平,拟合效果良好。相关分析表明,粒重主要是由快增期持续时间和缓增期速率决定的,与整个灌浆期持续期和平均灌浆速率正相关。在小麦灌浆快增期和缓增期,灌浆速率越快,持续时间越长,干物质积累越多,粒重就越高。
DOI:10.7668/hbnxb.2010.S2.019URL [本文引用: 2]
选取安徽省淮北地区7个小麦高产品种,对其籽粒灌浆过程进行了研究。结果表明,小麦籽粒灌浆进程呈"慢-快-慢"的"S"型曲线,籽粒灌浆期可分为渐增期、快增期、缓增期三个阶段。灌浆过程可以用Logistic方程拟合,方程的相关系数均大于0.980 1,达到显著水平,拟合效果良好。相关分析表明,粒重主要是由快增期持续时间和缓增期速率决定的,与整个灌浆期持续期和平均灌浆速率正相关。在小麦灌浆快增期和缓增期,灌浆速率越快,持续时间越长,干物质积累越多,粒重就越高。
DOI:10.3724/SP.J.1006.2014.00337URL [本文引用: 2]
The growing condition for winter wheat is relatively unfavourable in Sichuan Basin due to less radiation in wheat growing season, drought stress at mid growing stage, and high temperature at late growing stage. Wheat cultivars in this area are commonly characterized with large grain weight and long filling period. Therefore, quality of grain filling is critical to final yield. The objective of this study was to understand the effects of genotype and environment on characteristics of grain filling of wheat in Sichuan Basin. Ten representative cultivars were grown in three locations in 2010 2011 and 2011 2012 wheat growing seasons, and the dynamics of grain filling were observed. The average grain weight was 48.25 g over two years. There were three phases during grain filling, namely grain-filling pyramid period (T), grain-filling fast increase period (T), and grain-filling slowly increase period (T). The durations were sequenced as T (16.30 d) > T (13.41 d) > T (12.98 d), and the grain-filling rates were 0.618, 0.772, and 2.205 mg grain d, respectively. The contributions of biomass to grain were 21.21% in T, 58.27% in T, and 20.53% in T. Clearly, about 80% of dry matter has been accumulated before T phase. In the same growing season, grain weight and grain-filling rates including maximum, (),mean (), and phase (, , and ) rates of grain filling were mainly influenced by genotype, whereas other parameters for grain filling were mainly influenced by location. Grain weight was significantly correlated with R, R, R, and R. Chuanmai 42, Chuanyu 23, and Chuanmai 56 were characterized with early anthesis, high grain filling speed, long time of grain filling, and large grain weight.
[本文引用: 1]
[本文引用: 1]
DOI:10.3321/j.issn:1671-9387.2006.03.012 [本文引用: 3]
用Richards方程对新春8号等6个春小麦品种籽粒灌浆过程进行了拟合。结果表明,新春6号、新春9号和Geleng为典型的强、弱势粒异步灌浆型品种;新春8号、宁春30号和新陇麦15为典型的强、弱势粒同步灌浆型品种。异步灌浆型品种强、弱势粒起始势之间差异较大,强势粒进入灌浆盛期较弱势粒早;同步灌浆型品种强、弱势粒起始势之间差异不大。灌浆过程的前期、中期和后期3个阶段对总灌浆物质的贡献分别约占26%,45%, 29%,但所需的时间在强、弱势粒和品种间有较大差异。
DOI:10.3321/j.issn:1671-9387.2006.03.012 [本文引用: 3]
用Richards方程对新春8号等6个春小麦品种籽粒灌浆过程进行了拟合。结果表明,新春6号、新春9号和Geleng为典型的强、弱势粒异步灌浆型品种;新春8号、宁春30号和新陇麦15为典型的强、弱势粒同步灌浆型品种。异步灌浆型品种强、弱势粒起始势之间差异较大,强势粒进入灌浆盛期较弱势粒早;同步灌浆型品种强、弱势粒起始势之间差异不大。灌浆过程的前期、中期和后期3个阶段对总灌浆物质的贡献分别约占26%,45%, 29%,但所需的时间在强、弱势粒和品种间有较大差异。
DOI:10.7606/j.issn.1009-1041.2006.06.284URL [本文引用: 3]
The filling process of wheat grain are always simulated by Polynomial Regression, Logistic Equation and Richards Equation. To seek the best mathematical model for describing and study the grain filling process of wheat, the grain filling process of wheat
DOI:10.2135/cropsci1996.0011183X003600030002xURL [本文引用: 2]
DOI:10.2135/cropsci2002.9650URL [本文引用: 2]
[本文引用: 2]
DOI:10.3724/SP.J.1006.2009.01662URL [本文引用: 2]
Leaf stay-green trait is one of the major targets in maize ( = ebcx/ (1+ebcx). On the basis of correlation analysis, the green leaf number, chlorophyll content at physiological maturity, and mean decreasing rate of RGLA () were selected as the key indices to discriminate the stay-green and non-stay-green maize genotypes. According to relative green leaf area at physiological maturity (MRGLA), the maximum decrease rate of RGLA (), and the mean decreasing rate of RGLA (), the 75 inbred lines were classified into stay-green and non-stay-green two types with Hiechical clustering analysis. The stay-green type was composed of 12 inbred lines with the following common characteristics: MRGLA of more than 60%, of 0.687% d, no significant decrease of RGLA during the whole growing period (67.07% at maturity), and high green leaf number (8.8 leaves) and chlorophyll content (4.43 mg dm) at physiological maturity. The non-stay-green type, consisting of 63 inbred lines, was further categorized with quick-leaf-senescence (50 inbred lines) and slow-leaf-senescence (13 inbred lines) subgroups. In the quick- and slow-leaf senescence subgroups, the RGLA at maturity, , green leaf number at maturity, and chlorophyll content at maturity were 17.75% and 33.55%, 1.89% d and 1.44% d, 3.2 and 6.2, and 2.06 mg dm and 3.17 mg dm, respectively. At physiological maturity, the RGLA was positively correlated with LAD (= 0.8861, = 0.8221,
URLMagsci [本文引用: 2]
采用Excel工作表及Origin7.0统计分析软件对基于绿叶面积玉米叶片保绿度开花后衰减特性进行了初步研究,结果表明:玉米开花后叶片保绿度衰减符合方程y=aeb-cx/(1+eb-cx);不同基因型玉米叶片保绿度衰减启动时间、最大衰减速率和最大衰减速率出现时间等衰减特性差异较大;即使相同基因型在不同环境条件下叶片衰减特性也不尽相同。采用y=aeb-cx/(1+eb-cx)模拟方程能比较全面揭示叶片保绿度的动态变化过程。
URLMagsci [本文引用: 2]
采用Excel工作表及Origin7.0统计分析软件对基于绿叶面积玉米叶片保绿度开花后衰减特性进行了初步研究,结果表明:玉米开花后叶片保绿度衰减符合方程y=aeb-cx/(1+eb-cx);不同基因型玉米叶片保绿度衰减启动时间、最大衰减速率和最大衰减速率出现时间等衰减特性差异较大;即使相同基因型在不同环境条件下叶片衰减特性也不尽相同。采用y=aeb-cx/(1+eb-cx)模拟方程能比较全面揭示叶片保绿度的动态变化过程。
URL [本文引用: 2]
以12个冬小麦(Triticum aestivumL.)品种为供试材料,通过田间实验连续2年于开花后定期测定各品种的绿叶数目、绿叶面积、叶绿素和MDA含量以及SOD和CAT活性等指标,并以生理成熟时的保绿度、衰老启动时间为指标进行Hierarchical聚类分析,对小麦品种持绿能力进行分级。结果表明,参试冬小麦品种可分为持绿和非持绿两种类型,‘潍麦8号’(WM8)和‘豫麦66’(YM66)两年均表现为持绿型小麦。在整个灌浆期,持绿型小麦品种绿叶数目、面积、叶绿素含量明显高于非持绿型品种,叶片保护酶SOD与CAT活性也较非持绿小麦强,而其MDA含量明显低于非持绿型小麦品种。持绿型小麦叶片衰老启动时间延迟,生育后期绿叶面积较大,光合作用时间延长,具有较高的产量。本研究结果为冬小麦的品种选育、布局等相关研究奠定基础。
DOI:10.1007/s11032-009-9366-8URL [本文引用: 2]
Senescence is a genetically programmed and environmentally influenced process resulting in the destruction of chlorophyll and remobilization of nutrients to younger or reproductive parts of plants. Delayed senescence, or stay-green, contributes to a long grain-filling period and stable yield under stress. To model senescence and identify quantitative trait loci (QTL) for the trait, a population of recombinant inbred lines (RIL) from a cross between winter wheat cultivars, ‘Ventnor’ and ‘Karl 92’ was evaluated for heat tolerance under optimum temperature of 20/15°C (day/night) and continuous heat stress of 30/25°C from 1002days after anthesis (DAA) until maturity. Ventnor is a heat-tolerant cultivar and Karl 92 is a relatively heat-susceptible cultivar. Green leaf area was measured and used to model percent greenness retained over the reproductive period. Chlorophyll content and chlorophyll fluorescence were recorded on flag leaves. Senescence was converted to a quantitative trait using the model. Based on the modeled parameters, the RILs were categorized into three groups. When senescence-related traits were evaluated, nine QTL for heat tolerance were found on chromosome 2A, two each on chromosomes 6A and 6B and one each on chromosome 3A, 3B, and 7A. Both parents contributed favorable alleles for most of the senescence-related traits. Microsatellite markers Xgwm356 and Xgwm5 prominently linked to the senescence-related traits may be useful in marker-assisted breeding. These and the linked AFLP (amplified fragment length polymorphism) markers XCGT.TGCG-349 , XCGT.GTG-343 , and XCGT.CTCG-406, if converted to STS (sequence tagged sites), can be used for further molecular dissection of the QTL for post-anthesis heat tolerance.
URL [本文引用: 3]
干旱对小麦产量的影响日趋严重,尤其是在小麦灌浆期,所以研究小麦的抗旱性和选育抗旱品种对于提高小麦产量具有重要意义。而持绿性(Stay-green)与抗旱性、耐高温性密切相关,是作物的重要抗旱机制,在多种植物中被发现。持绿性品种有效光合作用时间长,光合效率高,因而能提高作物产量。作物的持绿性是一个复杂的生物学现象,表现为数量遗传;定位持绿相关性状基因位点,找到与之紧密连锁的、稳定表达的分子标记,可为分子标记辅助育种和图位克隆提供基础。 本研究在干旱胁迫和正常灌溉两种水分条件下,利用强抗旱性品种旱选10号与水地高产品种鲁麦14杂交构建的DH群体共150个株系为遗传研究材料,观测花后不同时期旗叶的功能绿叶面积(Green leaf area duration,GLAD),主茎绿叶数(Green leaf number of main stem,GLNMS),并利用非线性回归分析计算小麦旗叶最大衰老速率(Maximum rate of senescence,MRS)、达到最大衰老速率的时间(Time to maximum rate of senescence,TMRS),最大衰老速率时GLAD的百分比(Percent greenness at maximum senescence,PGMS)、衰老起始时间(the day that plant begin to senescence,Ts)、完全衰老时间(the day that plant senescence,To)等衰老特征性状;并且进行持绿性状间及其与产量性状的相关分析;对上述性状进行遗传分析和QTL定位,以便为揭示抗旱性的机制和选育持绿性品种提供依据。结果如下: 在两种水分条件下,花后22d、25d、28d和31d时旗叶GLAD均与花后20d、25d和30d时GLNMS呈显著或极显著正相关,与衰老特征性状75%G、50%G、25%G、PGMS、 TMRS、Ts和To均呈显著或极显著正相关,与MRS呈极显著负相关。花后各个时期的GLNMS与75%G、25%G、TMRS、Ts和To呈显著或极显著正相关,与PGMS和50%G无显著相关性;花后20d、25d和30d时GLNMS与MRS呈显著或极显著负相关。衰老特征性状间的相关分析表明,MRS与Ts呈极显著正相关,与To等其他衰老特征性状呈显著或极显著负相关;Ts与PGMS和50%G呈极显著负相关,PGMS与TMRS和25%G无显著相关性,其他衰老特征性状之间呈显著或极显著正相关。 两种水分条件下,千粒重与花后16、19、22、25、28d时的GLAD呈显著或极显著正相关,单株产量与花后各时期GLAD无显著相关关系;正常灌溉条件下,千粒重与花后10、15、20d的GLNMS呈显著或极显著正相关,单株产量与花后15、20、30d时的GLNMS呈显著或极显著正相关;干旱胁迫条件下,千粒重与花后20、25、30d时的GLNMS呈显著或极显著正相关,单株产量与GLNMS无显著相关性。正常灌溉条件下,千粒重、单株产量与MRS呈极显著负相关,与Ts、75%G和50%G呈极显著正相关,与其他衰老特征性状无显著相关关系;干旱胁迫条件下,千粒重、单株产量与MRS呈负相关,与Ts呈显著正相关,与其他衰老特征性状无显著相关性。 小麦DH群体持绿相关性状表型呈广泛变异和超亲分离,属于微效多基因控制的复杂数量性状。两种水分条件下共检测到关于小麦持绿相关性状的加性QTL位点50个,上位性QTL位点49对;加性QTL主要分布在1A、1B和SA染色体上,其中对表型变异贡献率大于10.00%的QTL共有29个,占总检出加性QTL的58.00%。正常灌溉和干旱胁迫条件下,共检测到产量性状加性QTL位点14个,分布在1A、1B、4A、5A、6A、6D和7A染色体上,上位性QTL位点6对。 正常灌溉条件下QGlnms20-1A-1与干旱胁迫条件下QTmrs-1A、QTs-1A、QTo-1A和Q25%G-1A位于1A染色体标记区间P3615.2-WMC336;正常灌溉条件下在1B染色体标记区间Xgwm273-Xgwm131检测到QGlad22-1B-1、QGlad25-1B-1和千粒重QTkw-1B-1;正常灌溉条件下控制GLNMS的加性QGlnms10-1D-1、QGlnms15-1D-1与干旱胁迫下QGlnms10-1D-2均位于1D染色体上标记WMC432附近;两种水分条件下,在5A染色体相邻标记区间WMC410-WMC74-Xgwm291-Xgwm410上检测到多个持绿性QTL以及产量性状的QTL位点:其中QGlad22-5A-2、QGlad25-5A-3、Q75%G-5A和QTkw-5A-1在正常灌溉条件下被检测到,QGlnms25-5A、QTmrs-5A、QTo-5A和Q25%G-5A在干旱胁迫下被检测到;同时干旱胁迫条件下,QGlad22-5A-1, QGlad25-5A-1、QTs-5A和Q75%G-5A-1均位于5A染色体标记区间WMC524-Xgwm595之间。而其他关于GLAD与GLNMS的加性QTL位点均在一个时期、一种水分环境下被检测到,呈特异性表达。控制小麦持绿相关性状的QTL在不同染色体上或同一染色体上的不同区间的分布不均匀,在1A、1B和5A染色体上的一些标记区间上存在控制多个持绿性状以及产量性状的QTL热点区域。 本研究对小麦旗叶功能叶面积(GLAD)、主茎绿叶数(GLNMS)等持绿相关性状进行QTL定位和遗传剖析,检测到的稳定表达的持绿性加性QTL位点以及QTL热点区域对进行QTL的功能研究、精细定位以及图位克隆具有重要意义。
[本文引用: 1]
[本文引用: 2]
DOI:10.3969/j.issn.1001-9626.1998.03.013URL [本文引用: 1]
生物的生长过程若用图形来描述将是一条S曲线,随生物物种、生态环境等因素不同,这一曲线呈多样性变化。Richards生长方程当其参数m在数轴上滑动取值时,不仅包含了itscherlich,Brody,Bertalanffy,Gompert,Logistictffut等生长方程。
DOI:10.3969/j.issn.1001-9626.1998.03.013URL [本文引用: 1]
生物的生长过程若用图形来描述将是一条S曲线,随生物物种、生态环境等因素不同,这一曲线呈多样性变化。Richards生长方程当其参数m在数轴上滑动取值时,不仅包含了itscherlich,Brody,Bertalanffy,Gompert,Logistictffut等生长方程。
URL [本文引用: 1]
用 Richards 方程 W=A/(1+Be~(-kt))1/N 配合农垦57号、汕优63号等6个品种(含杂种)强、弱势粒的籽粒增重资料。依弱势粒配得方程的 N 值,将此6个水稻品种的籽粒灌浆状况分为两个类型,即:0N1的同步灌浆型和 N1的异步灌浆型。并据籽粒生长速率曲线的两个拐点,将籽粒灌浆过程划分为:前,中(盛)、后(至90%A 止)3个期。同时导出:起始生长势 Ro=K/N,生长速率为最大时的日期tmax.G=(1nB-1nN)/K 和最大生长速率 G_(max)等灌浆特征参数。据此对两类品种的籽粒灌浆特征进行分析。结果为:同步灌浆型品种,弱势粒 Ro 值较高,进入灌浆盛期早,全穗籽粒的灌浆盛期均有不同程度重迭,灌浆中、后期生长速率较低;异步灌浆型品种,弱势粒 Ro 值较低,进入灌浆盛期迟,一穗各粒位势的籽粒灌浆盛期相对分散,灌浆中、后期生长速率较高。品种弱势粒的灌浆特征受源、库相对比例影响很大,源相对增强时,Ro 值提高,灌浆盛期提前;源相对减弱时则相反。
URL [本文引用: 1]
利用Matlab软件对玉米子 粒灌浆过程用Richards方程进行拟合后,通过编程实现灌浆次级特征参数计算,并对不同播期子粒灌浆特征进行分析和探讨。结果表明,在黑龙港地区生态 条件下,不同播期玉米各部位子粒灌浆均符合"S"形生长曲线,可用Richards方程很好地拟合。不同播期条件下,早播处理子粒起始势最高,达到灌浆盛 期时间最早,平均灌浆速率及最大灌浆速率最大,活跃灌浆期较长,粒重最高。各播期玉米不同部位子粒,穗下部与上部相比,子粒的起始生长势较大,平均灌浆速 率较高,达到灌浆高峰期时间较短,粒重较高。
URL [本文引用: 1]
利用Matlab软件对玉米子 粒灌浆过程用Richards方程进行拟合后,通过编程实现灌浆次级特征参数计算,并对不同播期子粒灌浆特征进行分析和探讨。结果表明,在黑龙港地区生态 条件下,不同播期玉米各部位子粒灌浆均符合"S"形生长曲线,可用Richards方程很好地拟合。不同播期条件下,早播处理子粒起始势最高,达到灌浆盛 期时间最早,平均灌浆速率及最大灌浆速率最大,活跃灌浆期较长,粒重最高。各播期玉米不同部位子粒,穗下部与上部相比,子粒的起始生长势较大,平均灌浆速 率较高,达到灌浆高峰期时间较短,粒重较高。
DOI:10.3724/SP.J.1006.2008.00142URL [本文引用: 1]
To investigate accumulation characteristics of seed oil in different oil-used peanut varieties and screen a suitable growth equation to describe the seed oil accumulation, six high oil varieties were used and tested by the Richards, Logistic and Gompertz equations. The results showed that the Richards equation was more suitable for simulating oil accumulation process than the other growth equations in peanut. The Richards could improve fitting effect among the three models. Via comparing the accumulation characteristics of seed oil content in different oil-used peanut cultivars, the accumulation of seed oil in peanut could be divided into three stages, which were initial accumulation stage, fast accumulation stage and steady accumulation stage. There were two ways for oil-used peanut cultivars to increase oil content: increasing the rate of seed oil accumulation and extending the time of seed oil accumulation process. From the results of parameters of growth equation, the important strategies in increasing the seed oil content are as follows: (1) Enhancing the maximum rate of oil accumulation; (2) Increasing the oil accumulation at the initial accumulation stage; (3) Increasing the proportion of oil accumulation at fast accumulation stage.
DOI:10.3969/j.issn.1000-0984.2003.10.013URL [本文引用: 2]
本文对 Logistic曲线与 Gom pertz曲线的性状进行了研究和对比 ,指出了它们都有使其二阶导数达到最大值、最小值和零值的三个点 ,称为曲线的特征点 .通过对特征点的研究 ,我们提出了三个定理 ,从而断定这两类曲线既有许多相似之处 ,又有不容忽视的本质差异
DOI:10.3969/j.issn.1000-0984.2003.10.013URL [本文引用: 2]
本文对 Logistic曲线与 Gom pertz曲线的性状进行了研究和对比 ,指出了它们都有使其二阶导数达到最大值、最小值和零值的三个点 ,称为曲线的特征点 .通过对特征点的研究 ,我们提出了三个定理 ,从而断定这两类曲线既有许多相似之处 ,又有不容忽视的本质差异
[本文引用: 1]
[本文引用: 1]
