 , 廖婷婷1
 , 陈科艺1, 罗浩林1, 陈智海1, 胡成媛1, 桂柯2, 吴佳奇1, 刘星辉1, 吴锴1
1. 成都信息工程大学大气科学学院, 高原大气与环境四川省重点实验室, 成都 610225;
2. 中国气象科学研究院大气成分研究所, 北京 100081
收稿日期: 2018-12-13; 修回日期: 2019-03-17; 录用日期: 2019-03-17
基金项目: 国家重点研发计划(No.2018YFC0214003);国家自然科学基金重大研究计划(No.9164426)
作者简介: 欧阳正午(1998-), 男, E-mail:oyangzw@gmail.com
通讯作者(责任作者): 廖婷婷(1985—), 女, 理学博士, 讲师, 主要研究方向为大气化学、大气污染.E-mail:ltt2014@cuit.edu.cn
摘要: 对2014-2017年四川盆地和京津冀地区气象数据和污染物浓度数据进行综合评估,在原有全球空气停滞日判别标准基础上发展出本地化空气停滞指数阈值,并以提高两个区域空气质量优良天数为目的建立模型,计算各城市空气停滞发生时PM2.5污染上限浓度参考值.本研究得出,四川盆地和京津冀地区本地化空气停滞日判别标准分别为地面风速 < 2.5 m·s-1、边界层高度 < 500 m和地面风速 < 3 m·s-1、边界层高度 < 300 m.四川盆地冬季空气停滞发生频率四周高,中心小,空气停滞对空气质量的影响西部高于东部;京津冀中部和南部空气停滞频率发生高,空气停滞对空气质量的影响呈现显著的南北差异.四川盆地以成都为中心城市群及京津冀中部和南部地区的高污染排放强度和高空气停滞频率导致重污染事件的频发.本文对我国两个冬季重污染高发的区域进行深入研究,更为客观、量化地评估4年来区域空气质量实际改善程度并初步建立空气质量目标管理模型,以期为区域空气质量达标管理提供可靠的科学依据.
关键词:空气停滞PM2.5京津冀地区四川盆地大气质量改善评估
Comparative analysis of winter air stagnation characteristics and air quality improvement assessment in Sichuan Basin and Beijing-Tianjin-Hebei Region from 2014 to 2017
OUYANG Zhengwu1
 , LIAO Tingting1
 , CHEN Keyi1, LUO Haolin1, CHEN Zhihai1, HU Chengyuan1, GUI Ke2, WU Jiaqi1, LIU Xinghui1, WU Kai1
 1. Plateau Atmosphere and Environment Key Laboratory of Sichuan Province, School of Atmospheric Sciences, Chengdu University of Information Technology, Chengdu 610225;
2. Institute of Atmospheric Composition, Chinese Academy of Meteorological Sciences, Beijing 100081
Received 13 December 2018; received in revised from 17 March 2019; accepted 17 March 2019
Abstract: The localized thresholds of air stagnation status for Sichuan Basin and Beijing-Tianjin-Hebei were developed based on the global air stagnation criterion, according to the comprehensive analysis of the data of meteorology and air quality in winter from 2014 to 2017, and we also established a simplified model to calculate the upper limited concentration of PM2.5 for reference under the status of air stagnation in order to improve the percentage of good air quality days. The localized criteria for air stagnation for Sichuan Basin and Beijing-Tianjin-Hebei were given as surface wind speed < 2.5 m·s-1, boundary layer height < 500 m, and surface wind speed < 3 m·s-1, boundary layer height < 300 m, in this study, respectively. As for Sichuan Basin, the occurrence frequency of air stagnation was obviously higher in surrounding areas than that in center, and a stronger effects of air stagnation on air quality was observed in the western part of the basin. In the Beijing-Tianjin-Hebei region, the air stagnation events happened more frequently in the middle and southern area, and there was a significant difference in air stagnation effect between the southern part and the northern part of this region. The high emission intensity of air pollutants in city agglomeration surrounding Chengdu in west of Sichuan Basin and the middle and southern part of Beijing-Tianjin-Hebei region might lead to the high frequency of heavy pollutions in such areas. In this study, we conducted in-depth research on two regions with severe pollution in winter in China, and then objectively and quantitatively evaluated the actual improvement of regional air quality in the past four years. We also established a preliminary model to provide a more reliable and scientific basis for regional air quality management.
Keywords: air stagnation indexPM2.5Beijing-Tianjin-Shijiazhuang RegionSichuan Basinair quality improvement assessment
1 引言(Introduction)近年来, 中国由于经济的快速发展和城市化进程不断加快, 污染物大量排放, 空气污染严重(IPCC, 2013; Mijling et al., 2013; Hu et al., 2014).其中PM2.5(颗粒物直径小于2.5 μm)因其对人体健康的影响, 引发社会的广泛关注.PM2.5浓度的增加不仅影响人体健康(Guan et al., 2014), 还将导致大气能见度降低(Kan et al., 2012), 并通过改变辐射平衡影响气候变化(潘月鹏等, 2014).PM2.5浓度受到排放源强度、化学转化和气象因素的影响, 具有显著的时空变异性(Hu et al., 2013).其中气象条件的作用不可忽视, 可以清除和传输污染物(Zhang et al., 2014), 在冬季PM2.5高浓度时期尤为显著(Quan et al., 2011; Zhao et al., 2013; Guo et al., 2015; Wang et al., 2015).国内外****在此做了不少研究, 指出近期东亚冬季风减弱, 水平纬向风切变减小, 降水减少, 湿度增加, 静小风增加, 对流层低层异常稳定, 冬季冷空气入侵次数减少, 导致中国东部污染事件频发(Niu et al., 2010; Ding et al., 2014; Zhang et al., 2015; Chen et al., 2015; Li et al., 2016; Zhang et al., 2016).除天气尺度的驱动力外, 地方气象条件对于空气污染的累积效应也很重要.浅边界层会形成一个锅盖, 限制污染物的垂直扩散(Zhang et al., 2010; Ji et al., 2012; Bressi et al., 2013; Fu et al., 2014);静小风对大气水平扩散能力的削弱作用, 使污染物难以扩散(Rigby et al., 2008);相对湿度的增加会导致细颗粒物的吸湿增长, 导致能见度降低(Quan et al., 2011; Chen et al., 2012).
空气停滞指数(Air Stagnation Index, ASI)常用来表征大气的传输和扩散能力, 不少****曾提出使用上下层风速和降水来定量计算ASI(Korshover et al., 1982; Wang et al., 1999; Leung et al., 2005), 但有研究指出该空气停滞指数在中国的四川盆地、塔里木盆地、准噶尔盆地等地区并不适用, 甚至呈现出相反的结论(Li et al., 2014), 这是由于空气停滞的主要驱动力是对流层中层风(Huang et al., 2017).为了解决这个不足, Wang等(2016; 2018)建立了一个基于10 m地面风速(Surface Wind Speed, WSP)、边界层高度(Boundary Layer Height, BLH)和有无降水的新空气停滞指数, 并通过拟合方程得到了空气停滞下的气象条件阈值.但该指数是基于欧洲与中国得到的全局标准, 由于空气停滞对局地的气象条件十分敏感, 全局标准难以准确描述局地的空气停滞状况, 本研究根据局地气象条件得到了适应于局地的冬季ASI标准, 希望更好的描述冬季局地空气停滞特点, 分析空气停滞状态对PM2.5浓度的影响.
京津冀地区和四川盆地是国内大气污染最为严重的两个区域, 其中人为排放是造成污染严重的主要原因(Yu et al., 2013;曹军骥等, 2014).2013年9月, 国务院发布了《大气污染防治行动计划》, 规定京津冀地区具体目标为细颗粒物浓度到2017年比2012年下降25%左右, 全国地级及以上城市下降10%以上.虽然经过4年的治理, 严控污染物排放, 京津冀地区和四川盆地PM2.5污染已经有了明显改善(结果见图 1及表 1), 但其中气象因素(空气停滞)对PM2.5浓度降低与减排措施的贡献分别是多少尚不明确.因此本研究提出在空气停滞期间除去空气停滞影响, 评估减排措施对PM2.5浓度降低的效果;PM2.5浓度高值往往发生在空气停滞状态下, 由此可给出基于空气停滞状态下的各城市PM2.5污染上限浓度参考标准值, 为地区空气质量达标管理提供量化、可靠的科学依据.
图 1(Fig. 1)
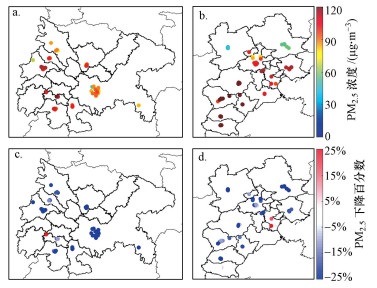 |
| 图 1 2014—2017年冬季PM2.5污染空间分布(a和b)及2017年较2014年改善情况(c和d) (左为四川盆地, 右为京津冀地区) Fig. 1Spatial distribution of PM2.5 concentration in Sichuan Basin (left) and Beijing-Tianjin-Hebei area (right) during the winter of 2014—2017(top) and the improvement in 2017 compared with 2014(bottom) |
表 1(Table 1)
| 表 1 不同地区空气停滞标准对比 Table 1 Comparisons of air stagnation standards in different areas | ||||||||||||||||||||
表 1 不同地区空气停滞标准对比 Table 1 Comparisons of air stagnation standards in different areas
| ||||||||||||||||||||
2 数据与方法(Materials and methods)2.1 数据来源本研究所使用的近地面污染物浓度数据为2014—2017年冬季四川盆地与京津冀的PM2.5逐时观测数据(http://106.37.208.233:20035), 数据来源于中国环境监测总站, 由于观测系统正在发展和逐步完善, 每个站可用数据集的持续时间是不同的.所有小时数据缺测比例超过20%的站点被剔除, 最终得到四川盆地49个有效站点, 京津冀地区64个有效站点.研究中所使用的气象数据(10 m地面风速、边界层高度)来源于欧洲气象中心(European Centre for Medium-Range Weather Forecasts, ECMWF)ERA-Interim再分析资料(http://apps.ecmwf.int/datasets/data/), 2008—2017年逐日4个时段的平均数据, 其空间分辨率为0.25°×0.25°.降水事件包括雨、雹和雪等, 而由于中国降水数据大量缺失, 因此本研究使用的2008—2017年日降水数据来源于美国气象中心(the US National Climate Data Center, NCDC)全球地表每日数据集(https://www.ncdc.noaa.gov/), 空间分辨率为1°×1°.2016年冬季PM2.5排放源数据为清华大学开发的中国多尺度排放清单MEIC(http://www.meicmodel.org/), 包括移动源、工业源、生活面源、电力源和农业源, 空间分辨率为0.25°×0.25°.本文使用最近邻插值方法将不同分辨率的气象网格数据插值到站点上.
2.2 分析方法空气停滞常用于表征空气污染物的扩散能力, 包括水平扩散、垂直扩散和湿沉积.为定量描述空气停滞状态, Wang等(2016)使用了一个定量标准进行改进, 根据边界层高度、地面风速和降水量来确定空气停滞状态, 其中地面风速和边界层高度用来表征大气的水平和垂直扩散能力, 降水用来排除湿沉降作用.降水会打破空气停滞状态, 为排除湿沉降作用, 将所有的降水事件(日降水量>1 mm)下的数据去除.为除去时空差异的影响, 对于一个特定的站点, 将站点日均PM2.5浓度用该站点当月月均值进行标准化处理.日均标准化PM2.5数据大于100%的气象条件定义为空气停滞状态, 并将高于100%的部分定义为空气停滞影响(Wang et al., 2016).通常近地表PM2.5浓度随着地面风和边界层高度的增加而降低, 浅层边界层和弱地面风有利于空气污染物的积累, 并通过拟合方程得到了空气停滞下的气象条件阈值.本研究定义京津冀地区冬季空气停滞条件为BLH < 646.91e-0183WSP, 四川盆地冬季空气停滞条件为BLH < 654.16e-0141WSP(图 2).
图 2(Fig. 2)
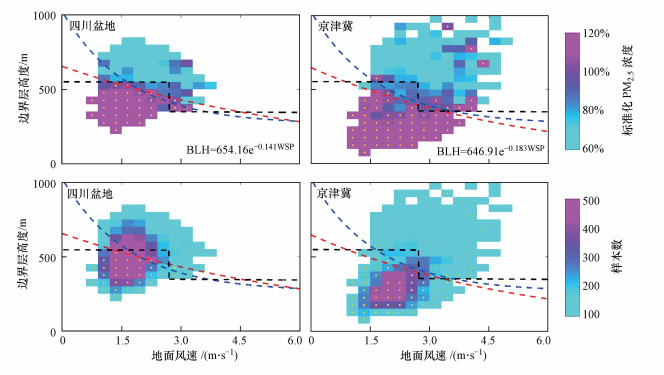 |
| 图 2 2014—2017年冬季标准化PM2.5浓度与地面10 m风速和边界层高度关系(上图)以及网格中样本数分布情况(下图) (注释:数据来源于2014—2017年冬季四川盆地(49个站点)和京津冀地区(64个站点), 为除去时空差异的影响, 将站点日均PM2.5浓度用该站点的月均值进行标准化处理.所有的降水事件(日总降水量 < 1 mm)下的数据去除, 以排除湿沉降的影响.图中的点标记表明该网格中的日均PM2.5浓度标准化数据的平均值大于100%, 表示日均PM2.5浓度大于月平均值.黑色虚线、蓝色虚线为全局标准, 红色虚线为本研究提出的局地标准, 虚线左下角表明处于空气停滞状态下PM2.5浓度呈现高值.图中只显示样本数超过50的网格) Fig. 2Correlations between standardized PM2.5 concentration and boundary layer height as well as wind speed above 10 m (top) and the corresponding distribution of samples in grids (bottom) |
满足空气停滞条件的一天被定义为空气停滞日(Air Stagnation Day, ASD), 连续3 d或以上的空气停滞日被定义为空气停滞事件(Air Stagnation Event, ASE).2014、2017年冬季分别去除空气停滞影响, 得到各城市在2014、2017年去除空气停滞影响后的PM2.5浓度, 由此判定两个区域近年来的空气改善情况, 并根据空气停滞对PM2.5浓度的累积效应得到冬季两个区域排放源参考标准值, 为大气污染减排提供科学依据.
研究中使用如下方法得到各个城市空气停滞状态下PM2.5污染上限浓度参考标准值.已知PM2.5浓度优良标准值为75 μg · m-3, 通过计算往年各城市冬季空气停滞状态对PM2.5浓度的平均影响程度, 给出各个城市空气停滞状态下PM2.5污染上限浓度参考标准值, 以减少冬季PM2.5高污染日数, 提高优良天数.设某城市冬季气象条件的影响为b%, 由于冬季空气停滞影响年变化不明显, 因此本文取b为该特定城市2014—2017年冬季平均空气停滞影响.去除空气停滞影响后, 得到由排放源和化学转化共同决定下的PM2.5浓度, 则可列出关系:
 | (1) |
3 结果与讨论(Results and discussion)3.1 PM2.5污染现状四川盆地与京津冀地区2014—2017年冬季PM2.5浓度的空间分布及改善情况如图 1所示.从整体上看, 两个地区大部分城市PM2.5浓度在80 μg · m-3及其以上, 说明2014—2017年四川盆地与京津冀地区污染形势较为严峻.其中, 四川盆地地区(图 1a)PM2.5浓度值呈现出明显的东西经向差异.PM2.5浓度较大值集中在四川盆地以西及成都平原附近, 部分站点PM2.5浓度值甚至达到了90 μg · m-3以上.而四川盆地以东PM2.5浓度较低.京津冀地区(图 2b)PM2.5浓度值出现纬向差异.其中南部与中部地区PM2.5浓度值较大, 这一区域中的部分城市浓度值达到120 μg · m-3左右, 属于严重污染区.而北部地区(张家口、承德)PM2.5浓度值与以南地区相比明显降低, 平均在60 μg · m-3以下.2017年冬季相较2014年, 四川盆地和京津冀地区PM2.5浓度有明显改善, 降幅分别达到了26%、17%.
3.2 PM2.5浓度与气象条件关系及定义区域性冬季空气停滞标准3.2.1 局地空气停滞标准图 2中展示了四川盆地和京津冀地区空气停滞状态与气象条件的定量关系, 其中日均地面10 m风速和边界层高度用于描述大气的水平扩散和垂直扩散能力, 降水量用来排除湿沉降作用.将边界日均标准化PM2.5浓度大于100%的网格进行指数拟合, 得到边界层高度与地面风速的指数关系, 用来判定空气停滞状态.空气停滞状态对局地气象条件十分敏感, 已有的全局标准(图 2中的黑色虚线与蓝色虚线, 具体标准见表 1)对于局地适应性不够, 因此本研究提出了适应于局地的空气停滞标准(图 2中虚线), 更为精细.京津冀地区边界层高度达到300 m时才发生空气停滞, 而四川盆地在500 m处即会发生空气停滞, 这是由于四川盆地地势低矮, 负地形不利于污染物的稀释扩散, 加之冬季静小风频率高, 大气环境容量远小于平原地区所致(Hu et al., 2016).
3.2.2 气象条件与PM2.5重污染关系污染事件通常与空气停滞状态有关(Zhang et al., 2014; Mu et al., 2014; Horton et al., 2014).局地大气污染物排放速率通常不会在短时间内发生剧烈变化, 而一旦发生空气停滞事件, 污染物在水平和垂直方向的扩散会受到显著抑制从而导致污染物浓度急剧上升.图 3与图 4显示了2014—2017年的1、2、12月四川盆地与京津冀地区PM2.5浓度变化及同期的大气条件变化情况.处于空气停滞状态, 地面风速、边界层高度处于低值, 弱地面风速限制了大气污染的水平扩散能力, 浅边界层高度削弱了大气污染的垂直扩散能力, PM2.5浓度呈现出高值.
图 3(Fig. 3)
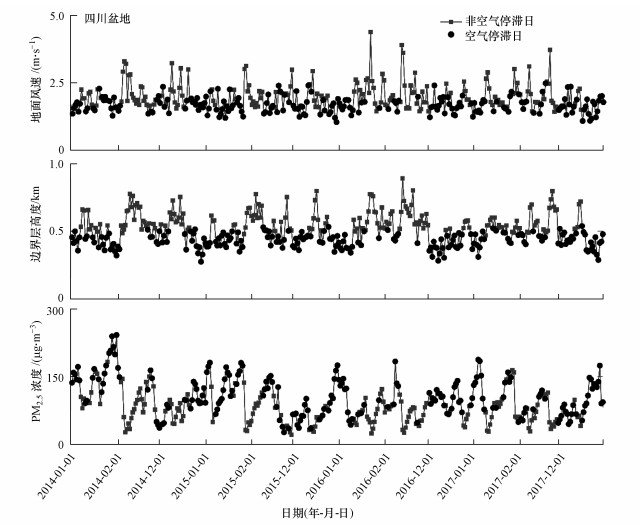 |
| 图 3 2014—2017冬季四川盆地气象条件与区域平均PM2.5浓度时间序列 Fig. 3Meteorological conditions and regional average PM2.5 concentration in Sichuan Basin during the winter of 2014—2017 |
图 4(Fig. 4)
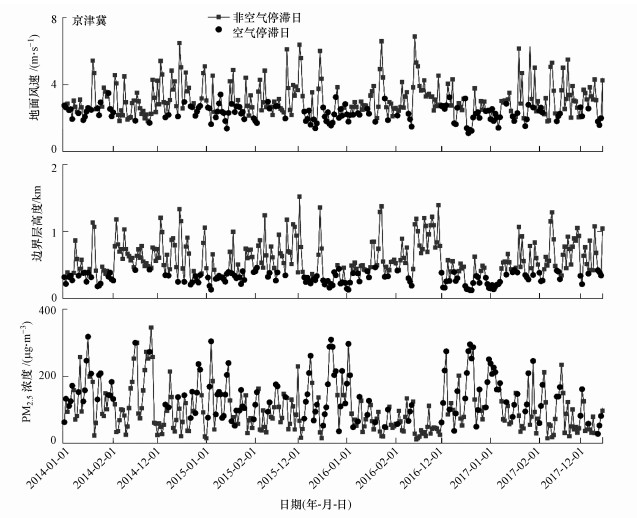 |
| 图 4 2014—2017冬季京津冀地区气象条件与区域平均PM2.5浓度时间序列 Fig. 4Meteorological conditions and regional average PM2.5 concentration in Beijing-Tianjin-Hebei area during the winter of 2014—2017 |
处于空气停滞状态下, 四川盆地地面风速在2.5 m · s-1以下, 边界层高度在500 m以下, PM2.5浓度值在20.8~242.4 μg · m-3之间变化;京津冀地区地面风速在3 m · s-1以下, 边界层高度在300 m以下, PM2.5浓度值在12.5~345.3 μg · m-3之间变化.非空气停滞状态下, 大气具有良好的扩散能力, PM2.5浓度普遍呈现出低值, 难以造成污染事件.持续的空气停滞状态(空气停滞事件)易造成大气污染事件, 而强地面风或深边界层也可打破这些污染事件.
3.3 空气停滞日(ASD)及空气停滞事件(ASE)频率时空分布特征图 5显示了四川盆地与京津冀地区2008—2017年空气停滞日(ASD)和空气停滞事件(ASE)频率的时间变化.其中四川盆地的ASD频率和ASE频率的年变化均不明显, 分别在30%与20%左右轻微波动.京津冀地区空气停滞日频率和空气停滞事件频率的年变化呈现出幅度较大且周期性明显的波动.
图 5(Fig. 5)
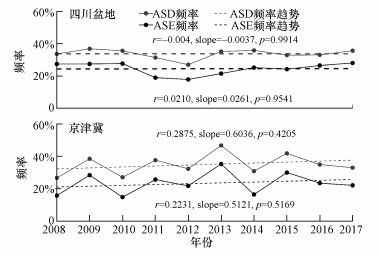 |
| 图 5 四川盆地与京津冀地区2008—2017年冬季空气停滞日(ASD)与空气停滞事件(ASE)频率年变化情况 Fig. 5Annual variation of ASD and ASE frequency in the Sichuan Basin and Beijing-Tianjin-Hebei area during the winter of 2008—2017 |
四川盆地与京津冀地区2008—2017年空气停滞日和空气停滞事件频率的空间分布如图 6所示.四川盆地ASD和ASE的频率普遍高于京津冀地区.其中四川盆地空气停滞日频率较大值出现在四川盆地西侧(与图 1a中PM2.5浓度较大值区域一致)与东南一侧, 最为严重的区域达到了50%以上.而这一区域的空气停滞事件频率的空间分布与空气停滞日相似.京津冀地区的空气停滞日频率较大值区域出现在中部与南部(这与图 1b中PM2.5较大值区域一致), 其空气停滞事件频率较大值同样分布在这一区域.说明四川盆地和京津冀地区出现空气停滞事件的区域其空气停滞的持续时间也较长.
图 6(Fig. 6)
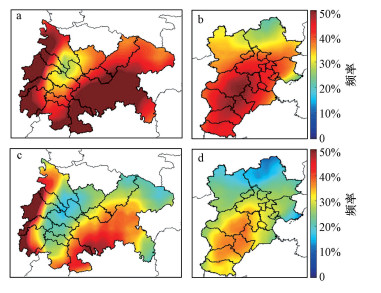 |
| 图 6 四川盆地(左)与京津冀地区(右) 2008—2017年冬季空气停滞日(ASD)(a和b)与空气停滞事件(ASE)(c和d)频率空间分布情况 Fig. 6Spatial distribution of ASD (top) and ASE (bottom) frequency in Sichuan Basin (left) and Beijing-Tianjin-Hebei area (right) during the winter of 2008—2017 |
3.4 冬季空气停滞影响时空分布特征及评估区域环境改善情况3.4.1 空气停滞影响时空分布特征图 7显示了2014—2017年冬季ASD与ASE对PM2.5浓度影响的时间变化.日均标准化PM2.5数据大于100%的气象条件定义为空气停滞状态, 高于100%的部分为空气停滞影响.ASE影响大于ASD, 即当空气处于连续的停滞状态下, 污染物的累积效应会越来越大.其中四川盆地ASD影响与ASE影响变化较小, 分别在30%与40%上下波动, 京津冀地区ASD与ASE影响呈现出相对明显的上升趋势.
图 7(Fig. 7)
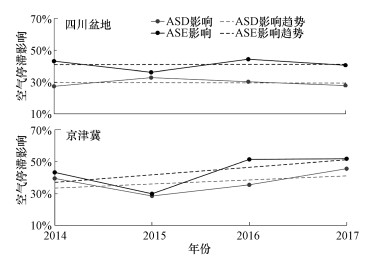 |
| 图 7 2014—2017年冬季空气停滞日(ASD)与空气停滞事件(ASE)影响年变化 Fig. 7Effects of ASD and ASE in winter during 2014—2017 |
图 8显示了ASD与ASE对PM2.5影响空间分布, 四川盆地呈现出西高东小的特点, 西部AS影响程度达到了30%左右, 盆地东南部的重庆为20%;京津冀地区呈现出北高南低的特点, 北部影响程度超过了40%, 南部影响程度在20%左右, 差异较大.说明四川盆地西部、京津冀北部受空气停滞事件影响非常大, 处于空气停滞状态时, 易造成严重污染事件的发生.
图 8(Fig. 8)
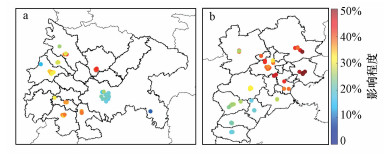 |
| 图 8 2014—2017年四川盆地(a)与京津冀地区(b)冬季空气停滞对PM2.5浓度影响空间分布情况 Fig. 8Spatial distribution of air stagnation effect in Sichuan Basin (a) and Beijing-Tianjin-Hebei area (b) in winter during 2014—2017 |
3.4.2 冬季空气质量改善评估图 9为2014、2017年冬季除去空气停滞影响后的PM2.5浓度分布和改善情况, 2014年冬季去除空气停滞影响后, 四川盆地和京津冀地区整体污染形势依然十分严峻, 这是由于2013年两个区域的污染物排放源很大, 导致严重污染事件的发生(潘竟虎等, 2014).2017年冬季, 由于减排措施的有效实施, 空气质量得到了显著改善, 四川盆地实际减排效果为26%, 其中空气停滞状态下为25%, 去除AS影响后的结果为24%;京津冀地区实际减排效果为17%, 其中空气停滞状态下为16%, 去除AS影响后的结果为21%(表 2), 结果表明四川盆地减排效果比京津冀地区更为显著.
图 9(Fig. 9)
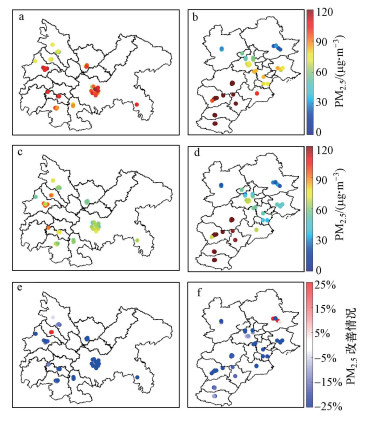 |
| 图 9 2014与2017年冬季除去空气停滞影响后的PM2.5浓度分布(图a与b为2014年, 图c与d为2017年)及改善情况(图e与f) Fig. 9Spatial distribution of PM2.5 concentration excluding AS effect during 2014(a&b) and 2017(c&d) winter and its improvement(e&f) |
表 2(Table 2)
| 表 2 2014—2017年冬季空气停滞日各城市PM2.5浓度改善情况及空气停滞状态上限浓度参考标准值 Table 2 Improvement of ASD PM2.5 concentration and the reference standard values of the upper limit in winter among some cities during 2014—2017 | ||||||||||||||||||||||||||||||||||||||||||||||||||||||||||||||||||||||||||||||||||||||||||||||||||||||||||||||||||||||||||||||||||||||||||||||||||||||||||||||||||||||||||||||||||||||||||||||||
表 2 2014—2017年冬季空气停滞日各城市PM2.5浓度改善情况及空气停滞状态上限浓度参考标准值 Table 2 Improvement of ASD PM2.5 concentration and the reference standard values of the upper limit in winter among some cities during 2014—2017
| ||||||||||||||||||||||||||||||||||||||||||||||||||||||||||||||||||||||||||||||||||||||||||||||||||||||||||||||||||||||||||||||||||||||||||||||||||||||||||||||||||||||||||||||||||||||||||||||||
四川盆地、京津冀地区2016年排放源空间分布情况如图 10所示, 四川盆地排放源主要集中在成都、重庆、自贡3个城市, 京津冀地区为其南部、中部及唐山等地区.四川盆地西侧成都及周边地区及京津冀中部和南部地区的污染源高排放(图 10)、高空气停滞频率(图 6)、空气停滞影响大(图 8), 造成这些地区重污染事件频发.
图 10(Fig. 10)
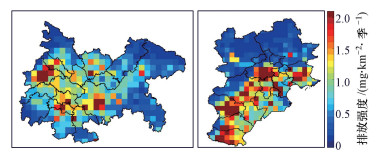 |
| 图 10 MEIC2016年冬季总PM2.5排放源分布 Fig. 10Spatial distribution of PM2.5 MEIC emission during the winter of 2016 |
3.4.3 冬季各城市PM2.5污染上限浓度参考标准值PM2.5污染事件主要发生在冬季, 而冬季PM2.5浓度高值往往出现在空气停滞期间(图 3与图 4), 且近年两个区域的空气停滞影响变化不大, 以提高城市PM2.5污染优良天数为目的, 使用公式(1)计算得到各城市空气停滞状态下PM2.5污染上限浓度参考标准值(表 2), 当各城市空气停滞状态PM2.5浓度控制在标准值以下时, PM2.5优良天数比例可大幅提升.其中秦皇岛、唐山、廊坊、承德等城市, 受空气停滞影响大, 极易造成严重污染天气, 需严控污染物的排放.
4 结论(Conclusions)1) 本研究通过拟合方程得到了空气停滞下的气象条件阈值, 其中京津冀地区冬季空气停滞标准为BLH < 646.91e-0183WSP, 四川盆地为BLH < 654.16e-0141WSP.当四川盆地气象条件地面风速分布在2.5 m · s-1以下, 边界层高度在500 m以下, 京津冀地区地面风速分布在3 m · s-1以下, 边界层高度在300 m以下, 空气停滞频发, PM2.5浓度呈现高值.
2) 四川盆地10年空气停滞频率变化不明显, 空间分布呈中心低, 四周高的特点;空气停滞影响随时间变化不明显, 空间分布西高东低.京津冀地区10年空气停滞频率呈现出显著周期性波动, 有缓慢的上升趋势, 频率高值区主要分布在中部和南部;空气停滞影响随时间变化较小, 影响高值区呈现出显著的南北差异, 北高南低.
3) 近年来, 四川盆地与京津冀环境质量有了明显改进, 实际改善幅度分别为26%、17%, 空气停滞状态下分别为25%、16%, 除去空气停滞影响分别为24%、21%.四川盆地减排效果较京津冀地区更为明显, 气象条件较京津冀地区差, 大气扩散能力差, 其环境质量的改善得利于减排措施的有效实施.四川盆地西部以成都为中心的周边地区及京津冀中部和南部地区的污染源高排放、高空气停滞频率、空气停滞影响大, 造成了这些地区重污染事件频发.
4) PM2.5污染事件主要发生在冬季, 而冬季PM2.5浓度高值往往出现在空气停滞期间, 且近年两个区域的空气停滞影响变化不大, 以提高城市PM2.5污染优良天数为目的, 计算得到各城市空气停滞状态下PM2.5污染上限浓度参考标准值, 为地区空气质量达标管理提供量化、可靠的科学依据.
参考文献
| 曹军骥. 2014. PM2.5与环境[M]. 北京: 科学出版社: 428. |
| Chen H, Wang H. 2015. Haze days in North China and the associated atmospheric circulations based on daily visibility data from 1960 to 2012[J]. Journal of Geophysical Research Atmospheres, 120(12): 5895–5909.DOI:10.1002/2015JD023225 |
| Chen Y, Xie S. 2012. Temporal and spatial visibility trends in the Sichuan Basin, China, 1973 to 2010[J]. Atmospheric Research, 112: 25–34.DOI:10.1016/j.atmosres.2012.04.009 |
| Ding Y H, Liu Y J. 2014. Analysis of long-term variations of fog and haze in China in recent 50 years and their relations with atmospheric humidity[J]. Science China Earth Sciences, 57(1): 36–46.DOI:10.1007/s11430-013-4792-1 |
| Fu G Q, Xu W Y, Yang R F, et al. 2014. The distribution and trends of fog and haze in the North China Plain over the past 30 years[J]. Atmospheric Chemistry and Physics, 14(21): 11949–11958.DOI:10.5194/acp-14-11949-2014 |
| Guan D, Su X, Zhang Q, et al. 2014. The socioeconomic drivers of China's primary PM2.5 emissions[J]. Environmental Research Letters, 9(2): 024010.DOI:10.1088/1748-9326/9/2/024010 |
| Guo L J, Guo X L, Fang C G, et al. 2015. Observation analysis on characteristics of formation, evolution and transition of a long-lasting severe fog and haze episode in North China[J]. Science China Earth Sciences, 58(3): 329–344.DOI:10.1007/s11430-014-4924-2 |
| Horton D E, Skinner C B, Singh D, et al. 2014. Occurrence and persistence of future atmospheric stagnation events[J]. Nature Climate Change, 4(8): 698–703.DOI:10.1038/nclimate2272 |
| Hu J, Wang Y, Ying Q, et al. 2014. Spatial and temporal variability of PM2.5 and PM10 over the North China Plain and the Yangtze River Delta, China[J]. Atmospheric Environment, 95: 598–609.DOI:10.1016/j.atmosenv.2014.07.019 |
| Hu M, Jia L, Wang J, et al. 2013. Spatial and temporal characteristics of particulate matter in Beijing, China using the Empirical Mode Decomposition method[J]. Science of The Total Environment, 458-460: 70–80.DOI:10.1016/j.scitotenv.2013.04.005 |
| Hu W, Hu M, Hu W W, et al. 2016. Characterization of submicron aerosols influenced by biomass burning at a site in the Sichuan Basin, southwestern China[J]. Atmospheric Chemistry and Physics, 16(20): 13213–13230.DOI:10.5194/acp-16-13213-2016 |
| Huang Q, Cai X, Song Y, et al. 2017. Air stagnation in China (1985-2014):climatological mean features and trends[J]. Atmospheric Chemistry and Physics, 17(12): 1–23. |
| IPCC, 2013: Climate Change 2013. The Physical Science Basis[OL]. Cambridge University Press, 1535 pp., https://doi.org/10.1017/CBO9781107415324. |
| Ji D, Wang Y, Wang L, et al. 2012. Analysis of heavy pollution episodes in selected cities of northern China[J]. Atmospheric Environment, 50(3): 338–348. |
| Kan H, Chen R, Tong S. 2012. Ambient air pollution, climate change, and population health in China[J]. Environment International, 42: 10–19.DOI:10.1016/j.envint.2011.03.003 |
| Korshover J, Angell J K. 1982. A review of air-stagnation cases in the eastern united states during 1981-Annual summary[J]. Monthly Weather Review, 110(10): 1515–1518.DOI:10.1175/1520-0493(1982)110<1515:AROASC>2.0.CO;2 |
| Leung, Ruby L. 2005. Potential regional climate change and implications to U.S. air quality[J]. Geophysical Research Letters, 32(16): L16711.DOI:10.1029/2005GL022911 |
| Li L, Qian J, Ou C Q, et al. 2014. Spatial and temporal analysis of air pollution index and its timescale-dependent relationship with meteorological factors in Guangzhou, China, 2001-2011[J]. Environmental Pollution, 190: 75–81.DOI:10.1016/j.envpol.2014.03.020 |
| Li Q, Zhang R, Wang Y. 2016. Interannual variation of the wintertime fog-haze days across central and eastern China and its relation with East Asian winter monsoon[J]. International Journal of Climatology, 36(1): 346–354.DOI:10.1002/joc.4350 |
| Bressi M, Sciare J, Ghersi V, et al. 2013. A one-year comprehensive chemical characterisation of fine aerosol (PM2.5) at urban, suburban and rural background sites in the region of Paris (France)[J]. Atmospheric Chemistry and Physics, 13(15): 7825–7844.DOI:10.5194/acp-13-7825-2013 |
| Mijling B, Van d A R J, Zhang Q. 2013. Regional nitrogen oxides emission trends in East Asia observed from space[J]. Atmospheric Chemistry and Physics, 13(23): 12003–12012.DOI:10.5194/acp-13-12003-2013 |
| Mu Q, Liao H. 2014. Simulation of the interannual variations of aerosols in China:role of variations in meteorological parameters[J]. Atmospheric Chemistry and Physics, 14(18): 9597–9612.DOI:10.5194/acp-14-9597-2014 |
| Niu F, Li Z, Li C, et al. 2010. Increase of wintertime fog in China:Potential impacts of weakening of the Eastern Asian monsoon circulation and increasing aerosol loading[J]. Journal of Geophysical Research Atmospheres, 115: D00K20. |
| 潘竟虎, 张文, 李俊峰, 等. 2014. 中国大范围雾霾期间主要城市空气污染物分布特征[J]. 生态学杂志, 2014, 33(12): 3423–3431. |
| 潘月鹏, 贾琳, 田世丽, 等. 2014. 大气霾污染对农业生产的可能影响[J]. 农业环境科学学报, 2014, 33(11): 2279–2280.DOI:10.11654/jaes.2014.11.030 |
| Quan J, Tie X, Zhang Q, et al. 2014. Characteristics of heavy aerosol pollution during the 2012-2013 winter in Beijing, China[J]. Atmospheric Environment, 88: 83–89.DOI:10.1016/j.atmosenv.2014.01.058 |
| Quan J, Zhang Q, He H, et al. 2011. Analysis of the formation of fog and haze in North China Plain (NCP)[J]. Atmospheric Chemistry and Physics, 11(15): 8205–8214.DOI:10.5194/acp-11-8205-2011 |
| Rigby M, Toumi R. 2008. London air pollution climatology:Indirect evidence for urban boundary layer height and wind speed enhancement[J]. Atmospheric Environment, 42(20): 4932–4947.DOI:10.1016/j.atmosenv.2008.02.031 |
| Tao W, Liu J, Banweiss G A, et al. 2015. Effects of urban land expansion on the regional meteorology and air quality of Eastern China[J]. Atmospheric Chemistry and Physics Discussions, 15(7): 10299–10340.DOI:10.5194/acpd-15-10299-2015 |
| Wang X, Wang K, Su L. 2016. Contribution of Atmospheric Diffusion Conditions to the Recent Improvement in Air Quality in China[J]. Scientific Reports, 6: 36404.DOI:10.1038/srep36404 |
| Wang X, Dickinson E, Su L, et al. 2018. PM2.5 pollution in China and how it has been exacerbated by terrain and meteorological conditions[J]. Bulletin of the American Meteorological Society, 99(1): 105–119.DOI:10.1175/BAMS-D-16-0301.1 |
| Wang Y H, Liu Z R, Zhang J K, et al. 2015. Aerosol physicochemical properties and implications for visibility during an intense haze episode during winter in Beijing[J]. Atmospheric Chemistry and Physics, 15(6): 3205–3215.DOI:10.5194/acp-15-3205-2015 |
| Wang J X L, Angell J K, 1999. Air stagnation climatology for the United States (1948-1998)[OL]. NOAA/Air Resources Laboratory ATLAS 1, 76 pp., https://www.arl.noaa.gov/documents/reports/atlas.pdf. |
| Yu L D, Wang G F, Zhang R J, et al. 2013. Characterization and source apportionment of PM2.5 in an urban environment in Beijing[J]. Aerosol and Air Quality Research, 13(2): 574–583.DOI:10.4209/aaqr.2012.07.0192 |
| Zhang R, Li Q, Zhang R N. 2014. Meteorological conditions for the persistent severe fog and haze event over eastern China in January 2013[J]. Science China Earth Sciences, 57(1): 26–35.DOI:10.1007/s11430-013-4774-3 |
| Zhang Y L, Cao F. 2015. Fine particulate matter (PM2.5) in China at a city level[J]. Scientific Reports, 5: 14884.DOI:10.1038/srep14884 |
| Zhang Y, Wen X Y, Jang C J. 2010. Simulating chemistry-aerosol-cloud-radiation-climate feedbacks over the continental U.S. using the online-coupled Weather Research Forecasting Model with chemistry (WRF/Chem)[J]. Atmospheric Environment, 44(29): 3568–3582.DOI:10.1016/j.atmosenv.2010.05.056 |
| Zhang Y, Ding A, Mao H, et al. 2016. Impact of synoptic weather patterns and inter-decadal climate variability on air quality in the North China Plain during 1980-2013[J]. Atmospheric Environmental, 124: 119–128.DOI:10.1016/j.atmosenv.2015.05.063 |
| Zhao X J, Zhao P S, Xu J, et al. 2013. Analysis of a winter regional haze event and its formation mechanism in the North China Plain[J]. Atmospheric Chemistry and Physics, 13(1): 5685–5696. |
