 ), 于照辉, 李菲茗, 王立君
 浙江师范大学教师教育学院, 金华 321004
收稿日期:2018-09-21出版日期:2019-06-25发布日期:2019-04-25通讯作者:詹沛达E-mail:pdzhan@gmail.com基金资助:* 国家自然科学基金青年基金项目(31600908);浙江省自然科学基金项目(LY16C090001);教育部人文社会科学研究青年基金项目(19YJC190025);浙江省教育科学规划重点课题资助(2019SB112)Using a multi-order cognitive diagnosis model to assess scientific literacy
ZHAN Peida(), YU Zhaohui, LI Feiming, WANG Lijun College of Teacher Education, Zhejiang Normal University, Jinhua 321004, China
Received:2018-09-21Online:2019-06-25Published:2019-04-25Contact:ZHAN Peida E-mail:pdzhan@gmail.com摘要/Abstract
摘要: 科学素养是指作为一名有反思意识的公民所具有的解决科学问题和运用科学理念的能力。为实现在认知诊断中对科学素养的测评, 本文基于PISA 2015科学素养测评框架首次提出科学素养包含的三阶潜在结构, 使用新提出的多阶认知诊断模型对PISA 2015科学测评数据进行分析, 并通过模拟研究探究新模型的心理测量学性能。结果表明:(1)新模型能够较好地分析包含三阶潜在结构的科学素养; (2)科学知识对科学素养的影响最大, 科学背景次之, 科学能力的影响最小; (3)全贝叶斯MCMC算法能够为新模型提供较精准的参数估计。
图/表 15

图1PISA 2015科学素养测评框架(来源:OECD (2016)第23页图2.2).
图1PISA 2015科学素养测评框架(来源:OECD (2016)第23页图2.2).
图2PISA 2015科学素养所包含的三阶潜在结构
图2PISA 2015科学素养所包含的三阶潜在结构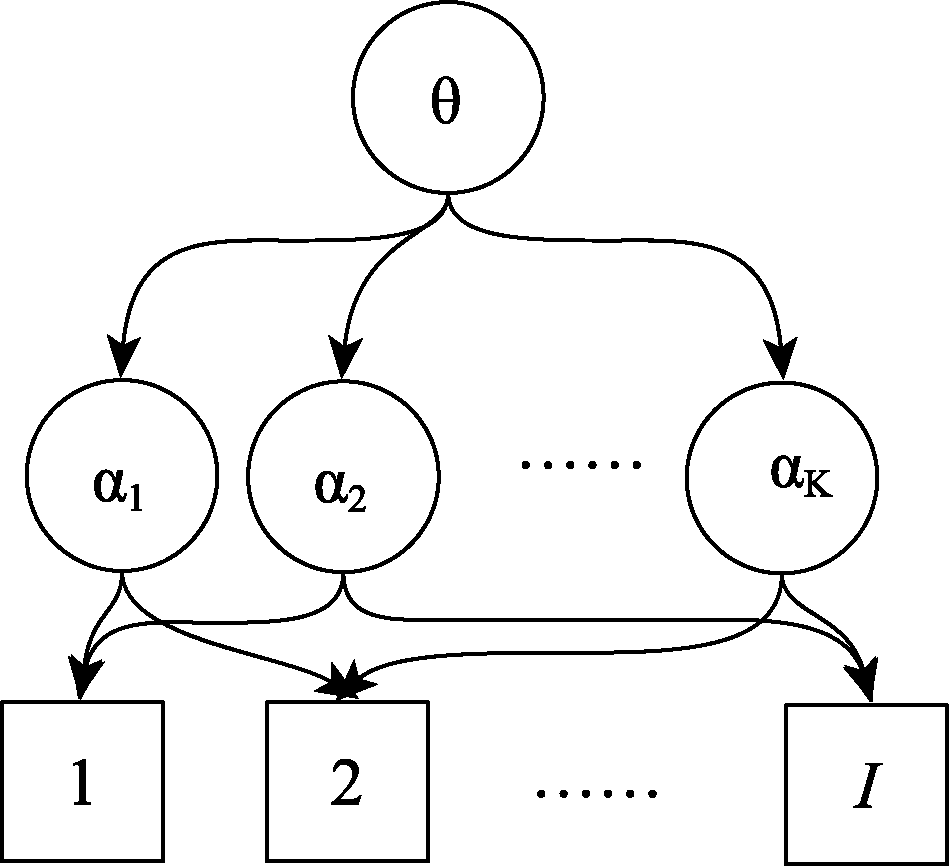
图3CDA中二阶潜在特质与属性间的关系示例图 注:θ为第二阶潜在特质; α为(第一阶)属性; K为总属性数量; I为总题目数量
图3CDA中二阶潜在特质与属性间的关系示例图 注:θ为第二阶潜在特质; α为(第一阶)属性; K为总属性数量; I为总题目数量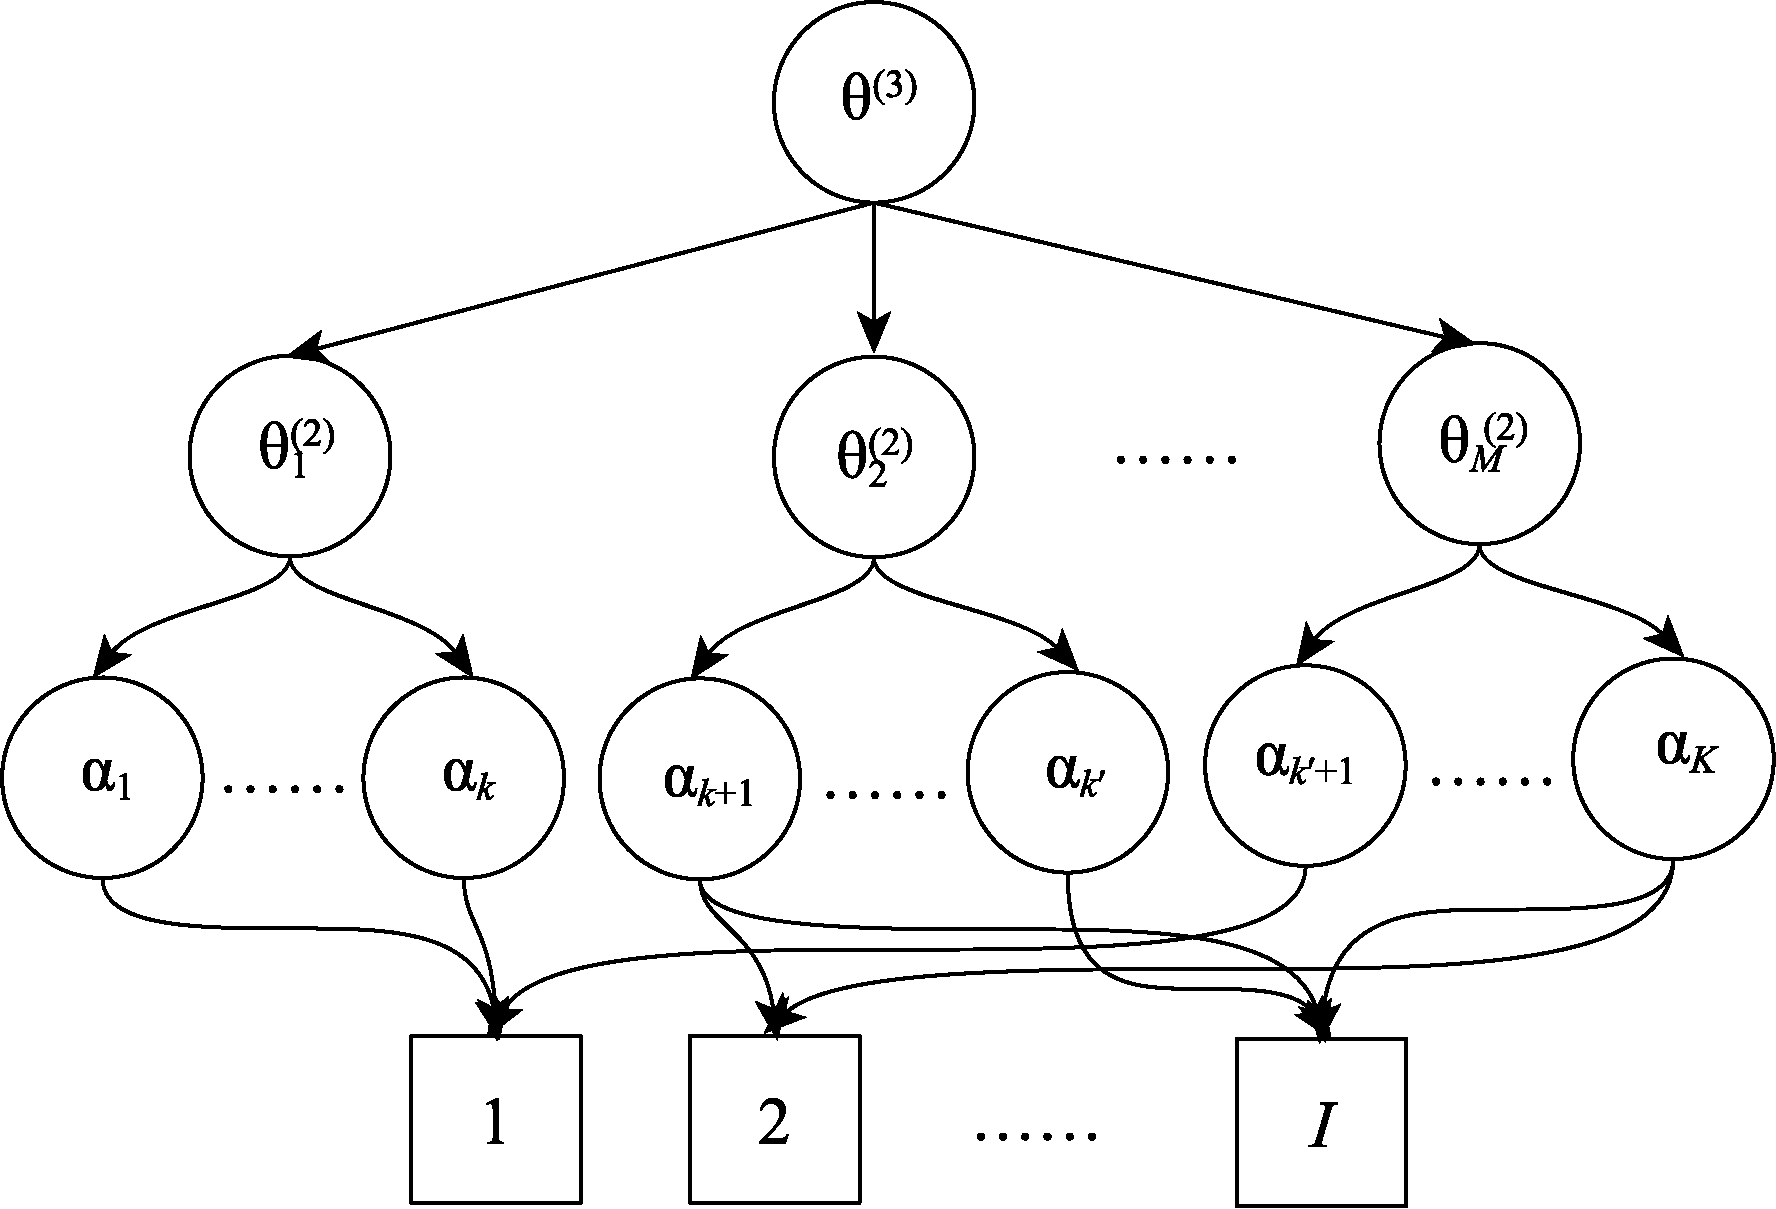
图4CDA中第三阶潜在特质与属性间的关系示例图. 注:θ(3)为第三阶潜在特质; θ(2)为第二阶潜在特质; α为(第一阶)属性; K为总属性数量; I为总题目数量。
图4CDA中第三阶潜在特质与属性间的关系示例图. 注:θ(3)为第三阶潜在特质; θ(2)为第二阶潜在特质; α为(第一阶)属性; K为总属性数量; I为总题目数量。表1PISA 2015科学测验部分题目的Q矩阵
| 题目 | θ(3) | ||||||||
|---|---|---|---|---|---|---|---|---|---|
| θ1(2) | θ2(2) | θ3(2) | |||||||
| A1 | A2 | A3 | A4 | A5 | A6 | A7 | A8 | A9 | |
| DS269Q01 | 1 | 1 | 1 | ||||||
| DS269Q03 | 1 | 1 | 1 | ||||||
| CS269Q04 | 1 | 1 | 1 | ||||||
| CS408Q01 | 1 | 1 | 1 | ||||||
| DS408Q03 | 1 | 1 | 1 | ||||||
| CS408Q04 | 1 | 1 | 1 | ||||||
| CS408Q05 | 1 | 1 | 1 | ||||||
| CS521Q02 | 1 | 1 | 1 | ||||||
| CS521Q06 | 1 | 1 | 1 | ||||||
| DS519Q01 | 1 | 1 | 1 | ||||||
| CS519Q02 | 1 | 1 | 1 | ||||||
| DS519Q03 | 1 | 1 | 1 | ||||||
| CS527Q01 | 1 | 1 | 1 | ||||||
| CS527Q03 | 1 | 1 | 1 | ||||||
| CS527Q04 | 1 | 1 | 1 | ||||||
| CS466Q01 | 1 | 1 | 1 | ||||||
| CS466Q07 | 1 | 1 | 1 | ||||||
| CS466Q05 | 1 | 1 | 1 | ||||||
表1PISA 2015科学测验部分题目的Q矩阵
| 题目 | θ(3) | ||||||||
|---|---|---|---|---|---|---|---|---|---|
| θ1(2) | θ2(2) | θ3(2) | |||||||
| A1 | A2 | A3 | A4 | A5 | A6 | A7 | A8 | A9 | |
| DS269Q01 | 1 | 1 | 1 | ||||||
| DS269Q03 | 1 | 1 | 1 | ||||||
| CS269Q04 | 1 | 1 | 1 | ||||||
| CS408Q01 | 1 | 1 | 1 | ||||||
| DS408Q03 | 1 | 1 | 1 | ||||||
| CS408Q04 | 1 | 1 | 1 | ||||||
| CS408Q05 | 1 | 1 | 1 | ||||||
| CS521Q02 | 1 | 1 | 1 | ||||||
| CS521Q06 | 1 | 1 | 1 | ||||||
| DS519Q01 | 1 | 1 | 1 | ||||||
| CS519Q02 | 1 | 1 | 1 | ||||||
| DS519Q03 | 1 | 1 | 1 | ||||||
| CS527Q01 | 1 | 1 | 1 | ||||||
| CS527Q03 | 1 | 1 | 1 | ||||||
| CS527Q04 | 1 | 1 | 1 | ||||||
| CS466Q01 | 1 | 1 | 1 | ||||||
| CS466Q07 | 1 | 1 | 1 | ||||||
| CS466Q05 | 1 | 1 | 1 | ||||||
表2PISA 2015科学测验部分题目数据的模型-数据拟合指标值.
| 模型 | -2LL | AIC | BIC | DIC | ppp |
|---|---|---|---|---|---|
| MO-DINA | 19332 | 19389 | 19673 | 24775 | 0.738 |
| HO-DINA | 19345 | 19399 | 19668 | 24644 | 0.716 |
| DINA | 19415 | 19962 | 22687 | 24856 | 0.692 |
表2PISA 2015科学测验部分题目数据的模型-数据拟合指标值.
| 模型 | -2LL | AIC | BIC | DIC | ppp |
|---|---|---|---|---|---|
| MO-DINA | 19332 | 19389 | 19673 | 24775 | 0.738 |
| HO-DINA | 19345 | 19399 | 19668 | 24644 | 0.716 |
| DINA | 19415 | 19962 | 22687 | 24856 | 0.692 |
表3PISA 2015科学测验部分题目的参数估计值.
| 题目 | gi | si | 95% CI (gi) | 95% CI (si) | IDIi | ||
|---|---|---|---|---|---|---|---|
| DS269Q01 | 0.325 | 0.119 | [0.263, 0.386] | [0.082, 0.158] | 0.556 | ||
| DS269Q03 | 0.459 | 0.070 | [0.397, 0.521] | [0.042, 0.102] | 0.471 | ||
| CS269Q04 | 0.237 | 0.351 | [0.190, 0.289] | [0.304, 0.398] | 0.412 | ||
| CS408Q01 | 0.434 | 0.181 | [0.373, 0.489] | [0.142, 0.222] | 0.385 | ||
| DS408Q03 | 0.033 | 0.810 | [0.015, 0.058] | [0.776, 0.843] | 0.157 | ||
| CS408Q04 | 0.429 | 0.261 | [0.374, 0.487] | [0.219, 0.300] | 0.310 | ||
| CS408Q05 | 0.295 | 0.213 | [0.220, 0.357] | [0.160, 0.266] | 0.492 | ||
| CS521Q02 | 0.548 | 0.133 | [0.494, 0.602] | [0.097, 0.170] | 0.319 | ||
| CS521Q06 | 0.849 | 0.008 | [0.809, 0.883] | [0.002, 0.017] | 0.143 | ||
| DS519Q01 | 0.106 | 0.524 | [0.047, 0.163] | [0.457, 0.582] | 0.370 | ||
| CS519Q02 | 0.281 | 0.304 | [0.231, 0.332] | [0.256, 0.353] | 0.415 | ||
| DS519Q03 | 0.323 | 0.228 | [0.212, 0.404] | [0.174, 0.282] | 0.449 | ||
| CS527Q01 | 0.033 | 0.788 | [0.012, 0.055] | [0.742, 0.831] | 0.179 | ||
| CS527Q03 | 0.393 | 0.330 | [0.343, 0.442] | [0.289, 0.371] | 0.277 | ||
| CS527Q04 | 0.281 | 0.373 | [0.203, 0.343] | [0.316, 0.423] | 0.346 | ||
| CS466Q01 | 0.448 | 0.182 | [0.378, 0.514] | [0.140, 0.226] | 0.370 | ||
| CS466Q07 | 0.649 | 0.050 | [0.543, 0.726] | [0.026, 0.080] | 0.301 | ||
| CS466Q05 | 0.342 | 0.243 | [0.284, 0.398] | [0.184, 0.300] | 0.415 | ||
表4PISA 2015科学测验部分题目的题目均值向量和方差协方差矩阵估计值.
| 参数 | 后验均值 | 95% CI | 相关系数 | |
|---|---|---|---|---|
| Σ | σβ2 | 1.773 | [0.873, 3.571] | 1.000 |
| ρβδσβσδ | -1.833 | [-3.719, -0.856] | -0.890 | |
| σδ2 | 2.394 | [1.145, 4.778] | 1.000 | |
| μ | μβ | -0.783 | [-1.408, -0.154] | |
| μδ | -1.212 | [-1.924, -0.493] | ||

图5PISA 2015科学测验中潜在结构参数估计值(基于MO-DINA模型). 注:括号内为95%贝叶斯可信区间.
图5PISA 2015科学测验中潜在结构参数估计值(基于MO-DINA模型). 注:括号内为95%贝叶斯可信区间.表5PISA 2015科学测验部分题目数据的诊断结果示例(基于MO-DINA模型).
| 被试 | α | θ1(2) | θ2(2) | θ3(2) | θ(3) |
|---|---|---|---|---|---|
| 2 | 111111111 | 0.582 [-0.863, 2.194] | 0.661 [-0.586, 2.174] | 0.656 [-0.572, 2.175] | 0.664 [-0.581, 2.194] |
| 5 | 010001000 | -0.873 [-2.317, 0.537] | -0.940 [-2.290, 0.276] | -0.910 [-2.307, 0.357] | -0.939 [-2.302, 0.263] |
| 7 | 010000000 | -0.919 [-2.429, 0.541] | -1.022 [-2.432, 0.198] | -1.028 [-2.445, 0.211] | -1.027 [-2.453, 0.183] |
| 23 | 111111111 | 0.202 [-1.182, 1.950] | 0.283 [-1.057, 1.961] | 0.338 [-0.999, 1.959] | 0.294 [-1.035, 1.968] |
| 54 | 010101000 | -0.831 [-2.414, 0.620] | -0.880 [-2.319, 0.461] | -0.870 [-2.368, 0.525] | -0.886 [-2.341, 0.426] |
| 86 | 111101110 | -0.404 [-2.082, 1.368] | -0.462 [-2.054, 1.314] | -0.468 [-2.034, 1.293] | -0.467 [-2.062, 1.300] |
表5PISA 2015科学测验部分题目数据的诊断结果示例(基于MO-DINA模型).
| 被试 | α | θ1(2) | θ2(2) | θ3(2) | θ(3) |
|---|---|---|---|---|---|
| 2 | 111111111 | 0.582 [-0.863, 2.194] | 0.661 [-0.586, 2.174] | 0.656 [-0.572, 2.175] | 0.664 [-0.581, 2.194] |
| 5 | 010001000 | -0.873 [-2.317, 0.537] | -0.940 [-2.290, 0.276] | -0.910 [-2.307, 0.357] | -0.939 [-2.302, 0.263] |
| 7 | 010000000 | -0.919 [-2.429, 0.541] | -1.022 [-2.432, 0.198] | -1.028 [-2.445, 0.211] | -1.027 [-2.453, 0.183] |
| 23 | 111111111 | 0.202 [-1.182, 1.950] | 0.283 [-1.057, 1.961] | 0.338 [-0.999, 1.959] | 0.294 [-1.035, 1.968] |
| 54 | 010101000 | -0.831 [-2.414, 0.620] | -0.880 [-2.319, 0.461] | -0.870 [-2.368, 0.525] | -0.886 [-2.341, 0.426] |
| 86 | 111101110 | -0.404 [-2.082, 1.368] | -0.462 [-2.054, 1.314] | -0.468 [-2.034, 1.293] | -0.467 [-2.062, 1.300] |
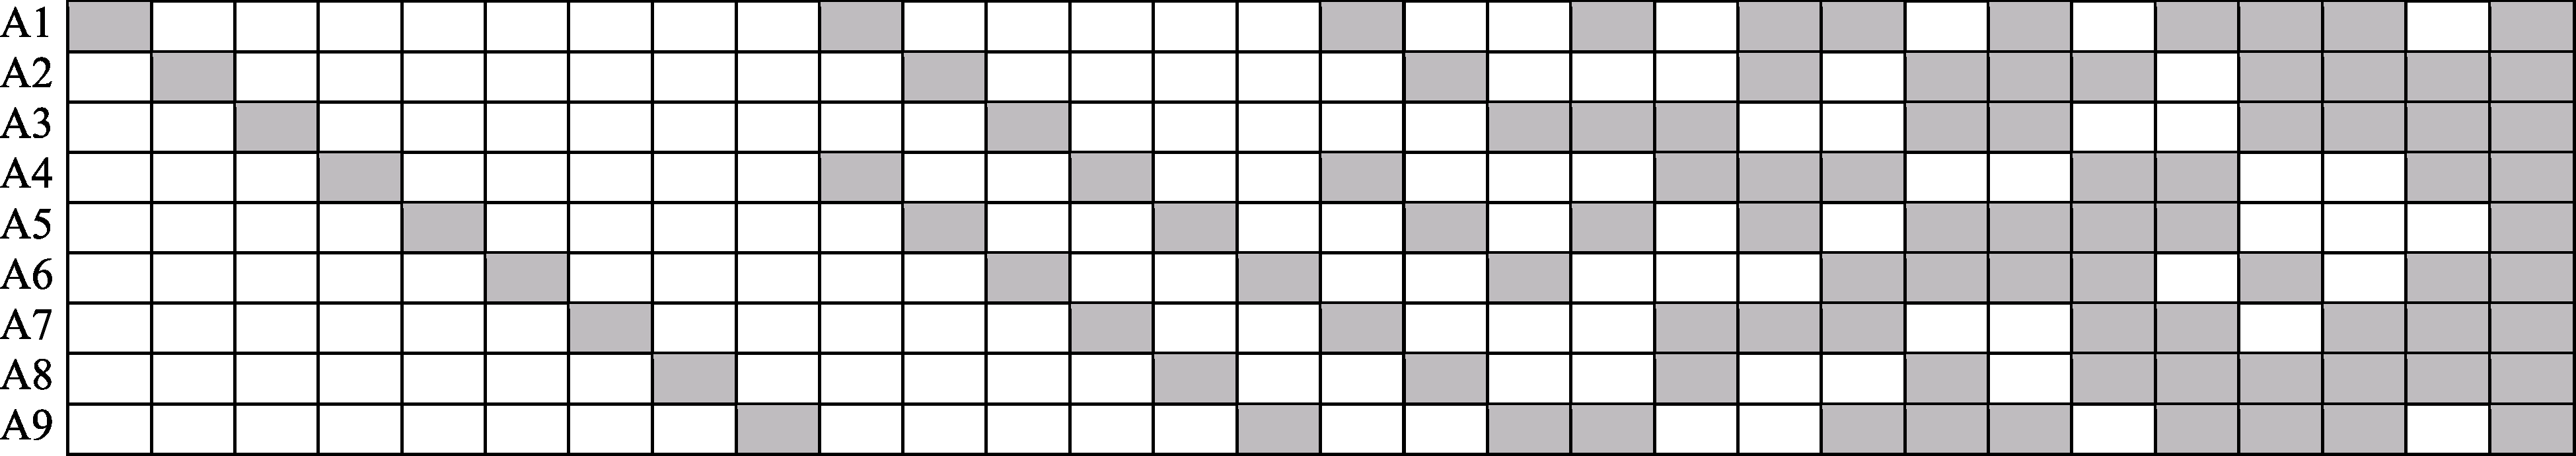
图6模拟研究中的K × I的Q’ 矩阵. 灰色表示“1”, 白色表示“0”.
图6模拟研究中的K × I的Q’ 矩阵. 灰色表示“1”, 白色表示“0”.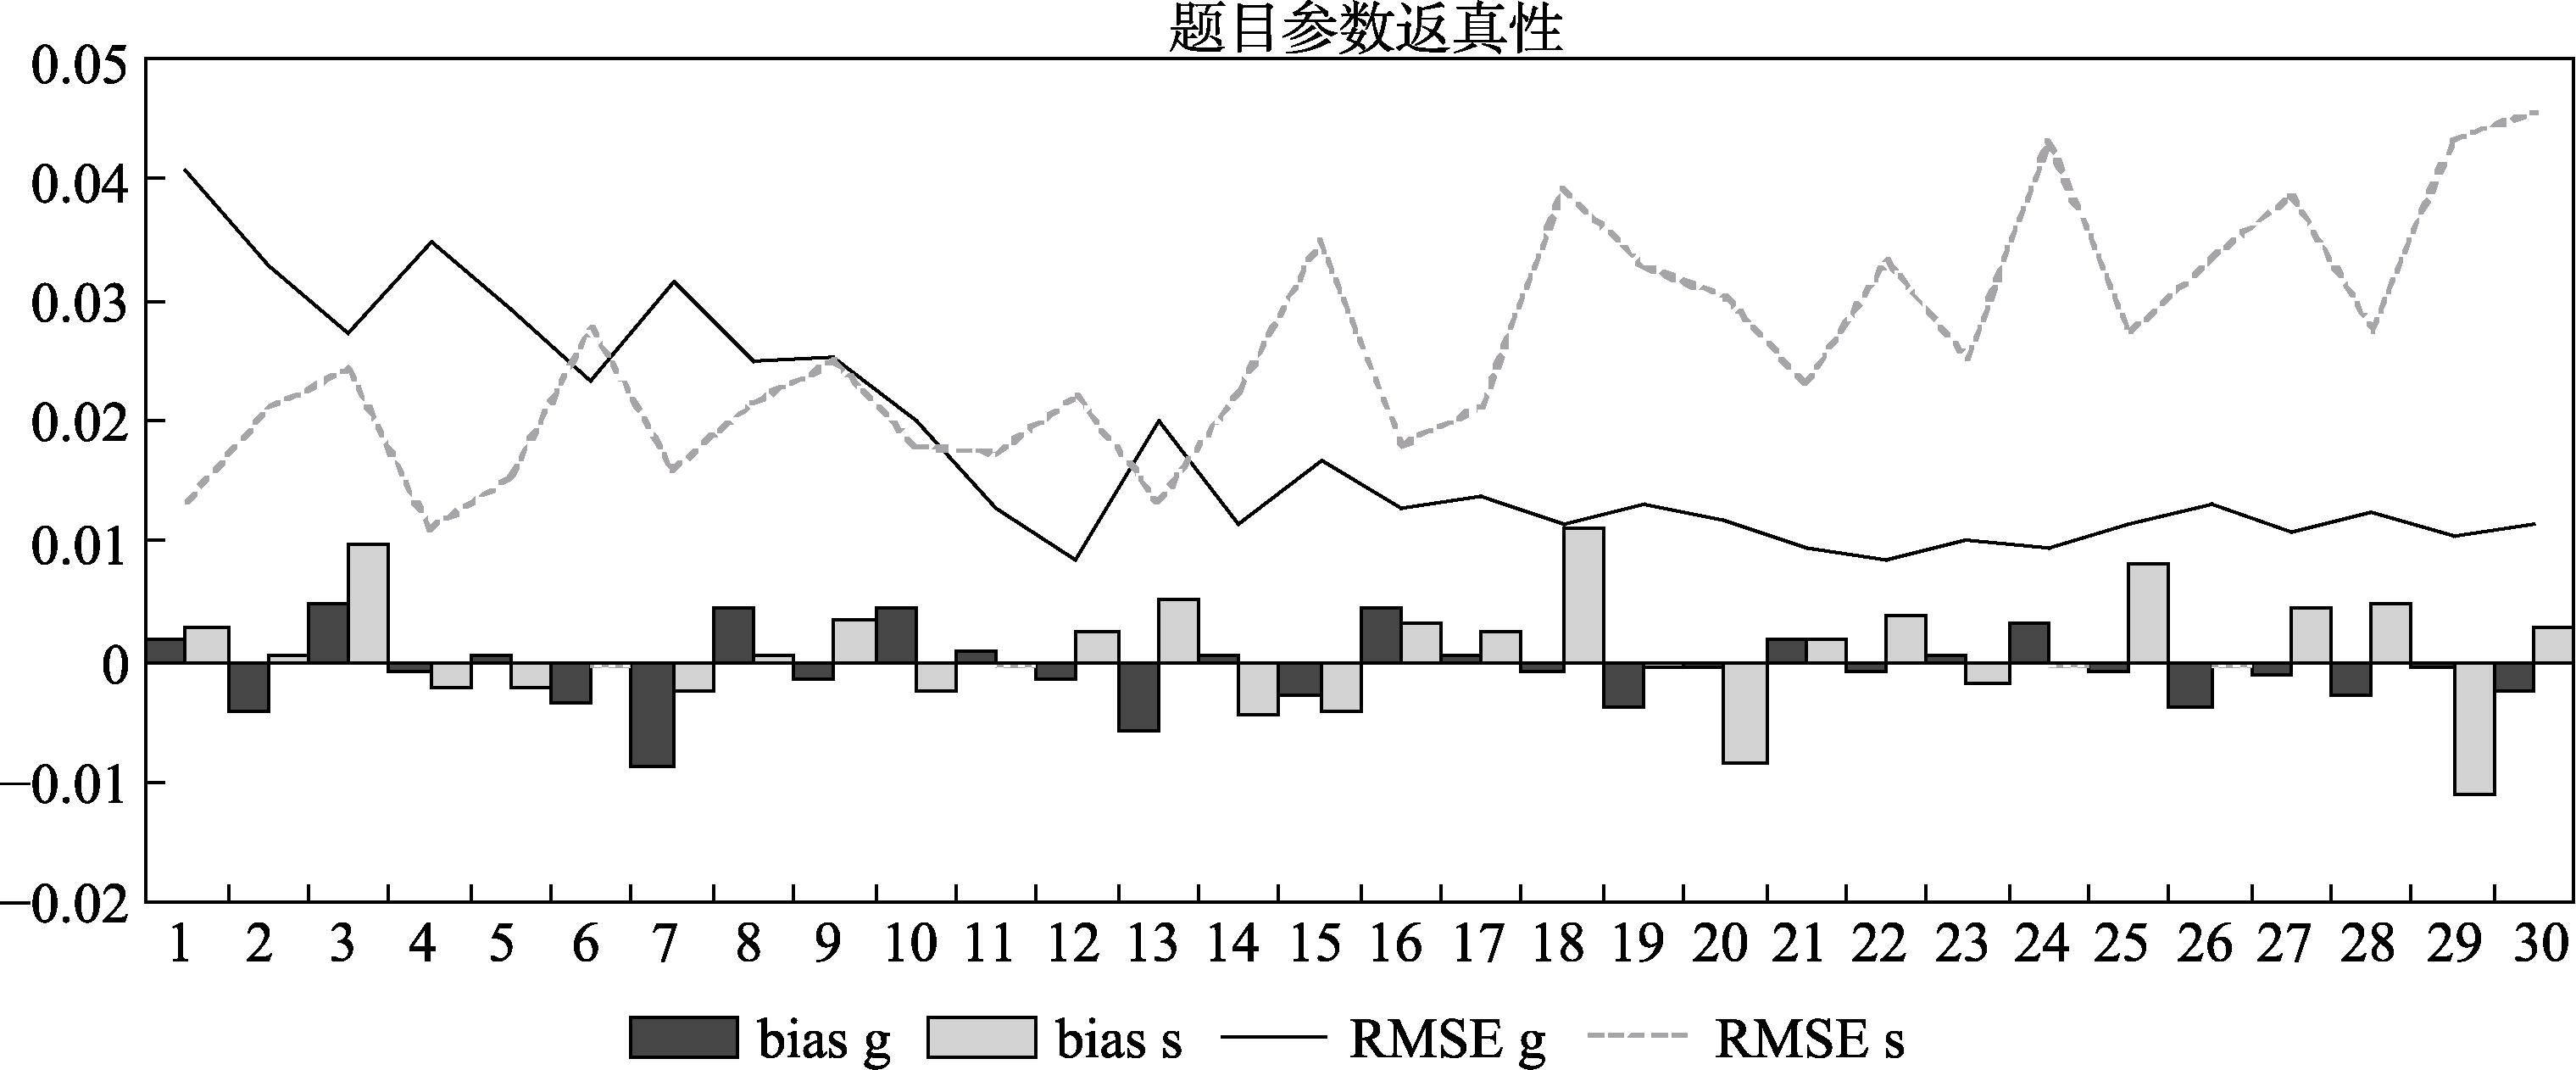
图7模拟研究中题目参数的返真性. 注: bias = 偏差; RMSE = 均方根误差.
图7模拟研究中题目参数的返真性. 注: bias = 偏差; RMSE = 均方根误差.
图8模拟研究中属性参数的属性正确判准率(ACCR).
图8模拟研究中属性参数的属性正确判准率(ACCR).表6模拟研究中高阶潜在特质参数的返真性.
| 参数 | tbias | RMSE | Cor | ||||||
|---|---|---|---|---|---|---|---|---|---|
| 平均绝对值 | 标准差 | 最小值 | 最大值 | 平均值 | 标准差 | 最小值 | 最大值 | ||
| θ(3) | 0.100 | 0.124 | -0.380 | 0.368 | 0.686 | 0.090 | 0.408 | 0.983 | 0.721 |
| θ1(2) | 0.100 | 0.125 | -0.378 | 0.352 | 0.689 | 0.092 | 0.385 | 0.983 | 0.719 |
| θ2(2) | 0.104 | 0.126 | -0.372 | 0.351 | 0.683 | 0.089 | 0.416 | 0.947 | 0.726 |
| θ3(2) | 0.104 | 0.130 | -0.481 | 0.381 | 0.690 | 0.095 | 0.358 | 1.050 | 0.715 |
表6模拟研究中高阶潜在特质参数的返真性.
| 参数 | tbias | RMSE | Cor | ||||||
|---|---|---|---|---|---|---|---|---|---|
| 平均绝对值 | 标准差 | 最小值 | 最大值 | 平均值 | 标准差 | 最小值 | 最大值 | ||
| θ(3) | 0.100 | 0.124 | -0.380 | 0.368 | 0.686 | 0.090 | 0.408 | 0.983 | 0.721 |
| θ1(2) | 0.100 | 0.125 | -0.378 | 0.352 | 0.689 | 0.092 | 0.385 | 0.983 | 0.719 |
| θ2(2) | 0.104 | 0.126 | -0.372 | 0.351 | 0.683 | 0.089 | 0.416 | 0.947 | 0.726 |
| θ3(2) | 0.104 | 0.130 | -0.481 | 0.381 | 0.690 | 0.095 | 0.358 | 1.050 | 0.715 |
表7模拟研究中潜在结构参数的返真性
| 参数 | bias | RMSE | Cor | ||||||
|---|---|---|---|---|---|---|---|---|---|
| 平均绝对值 | 标准差 | 最小值 | 最大值 | 平均值 | 标准差 | 最小值 | 最大值 | ||
| λ0k | 0.042 | 0.048 | -0.066 | 0.072 | 0.189 | 0.062 | 0.129 | 0.305 | 0.982 |
| λ1km | 0.116 | 0.051 | 0.015 | 0.172 | 0.346 | 0.057 | 0.245 | 0.429 | 0.982 |
| γ1(2) | -0.031 | 0.053 | |||||||
| γ2(2) | -0.012 | 0.076 | |||||||
| γ3(2) | -0.012 | 0.076 | |||||||
参考文献 43
| [1] | Birnbaum A., ( 1968). Some latent trait models and their use in inferring a student’s ability. In F. M. Lord & M. R. Novick (Eds.). Statistical theories of mental test scores. Addison- Wesley, Reading, MA. |
| [2] | Brooks S. P., & Gelman A. , ( 1998). General methods for monitoring convergence of iterative simulations. Journal of Computational and Graphical Statistics. 7(4), 434-455. |
| [3] | Chen F., Zhan P., Wang L., Chen C., & Cai M . ( 2015). The development and application of higher-order item response models. Advances in Psychological Science, 23, 150-157. |
| [ 陈飞鹏, 詹沛达, 王立君, 陈春晓, 蔡毛 . ( 2015). 高阶项目反应模型的发展与应用. 心理科学进展, 23, 150-157.] | |
| [4] | de la Torre J. , ( 2008). An empirically-based method of Q-matrix validation for the DINA model: Development and applications. Journal of Educational Measurement, 45( 4), 343-362. doi: 10.1111/jedm.2008.45.issue-4URL |
| [5] | de la Torre J. , ( 2009). DINA model and parameter estimation: A didactic. Journal of Educational and Behavioral Statistics, 34( 1), 115-130 doi: 10.3102/1076998607309474URL |
| [6] | de la Torre J., & Douglas J. A . ( 2004). Higher-order latent trait models for cognitive diagnosis. Psychometrika, 69( 3), 333-353. doi: 10.1007/BF02295640URL |
| [7] | de la Torre J., & Song H. , ( 2009). Simultaneously estimation of overall and domain abilities: A higher-order IRT model approach. Applied Psychological Measurement, 33( 8), 620-639. doi: 10.1177/0146621608326423URL |
| [8] | Gao H. B . ( 2011). Results of the eighth survey on Chinese citizens' scientific literacy were released. Bulletin of National Natural Science Foundation of China, 25, 63-64. |
| [ 高宏斌 . ( 2011). 第八次中国公民科学素养调查结果发布. 中国科学基金, 25, 63-64.] | |
| [9] | Hu Y., Yang S., & Lu K . ( 2012). The research of assessment tools of adolescents’ scientific literacy and its quality analysis. Education Research Monthly, 3, 16-21. |
| [ 胡咏梅, 杨素红, 卢珂 . ( 2012). 青少年科学素养测评工具研发及质量分析. 教育学术月刊, 3, 16-21.] | |
| [10] | Huang H.-Y., Wang W.-C., Chen P.-H., & Su C.-M . ( 2013). Higher-order item response models for hierarchical latent traits. Applied Psychological Measurement, 37( 8), 619-637. doi: 10.1177/0146621613488819URL |
| [11] | Junker B. W., & Sijtsma K. , ( 2001). Cognitive assessment models with few assumptions, and connections with nonparametric item response theory. Applied Psychological Measurement, 25, 258-272. doi: 10.1177/01466210122032064URL |
| [12] | Karelitz T. M . ( 2004). Ordered category attribute coding framework for cognitive assessments (Unpublished doctoral dissertation). University of Illinois at Urbana-Champaign |
| [13] | Kang C., & Xin T. , ( 2010). New development in test theory: multidimensional item response theory. Advances in Psychological Science, 18( 3), 530-536 |
| [ 康春花, 辛涛 . ( 2010). 测验理论的新发展:多维项目反应理论. 心理科学进展, 18( 3), 530-536.] | |
| [14] | Köhn H.-F. & Chiu C.-Y. , ( 2017). A procedure for assessing the completeness of the Q-matrices of cognitively diagnostic tests. Psychometrika, 82( 1), 112-132 doi: 10.1007/s11336-016-9536-7URL |
| [15] | Leighton J. & Gierl, M. (Eds.). , ( 2007) . Cognitive diagnostic assessment for education: Theory and applications Cambridge University Press Theory and applications. Cambridge University Press. |
| [16] | Leighton J. P., Gierl M. J., & Hunka S. M . ( 2004). The attribute hierarchy method for cognitive assessment: A variation on Tatsuoka’s rule-space approach. Journal of Educational Measurement, 41( 1), 205-237. doi: 10.1111/jedm.2004.41.issue-3URL |
| [17] | Li F., Cohen A Bottge, B, & Templin, J. ., ( 2016). A latent transition analysis model for assessing change in cognitive skills. Educational and Psychological Measurement, 76( 2), 181-204. doi: 10.1177/0013164415588946URL |
| [18] | Liu H., Liu Y., & Li M . ( 2018). Analysis of process data of PISA 2012 computer-based problem solving: Application of the modified multilevel mixture IRT model. Frontiers in Psychology, 9, 1372. |
| [19] | Liu K., Li C . ( 2015). The content and characteristic of PISA 2015 draft science framework. Comparative Education Review, 37( 7), 98-105. |
| [ 刘克文, 李川 . ( 2015). PISA 2015科学素养测试内容及特点. 比较教育研究, 37( 7), 98-105.] | |
| [20] | Macready G. B., & Dayton C. M . ( 1977). The use of probabilistic models in the assessment of mastery. Journal of Educational and Behavioral Statistics, 2( 2), 99-120. doi: 10.3102/10769986002002099URL |
| [21] | Miller J. D . ( 1983). Scientific literacy: A conceptual and empirical review. Daedalus, 112( 2), 29-48. |
| [22] | OECD. ( 2006). Assessing Scientific, Reading and Mathematical Literacy: A Framework for PISA 2006. Paris: PISA, OECD Publishing |
| [23] | OECD. ( 2016). PISA 2015 Assessment and Analytical Framework: Science, Reading, Mathematic and Financial Literacy. Paris: PISA, OECD Publishing |
| [24] | OECD. ( 2017). PISA 2015 Technical Report. Paris: PISA, OECD Publishing |
| [25] | Qin H., & Qian Y. , ( 2008). A survey report on Shanghai adolescents’ scientific literacy. Research in Educational Development,( 24), 31-35. |
| [ 秦浩正, 钱源伟 . ( 2008). 上海青少年科学素养调查报告. 教育发展研究, ( 24), 31-35.] | |
| [26] | Reckase M. D . ( 2009). Multidimensional item response theory. New York: Springer. |
| [27] | Ren L., Zhang C., & He W . ( 2013). Constructing and anallysis of the model of how the factors affect the scientific literacy of Chinese citizens and a comparative investigation. Studies in Science of Science, 31, 983-990. |
| [ 任磊, 张超, 何薇 . ( 2013). 中国公民科学素养及其影响因素模型的建构与分析. 科学学研究, 31( 7), 983-990.] | |
| [28] | Rijmen F., Jeon M., von Davier M., & Rabe-Hesketh S . ( 2014). A third-order item response theory model for modeling the effects of domains and subdomains in large-scale educational assessment surveys. Journal of Educational and Behavioral Statistics, 39( 4), 235-256. doi: 10.3102/1076998614531045URL |
| [29] | Roos J. M . ( 2014). Measuring science or religion? A measurement analysis of the National Science Foundation sponsored science literacy scale 2006-2010. Public Understanding of Science, 23( 7), 797-813. doi: 10.1177/0963662512464318URL |
| [30] | Rupp A. A., Templin J., & Henson R. A . ( 2010). Diagnostic Measurement: Theory, Methods, and Applications. New York, NY: Guilford Press |
| [31] | Ryan J. J., & Schnakenberg-Ott S. D . ( 2003). Scoring reliability on the Wechsler Adult Intelligence Scale-Third Edition (WAIS-III). Assessment, 10( 2), 151-159. doi: 10.1177/1073191103010002006URL |
| [32] | Templin J. L., Henson R. A., Templin S. E., & Roussos L . ( 2008). Robustness of hierarchical modeling of skill association in cognitive diagnosis models. Applied Psychological Measurement, 32( 7), 559-574. doi: 10.1177/0146621607300286URL |
| [33] | The Ministry of Education of the People's Republic of China. ( 2017). Compulsory education primary school curriculum standards. Retrieved June 2, 2017, from |
| [中华人民共和国教育部. ( 2017. 义务教育小学科学课程标准. ] | |
| [34] | Tu D, Cai Y & Ding S. , ( 2012). Cognitive diagnosis: Theory, Methods, and Applications. Beijing: Beijing Normal University Publishing Group. |
| [ 涂冬波, 蔡艳, 丁树良 . ( 2012). 认知诊断理论、方法与应用. 北京: 北京师范大学出版社. | |
| [35] | Wang W.-C., & Chen P.-H. , ( 2004). Implementation and measurement efficiency of multidimensional computerized adaptive testing. Applied Psychological Measurement, 28( 5), 295-316. doi: 10.1177/0146621604265938URL |
| [36] | Zhan P., Chen P., & Bian Y . ( 2016). Using confirmatory compensatory multidimensional IRT models to do cognitive diagnosis. Acta Psychologica Sinica, 48( 10), 1347-1356. |
| [ 詹沛达, 陈平, 边玉芳 . ( 2016). 使用验证性补偿多维IRT模型进行认知诊断评估. 心理学报, 48( 10), 1347-1356.] | |
| [37] | Zhan P., Jiao H., & Liao D . ( 2018). Cognitive diagnosis modelling incorporating item response times. British Journal of Mathematical and Statistical Psychology, 71( 2), 262-286. doi: 10.1111/bmsp.2018.71.issue-2URL |
| [38] | Zhan P., Jiao H., Liao D & Li F. , (in press). A longitudinal higher-order diagnostic classification model.Journal of Educational and Behavioral Statistics. |
| [39] | Zhan P., Jiao H., Liao M., & Bian Y . ( 2018). Bayesian DINA modeling incorporating within-item characteristic dependency. Applied Psychological Measurement. Advanced online publication. URL |
| [40] | Zhan P., Jiao H., Man K & Wang L. ,(in press). Using JAGS for Bayesian cognitive diagnosis modeling: A tutorial.Journal of Educational and Behavioral Statistics. |
| [41] | Zhan P., Ma W., Jiao H & Ding S. , (in press). A sequential higher-order latent structural model for hierarchical attributes in cognitive diagnostic assessments. Applied Psychological Measurement. |
| [42] | Zhan P., Wang W.-C & Li X. ,(in press). A partial mastery, higher-order latent structural model for polytomous attributes in cognitive diagnostic assessments.Journal of Classification. |
| [43] | Zhan P., Wang W.-C., & Wang L . ( 2013). Testlet response theory: an introduction and new developments. Advances in Psychological Science, 21( 12), 2265-2280. |
| [ 詹沛达, 王文中, 王立君 . ( 2013). 项目反应理论新进展之题组反应理论. 心理科学进展, 21( 12), 2265-2280.] |
相关文章 15
| [1] | 詹沛达, Hong Jiao, Kaiwen Man. 多维对数正态作答时间模型:对潜在加工速度多维性的探究[J]. 心理学报, 2020, 52(9): 1132-1142. |
| [2] | 罗芬, 王晓庆, 蔡艳, 涂冬波. 基于基尼指数的双目标CD-CAT选题策略[J]. 心理学报, 2020, 52(12): 1452-1465. |
| [3] | 汪大勋, 高旭亮, 蔡艳, 涂冬波. 基于类别水平的多级计分认知诊断Q矩阵修正:相对拟合统计量视角[J]. 心理学报, 2020, 52(1): 93-106. |
| [4] | 高旭亮, 汪大勋, 王芳, 蔡艳, 涂冬波. 基于分部评分模型思路的多级评分认知诊断模型开发[J]. 心理学报, 2019, 51(12): 1386-1397. |
| [5] | 高椿雷;罗照盛;喻晓锋; 彭亚风;郑蝉金. CD-MST初始阶段模块组建方法比较[J]. 心理学报, 2016, 48(8): 1037-1046. |
| [6] | 郭磊; 郑蝉金; 边玉芳; 宋乃庆; 夏凌翔. 认知诊断计算机化自适应测验中新的选题策略:结合项目区分度指标[J]. 心理学报, 2016, 48(7): 903-914. |
| [7] | 刘彦楼;辛涛;李令青;田伟;刘笑笑. 改进的认知诊断模型项目功能差异检验方法 ——基于观察信息矩阵的Wald统计量[J]. 心理学报, 2016, 48(5): 588-598. |
| [8] | 詹沛达;边玉芳;王立君. 重参数化的多分属性诊断分类模型及其判准率影响因素[J]. 心理学报, 2016, 48(3): 318-330. |
| [9] | 彭亚风;罗照盛;喻晓锋;高椿雷;李喻骏. 认知诊断评价中测验结构的优化设计[J]. 心理学报, 2016, 48(12): 1600-1611. |
| [10] | 蔡艳;苗莹;涂冬波. 多级评分的认知诊断计算机化适应测验[J]. 心理学报, 2016, 48(10): 1338-1346. |
| [11] | 詹沛达;陈平;边玉芳. 使用验证性补偿多维IRT模型进行认知诊断评估[J]. 心理学报, 2016, 48(10): 1347-1356. |
| [12] | 康春花;任平;曾平飞. 非参数认知诊断方法:多级评分的聚类分析[J]. 心理学报, 2015, 47(8): 1077-1088. |
| [13] | 罗照盛;喻晓锋;高椿雷;李喻骏;彭亚风;王 睿;王钰彤. 基于属性掌握概率的认知诊断计算机化自适应测验选题策略[J]. 心理学报, 2015, 47(5): 679-688. |
| [14] | 詹沛达;李晓敏;王文中;边玉芳;王立君. 多维题组效应认知诊断模型[J]. 心理学报, 2015, 47(5): 689-701. |
| [15] | 喻晓锋;罗照盛;高椿雷;李喻骏;王 睿;王钰彤. 使用似然比D2统计量的题目属性定义方法[J]. 心理学报, 2015, 47(3): 417-426. |
PDF全文下载地址:
http://journal.psych.ac.cn/xlxb/CN/article/downloadArticleFile.do?attachType=PDF&id=4460
