 ), 汤丹丹1, 顾红磊2
 1华南师范大学心理应用研究中心/心理学院, 广州 510631
2信阳师范学院教育科学学院, 信阳 464000
收稿日期:2018-06-22出版日期:2019-03-25发布日期:2019-01-22通讯作者:温忠麟E-mail:wenzl@scnu.edu.cn基金资助:* 国家自然科学基金项目资助(31771245)A general simulation comparison of the predictive validity between bifactor and high-order factor models
WEN Zhonglin1(), TANG Dandan1, GU Honglei2 1 Center for Studies of Psychological Application / School of Psychology, South China Normal University, Guangzhou 510631, China
2 School of Education Science, Xinyang Normal University, Xinyang 464000, China
Received:2018-06-22Online:2019-03-25Published:2019-01-22Contact:WEN Zhonglin E-mail:wenzl@scnu.edu.cn摘要/Abstract
摘要: 高阶因子模型本质上是一种特殊的双因子模型, 应用中却常被当做双因子模型的竞争模型。已有研究以满足比例约束的双因子模型(此时等价于一个高阶因子模型)为真实测量模型产生模拟数据, 比较了用双因子模型和高阶因子模型作为测量模型的预测效果。本文使用不满足比例约束的双因子模型(此时不与任何高阶因子模型等价)为真实测量模型产生模拟数据进行比较, 所得结果与满足比例约束的双因子模型的结果有很大差别, 双因子模型结构系数的相对偏差较小、检验力较高, 但第Ⅰ类错误率略高。结论是, 在比例约束条件成立时可以使用高阶因子模型, 否则, 从统计角度看, 一般情况下使用双因子模型进行预测比较好。
图/表 6

图1双因子模型M1和高阶因子模型M2
图1双因子模型M1和高阶因子模型M2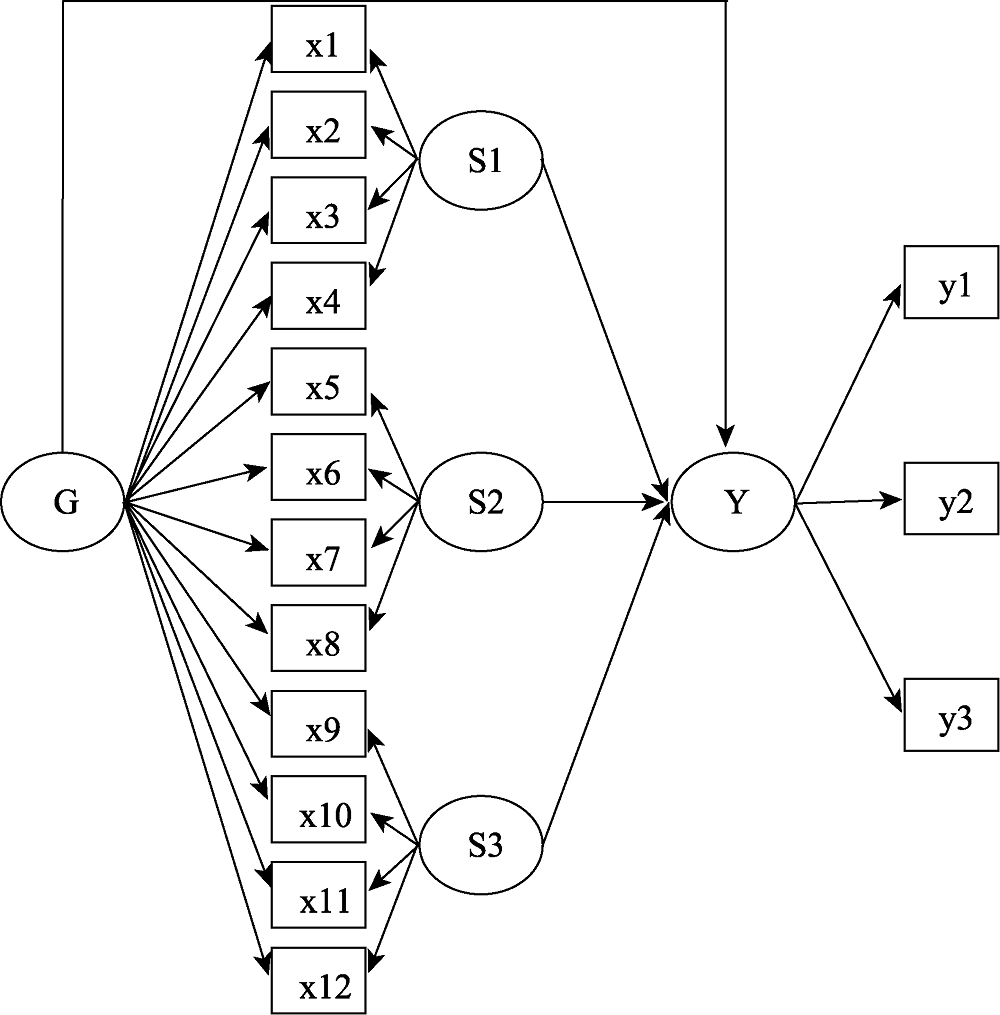
图2双因子模型Mb对效标变量的预测
图2双因子模型Mb对效标变量的预测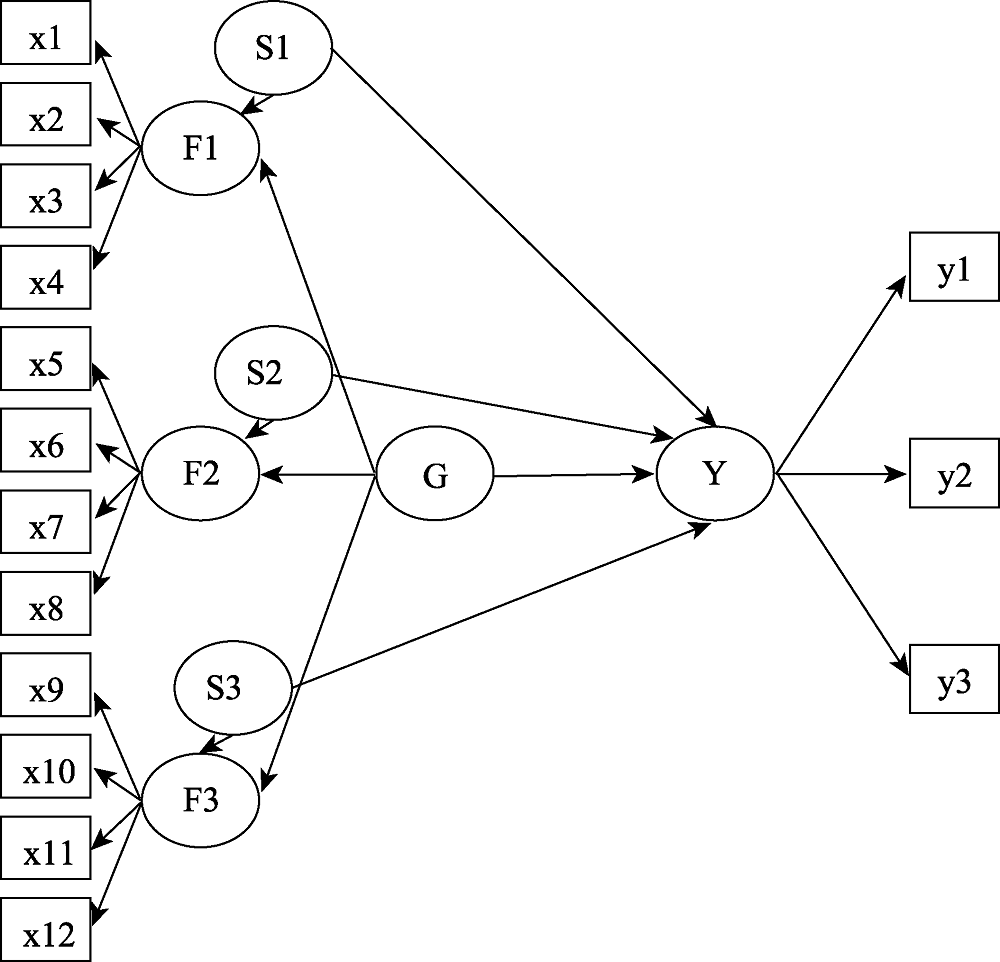
图3高阶因子模型Mh对效标变量的预测
图3高阶因子模型Mh对效标变量的预测
图4不满足比例约束条件时结构系数的相对偏差 注:横轴G表示全局因子负荷(下同); 纵轴G-Bias%表示G因子的结构系数的相对偏差; S1-Bias%表示S1因子的结构系数的相对偏差。
图4不满足比例约束条件时结构系数的相对偏差 注:横轴G表示全局因子负荷(下同); 纵轴G-Bias%表示G因子的结构系数的相对偏差; S1-Bias%表示S1因子的结构系数的相对偏差。
图5不满足比例约束条件时结构系数的统计检验力 注:G-Power表示G因子的结构系数统计检验力, S1-Power表示S1因子的结构系数统计检验力。
图5不满足比例约束条件时结构系数的统计检验力 注:G-Power表示G因子的结构系数统计检验力, S1-Power表示S1因子的结构系数统计检验力。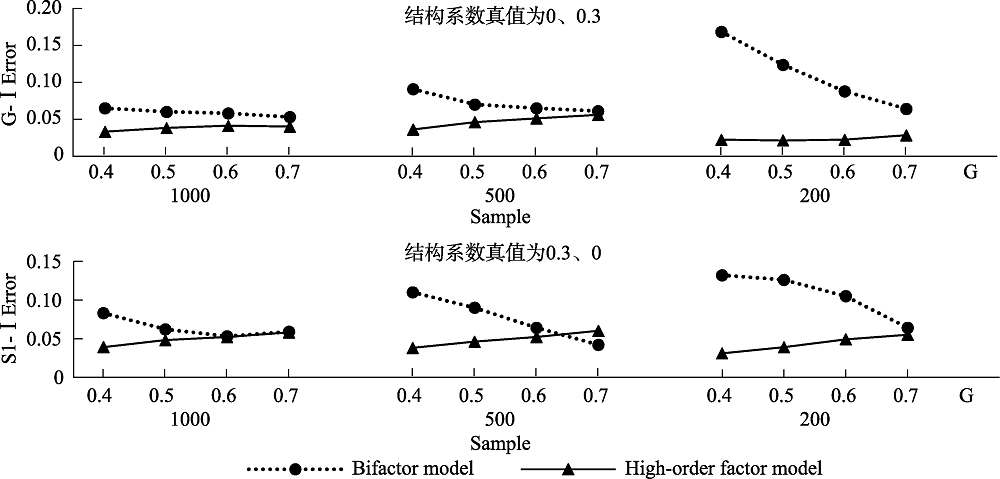
图6不满足比例约束条件时结构系数的第I类错误率 注:G-I Error表示G因子的结构系数的第I类错误率, S1-I Error表示S1因子的结构系数的第I类错误率。
图6不满足比例约束条件时结构系数的第I类错误率 注:G-I Error表示G因子的结构系数的第I类错误率, S1-I Error表示S1因子的结构系数的第I类错误率。参考文献 31
| [1] | Beaujean A. A., Parkin J., &Parker S . ( 2014). Comparing Cattell-Horn-Carroll factor models: Differences between bifactor and higher order factor models in predicting language achievement. Psychological Assessment, 26( 3), 789-805. doi: 10.1037/a0036745URLpmid: 24840178 |
| [2] | Bentler P.M . ( 1995). EQS 6 structural equations program manual. Encino, CA:Multivariate Software. |
| [3] | Bradley, &James V. ( 1978). Robustness? British Journal of Mathematical & Statistical Psychology, 31, 144-152. |
| [4] | Burnham K.P., &Anderson D.R . ( 1998). Model selection and inference: A practical information-theoretic approach. New York, NY:Springer. |
| [5] | Chen F. F., Hayes A., Carver C. S., Laurenceau J-P., &Zhang Z . ( 2012). Modeling general and specific variance in multifaceted constructs: A comparison of the bifactor model to other approaches. Journal of Personality, 80( 1), 219-251. doi: 10.1111/j.1467-6494.2011.00739.xURLpmid: 22092195 |
| [6] | Chen F. F., Jing Y., Hayes A., &Lee J. M . ( 2013). Two concepts or two approaches? A bifactor analysis of psychological and subjective well-being. Journal of Happiness Studies, 14( 3), 1033-1068. doi: 10.1007/s10902-012-9367-xURL |
| [7] | Chen F. F., West S. G., &Sousa K. H . ( 2006). A comparison of bifactor and second-order models of quality of life. Multivariate Behavioral Research, 41( 2), 189-225. doi: 10.1207/s15327906mbr4102_5URLpmid: 26782910 |
| [8] | Cucina J., &Byle K ., ( 2017). The bifactor model fits better than the higher-order model in more than 90% of comparisons for mental abilities test batteries. Journal of Intelligence, 5( 3), 27. doi: 10.3390/jintelligence5030027URL |
| [9] | Demars C.E . ( 2006). Application of the bi-factor multidimensional item response theory model to testlet- based tests. Journal of Educational Measurement, 43( 2), 145-168. doi: 10.1111/j.1745-3984.2006.00010.xURL |
| [10] | Distefano C., Greer F. W., &Kamphaus R. W . ( 2013). Multifactor modeling of emotional and behavioral risk of preschool-age children. Psychological Assessment, 25( 2), 467-476. doi: 10.1037/a0031393URLpmid: 23356680 |
| [11] | Gignac G.E . ( 2008). Higher-order models versus direct hierarchical models: A superordinate or breadth factor?. Psychology Science Quarterly, 50( 1), 21-43. |
| [12] | Gu H., &Wen Z .( 2017). Reporting and interpreting multidimensional test scores: A bi-factor perspective. Psychological Development and Education, 33, 504-512. |
| [ 顾红磊, 温忠麟 . ( 2017). 多维测验分数的报告与解释: 基于双因子模型的视角. 心理发展与教育, 33( 4), 504-512.] | |
| [13] | Gu H., Wen Z., &Fan X . ( 2017 a). Structural validity of the Machiavellian personality scale: A bifactor exploratory structural equation modeling approach. Personality and Individual Differences, 105, 116-123. doi: 10.1016/j.paid.2016.09.042URL |
| [14] | Gu H., Wen Z., &Fan X . ( 2017 b). Examining and controlling for wording effect in a self-report measure: A Monte Carlo simulation study. Structural Equation Modeling: A Multidisciplinary Journal, 24( 4), 545-555. doi: 10.1080/10705511.2017.1286228URL |
| [15] | Gustafsson J. E., &Balke G ., ( 1993). General and specific abilities as predictors of school achievement. Multivariate Behavioral Research, 28( 4), 407-434. doi: 10.1207/s15327906mbr2804_2URL |
| [16] | Hau K. T., Wen Z., Cheng Z. ( 2004). Structural equation model and its applications. Beijing, China: Educational Science Publishing House. |
| [ 侯杰泰, 温忠麟, 成子娟 . ( 2004). 结构方程模型及其应用. 北京: 教育科学出版社.] | |
| [17] | Hoogland J.J., &Boomsma A .( 1998). Robustness studies in covariance structure modeling: An overview and a meta- analysis. Sociological Methods & Research, 26( 3), 329-368. |
| [18] | Howard J. L., Gagné M., Morin A. J. S., &Forest J . ( 2018). Using bifactor exploratory structural equation modeling to test for a continuum structure of motivation. Journal of Management.44( 7), 2638-2664. |
| [19] | Hyland P., Boduszek D., Dhingra K., Shevlin M., &Egan A . ( 2014). A bifactor approach to modelling the Rosenberg Self Esteem Scale. Personality and Individual Differences, 66, 188-192. doi: 10.1016/j.paid.2014.03.034URL |
| [20] | Mackinnon D. P., Lockwood C. M., &Williams J . ( 2004). Confidence limits for the indirect effect: Distribution of the product and resampling methods. Multivariate Behavioral Research, 39( 1), 99-128. doi: 10.1207/s15327906mbr3901_4URL |
| [21] | Marsh H. W., Hau K. T., &Wen Z. L . ( 2004). In search of golden rules: Comment on hypothesis-testing approaches to setting cutoff values for fit indexes and dangers in overgeneralizing Hu and Bentler's (1999) findings. Structural Equation Modeling: A Multidisciplinary Journal, 11( 3), 320-341. doi: 10.1207/s15328007sem1103_2URL |
| [22] | Muthén L.K., &Muthén B.O . ( 2012). Mplus user’s guide (7 th ed.). Los Angeles, CA: Muthén & Muthén. |
| [23] | Reise S. P., Scheines R., Widaman K. F., &Haviland M. G . ( 2013). Multidimensionality and structural coefficient bias in structural equation modeling: A bifactor perspective. Educational and Psychological Measurement, 73( 1), 5-26. doi: 10.1177/0013164412449831URL |
| [24] | Salerno L., Ingoglia S., &Coco G. L . ( 2017). Competing factor structures of the Rosenberg Self-Esteem Scale (RSES) and its measurement invariance across clinical and non-clinical samples. Personality and Individual Differences, 113, 13-19. doi: 10.1016/j.paid.2017.02.063URL |
| [25] | Schmid J., &Leiman J.M . ( 1957). The development of hierarchical factor solutions. Psychometrika, 22( 1), 53-61. doi: 10.1007/BF02289209URL |
| [26] | Wang M. T., Fredricks J. A., Ye F., Hofkens T. L., &Linn J. S . ( 2016). The math and science engagement scales: Scale development, validation, and psychometric properties. Learning and Instruction, 43, 16-26. doi: 10.1016/j.learninstruc.2016.01.008URL |
| [27] | Wen Z., Hau K.T., &Marsh H.W . ( 2004). Structural equation model testing: Cutoff criteria for goodness of fit indices and chi-square test. Acta Psychologica Sinica, 36( 2), 186-194. |
| [ 温忠麟, 侯杰泰, 马什赫伯特 . ( 2004). 结构方程模型检验:拟合指数与卡方准则. 心理学报, 36( 2), 186-194.] | |
| [28] | Wu Y., Wen Z., Marsh H. W., &Hau K-T ., ( 2013). A comparison of strategies for forming product indicators for unequal numbers of items in structural equation models of latent interactions. Structural Equation Modeling: A Multidisciplinary Journal, 20( 4), 551-567. doi: 10.1080/10705511.2013.824772URL |
| [29] | Xu S. X., Yu Z. H., &Li Y. M . ( 2017). Simulated data comparison of the predictive validity between bi-factor and high-order models. Acta Psychologica Sinica, 49( 8), 1125-1136. |
| [ 徐霜雪, 俞宗火, 李月梅 . ( 2017). 预测视角下双因子模型与高阶模型的模拟比较. 心理学报, 49( 8), 1125-1136.] doi: 10.3724/SP.J.1041.2017.01125URL | |
| [30] | Ye B., &Wen Z . ( 2012) Estimating homogeneity coefficient and its confidence interval. Acta Psychologica Sinica, 44( 12), 1687-1694. |
| [ 叶宝娟, 温忠麟 .( 2012). 测验同质性系数及其区间估计. 心理学报, 44( 12), 1687-1694.] doi: 10.3724/SP.J.1041.2012.01687URL | |
| [31] | Yung Y-F., Thissen D., &Mcleod L. D . ( 1999). On the relationship between the higher-order factor model and the hierarchical factor model. Psychometrika, 64( 2), 113-128. doi: 10.1007/BF02294531URL |
相关文章 2
| [1] | 刘玥, 刘红云. 基于双因子模型的测验总分和 维度分的合成方法[J]. 心理学报, 2017, 49(9): 1234-1246. |
| [2] | 徐霜雪, 俞宗火, 李月梅. 预测视角下双因子模型与高阶模型的模拟比较[J]. 心理学报, 2017, 49(8): 1125-1136. |
PDF全文下载地址:
http://journal.psych.ac.cn/xlxb/CN/article/downloadArticleFile.do?attachType=PDF&id=4409
