全文HTML
--> --> -->谐波雷达[5]是基于频率变换实现目标探测的另一种体制. 通过发射单频或双频信号, 利用目标的反射特性产生谐波, 从而提高探测性能. 谐波雷达存在最大谐波与主波功率之比太小, 且受到金属结尺寸、材料等因素的影响的问题[6,7]. 本文提出用阵列天线产生近光速远离运动雷达多普勒信号, 实现信号频率大幅降低的方法, 并通过对发射信号波形、阵列参数选择的设计, 保证了合成信号的性能.
2.1.多普勒效应
当信号源与目标之间存在相对运动时, 目标区的接收信号频率与发射信号频率不同, 这种现象被称为多普勒效应, 接收信号与发射信号的频率差为多普勒频率.文献[8-12]推导了电磁波多普勒效应的原理. 以运动雷达为信号源, 接收装置放置于目标区. 记雷达发射信号的频率为


 图 1 雷达运动示意图
Figure1. Schematic diagram of the radar’s movement
当雷达与目标相背运动时, 接收信号的脉宽为
如图2所示,若雷达与目标的初始距离为1 km, 发射载频1 GHz脉宽为0.5 μs的信号, 同时以速度

 图 2 多普勒效应中的发射/接收信号波形与频谱 (a) 发射信号波形; (b) 接收信号波形; (c) 发射信号与接收信号频谱
Figure2. The emission/received signal waveform and spectrum of doppler effect: (a) The emission signal waveform; (b) the received signal waveform; (c) spectrum of the emission/received signal.
2
2.2.阵列结构合成低频信号原理
根据对电磁波多普勒效应的理解, 将运动雷达发射信号的过程在时间维分解, 让阵列中各辐射单元顺序发射脉冲信号, 利用阵列等效产生高速运动的雷达信号.对于运动雷达及其发射信号的讨论将基于两个坐标系, 其一是以雷达为原点的运动坐标系S', 其二是以雷达运动初始时间、位置为原点的空时坐标系S. S' 系的X' 轴、Y' 轴和Z' 轴均为空间坐标轴, S系的X轴为空间坐标轴, T轴为时间轴. 在初始时刻

图3为在S系中对运动雷达发射信号过程的分解. 在

 图 3 空时坐标系中对运动雷达发射信号过程分解的示意图
Figure3. Schematic diagram of decomposition of moving radar in space-time coordinate system.
设雷达发射信号在运动坐标系中的脉宽为


由此将连续的雷达运动过程离散化, 并得到对应阵列天线结构中的辐射单元位置与发射信号的时序.
如图4所示, 在S系中, 将阵列天线结构中辐射单元以间距d从原点开始沿X轴负方向排布, 并分别编号为


 图 4 阵列天线结构等效运动雷达的示意图
Figure4. Schematic diagram of the array antenna structure equivalent to the moving radar.
3.1.目标在阵列方向时
33.1.1.辐射单元信号与目标区的合成信号
图5为目标在阵列方向时的阵列天线结构, 辐射单元


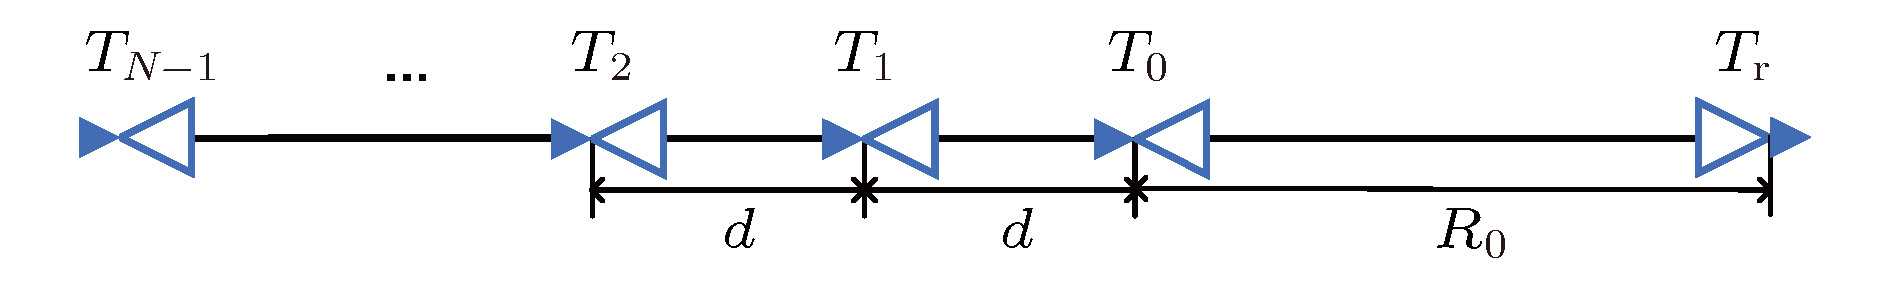 图 5 目标在阵列方向时的阵列天线结构
Figure5. Array antenna structure when the target being in the array direction.
根据S' 系中雷达处发射信号的相位变化与雷达运动距离的关系, 设计辐射单元的发射信号, 并根据其与目标之间的距离, 推导目标区合成信号的表达式.
对于信号的讨论基于快时间和慢时间角度. 记各辐射单元所发射的脉冲内时间为快时间


辐射单元


3
3.1.2.阵列长度与辐射单元信号脉宽展宽量
以上为对各辐射单元的发射信号与目标区合成信号的设计, 接下来对信号和阵列结构的具体参数进行讨论. 以下讨论的前提条件为辐射单元发射信号载波频率


对于阵列长度的设置, 由于各辐射单元信号脉宽固定, 因此需要通过阵列结构实现多普勒效应中的脉宽展宽. 合成信号的脉宽


若设雷达发射信号脉宽为

3
3.1.3.辐射单元信号脉宽与相位调制
阵列长度由雷达发射信号脉宽的展宽量和辐射单元发射信号脉宽共同决定.若各辐射单元的信号首尾相接, 即辐射单元发射信号的脉宽

若设置阵列导致的辐射单元信号脉宽展宽量为0.833 μs, 则雷达发射信号脉宽0.33 μs, 辐射单元信号脉宽1.2 ns, 合成信号脉宽0.834 μs, 阵长105 m, 辐射单元总数700, 仿真此时目标区的合成信号.
由图6可发现, 当辐射单元信号首尾相接时, 合成信号中谐波的影响明显.
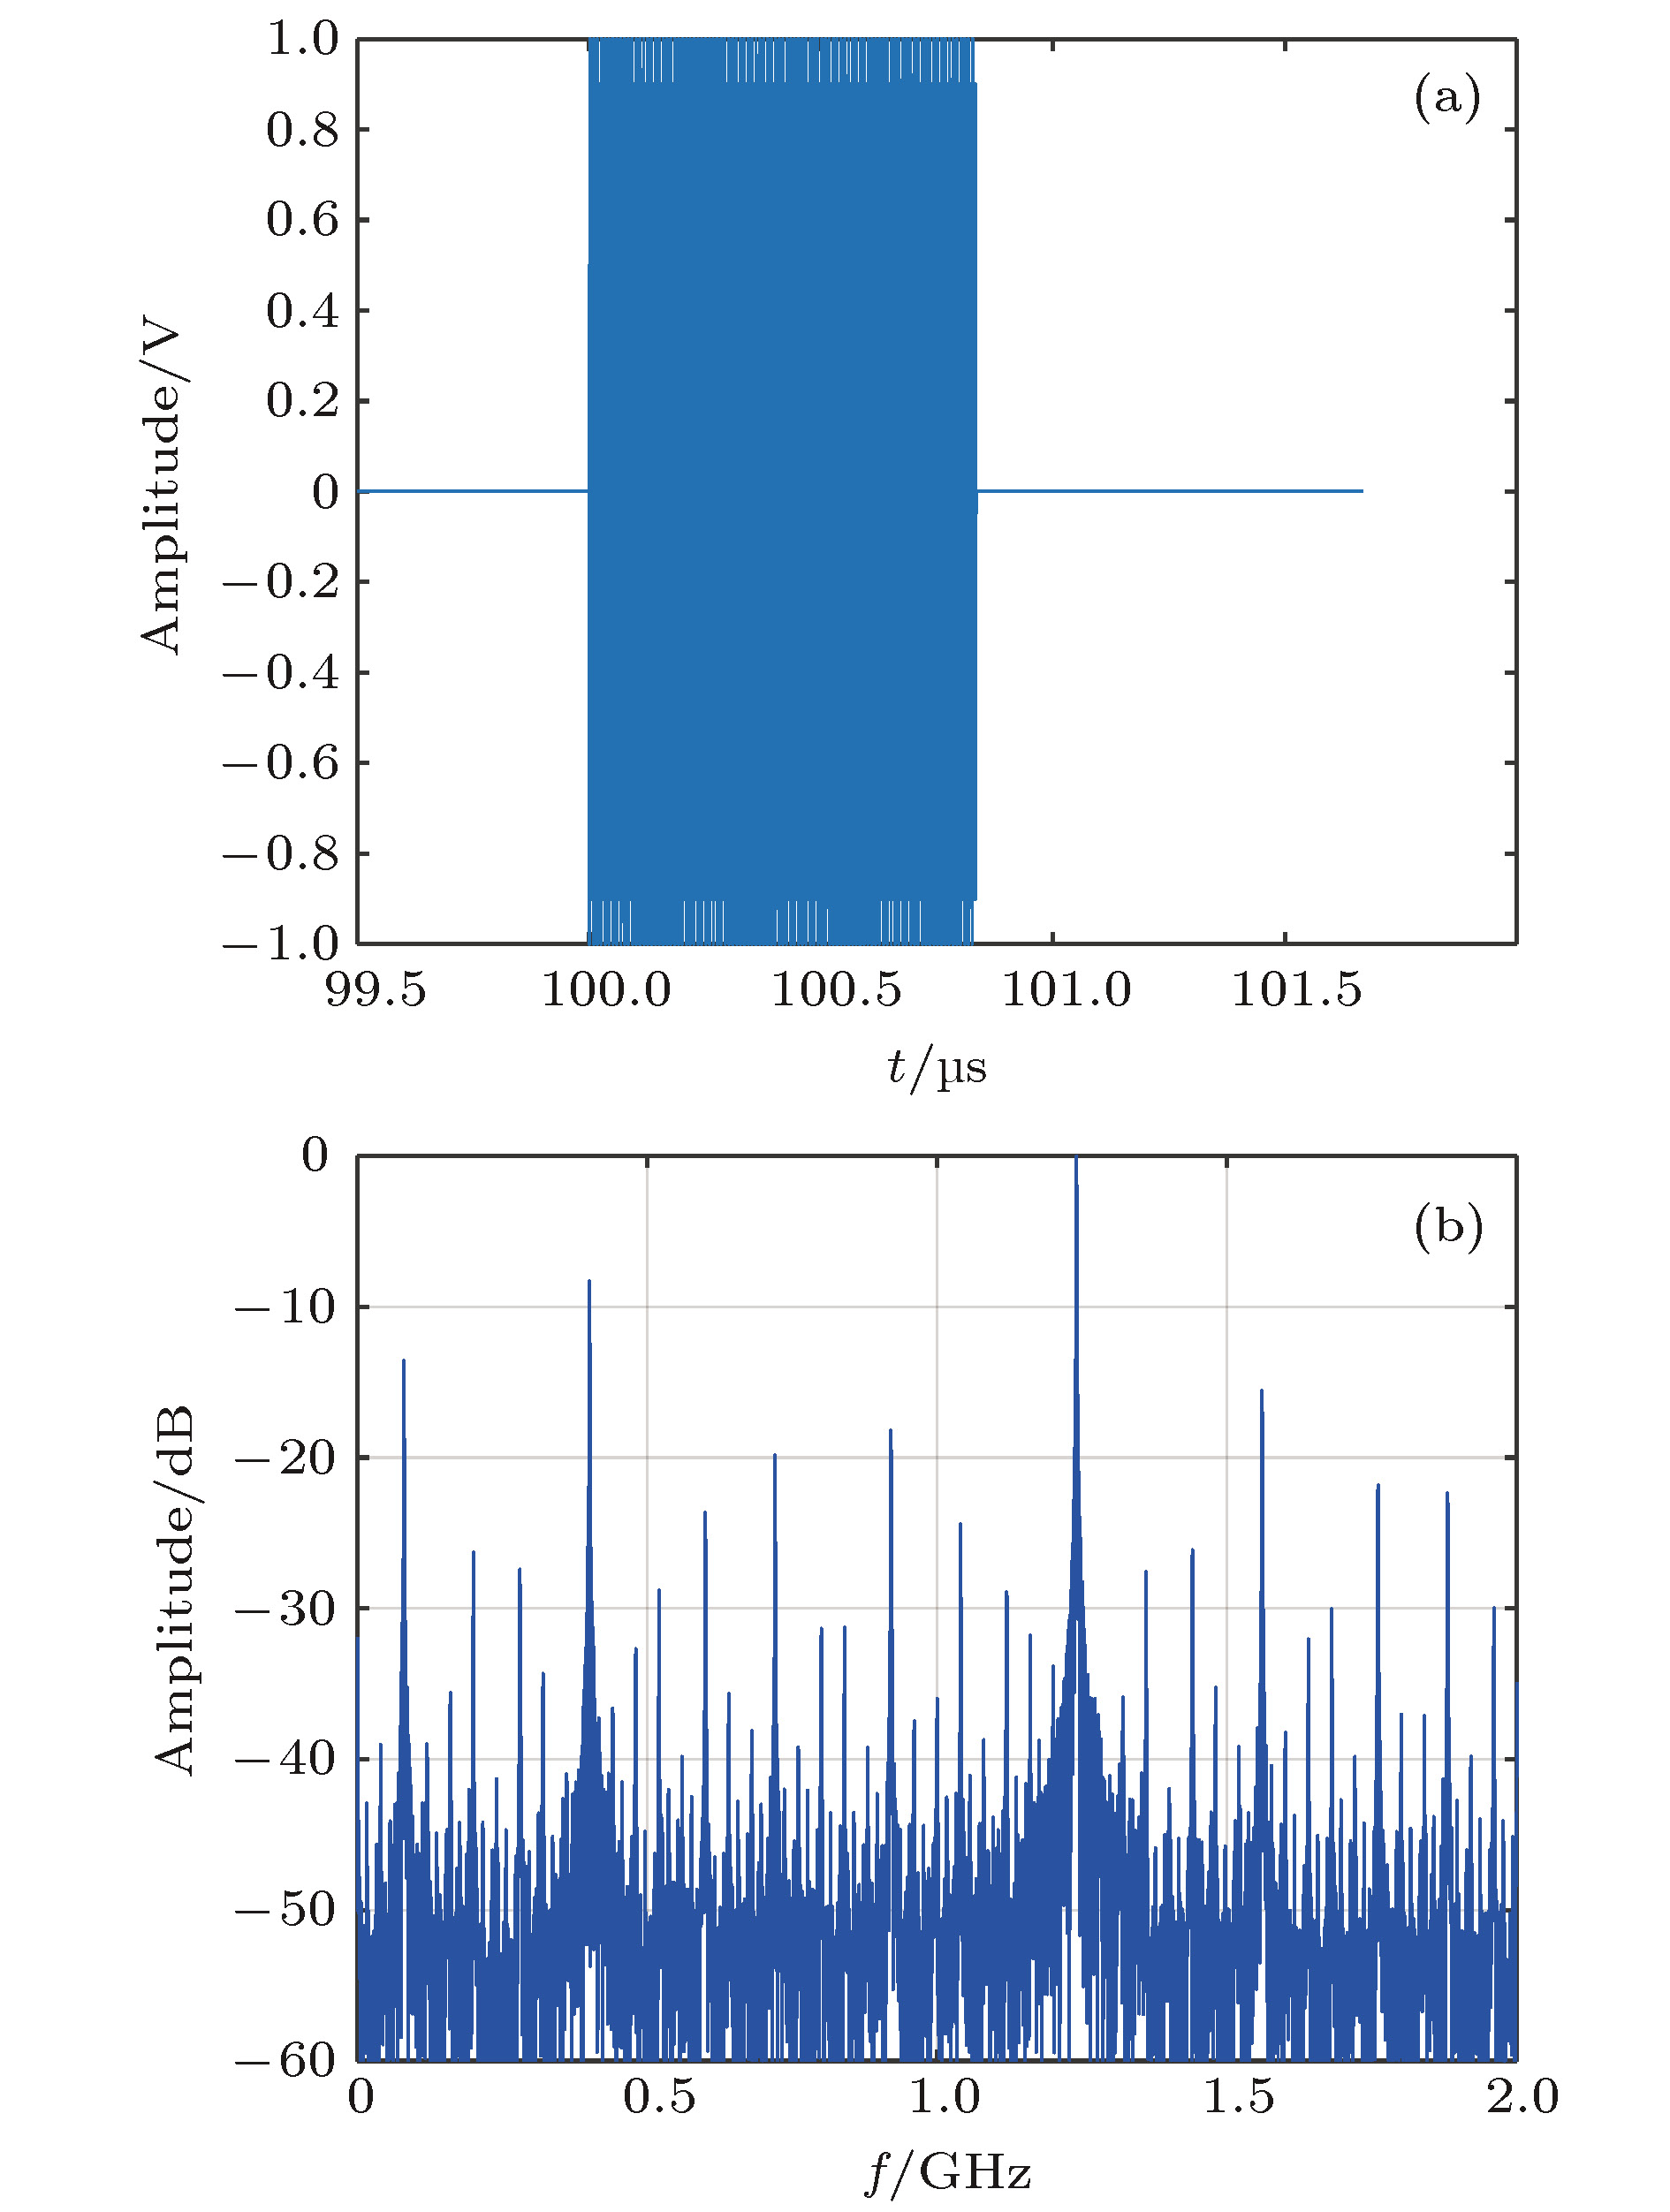 图 6 辐射单元信号首尾相接时合成信号的波形与频谱 (a) 合成信号波形; (b)合成信号频谱
Figure6. Waveform and spectrum of the composite signal when signals of radiating elements being connected end to end: (a) Waveform of the composite signal; (b) spectrum of the composite signal.
辐射单元信号首尾相接时在目标区合成的信号等效于对1 GHz信号以时间间隔

为使得阵列结构与电磁波多普勒效应相对应, 令辐射单元信号脉宽等于雷达信号在S系中的对应脉宽, 即:

对辐射单元发射信号进行相位调制时, 设相位调制频率为


相位调制频率必须保证相位步进经


设置雷达发射信号脉宽的展宽量为0.833 μs, 则合成信号脉宽为1.67 μs. 若辐射单元信号脉宽满足(14)式, 则可得阵长为105 m, 辐射单元发射信号脉宽0.833 μs. 设置辐射单元发射信号相位调制频率81 MHz, 则相位步进

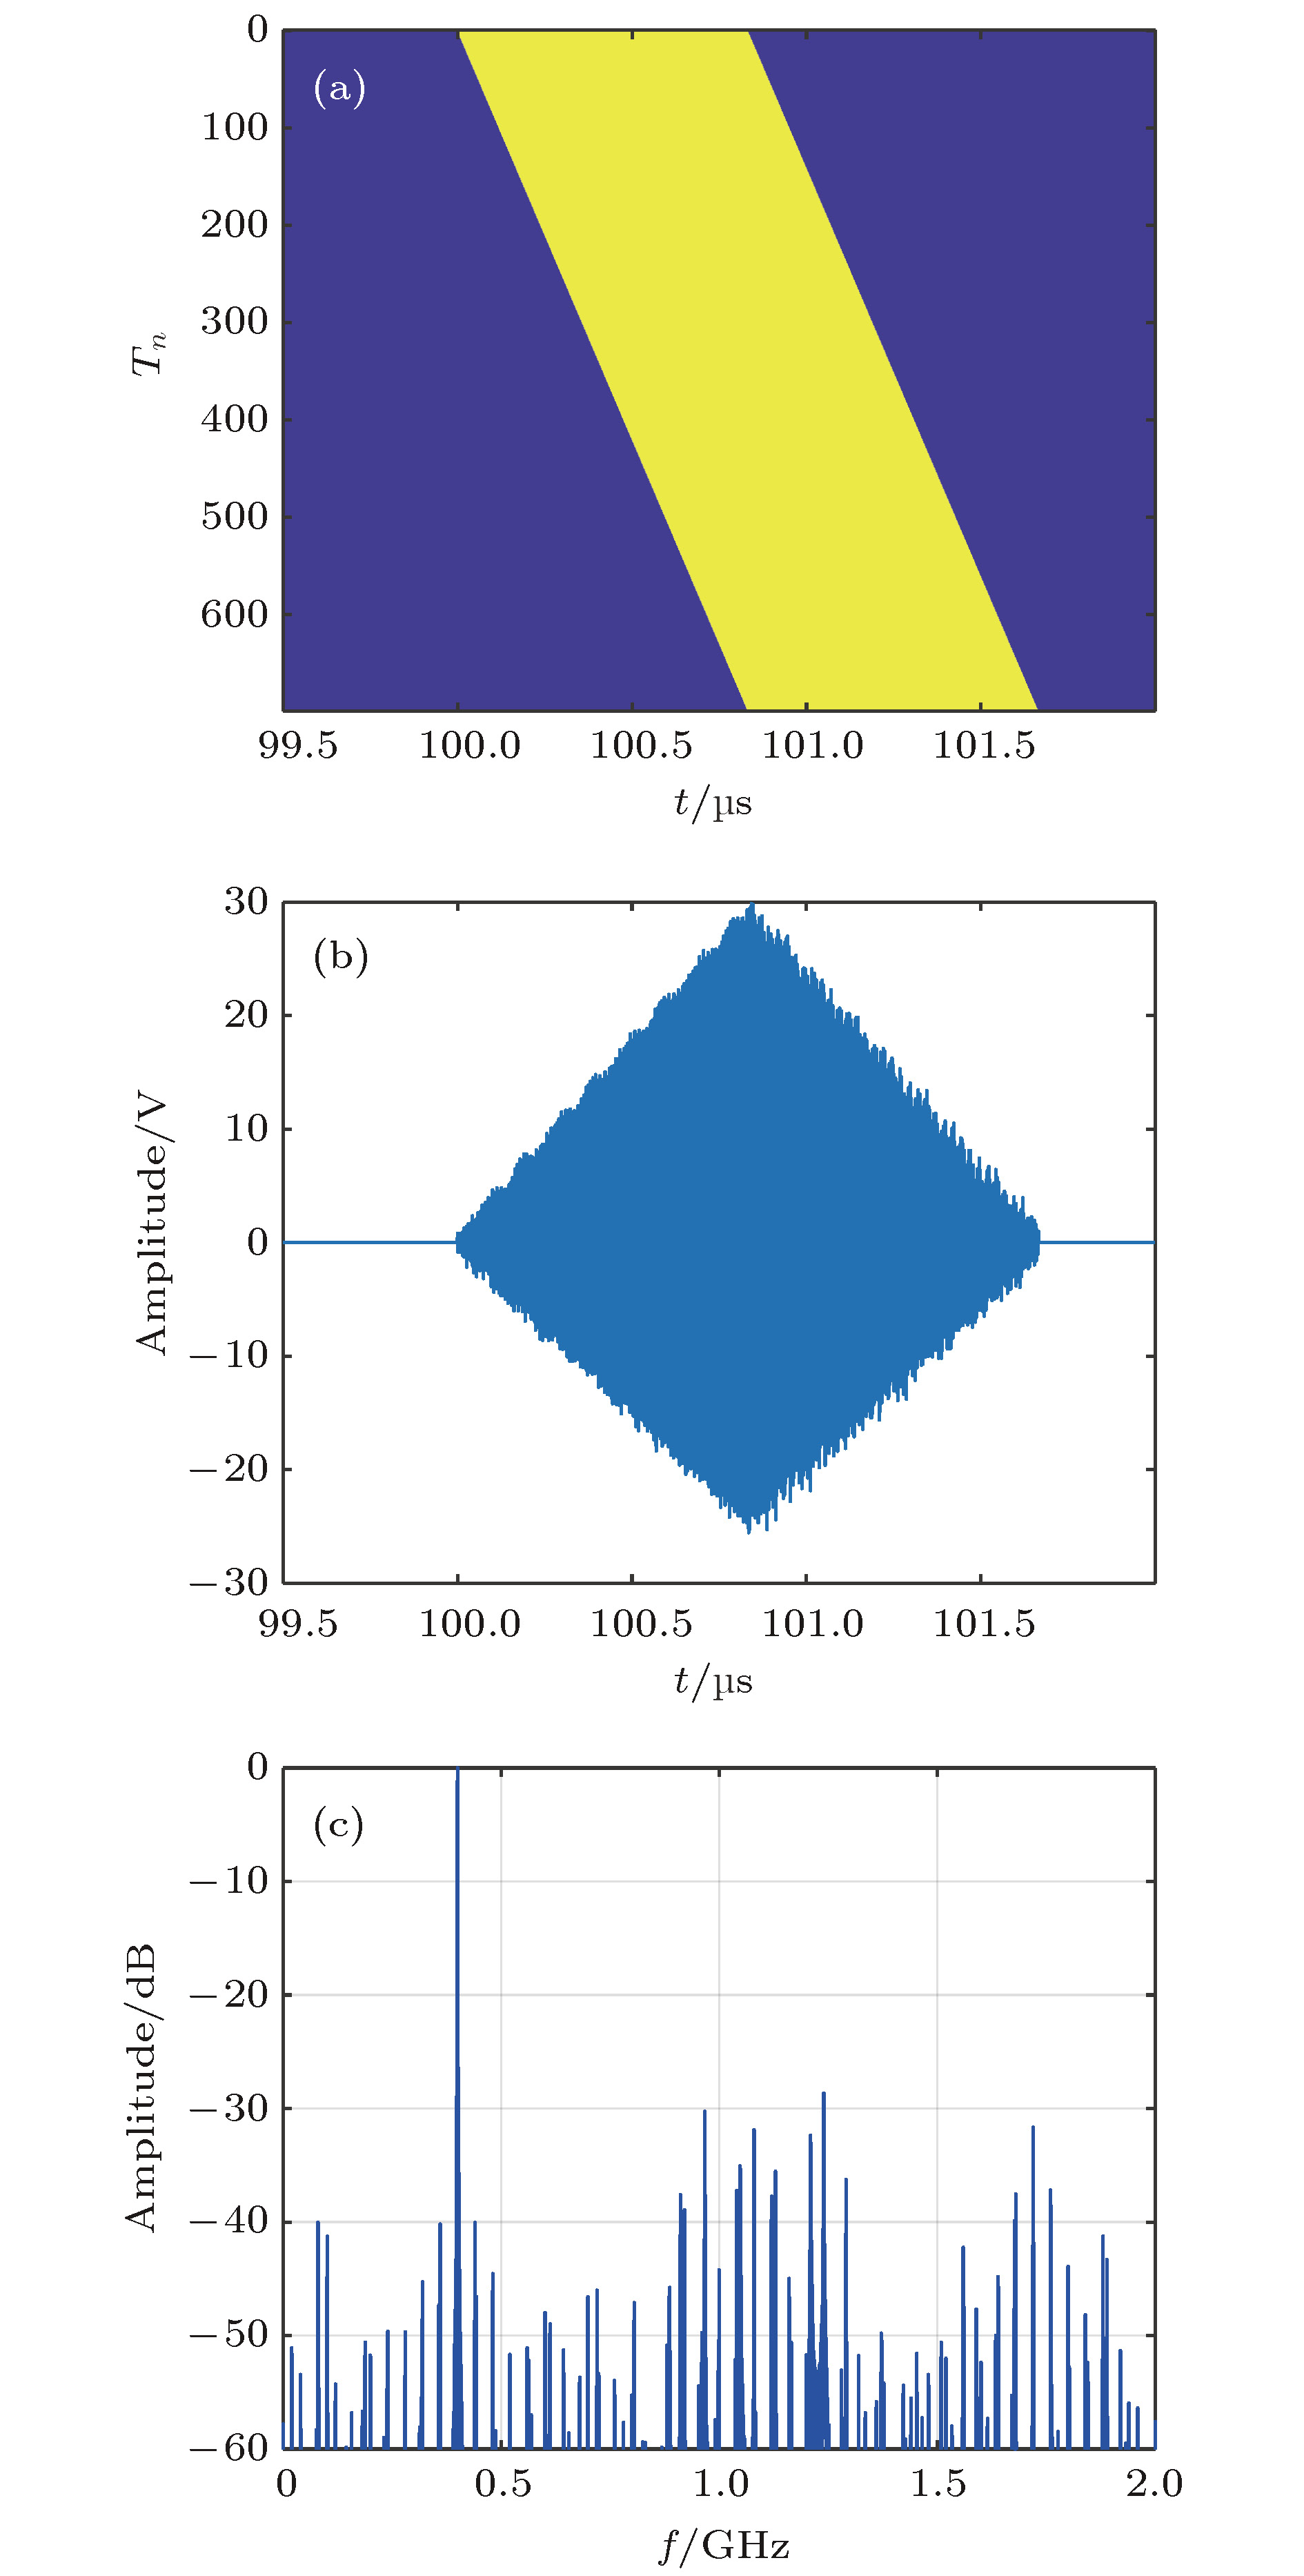 图 7 辐射单元发射信号相位调制频率81 MHz时合成信号的包络移动情况、波形与频谱 (a) 合成信号的包络移动情况; (b) 合成信号的波形; (c) 合成信号的频谱
Figure7. Envelope movement, waveform and spectrum of the composite signal when the phase modulation frequency of the radiating element signal being 81 MHz: (a) Envelope movement of the composite signal; (b) waveform of the composite signal; (c) spectrum of the composite signal.
当辐射单元脉宽为0.833 μs时, 从目标的角度描述各辐射单元信号的包络通过目标位置的时间, 可等效雷达信号包络的移动, 这与雷达成像[16]中的距离徙动信号类似.
本文采用文献[17]中的峰值旁瓣比和积分旁瓣比来评价合成信号的质量. 当辐射单元信号相位调制频率为81 MHz时, 合成信号频谱峰值旁瓣比为–28.65 dB, 积分旁瓣比为–19.26 dB.
高的相位调制频率可增加辐射单元发射信号脉冲内相位调制的次数, 抑制载波能量, 增大低频信号, 使得合成信号更接近所需的低频信号. 但是在实际条件下, 辐射单元发射信号带宽一般小于载波频率的10%, 即载波频率1 GHz时, 辐射单元能够工作的频率范围为

图8给出了相位调制频率为81和39 MHz时辐射单元发射信号的频谱, 显然当相位调制频率取81 MHz的情况下, 发射信号频谱散布的范围较大, 其有效信号能量辐射会受到限制.
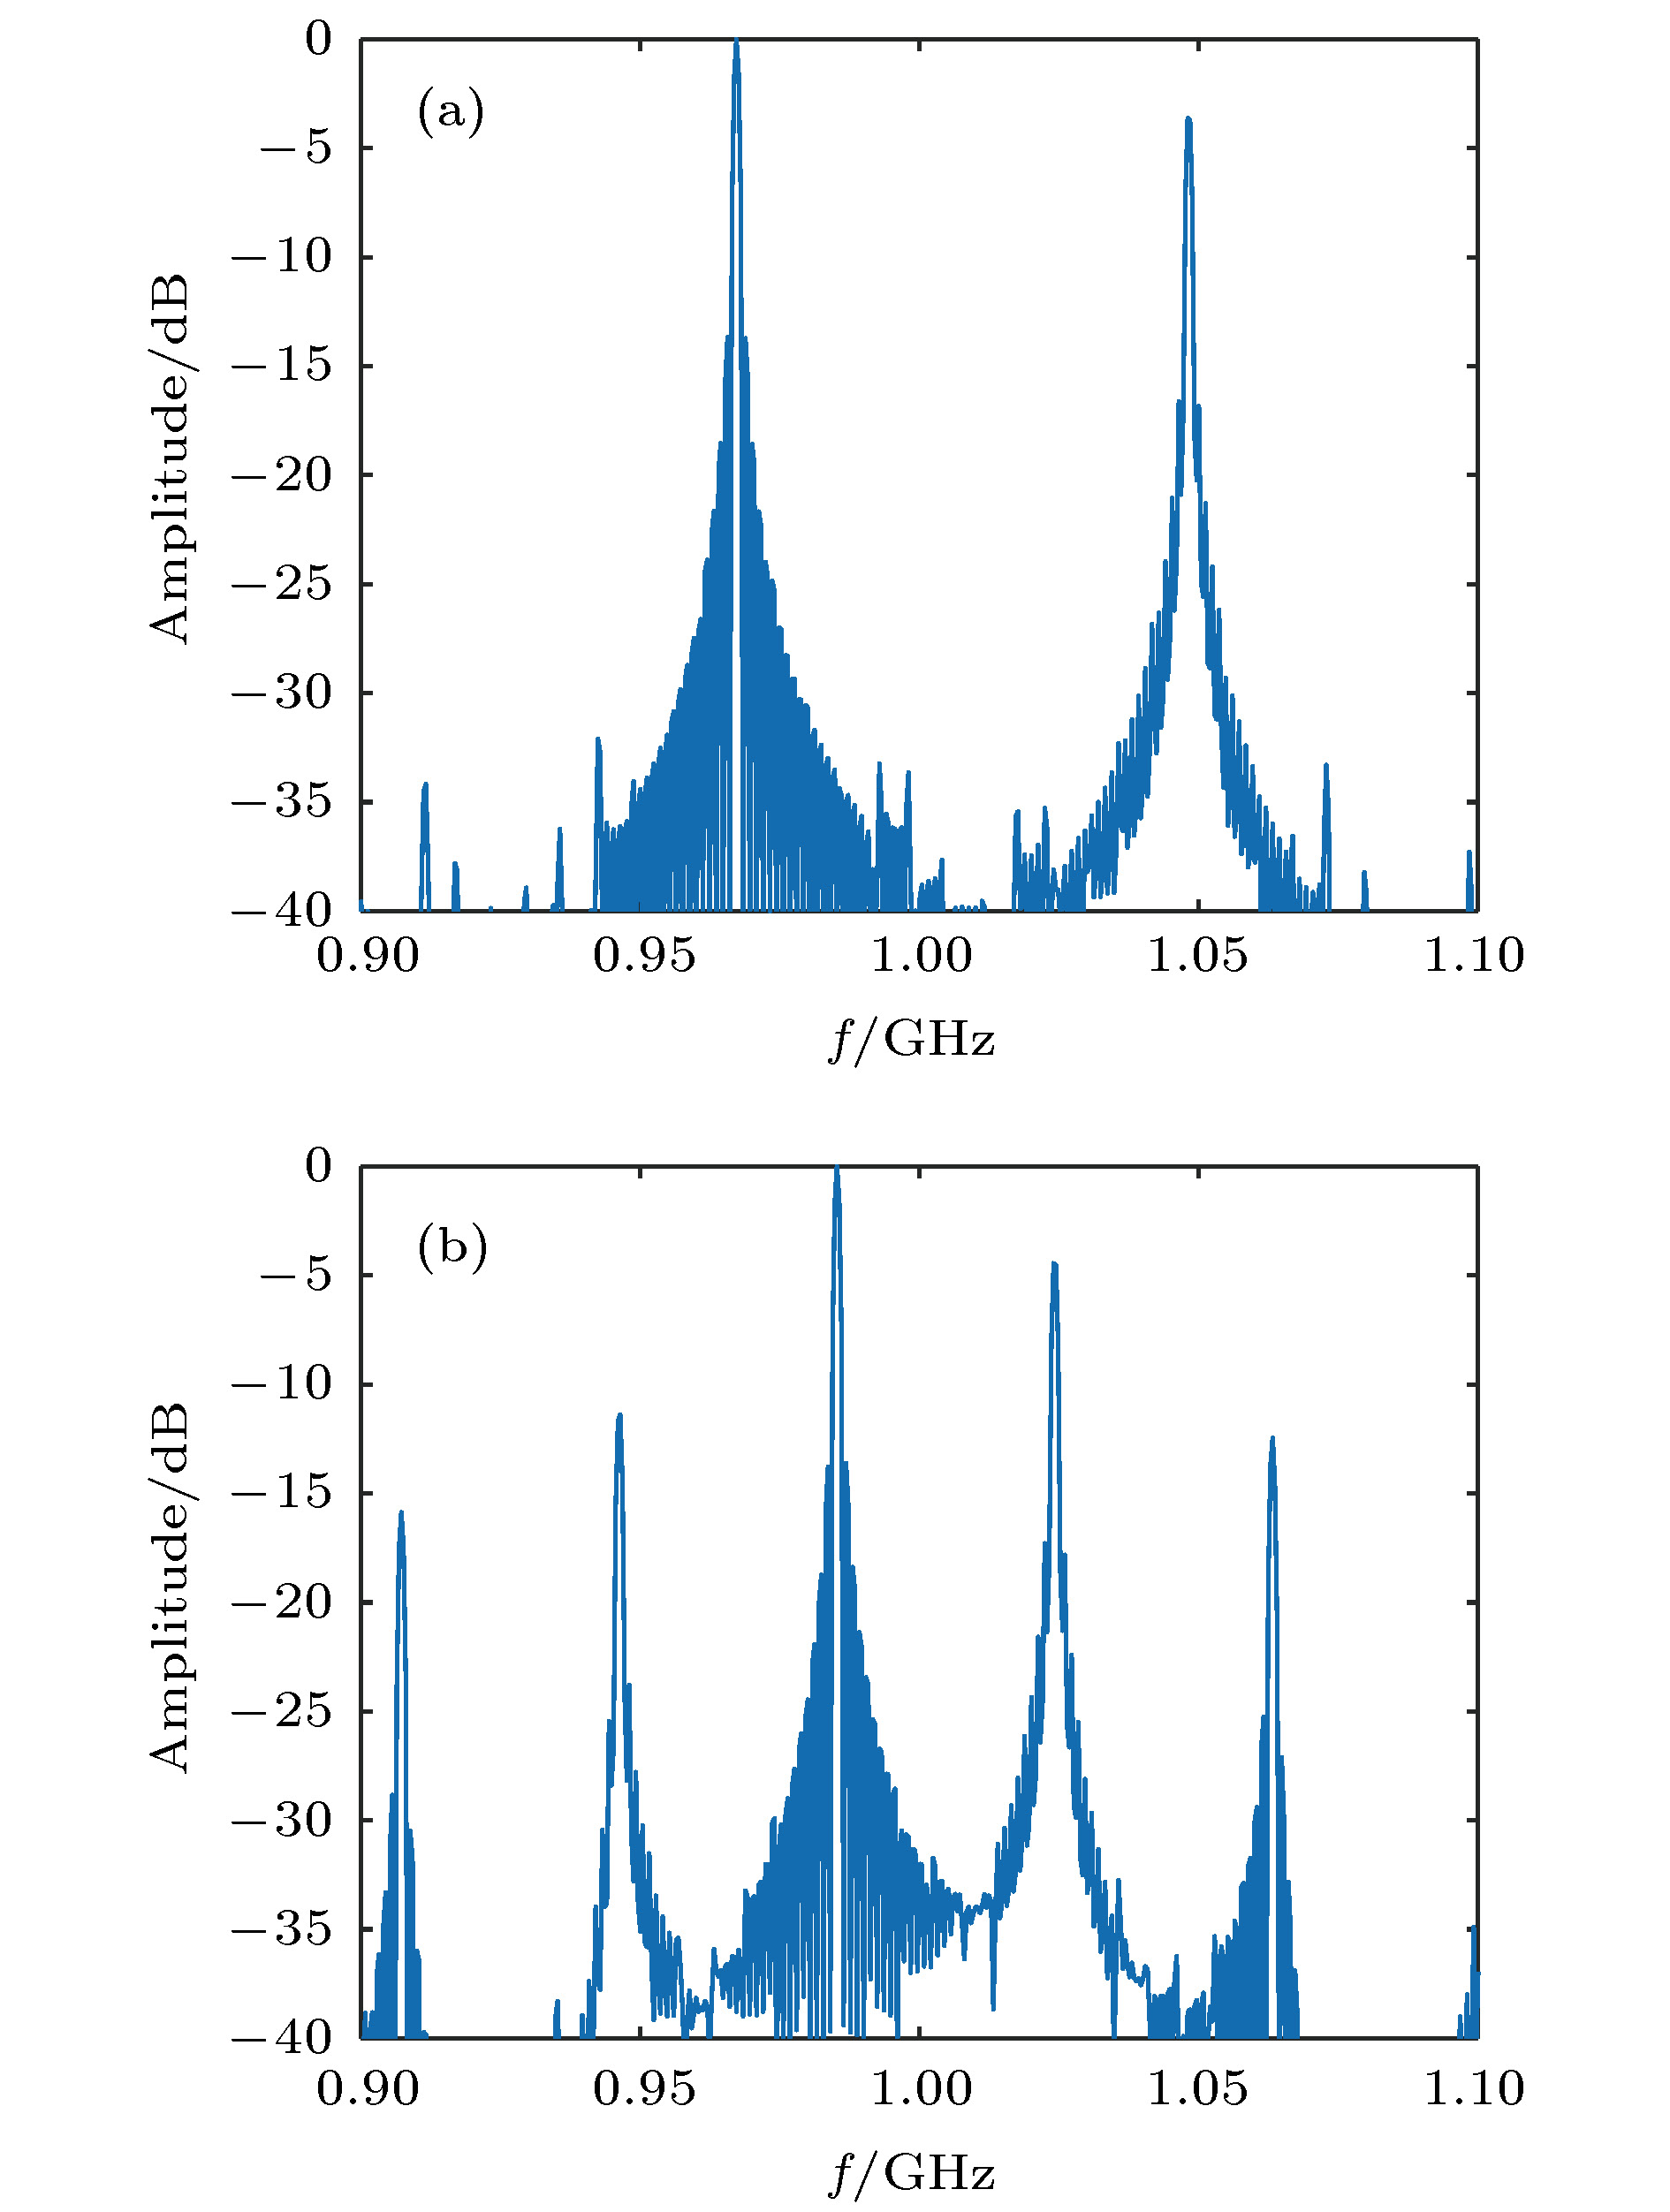 图 8 相位调制频率为81 MHz和39 MHz时辐射单元信号的频谱 (a) 相位调制频率为81 MHz时辐射单元信号的频谱; (b) 相位调制频率为39 MHz时辐射单元信号的频谱
Figure8. Spectrums of the radiating element signal when the phase modulation frequency being 81 MHz and 39 MHz: (a) Spectrum of the radiating element signal when the phase modulation frequency being 81 MHz; (b) spectrums of the radiating element signal when the phase modulation frequency being 39 MHz
为减小带宽限制对辐射单元发射信号的影响, 保持阵列结构与信号其他参数不变, 将相位调制频率降低至39 MHz, 则相位步进


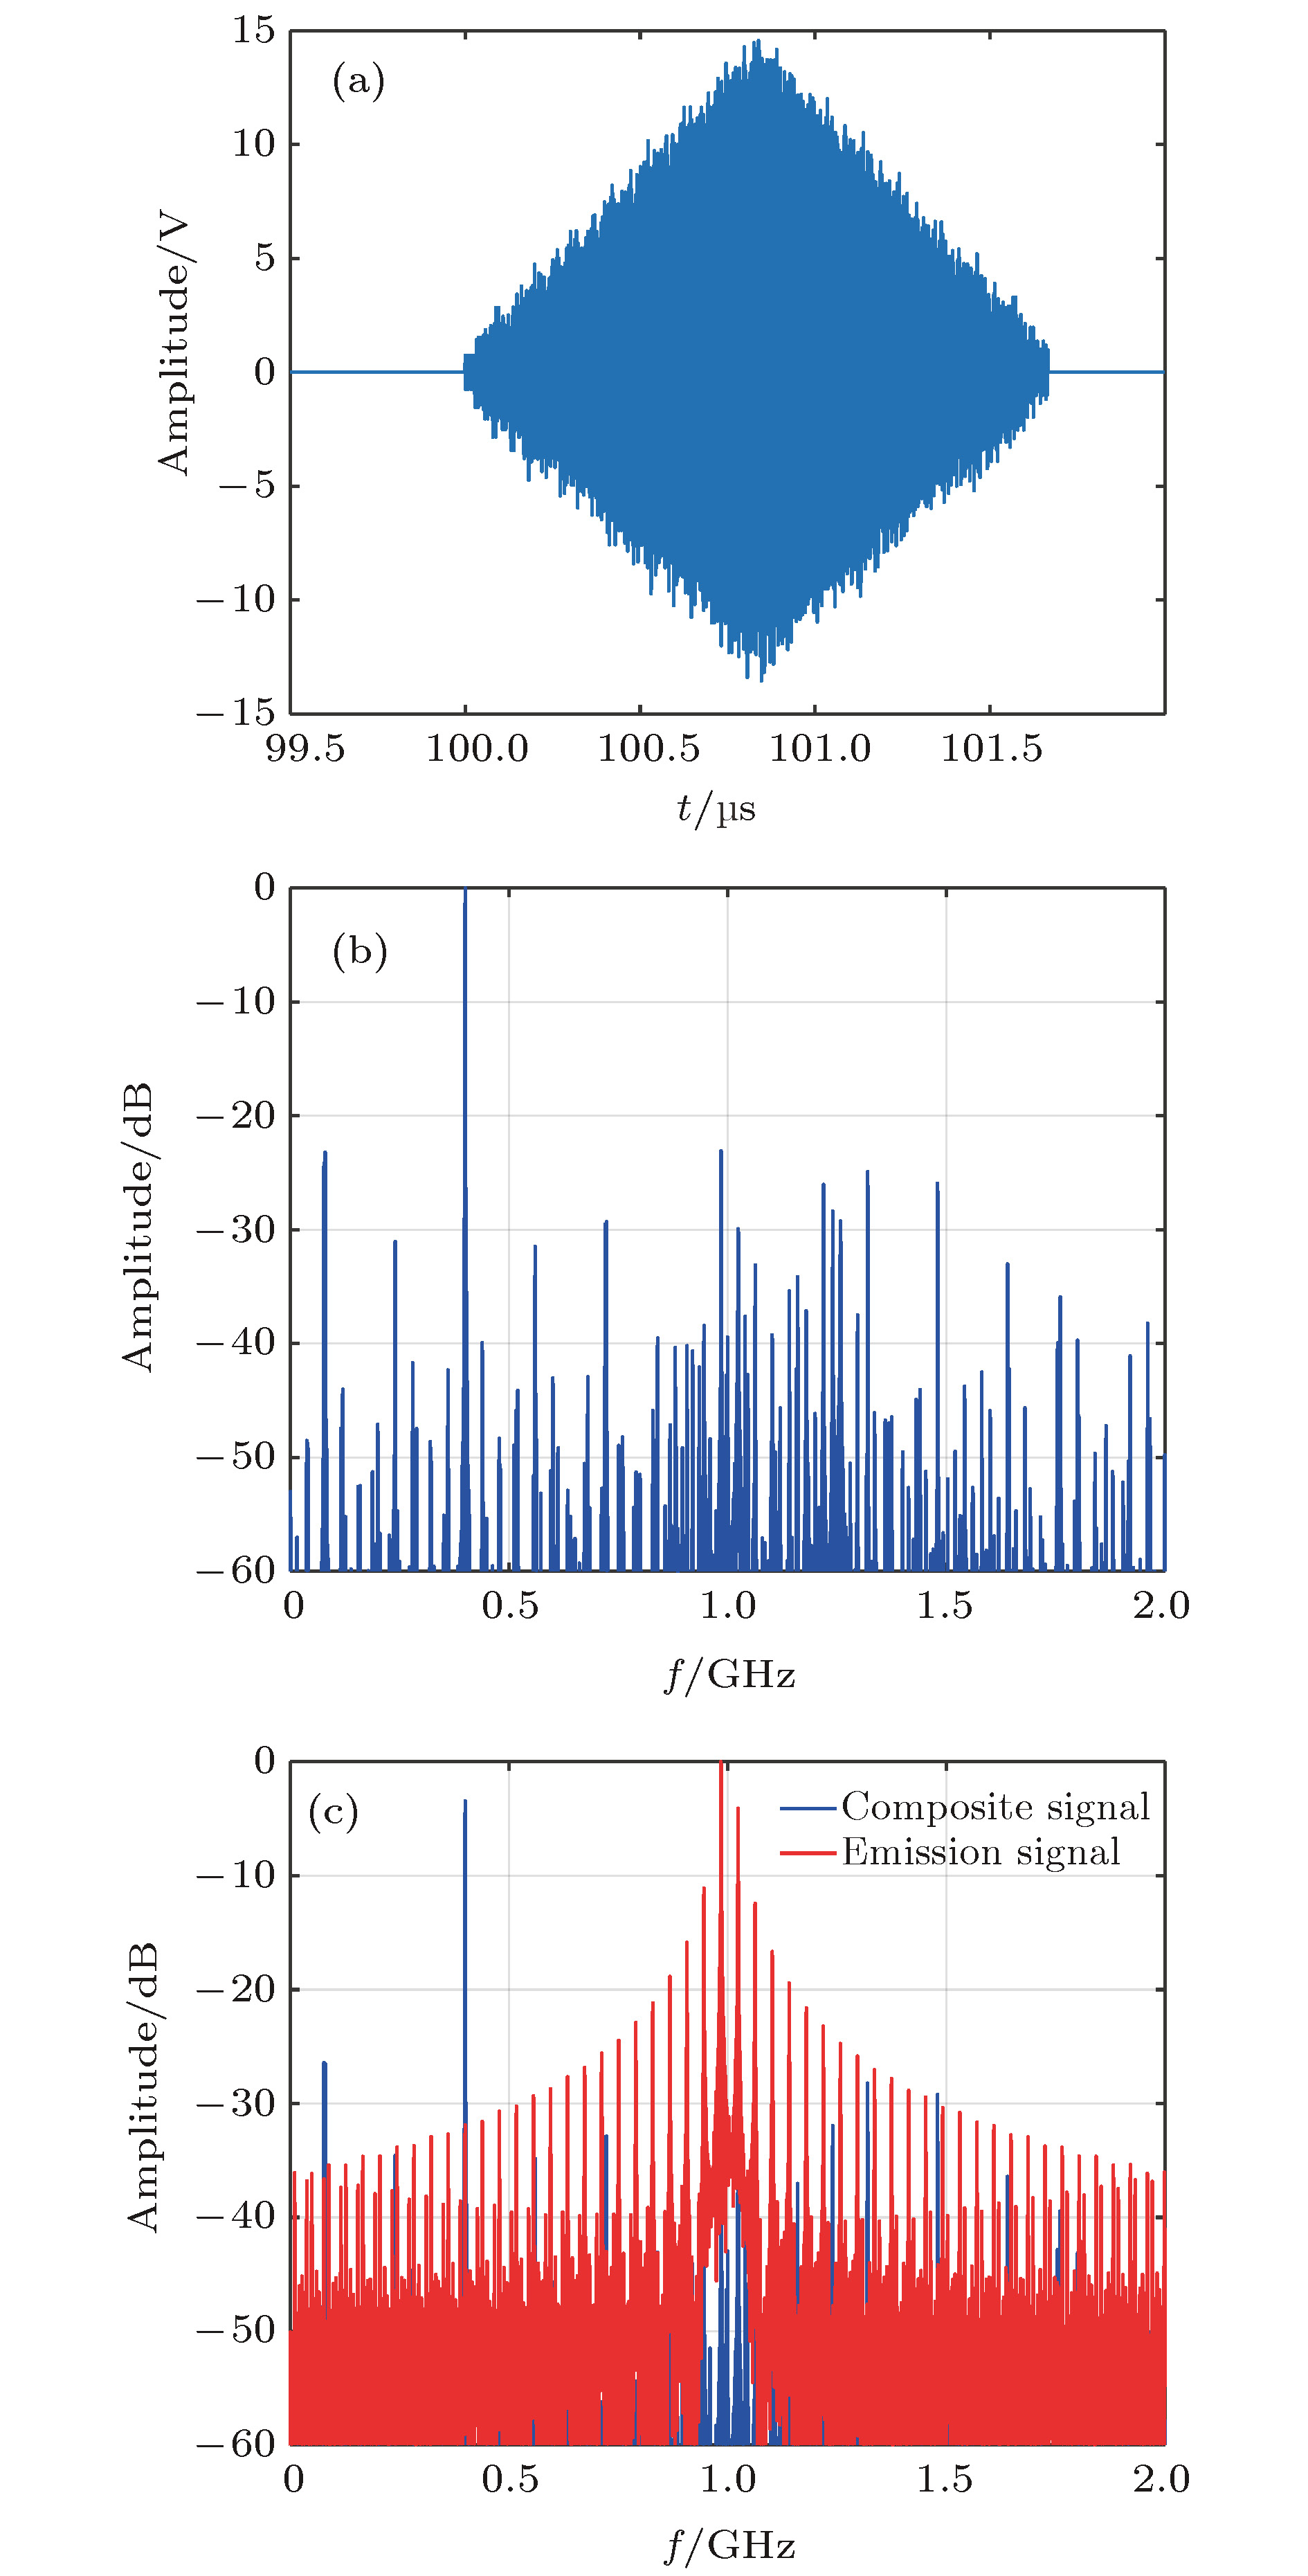 图 9 辐射单元发射信号相位调制频率39 MHz时合成信号的波形、频谱以及阵列发射信号与合成信号的频谱对比图 (a) 合成信号的波形; (b) 合成信号的频谱; (c) 阵列发射信号与合成信号的频谱对比
Figure9. Waveform, spectrum of the composite signal and the spectrum comparison between the signal transmitted by the array and the composite signal when the phase modulation frequency of radiating element signals being 39 MHz: (a) Waveform of the composite signal; (b) spectrum of the composite signal; (c) spectrum comparison between the signal transmitted by the array and the composite signal.
2
3.2.目标在45°扫描角时
在实际应用中, 目标一般不会位于阵列方向, 所以为了符合实际需要, 设计波束扫描角[18]为45°的阵列结构天线.图10为波束扫描角为45°时的阵列天线结构. 在空间坐标系中, 辐射单元以间距d从原点开始沿X轴负方向排布, 目标与阵列近端之间的距离为


 图 10 波束扫描角为45°时的阵列结构
Figure10. Array structure when the beam scanning angle being 45°.
根据多普勒频率和辐射单元斜距确定发射信号的相位.
辐射单元


波束扫描角为45°时, 辐射单元信号的相位调制与3.1节中一致.
根据表1所示参数仿真目标区的合成信号, 结果如图11所示,则合成信号频谱的峰值旁瓣比为–24.28 dB, 积分旁瓣比为–14.93 dB, 低频分量在合成信号中的能量占比为96.88%. 频谱对比图中合成信号低频分量为–3.754 dB(64.91%).
| 参数 | 数据 | 参数 | 数据 |
| 阵列长度 | 105 m | 目标与阵列距离 | 30 km |
| 辐射单元信号脉宽 | 0.73 μs | 合成信号脉宽 | 1.46 μs |
| 辐射单元信号频率 | 1 GHz | 合成信号频率 | 400 MHz |
| 辐射单元间距 | 0.15 m | 辐射单元总数 | 700 |
| 相位调制频率 | 39 MHz | 相位步进 | $ - \dfrac{{10}}{{13}}{\text{π}}$ |
表1波束扫描45°时合成信号的仿真参数
Table1.Simulation parameters of the composite signal when beam scanning angle being 45°
 图 11 波束扫描角为45°时合成信号的波形、频谱以及阵列发射信号与合成信号的频谱对比图 (a) 合成信号波形; (b) 合成信号频谱; (c) 阵列发射信号与合成信号的频谱对比
Figure11. Waveform and spectrum of the composite signal and the spectrum comparison between the signal transmitted by the array and the composite signal when the beam scanning angle being 45°: (a) Waveform of the composite signal; (b) spectrum of the composite signal; (c) spectrum comparison between the signal transmitted by the array and the composite signal
4.1.辐射单元间距误差和相位误差
在实际应用的情况下, 分析辐射单元间距误差和相位误差[19]的影响是必要的. 若辐射单元间距误差(单位: m)服从正态分布

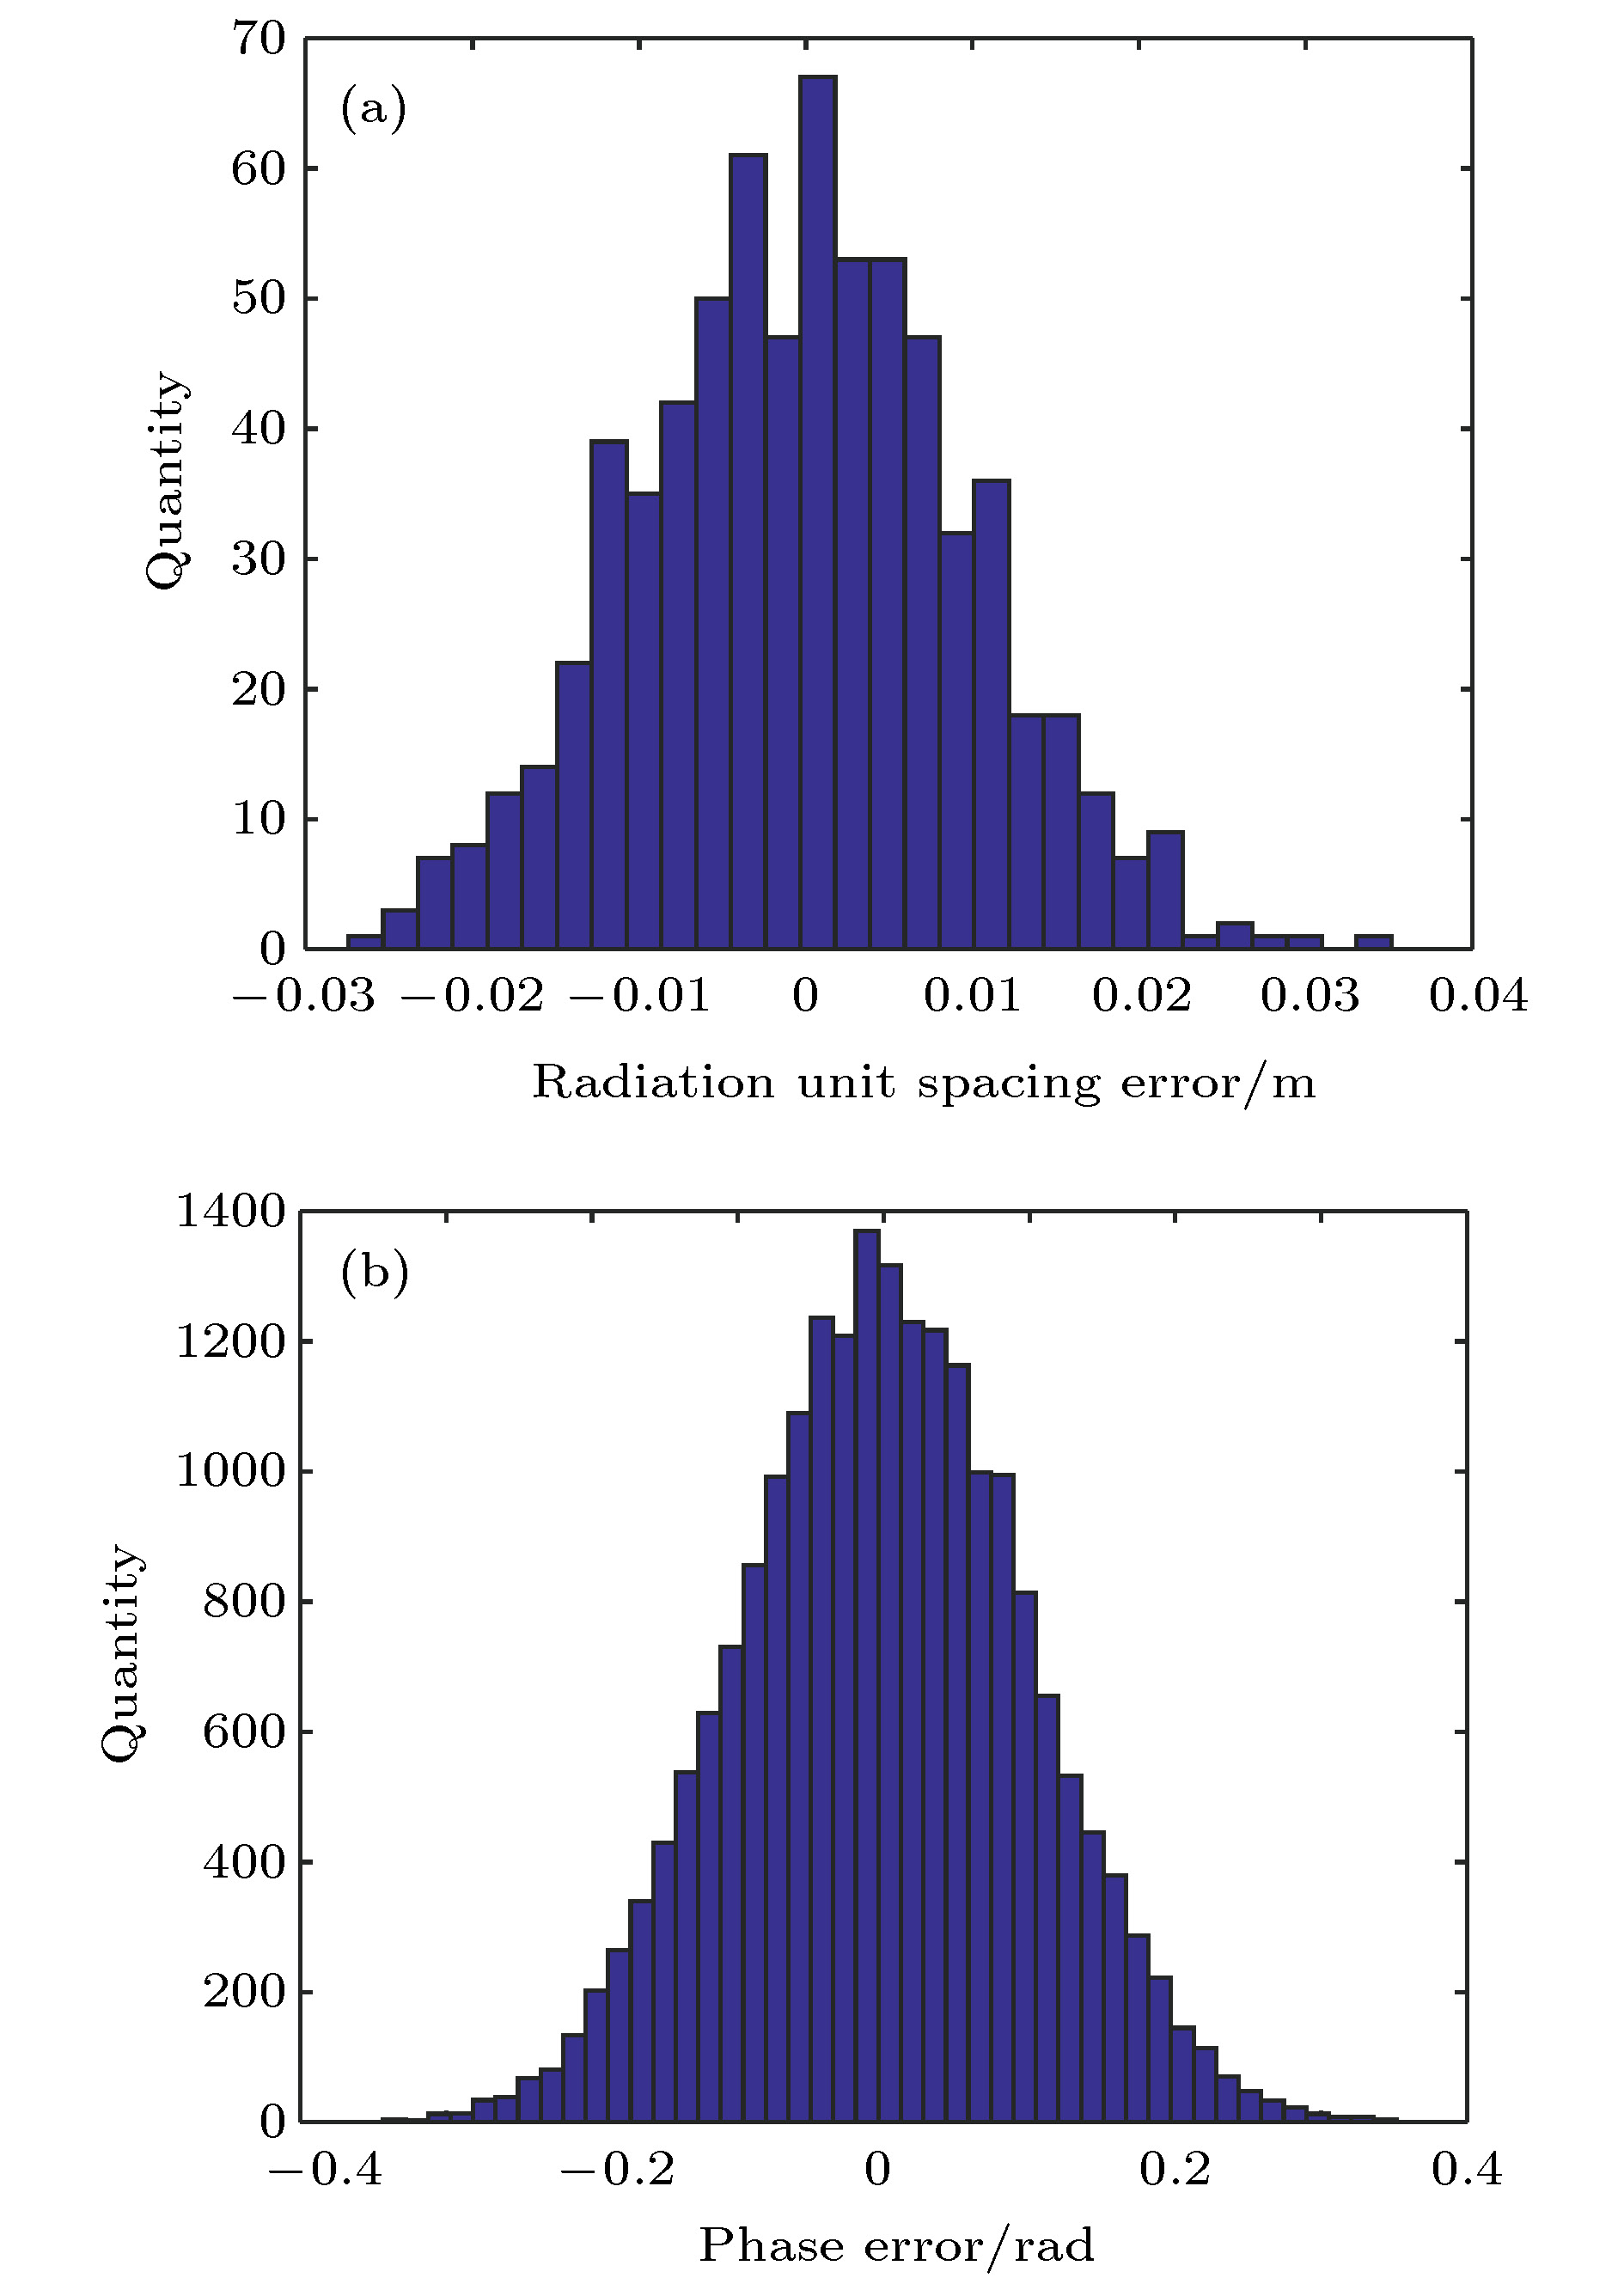 图 12 辐射单元间距误差和相位误差的分布直方图 (a)辐射单元间距误差的分布直方图; (b) 相位误差的分布直方图
Figure12. Distribution histogram of radiating element spacing error and phase error: (a) Distribution histogram of radiating element spacing; (b) distribution histogram of phase error.
在表1所示仿真参数的基础上, 向合成信号中引入上述误差, 则合成信号的波形与频谱如图13所示.
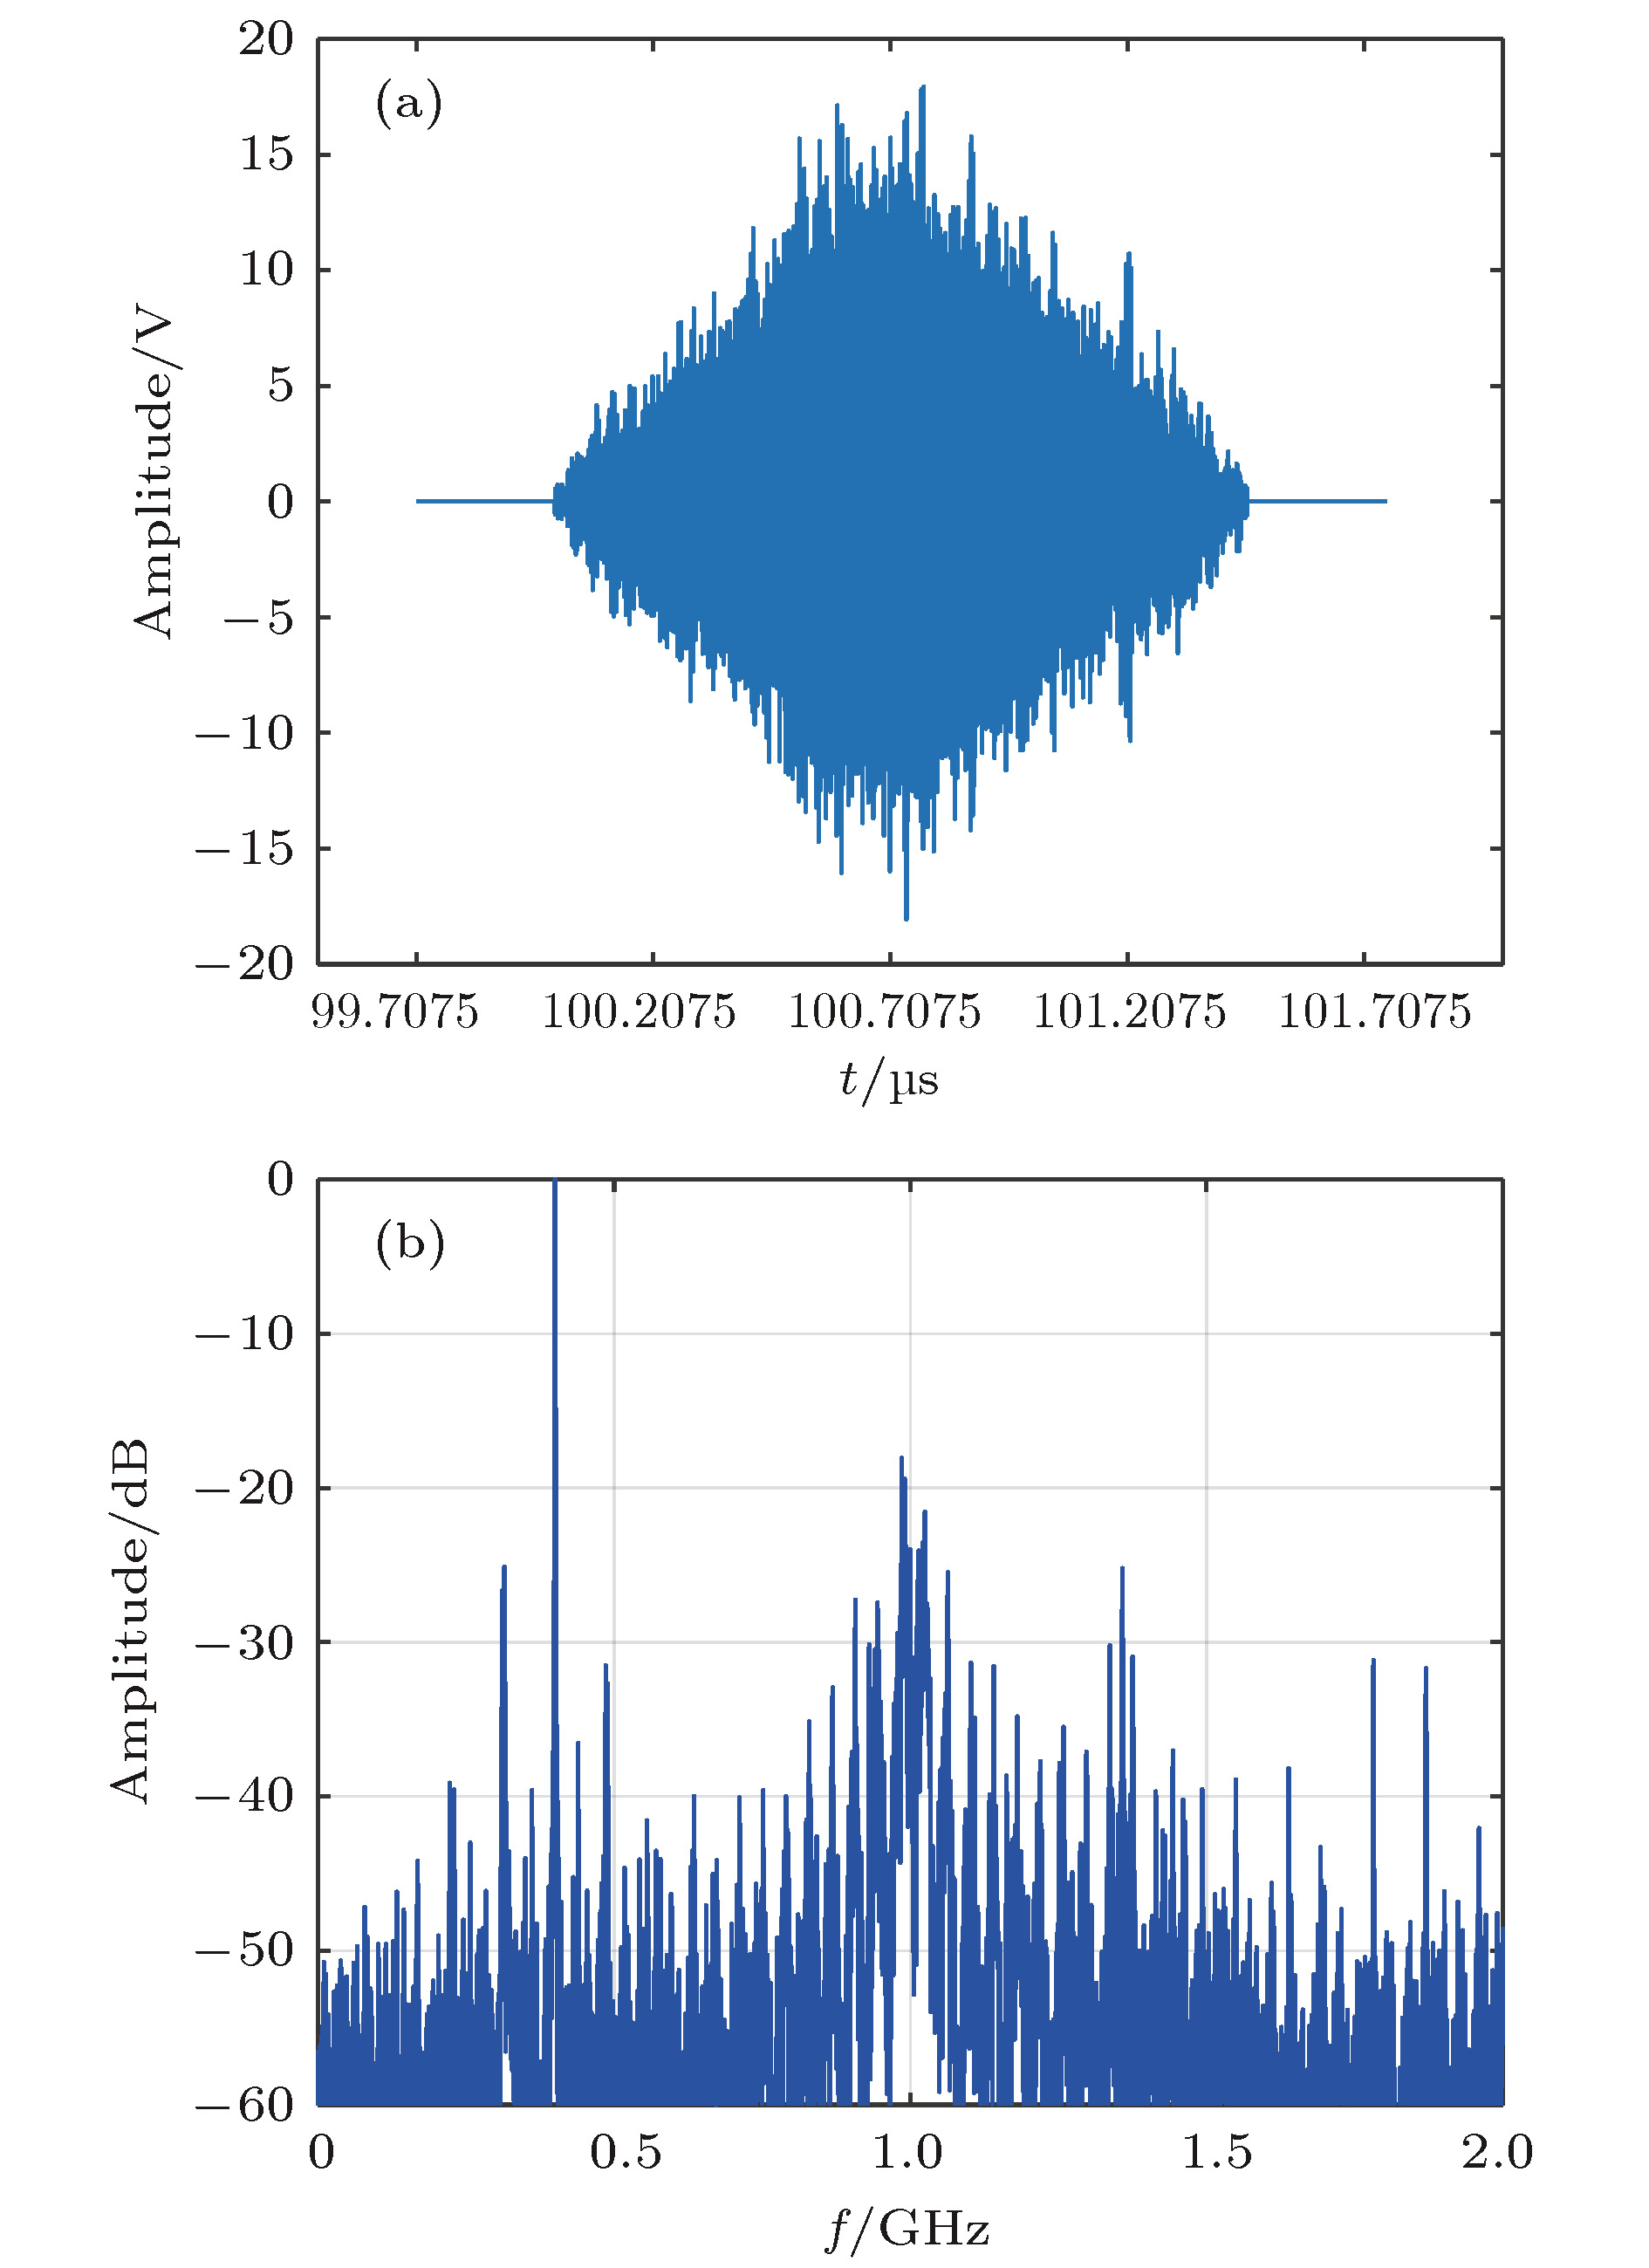 图 13 受到辐射单元间距误差和相位误差时合成信号的波形与频谱 (a) 合成信号的波形; (b) 合成信号的频谱
Figure13. Waveform and spectrum of the composite signal subjected to radiating element spacing error and phase error: (a) Waveform of the composite signal; (b) spectrum of the composite signal.
此时合成信号频谱的峰值旁瓣比为–17.01 dB, 积分旁瓣比为–7.93 dB. 因此辐射单元间距误差和相位误差将导致谐波分量对合成信号的影响增大.
2
4.2.目标距离范围
虽然辐射单元发射信号的相位根据目标位置设定, 但是实际情况下目标并不一定会位于预定位置, 因此需要讨论目标偏离预定位置对合成信号的影响.根据表1所示参数仿真, 并使得实际目标在波束扫描45°方向上偏离预定位置, 则合成信号的仿真结果如图14和图15所示.
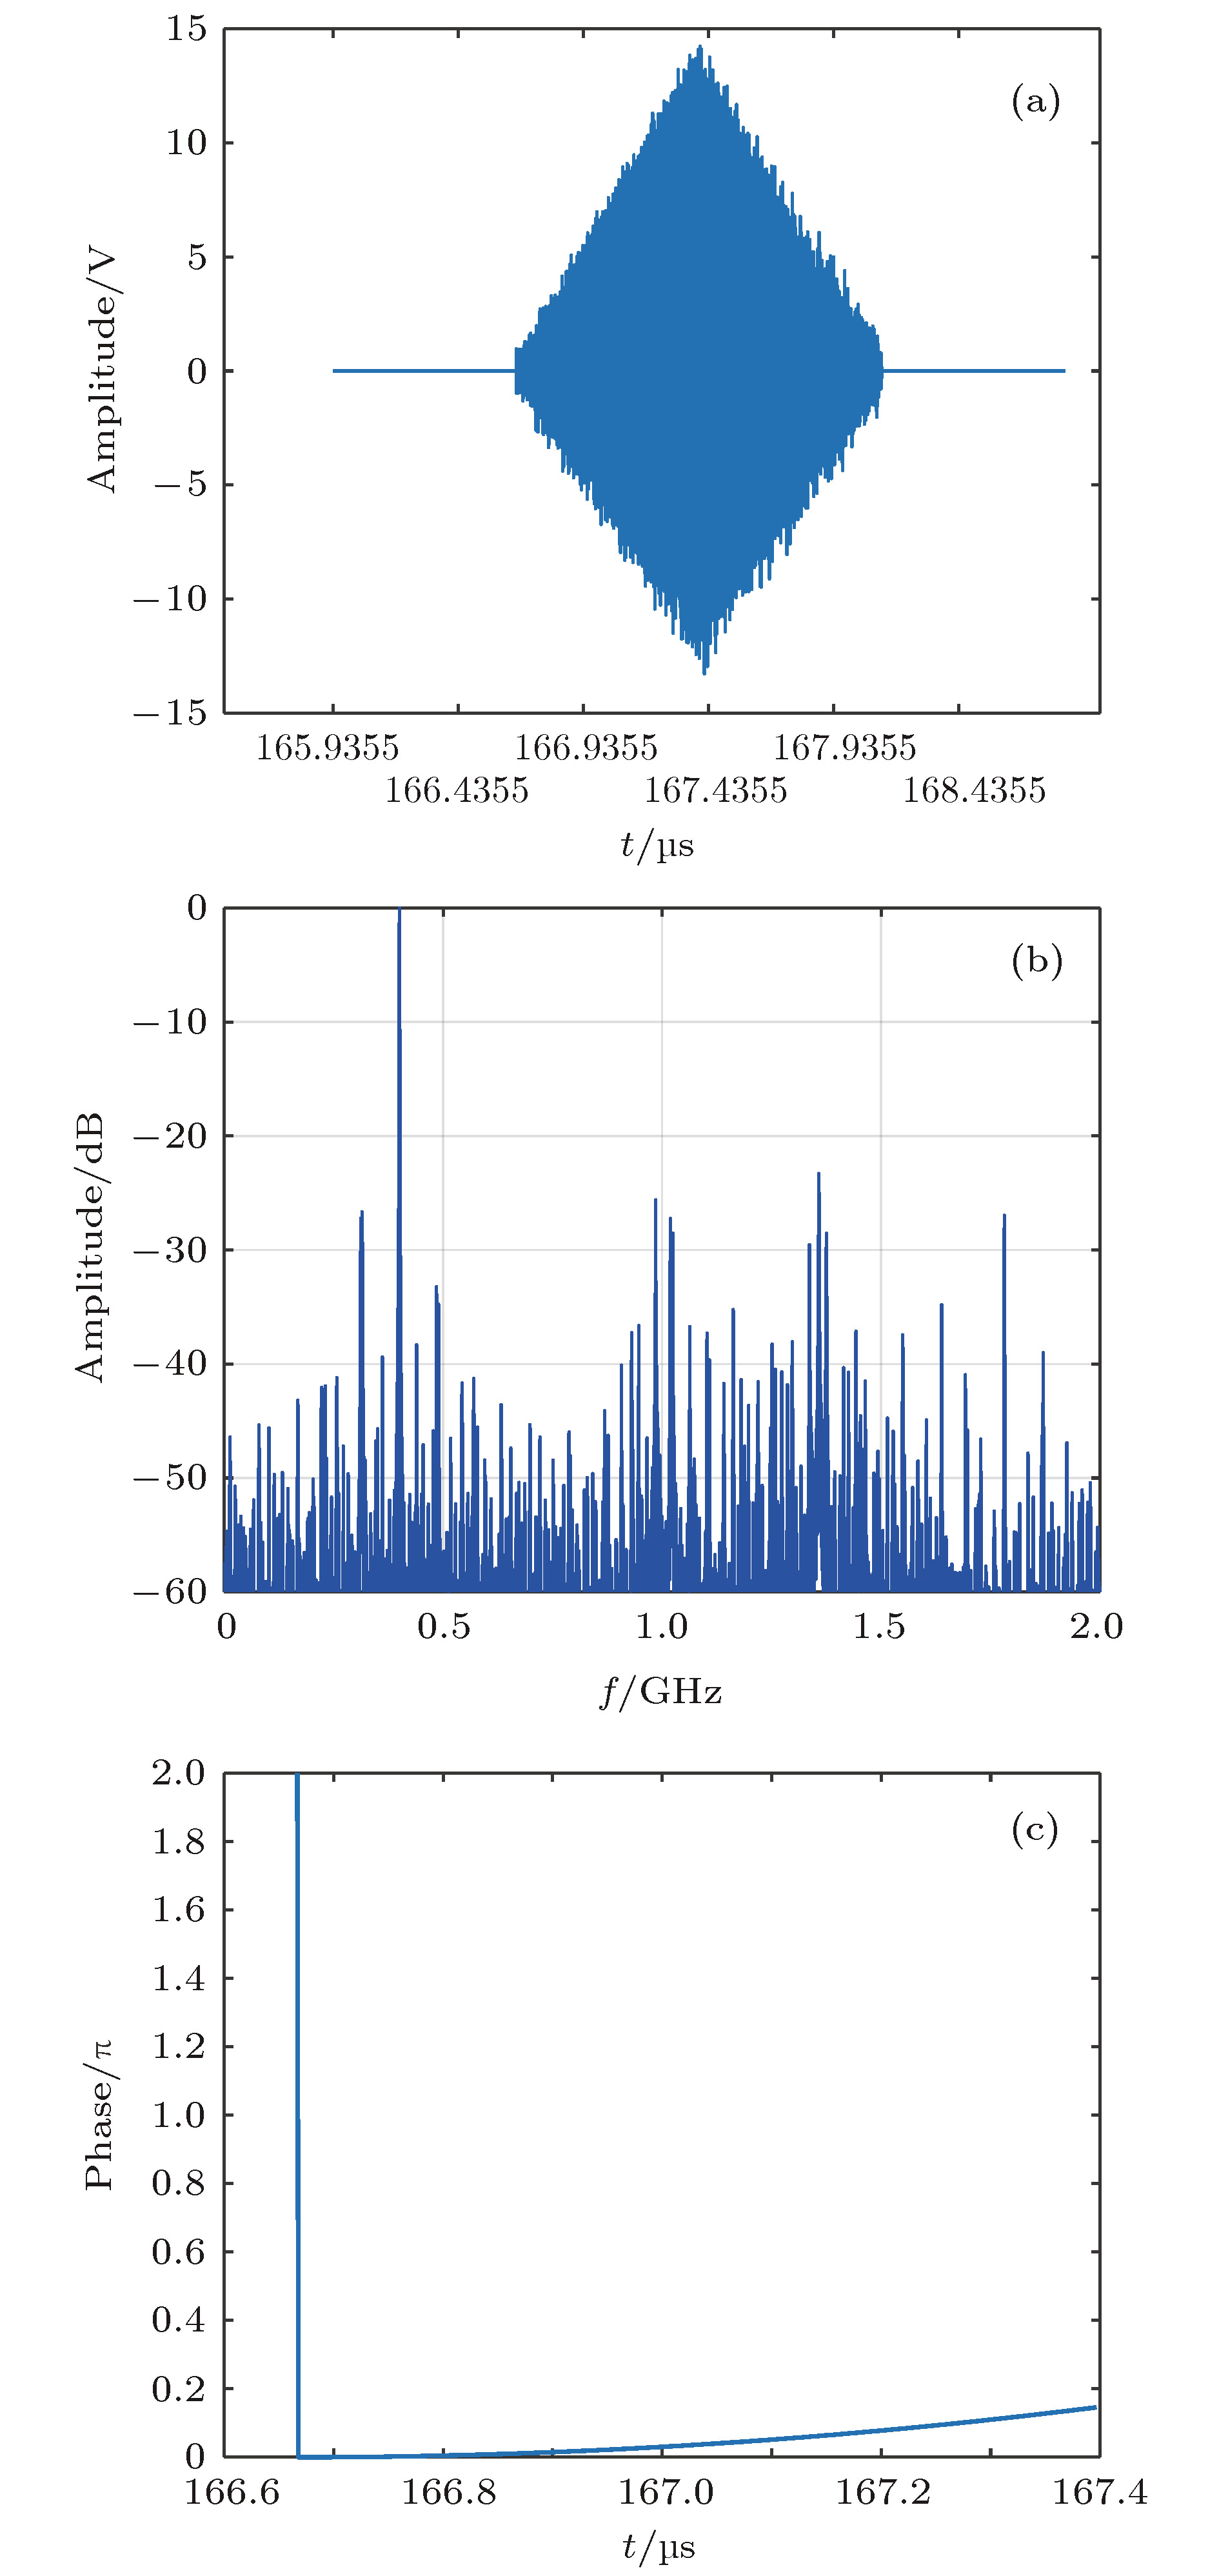 图 14 实际目标距离阵列近端50 km时合成信号的波形、频谱与合成信号慢时间相位和低频信号相位的差值 (a) 合成信号的波形; (b) 合成信号的频谱; (c) 合成信号慢时间相位和低频信号相位的差值
Figure14. Waveform, spectrum of the composite signal and slow time phase difference with that of low frequency signal when the actual target being 50 km from the near end of the array: (a) Waveform of the composite signal; (b) spectrum of the composite signal; (c) slow time phase difference with that of low frequency signal.
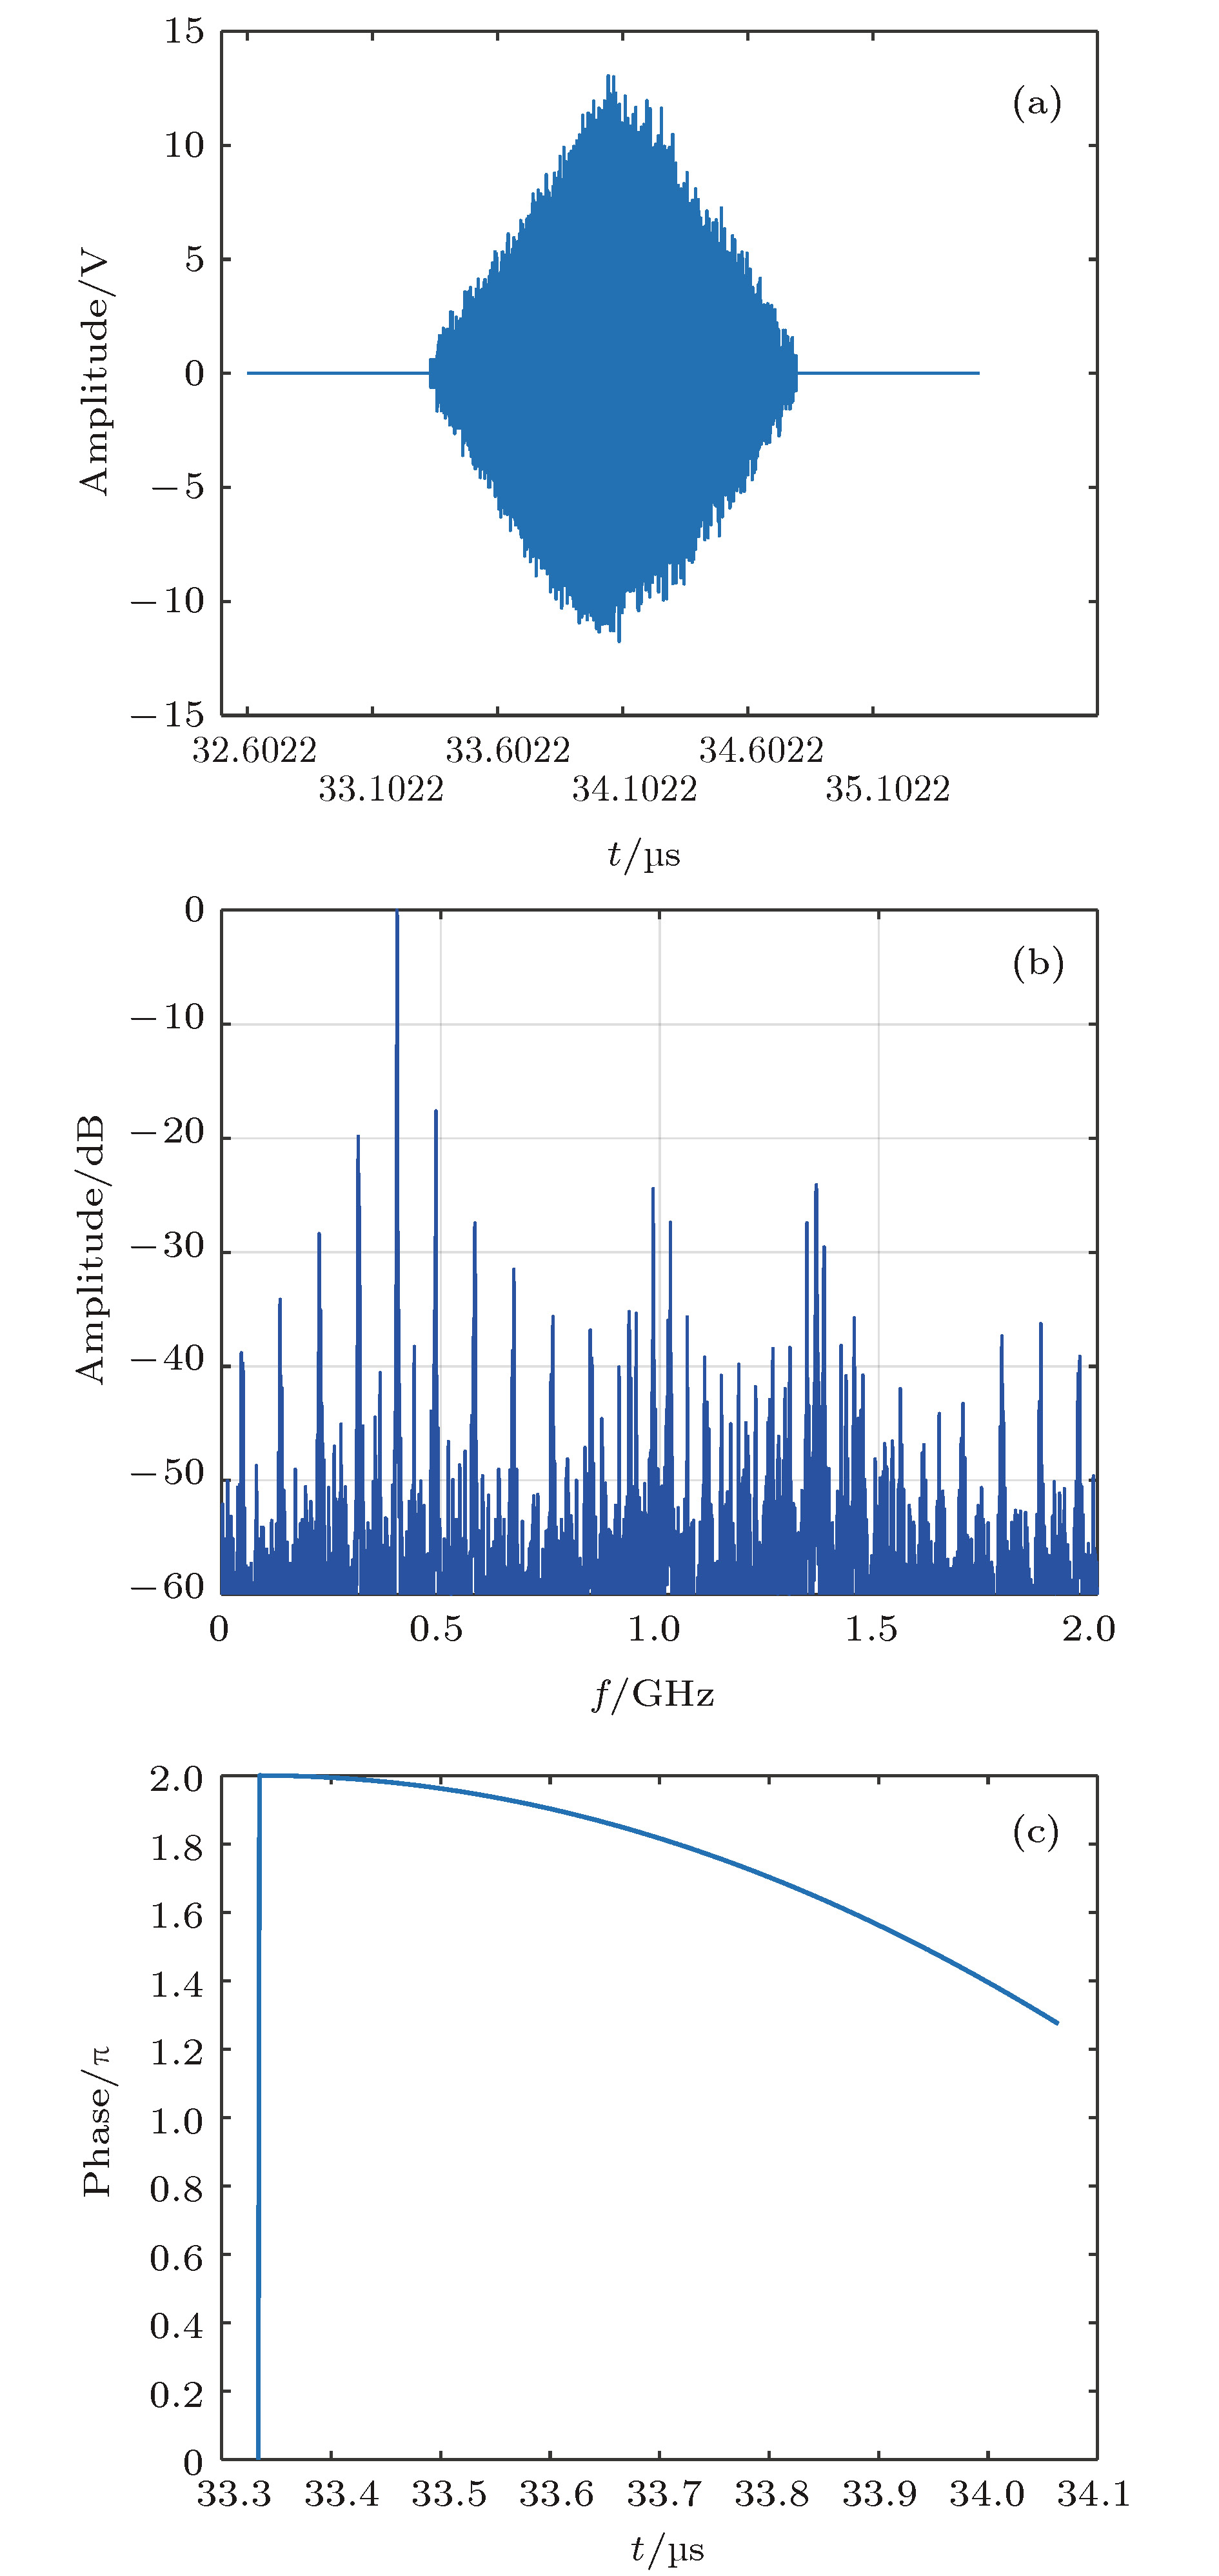 图 15 实际目标距离阵列近端10 km时合成信号的波形、频谱与合成信号慢时间相位和低频信号相位的差值 (a) 合成信号的波形; (b) 合成信号的频谱; (c) 合成信号慢时间相位和低频信号相位的差值
Figure15. Waveform, spectrum of the composite signal and slow time phase difference with that of low frequency signal when the actual target being 10 km from the near end of the array: (a) Waveform of the composite signal; (b) spectrum of the composite signal; (c) slow time phase difference with that of low frequency signal.
当实际目标距离阵列近端50 km时, 合成信号的峰值旁瓣比为–23.3 dB, 积分旁瓣比为–14.92 dB, 当实际目标距离阵列近端10 km时, 合成信号频谱的峰值旁瓣比为–17.6 dB, 积分旁瓣比为–11.17 dB, 因此目标向远处偏离预定位置时, 对合成信号影响很小, 反之, 目标向近处偏离预定位置时, 对合成信号影响较大(见表2).
| 实际目标与阵列距离/km | 峰值旁瓣比/dB | 积分旁瓣比/dB |
| 50 | –23.3 | –14.92 |
| 10 | –17.6 | –11.17 |
表2目标偏离预定位置时合成信号的仿真结果
Table2.Simulation results of the composite signal when the target deviating from the predetermined position.
 图 16 等间隔稀疏阵列合成信号的波形与频谱 (a) 合成信号的波形; (b) 合成信号的频谱
Figure16. Waveform and spectrum of signals composited by equally spaced sparse array: (a) Waveform of the composite signal; (b) spectrum of the composite signal.
以表3所示参数仿真合成信号, 则合成信号频谱的峰值旁瓣比为–12.83 dB, 积分旁瓣比为–7.14 dB. 显然, 辐射单元间距的增大导致了谐波分量的增大.
| 参数 | 数据 | 参数 | 数据 |
| 阵列长度 | 105 m | 目标与阵列距离 | 30 km |
| 辐射单元间距 | 0.3 m | 辐射单元总数 | 350 |
| 辐射单元信号频率 | 1 GHz | 合成信号频率 | 400 MHz |
| 辐射单元信号脉宽 | 0.73 μs | 合成信号脉宽 | 1.46 μs |
| 相位调制频率 | 39 MHz | 相位步进 | $ - \dfrac{{10}}{{13}}{\text{π}}$ |
表3等间隔稀疏条件下合成信号的仿真参数
Table3.Simulation parameters of the composite signal under the condition of equispaced sparsity.
感谢西安电子科技大学的水鹏朗老师对本文工作的帮助.
