1.State Key Laboratory of Quantum Optics and Quantum Optics Devices, Institute of Laser Spectroscopy, Shanxi University, Taiyuan 030006, China 2.Collaborative Innovation Center of Extreme Optics, Shanxi University, Taiyuan 030006, China 3.Center of Light Manipulations and Applications, College of and Electronics, Shandong Normal University, Jinan 250358, China
Abstract:Hofstadter ladder describes a Boson ladder under a uniform magnetic field and supports nontrivial energy band and fractional quantum Hall states. Staggered hopping is illuminated from the SSH model and proved to have non-trivial effects on current phases. We introduce staggered hopping on Hofstadter ladder to study the novel current phases. Exact diagonalization (ED) and density matrix renormalization group (DMRG) methods have been employed to study the current phases of the ladder in noninteraction and strong interaction (hard core boson) cases. By observing energy singularities and the new flux patterns when increasing the staggered hopping strength, we extend Meissner and vortex phase to horizontal current phase, vertical current phase and vortex phase. The horizontal current phase has stronger chiral currents in horizontal direction, which is the long direction of the ladder. The vertical current phase has stronger chiral currents in vertical direction. The above two phases do not break translational invariance while the vortex phase does. The current patterns of horizontal current phase are proved to be continuously deformed form the Meissner phase, and the vortex phase has similar signatures. The vertical current phase is only visible when the hopping is staggered. These phases generally exist in noninteraction regimes and interacting superfluid regimes. We have defined new quantities (i.e. current inhomogeneity and nearest overlap) to characterize different quantum phases. In noninteraction case, the horizontal current phase go through the vortex phase to enter the vertical current phase by second order phase transitions, but in strong interaction case such a change can be directly made in a first order phase transition. The direct transition is made in higher fillings with almost identical flux. Surprisingly, the three phases turn into only two phases in Mott regimes, and the phase transition between the horizontal current phase and the vertical current phase has disappeared. We call the new phase as Mott-homogenous phase. The staggered hopping has exotic effects in strong interaction case. For n = 0.25 filling, the staggered hopping shrinks the region of vortex phases and produces Mott-SF transition. When the staggered hopping is weak, the system achieves Mott-SF transition just by varying the flux. This research can enrich current phases in lattice systems and illuminate further studies on chiral currents. Keywords:quantum phase transition/ numerical simulation/ Hofstadter ladder/ chiral current
其中${A_k} = - {t_1}{{\rm{e}}^{{\rm{i}}\phi /2}} - {t_2}{{\rm{e}}^{ - {\rm{i}}\phi /2}}{{\rm{e}}^{ - {\rm{i}}k}}$, ${B_k} = - {t_1}{{\rm{e}}^{ - {\rm{i}}\phi /2}} - $${t_2}{{\rm{e}}^{{\rm{i}}\phi /2}}{{\rm{e}}^{ - {\rm{i}}k}} $. 根据基态能突变的相变行为(图2(a)), 可以将系统分为三个相: 横流相、涡旋相和纵流相, 分别对应最低能带最小值的不同k位置(图2(b)). 横、纵流态的流分布都具有2的周期, 体密度全格点均匀分布, 横流相横向的流强于纵向的流, 纵流相纵向的流强于横向的流; 涡旋相的流分布不具有为2的周期性(图2(c1)—图2(c3)). 横流相和纵流相的基态不简并, 涡旋相的基态是二重简并的. 横流相到涡旋相的相变和纵流相到涡旋相的相变都是二阶相变, 其基态能对参数二阶导不连续. 能引起这些相变的, 可以是交错跃迁, 也可以是磁通$\phi $或者腿间跃迁系数K. 图 2 (a) 用来识别相变的基态能导数的突变, 数据取自${t_1}/K = 1$, ${t_2}/K = 0.3$; (b) 无相互作用相图; (c1)?(c3) 区分三种相的流图案. 图中箭头表示流, 点表示密度, 箭头的方向和粗细代表流的方向和强度, 点的大小表示密度的大小, 箭头的粗细和点的大小都已经除以当组最大的流或密度归一. 数据取自${t_1}/K = 1$, ${t_2}/K = 0.3$, $\phi /{\text{π}} = $0.1, 0.6, 0.9, 精确对角化 Figure2. (a) Singularities in derivative of ground state energy indicate phase transitions. Data is from ${t_1}/K = 1$, ${t_2}/K = 0.3$; (b) phase diagram for non-interacting case; (c1)?(c3) the current pattern used to distinguish the 3 phases. Direction and thickness of an arrow indicate the direction and strength of the current on the plotted bond. The strengths are normalized by the strongest local current. The sizes of the points indicate the density strengths and are normalized by the largest density. The current patterns are from ED calculations for $\phi /{\text{π}} = 0.1, \;0.6, \;0.9$ when ${t_1}/K = 1$, ${t_2}/K = 0.3$.
横流相、涡旋相和纵流相之间的相变还可用最近邻内积$\left| {\left\langle {{{\psi _1}}} / {{{\psi _2}}} \right\rangle } \right|$来断定, 最近邻内积是数值上连续均匀扫描模型参数、计算基态时, 最相邻参数基态间内积的模(文中内积的模简称为内积). 如图3(a)所示, 发生相变时, 基态之间的最近邻内积也会突变, 系统进入涡旋相后最近邻内积会突变为0并振荡, 最近邻内积能找到和手性流计算能够得到一致的相变临界点. 此外, 内积能说明交错跃迁时态的起源. 接近Meissner的基态与Meissner态内积接近1而没有突变, 并且之后缓缓变小(图3(b)), 结合此时横向手性流的平缓变化, 说明此区域从${t_1} = {t_2}$到${t_1} \ne {t_2}$没有相变, 横流相是均匀跃迁(${t_1} \!=\! {t_2}$)时的Meissner相渐变过来的. Meissner态连续变化的过程从观察到的流图案上可以理解为${t_2}$减小时通过梯子长方向的流受到阻隔, 为了依旧能抵抗外磁场, 流改从横栏间经过形成横流态. 同样的推理能说明纵流态是从均匀跃迁时$\phi = {\text{π}}$处的单个点渐变过来的, 但事实上这个态以前没有被关注过, 是交错跃迁(${t_1} \ne {t_2}$)扩大了其相区域才使我们注意到它. 另外, 磁通$\phi $经过${\text{π}}$时, 流的方向会反向翻转, 和均匀跃迁时的平缓过渡不同的是, 交错跃迁时的流反向过程是剧烈的一阶相变过程(图3(c)). 图 3 (a) 无相互作用时扫描$\phi $计算出的最近邻内积, 数据取自${t_1}/K = 1, \;{t_2}/K = 0.3$; (b) 保持${t_1}/K = 1$, 逐渐改变${t_2}/K$时, 横流相和纵流相的态和${t_1}/K = {t_2}/K = 1$时态的内积; (c) 一般的, 系统在$\phi = {\text{π}}$处整个流图案的流会逆转方向, 交错跃迁会让流换向以一阶相变的形式进行, 数据取自${t_1}/K = 1$ Figure3. (a) Nearest overlaps from ED calculations. Data is from ${t_1}/K = 1, {t_2}/K = 0.3$; (b) when ${t_1}/K = 1$, as ${t_2}/K$ decays, the overlap with ${t_1}/K = {t_2}/K = 1$ state decays from 1 smoothly; (c) generally all local currents in the system reverse sign in $\phi = {\text{π}}$. The staggered hopping makes the process the first order phase transition. Data is from ${t_1}/K = 1$.
选取${t_1}/K = 1, \;{t_2}/K = 0.3$来展示交错跃迁时的量子相, 相图见图4(a). 此情形下$n = 0.25$的倍数填充会产生Mott相, 其余填充为超流相. 超流相之中也分为横流相、纵流相和涡旋相, 对应流和密度的特征和无相互作用时一样. 超流区的中部出现了一个三相汇聚的区域, 靠近$n = 0$的区域横流相需通过涡旋相再到达纵流相, 接近$n = 0.25$的区域横流相直接相变成纵流相. 有趣的是, 横流相直接相变成纵流相的边界在数值上是一条很精确的直线, 此区域内不论填充是多少, 系统在相同的$\phi $处发生横流相-纵流相相变. 图 4 (a) ${t_1}/K = 1, \;{t_2}/K = 0.3$强相互作用极限(HCB)相图, $n = N/(2 L)$为填充; (b) 该相图中三个相对应的纠缠熵分布与拟合结果, $\phi /{\text{π}} = 0.3, 0.64, 0.8$分别取自横流相、涡旋相和纵流相, 散点是有限尺寸系统中计算的纠缠熵(S), 实线和中心荷(c)是将散点用公式(7)拟合的结果. 交错跃迁导致了纠缠熵空间分布的起伏, 数据取自周期边界, $L = 64$, $N = 12$; (c) 横流相-纵流相相变时横向手性流和纵向手性流的突变, 突变后二者强弱交换; 数据取自$L = 64, N = 25$, 在手性流的计算中为了减小开边界带来的边界效应, 只截取了中间$L/2$部分; (d) 横流相-涡旋相-纵流相相变; 扫描$\phi $时, 最近邻内积进入涡旋相时会突变, 并且数值上类似于无相互作用时一样振荡; 数据取自$N = 4$ Figure4. (a) Phase diagram for HCB when ${t_1}/K = 1$, ${t_2}/K = 0.3$, $n = N/(2 L)$; (b) VN entropy and the corresponding fitted central charge for three phases in the phase diagram above. $\phi /{\text{π}} = 0.3, 0.64, 0.8$ are from horizontal current, vortex and vertical current phase respectively. The points are VN entropy data in PBC finite system. Solid lines and central charge are fitted from formula(7). The staggered hopping has made the VN entropy also staggered. Data is from $L = 64$, $N = 12$; (c) horizontal current phase to vertical current phase transition for$L = 64, N = 25$. The average horizontal current and average vertical current will swap their strong and weak relations in the transition point. In order to reduce the boundary effect in average currents, we used the$L/2$part in the middle of the ladder; (d) horizontal current to vortex and vortex to vertical current phase transition. The nearest overlap shows that in horizontal and vertical current phases the ground state changes smoothly, and numerically oscillates in the vortex phase. Data is from$N = 4$.
接下来论述交错跃迁较强时的Mott相, 再展示其是如何从均匀跃迁时过渡而来的. 均匀跃迁时, Mott线出现在$n = 0.5$的整数倍填充上, 其$n = 0.5$ Mott线上存在Mott-Meissner相和Mott-涡旋相. 但交错跃迁时的Mott态与之相比很奇怪: ${t_1}/K = 1$, ${t_2}/K = 0.3$相图中$n = 0.25$ Mott线上不包含涡旋相, 和均匀跃迁时不同, 这条线上只存在一个相, 这个相中心荷为0, 流和密度均匀; 另外从流的图案和相变特征来看, 这个Mott相不分横、纵流相, 其基态从横流态不经相变地变成前面定义的纵流态(图5(c)), 这也和交错跃迁时的超流区不同, 令人不解. 因此改变${t_1}, {t_2}$的差, 观察这条Mott线是如何从均匀跃迁时转变过来的. 图 5 (a) $n = 0.25$相图, ${t_1}/K = 1$, 虚线圈出的是vortex相; (b) 相图中均匀相与涡旋相是用量化的流的周期2不均匀性区分的, 数据取自${t_1}/K = 1$, ${t_2}/K = 0.9$; (c) ${t_1}/K = 1$, ${t_2}/K = 0.3$的$n = 0.25$ Mott线, 系统基态平缓地从横流相变成纵流相, 这个过程中流图案的周期一直为2 Figure5. (a) Phase diagram for $n = 0.25$ filling when${t_1}/K = 1$; (b) the homogenous phase and vortex phase are distinguished from the inhomogeneity of densities and currents. Data is from ${t_1}/K = 1$, ${t_2}/K = 0.9$; (c) the $n = 0.25$ Mott line for ${t_1}/K = 1$, ${t_2}/K = 0.3$. The average vertical current surpasses the average horizontal current smoothly, during the process the current patterns have perfect periodicity of 2 and the density is homogenous.
表1在有代表性的区域取点, 精确计算中心荷(c)来验证各个流相的存在, 系统取周期边界来减小纠缠熵振荡. 表格列出了散点在相图中的位置,对这些点的电荷能隙和流相性质的判断,以及对应的中心荷判据,L = 64—100, t1/K = 1 Table1.PBC central charges (c) are accurately checked in several points in typical regions. The table has listed the points' position in the phase diagram, the judged charge gap and current phase pro-perties, and the corresponding central charge evidence, L = 64–100, t1/K = 1.


 图 1 哈密顿量中跃迁项示意图


 图 2 (a) 用来识别相变的基态能导数的突变, 数据取自


 图 3 (a) 无相互作用时扫描


 图 4 (a)


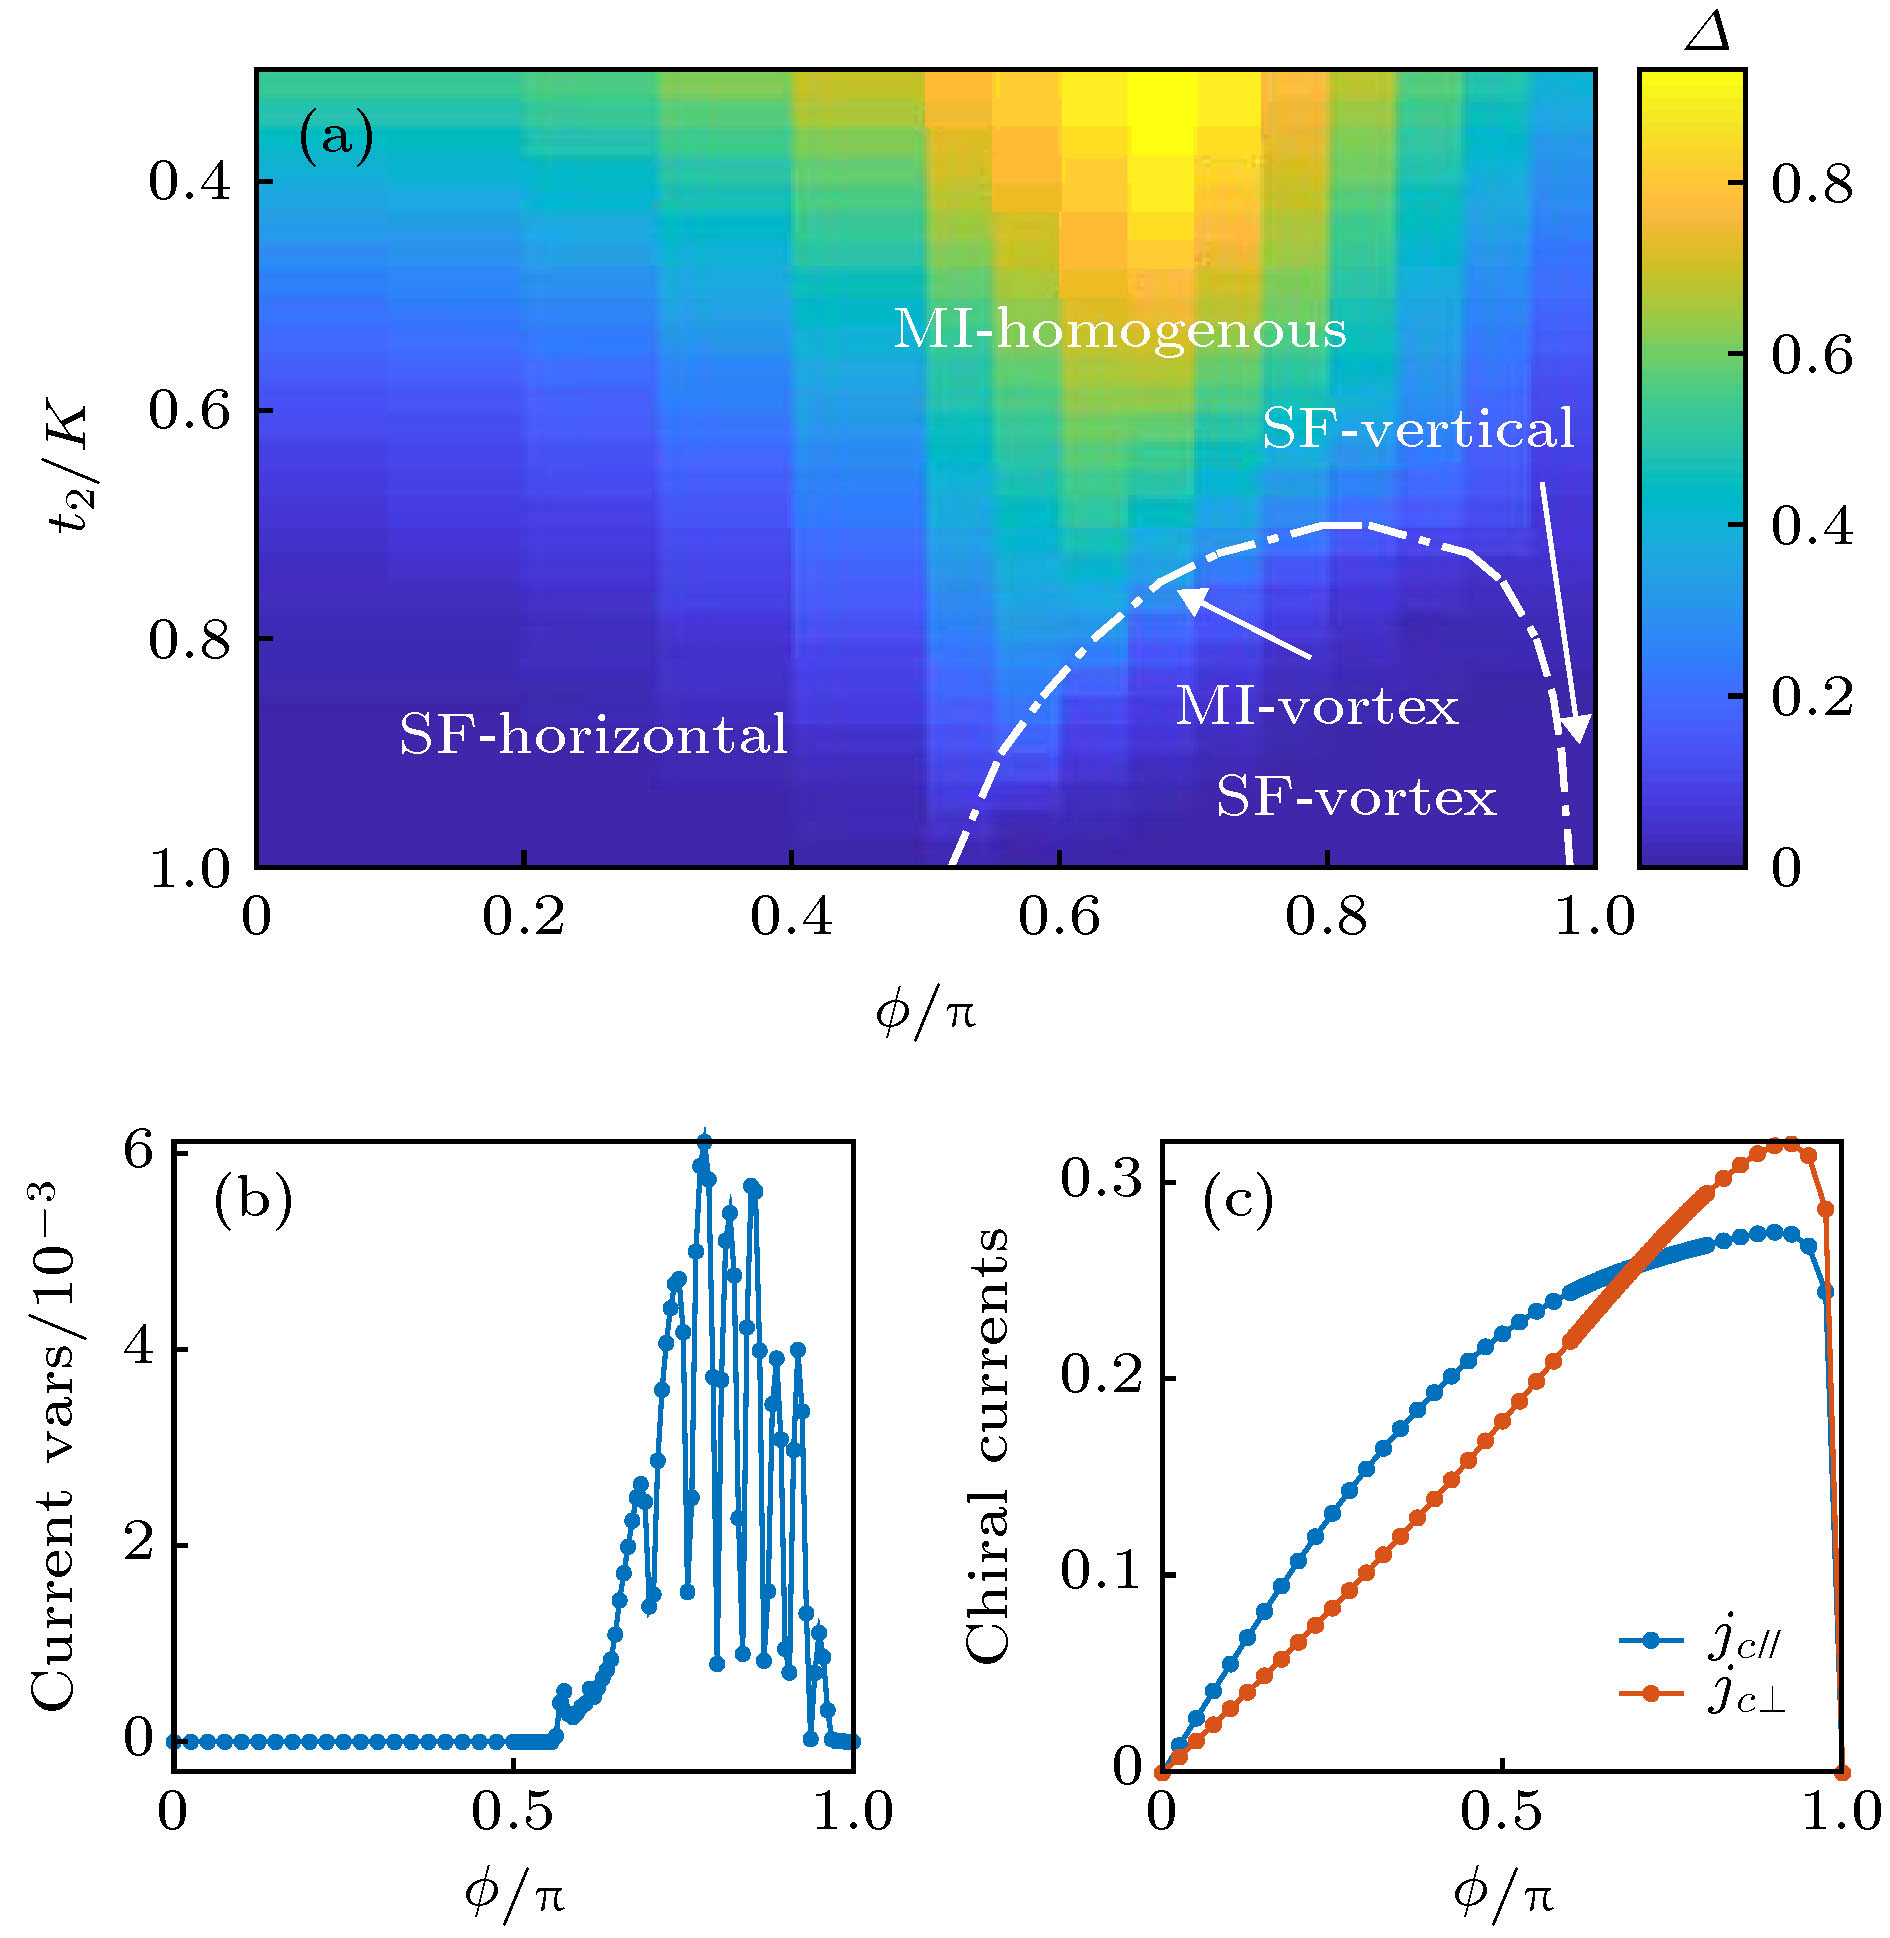 图 5 (a)


