全文HTML
--> --> -->最近, 人工神经网络被用于凝聚态物理、高分子物理等领域研究. 卷积神经网络被用来区分凝聚态物质在高温下的顺磁性和在低温下的铁磁性[2], 还有深度学习被用来研究聚合物的Coil-globule相变, 这种将机器学习与MC方法相结合的方法在科学计算研究上取得了非常好的效果[1]. 这激发我们将机器学习应用于高分子吸附的研究, 也为我们研究的可行性提供了保障. 对于高分子链在表面的吸附相变问题已经有研究人员采用传统的MC模拟方法进行了研究并且计算了临界吸附点[19-25]. 本文将神经网络和MC模拟方法相结合来研究高分子链在表面的吸附相变. 吸附表面分为均质表面和条纹表面两种情况. 研究表明对于单一的高分子链, 神经网络可以很好地识别在均质表面的脱附态和吸附态以及在条纹表面的脱附态、多条纹吸附态和单条纹吸附态, 并分别计算出了高分子链在均质表面以及条纹表面的临界相变温度, 为研究高分子链的临界吸附提供了一种新方法.


本文采用卷积神经网络和全连接神经网络研究高分子链的吸附相变, 在每个温度下抽取了9600个样本用于神经网络的训练和测试. 神经网络的梯度更新采用累积更新算法, 并使用滑动平均以及正则化来防止过拟合. 本文所采用的神经网络模型如图1所示.
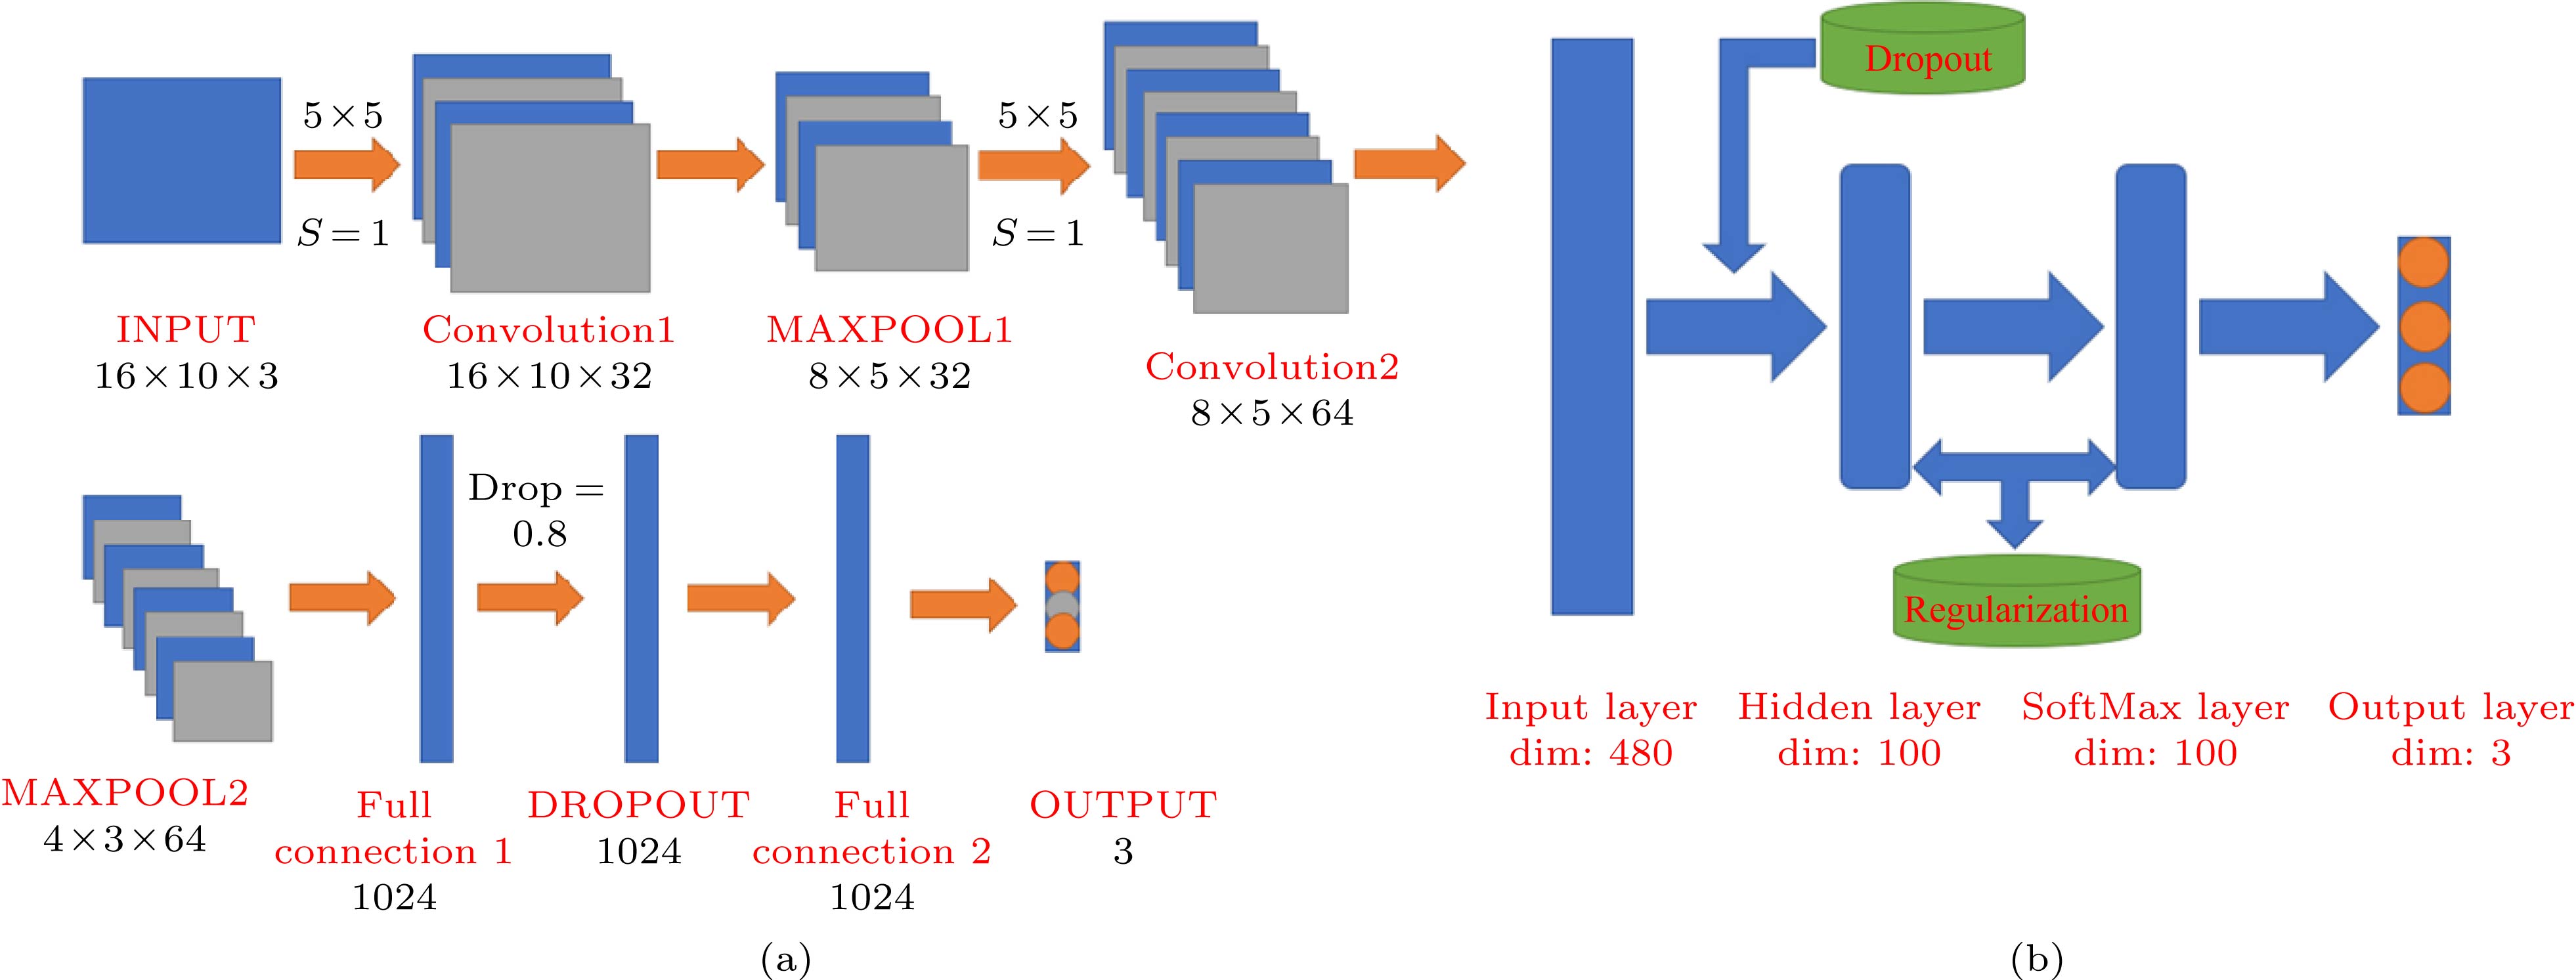 图 1 神经网络结构示意图 (a) 卷积神经网络, INPUT表示输入层, Convolution表示卷积层, MAXPOOL表示池化层, Full connection表示全连接层, OUTPUT表示输出层, PADDING方式均为SAME; (b) 全连接网络的一般结构, 其中hidden layer表示隐藏层, 使用正则化和dropout来防止过拟合, DIM表示输入张量的维度
Figure1. Schematic diagram of the neural network structure: (a) Convolutional neural network, INPUT is the data entry, OUTPUT is the learning result, and the padding way is SAME; (b) the general structure of a full-connected network, where regularization and dropout are used to prevent overfitting, and DIM represents the dimension of the tensor.
在图像识别领域通常将一张图片转换成矩阵输入神经网络. 卷积神经网络的结构示意图如图1(a)所示. 将构象的坐标信息当作“RGB图像”转换成

本文采用ROC (receiver operating charac-teristic)曲线[28,29]来辅助判断识别的性能, 当ROC曲线围成的面积越接近1时则说明分类器的性能越好, 即采用ROC下面积AUC (area under curve)来判断分类器的性能, AUC的计算过程为

采用状态标记法和温度标记法来对模拟得到的样本进行标记. 状态标记法针对每一个样本都进行标记, 高分子链在每个温度运行

 图 2 吸附率与温度之间的关系. 其中链长N = 160, 插图(a) 是温度T = 1.0时的吸附态构象, 插图(b) 是温度T = 2.0时的脱附态构象
Figure2. Relationship between adsorption rate and temperature. Wherein the chain length N = 160, inset (a) is the conformation of polymer adsorbed on the surface at temperature T = 1.0, and inset (b) is the conformation of polymer desorbed from surface at temperature T = 2.0.
从图2可以看出当吸附率等于0 (即没有单体接触表面)时即为脱附状态, 其典型的构象如图2(b)所示. 当吸附率非零时即发生了吸附现象, 称为吸附状态, 典型构象如图2(a)所示. 临界相变点大约在


 图 3 识别率与训练样本的Epoch, 神经网络层数以及每个温度采用的训练样本数之间的关系 (a) 识别率与Epoch的关系图, SPT (sample per temperature)表示在每个温度下抽取的用于训练神经网络的样本数目, 采用状态标记法标记样本. 其中nh = 1表示隐藏层数目为1, 其他的类似, nh = 1至 nh = 3均采用SPT = 192的样本用于训练, 剩余的样本用于测试与验证, 插图描述的是识别率与隐藏层数目nh的关系, 该识别率为每个学习器最终稳定的识别结果; (b) 识别率与每个温度采用训练样本数目的关系图, 采用状态标记法标记样本, 隐藏层数等于3, 纵坐标为不同训练样本在足够Epoch下达到稳定时的识别率, 测试集均为SPT = 7680, 且与训练集不重复
Figure3. The relationship between the recognition rate and the Epochs of training case, the number of neural network layers and the number of training samples obtained from each temperature: (a) the plot of recognition rate versus Epochs. SPT (sample per temperature) represents the number of samples extracted at each temperature for training the neural network. The sample is labeled by status. Where nh
从图3(a)中可以看出, 随着隐藏层数目的增加, 识别率先提高然后趋于稳定, 当隐藏层数目大于等于3时识别率基本稳定在97.1%, 因此本文缺省所采用的隐藏层数均为3. 当Epoch > 30时训练基本趋于稳定. 从图3(b)中可以看出, 即使每个温度下抽取用于训练神经网络的样本数目(sample per temperature, SPT)足够小, 例如SPT=1时神经网络仍然拥有91.88%的识别率, 也足以识别大部分的样本. 当

 图 4 神经网络训练的识别结果图. 横坐标为温度, State表示每个温度下的样本被识别为某个状态的概率, S表示状态标记法, T表示温度标记法, AD表示吸附态, DE表示脱附态. 图为两种标记方法的识别结果, 卷积网络的识别率为98.3%, AUC值为0.9989, 全连接网络为97.6%, AUC值为0.9982, 两种标记方法的临界相变温度
Figure4. A plot of the result based on the neural network. The x-axis is the temperature, State represents the probability that the sample at each temperature is recognized as a certain state, The letter S represents the state labeling method, the letter T represents the temperature labeling method, AD represents the adsorption state, and DE represents the desorption state. The figure shows the learning results of the two labeling methods. The recognition rate of the convolutional network is 98.3%, the AUC value is 0.9989, the fully connected network is 97.6%, the AUC value is 0.9982, and the critical phase transition temperature is 1.5 of the two labeling methods.
从图4可以看出, 卷积神经网络和全连接神经网络都得到了较高的识别率以及较大的AUC值, 因此神经网络可以较好地识别高分子链在均质表面的两个状态, 且卷积神经网络的识别率稍高一些. 两种方法都可以用来确定其吸附相变点, 且得到的临界相变温度相同, 均为


接下来采用神经网络对高分子链在条纹表面的吸附状态识别进行研究. 高分子链在条纹表面的吸附率如图5所示, 插图分别是三种状态下的典型构象, 其中表面上的两种不同条纹对高分子单体有不同的吸附作用, 颜色深的条纹对高分子单体有吸附作用, 白色条纹对高分子单体只有体积排斥作用. 高分子链在条纹表面的构象涉及三种状态, 单条纹吸附态(single-stripe adsorption state)、多条纹吸附态(multi-stripe adsorption state)以及脱附态(desorption state), 因此三种状态之间的转变伴随着两个临界相变点.
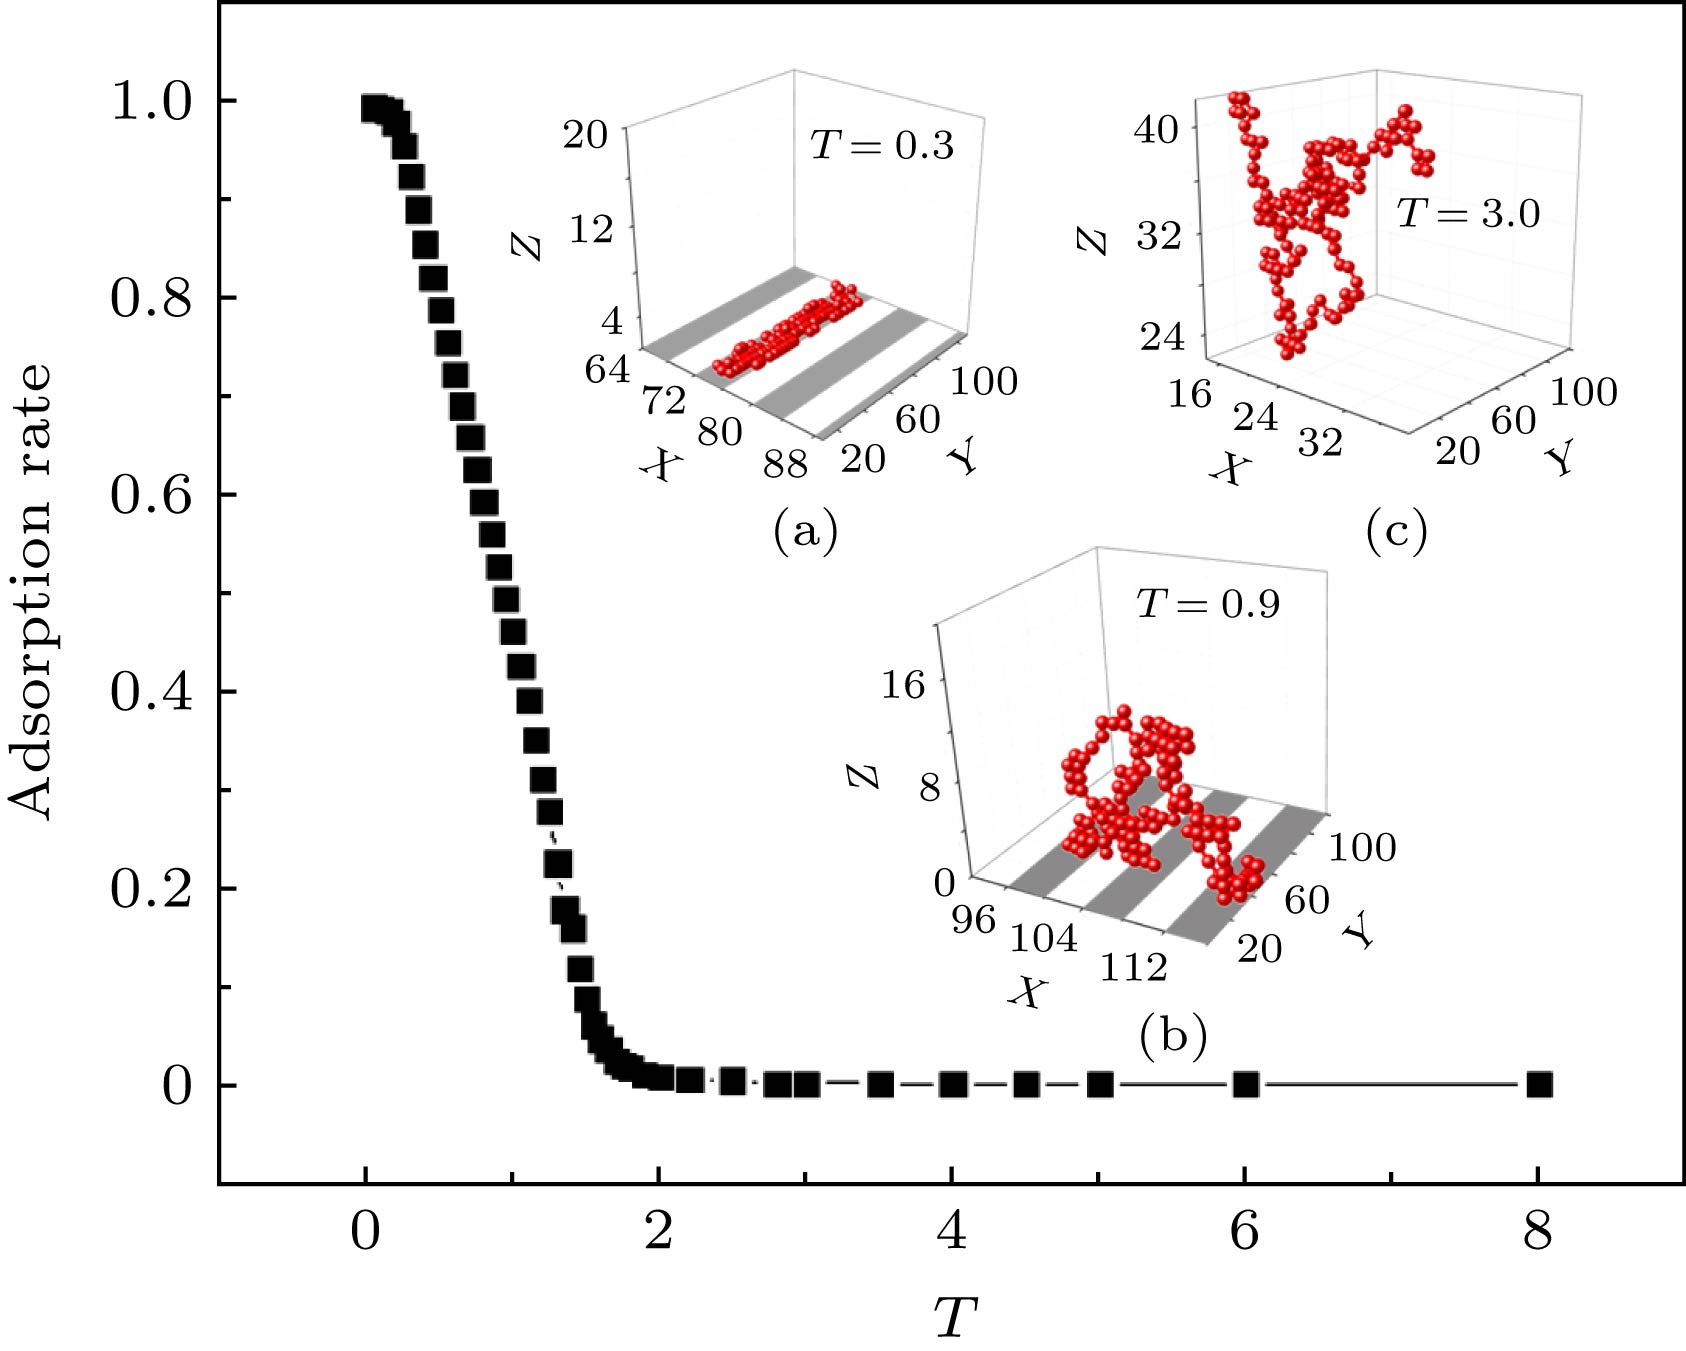 图 5 高分子链在条纹表面的吸附率随温度的变化以及典型的三态构象示意图 (a) 单条纹吸附状态, 温度T = 0.3; (b) 多条纹吸附状态, T = 0.9; (c) 脱附状态, T = 3.0. 其中链长N = 160, 条纹宽度L = 4, 条纹方向垂直于x轴, 沿着y轴方向延伸, 选取的空间尺寸为
Figure5. The schematic diagram of the adsorption rate of polymer adsorbed on the stripe surface changes with temperature and typical tri-state conformations: (a) the single-strip adsorption state, where the temperature is 0.3; (b) the multi-strip adsorption state, where the temperature is 0.9; (c) the desorption state, where the temperature is 3.0. Wherein the chain length N is 160, and the stripe width L of the adsorption surface is 4. The stripe direction is perpendicular to the x axis and extends along the y axis, and the selected space size is

从图5可以看出, 在高温时高分子链的吸附率几乎为0, 即为脱附态, 该状态与均质表面的脱附态相一致; 在低温时高分子链吸附率非常高, 而且高分子链被单条纹所吸附, 我们把这个吸附状态称为单条纹吸附态, 如图5(a)所示; 而在中间温度存在高分子链吸附在多条纹上, 其吸附率也介于脱附态和单条纹吸附之间, 我们把这个吸附态称为多条纹吸附态. 在多条纹吸附态, 高分子链分布在不同的吸附条纹上, 如图5(b)所示. 对于温度标记法, 我们选取


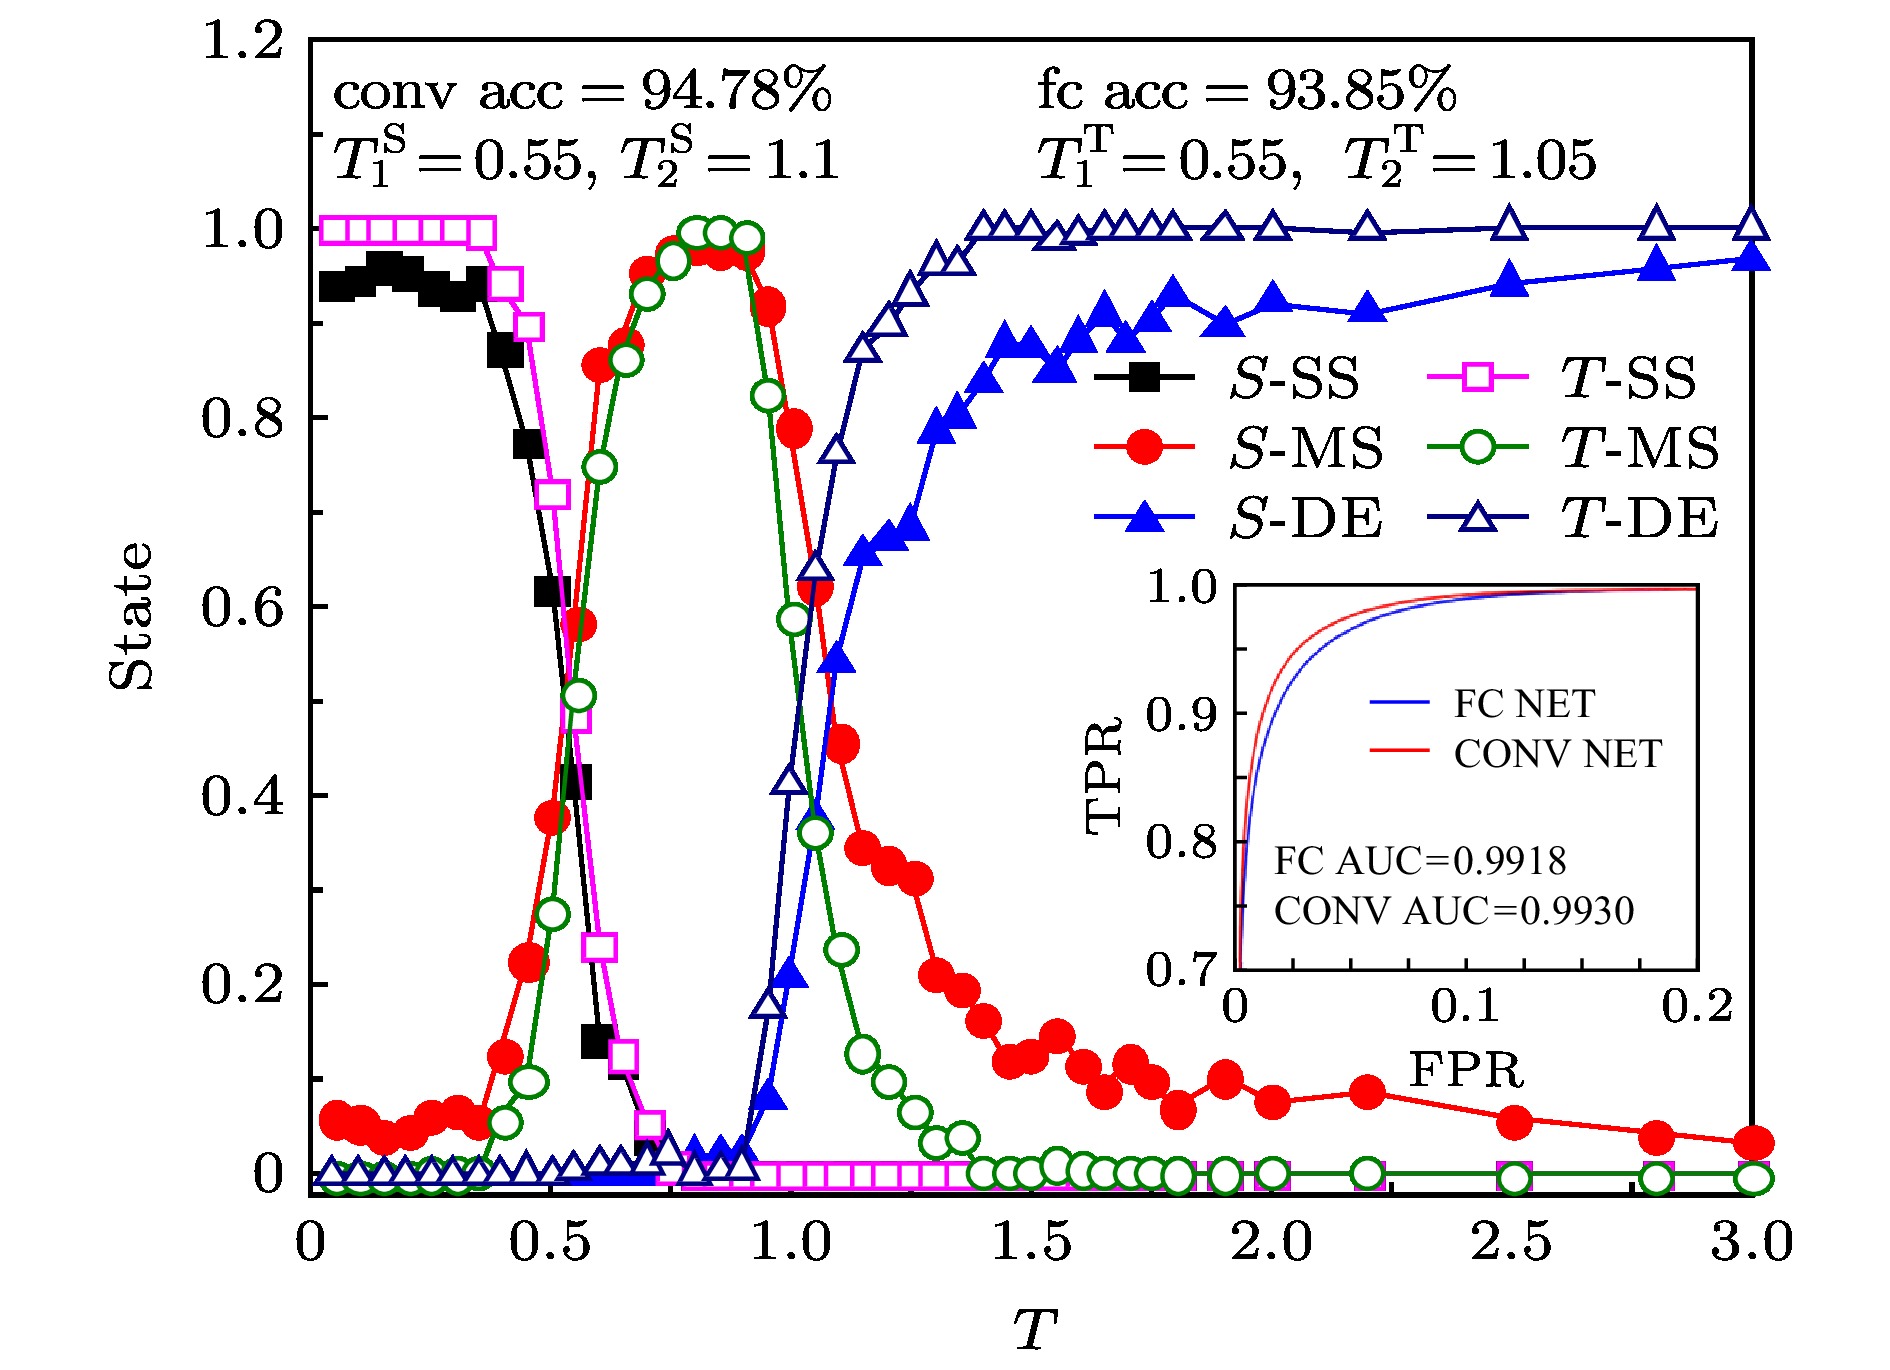 图 6 神经网络训练的识别结果图 横坐标为温度, 纵坐标State表示每个温度下的样本被识别为某个状态的概率, 图标中S表示状态标记法, T表示温度标记法, SS表示单条纹吸附态, MS表示多条纹吸附态, DE表示脱附态. 其中卷积网络的识别率为94.78%, AUC值为0.9930, 全连接网络为93.85%, AUC值为0.9918, 状态标记法的临界相变温度


Figure6. A plot of the result of the neural network training. The x-axis is the temperature, the State indicates the pro-bability that the sample at each temperature is recognized as a certain state, S indicates the state labeling method, T indicates the temperature labeling method, SS indicates the single-striped adsorption state, MS indicates the multi-striped adsorption state, and DE indicates desorbed state. The figure shows the learning results of two kinds of labeling methods. The recognition rate of convolutional network is 94.78%, where the AUC value is 0.9930. the fully connected network is 93.85%, where the AUC value is 0.9918, and the critical phase transition temperature of state labeling method is 0.55 and 1.1. The critical phase transition temperature of the temperature labeling method is 0.55 and 1.05.
从图6可以看出, 卷积网络和全连接网络同样具有较高的高分子构象状态的识别率, 且AUC值非常接近1, 这说明神经网络可以识别高分子链在条纹表面的三种状态, 且卷积神经网络识别率略高于全连接网络. 两种样本标记方法所得到的临界相变温度基本相同, 其中多条纹吸附向单条纹吸附的相变点为


完成了上述实验之后, 我们发现条纹的表面的高分子识别率要低于均质表面, 因此我们对识别过程中的误判进行了统计, 如图7所示.
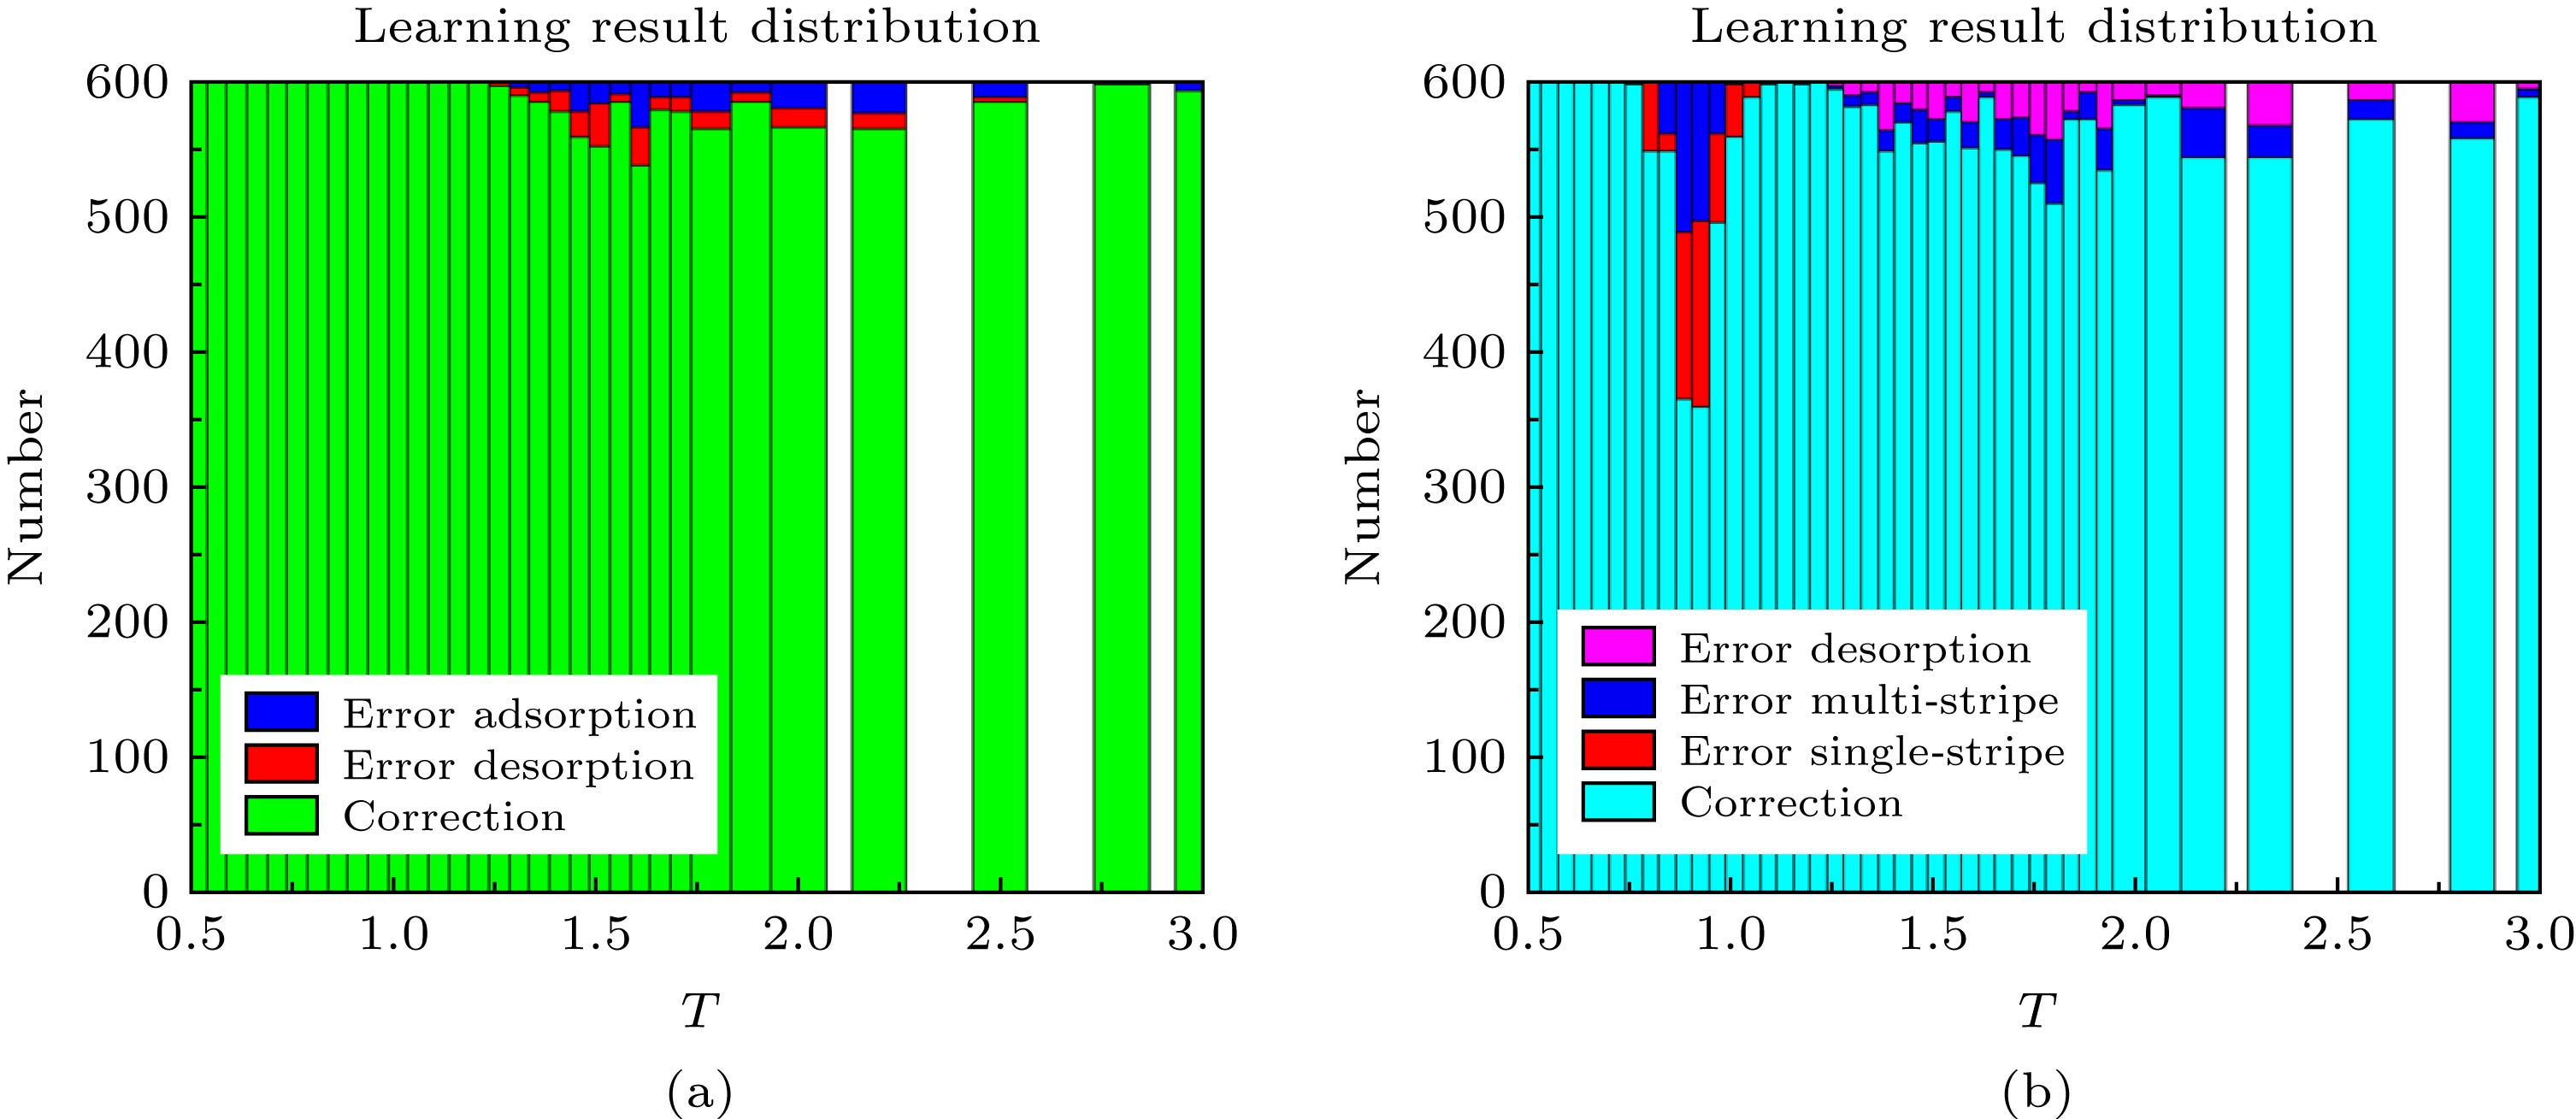 图 7 神经网络学习结果的分布图 (a) 均质表面下的学习结果分布, 绿色表示识别正确的样本, 其他的表示识别错误的样本; (b) 条纹表面下的学习结果分布, 蓝色表示识别正确的样本, 其他的表示识别错误的样本
Figure7. The distribution of neural network learning results: (a) the distribution of learning outcomes on the homogeneous surface, green indicates that the correct sample, and other samples that identify the error; (b) the distribution of learning results on the pattern-stripe surface, blue indicates that the correct sample, and other samples that identify the error.
从图7中可以看出, 识别错误的样本主要集中在临界相变点附近, 这是因为该附近的有限链长样本自身属于哪一个态的典型特征不明显, 容易被识别为相邻状态中的另一个状态, 因此误判的可能性比较高. 该结果也说明了随着临界相变点的增多增加了模式识别的复杂性, 其识别率也随之下降.


