 ,*,??,2)
EXPERIMENTAL INVESTIGATION ON THE EVOLUTION MECHANISM OF UNIFORM MOMENTUM ZONES IN TURBULENT BOUNDARY LAYER1)
Wang Chaowei*, Wang Kangjun*, Li Biaohui*, Jiang Nan,*,??,2)通讯作者: 2) 姜楠,教授,主要研究方向:实验流体力学,湍流. E-mail:nanj@tju.edu.cn
收稿日期:2020-06-27网络出版日期:2021-03-18
| 基金资助: |
Received:2020-06-27Online:2021-03-18
作者简介 About authors

摘要
等动量区是瞬时流场中流体动量接近的局部区域,其生成和分布与相干结构密切相关. 对等动量区的研究有助于更深入认识湍流边界层相干结构,但目前对其演化过程还缺乏实验支持和机理分析. 设计并使用移动式高时间分辨率粒子图像测速技术(TRPIV)系统对光滑平板湍流边界层进行了跟踪测量,用滤波方式对数据进行降噪,结合对直接数值模拟数据的插值结果,获得脉动速度信号. 使用改进方法去掉非湍流的影响,检测边界层内的等动量区,得到其数量的时间序列,结合流向速度概率密度函数分布的变化,分析得出了等动量区的数量在大的时间尺度下从一个稳态到另一个稳态的阶梯状变化特点. 分解不同尺度的脉动速度,对大尺度和小尺度脉动信号进行条件平均,发现大尺度脉动对等动量区数量变化起主要作用,表现为不同速度流体通过发生不同猝发事件改变流向速度概率密度函数分布. 分析流向大尺度脉动空间分布的变化,发现等动量区内常含有多个大尺度脉动区域,不同区域的扩张、收缩、分裂、合并影响流向速度的集中程度,进而导致等动量区数量的变化.
关键词:
Abstract
Uniform momentum zone is one type of local regions where the instantaneous momentum of fluid approaches, and its generation and distribution are closely related to the coherent structure. The study of uniform momentum zone contributes to further understanding of the coherent structure in turbulent boundary layers, but there is still a lack of experimental support and mechanism analysis for the evolution process of uniform momentum zone. The moving TRPIV system was designed and used to measure the velocity fields of the turbulent boundary layer on a smooth surface as it moved downstream. The data is denoised by filtering, and the fluctuating velocity signal is obtained by combining the interpolation results of the direct numerical simulation data. After the influence of non-turbulence removed by an improved method,this thesis detects the uniform momentum zone in turbulent boundary layer, and obtain the time series of its quantity. In combination with the change of the streamwise velocity probability density distribution, the stepwise variation in the number of uniform momentum regions from one steady state to another over large time scales is obtained. The fluctuating velocity of different scales was decomposed, and the conditional average of large-scale and small-scale fluctuation signals were carried out. The results show that the large-scale fluctuations play a major role in the quantity change of the uniform momentum zone, the action mode is that the probability density function distribution of streamwise velocity is changed by different burst events of fluid in different velocities. By analyzing the changes of different fluctuation regions in the streamwise large-scale fluctuation space, it is found that a uniform momentum zone often contains multiple large-scale fluctuation regions. The expansion, contraction, splitting and merging of different large-scale fluctuation regions affect the concentration degree of streamwise velocity, leading to significant changes of the number of uniform momentum zones.
Keywords:
PDF (19261KB)元数据多维度评价相关文章导出EndNote|Ris|Bibtex收藏本文
本文引用格式
王超伟, 王康俊, 李彪辉, 姜楠. 湍流边界层等动量区演化机理的实验研究1). 力学学报[J], 2021, 53(3): 761-772 DOI:10.6052/0459-1879-20-223
Wang Chaowei, Wang Kangjun, Li Biaohui, Jiang Nan.
引言
湍流边界层一直是湍流研究领域的热点.随着实验技术的进步和分析手段的丰富,研究者逐渐发现湍流边界层中分布着不同尺度的相干结构??[1-3].Marusic等?[4] 根据空间流向尺度大小将相干结构分为3类:(1) 尺度约为$100\delta _\nu $($\delta _\nu$为黏性特征长度)量级的内条带结构;(2) 尺度为边界层厚度$\delta $量级的大尺度结构;(3)尺度在10$\delta $量级的超大尺度结构,或者叫超级结构.发卡涡和发卡涡包是最为典型的大尺度相干结构?[2],自从Theodorsen于1952年首次发现发卡涡以来,大量的DNS和实验数据证实了发卡涡的存在??[5-6].Zhou等?[7]通过直接数值模拟发现了发卡涡从生成到演化为发卡涡包的过程:强喷射事件在流向速度梯度作用下演化为主发卡涡,进而诱导产生下游发卡涡、涡腿侧面的准流向涡、二次发卡涡、三次发卡涡等次生发卡涡,这些沿流向排列的发卡涡则构成了发卡涡包结构. Adrian等??[2,6,8-9]应用成熟的粒子图像测速技术(TRPIV)发现了在发卡涡包内多个发卡涡联合诱导作用下,在其下方形成流向大尺度低速流体区域的过程,并指出发卡涡包内涡头连线与壁面的夹角与Head等?[10]观察到的大尺度结构的倾角相符.
大尺度相干结构中的等动量区近年来成为了新的关注焦点.1995年,Meinhart和Adrian?[11]在湍流边界层中观察到了等动量区的存在,他们发现贯穿于整个湍流边界层厚度范围内,存在着一系列瞬时流向速度或者动量近似相等的区域,并将其命名为等动量区(uniform momentum zone,UMZ).作为大尺度结构的一种表现形式?[12],UMZ的流向尺度可以达到数倍的边界层厚度?[6].Adrian等?[6]提出了UMZ的检测方法,该方法将瞬时流向速度的概率密度函数分布中极大值的数目作为等动量区的数目,把极大值作为每个等动量区的特征模态速度,这一检测标准被后来的研究者广泛使用??[13-16].
Adrian等?[6]发现等动量区边界的连线均通过发卡涡包内发卡涡头的中心,推测等动量区与湍流边界层内的相干结构关系密切. Tomkins等?[9]研究认为这种大尺度的等动量区沿流向的分布与发卡涡包内部涡结构的排列分布有着密切的联系.Lee和Sung?[17]通过分析DNS数据,发现沿流向有序分布的一系列发卡涡在拉伸中产生了不同的等动量区. deSilva等??[14-15]在研究中发现等动量区边界处流向速度梯度$\partial U / \partial y$较大,存在着强剪切作用,分布着较强的展向涡量,而展向涡量的集中分布表明该处存在发卡涡等相干结构,进而提出等动量区的形成与发卡涡及发卡涡包的演化和诱导作用密切相关.Laskari等?[16]则认为湍流边界层中等动量区的数量与大尺度的Q2, Q4事件有关.
Thavamani等?[18]研究了Cuvier等?[19]提供的逆压力梯度数据,分析认为随着UMZ数量的增加,UMZ的厚度逐渐减小,宽度逐渐增加. de Silva等?[14] 通过大量实验证明了UMZ数量随雷诺数对数线性增长.Cui等?[20]研究发现在汇聚、发散沟槽表面条件下,湍流边界层内UMZ的数量相对于光滑表面略有减小.
为实现对相干结构更长时间的追踪测量,有一些研究者使用了移动式PIV系统进行跟踪拍摄的实验. Gui等?[21]利用Dantec公司设计的拖曳式PIV系统,在拖曳式水槽中对模型船运动所产生名义尾流区的平均速度和雷诺应力进行了测量,发现该方法在轴向速度、涡量等方面的误差要低于五孔皮托管测量方法.Scarano等?[22]使用水下相机跟踪拍摄了在水槽中以不同攻角进行拖曳的飞行器模型.Chen和Chang?[23]利用移动式PIV系统观测了拖曳于水槽中的潜艇和游轮模型周围的流场.Gao等?[24]设计和使用了移动式层析PIV来跟踪测量三维瞬时速度场的演化和边界层中的相干结构.
现有关于UMZ的研究多基于DNS或传统PIV实验技术获取数据,然后进行统计分析,对UMZ演化的时间特性研究还很少.本文设计和使用了移动式高时间分辨率粒子图像测速技术(TRPIV)系统来跟踪测量UMZ演化的时间历程,该系统可以在流向上以指定速度移动,对特定流场区域进行跟踪测量.本文第一部分介绍了移动式TRPIV的设计和使用,第二部分检测流场中的UMZ,分析其时间演化特性,第三部分从尺度分解、条件平均、脉动空间等角度分析UMZ演化过程的主导因素.
1 实验设备与技术
1.1 实验设施
实验是在天津大学流体力学实验室回流式水槽中进行的,水槽使用变频器控制水箱中的潜水泵对流速进行连续调节,最高流速可达0.4m/s.流体流经稳流段、收缩段达到实验所需流速和湍流度后进入试验段,试验段尺寸为6.2m$\times$0.29m$\times$0.38m(长$\times$宽$\times$高).实验产生湍流边界层所用的光滑平板为亚克力材质,尺寸为4m$\times$0.28m$\times$0.02m,前缘按$4,:,1$椭圆修形,拌线直径为2mm,固定于自前缘起下游0.1m处($x =0.1$,m),以促进湍流的充分发展.平板平行于水槽底面放置,距底面0.06m,平板前缘距试验段入口1m,后缘接尾板,通过改变尾板的倾角实现流动的零压力梯度.1.2 流动参数
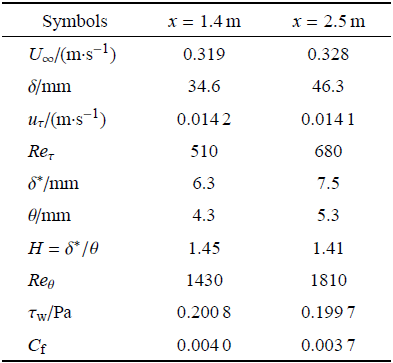
所有实验均在光滑平板条件下进行.移动式TRPIV的拍摄段(即使用移动式TRPIV进行移动拍摄采集数据的范围)为前缘下游1.4m到前缘下游2.5m范围内($x = 1.4$,m$\times$2.5m).试验用示踪粒子为直径$20,\mu$m的空心玻璃微珠,密度$\rho _{p} = 1.03\times 10^3$,kg/m$^3$.实验水温$T =22,^ \circ$C,水的密度$\rho _{w} = 998$,kg/m$^3$,运动黏度系数$\nu = 0.961$m$^2$/s.PIV是实验流体力学常用的实验测量技术??[25-26],移动式TRPIV为经过改造可以在流向方向上运动的TRPIV,其可以将相机停在某流向位置作为静态的TRPIV以获取流动参数.表1展示了位于移动拍摄段首尾即$x = 1.4$,m和$x =2.5$,m两个位置测量所得边界层流动参数,其中$U_{\infty}$为自由来流速度,$\delta $是基于0.99倍自由来流速度的名义边界层厚度. $u_{\tau }$为壁面摩擦速度,通过拟合平均速度剖面对数律区的方法获得??[27-28],对数律公式为$u^ + = 1 /\kappa {ln} y^+ + B$,其中内尺度无量纲流向速度$u^ + = u / u_\tau $,内尺度无量纲壁法向位置$y^+ =yu_{\tau }/ \nu $,$\kappa $为卡门常数,$B$为积分常数,本文中$\kappa = 0.41$,$B = 5.1$,则有$u /u_\tau = 1 /\kappa\ln (yu_\tau / \nu ) + { B}$. 利用残差公式
Table 1
表1
表1边界层参数
Table 1
 |
新窗口打开|下载CSV
计算$u_{\tau } $,当残差取得最小值时的$u_{\tau } $即为所求值. 表1中$Re_\tau$为基于壁面摩擦速 度和边界层厚度的内尺度雷诺数,$Re_\tau = u_\tau \delta / \nu $. $\delta ^\ast$表示位移厚度,$\theta $表示动量厚度,形状因子$H = \delta ^\ast / \theta $,$Re_\theta$表示基于自由来流速度和动量厚度的动量雷诺数,$Re_\theta = U_{\infty} \theta / \nu $. $\tau _{w}$为壁面摩擦切应力,$\tau _{w} = \rho _{w} u_\tau ^2$,再结合自由来流速度可以得到壁面摩擦系数$C_{f} =2\tau _{w} / \rho _{w} U_{\infty} ^2 $.
1.3 移动式TRPIV系统
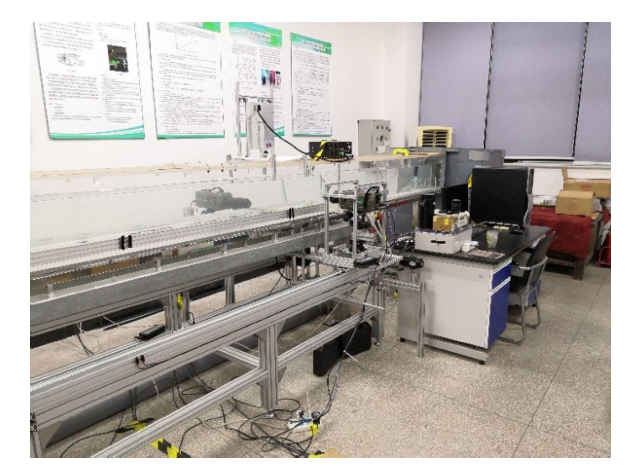
移动式TRPIV系统主要由基座、运动系统、激光器、相机等硬件和运动控制系统、数据采集系统等软件构成,参见图1实物图.图1
 新窗口打开|下载原图ZIP|生成PPT
图1实验装置实物图
Fig. 1Physical picture of the experimental apparatus
基座使用横截面积为80mm$\times$80mm的铝合金型材搭建,尺寸为1.5mm$\times$0.8mm$\times$0.6m(长$\times$宽$\times$高),主要作用为提供支撑和作为运动轨道,基座长边沿水槽流向放置,其长边中心线严格平行于水槽中心线.基座两长边上面各固定一条长1.5m的滑轨,平行于水槽流向中心线,该长度包含运动过程中的加速段、匀速段、减速段,3段行程分别为0.2m,1.1m,0.2m,移动拍摄在匀速段进行.基座高度保证激光器和相机都能处在合适的数据采集法向位置.
运动系统由滑动平台、同步带、伺服电机、动力连杆和限位传感器构成.滑动平台是一个矩形框架,能在基座上沿基座长边中心线方向滑动,组成部分包括构建矩形框架的型材、铝板和处于矩形顶点的4个滑块,滑块的特点是在承压范围内承受竖直方向压力越大,其与滑轨之间的摩擦系数越小.同步带用于传输动力和精确定位,与伺服电机配合下其位移误差约为0.5mm.伺服电机为台达ASDA-B2系列电机,额定输出功率400,W,安装在相机侧下游,通过动力连杆传导扭矩为另一侧提供动力.在基座相机侧的上横梁侧面安置光电开关作为限位装置,防止滑动平台超范围运动发生撞击.
激光器型号为上海科盈光电公司的GL532T7-3000-PSD,点激光最大输出功率为3000mW,输出波长为532,nm. 激光器固定在型材组建的长方体笼架中,而笼架固定在滑动平台下,位于水槽正下方,激光面竖直放置且与水槽中线重合. 调节激光器高度使得激光面恰好完全包含相机拍摄区域,实验中激光面厚度1mm.
实验使用Dantec公司的Speedsence 2000系列相机,其拍摄范围包含整个边界层,视窗实际物理尺寸为92.1mm$\times$53.1mm,(流向$\times$法向). 相机通过型材、升降台、云台与滑动平台相连,可以实现空间上3个平移维度和3个旋转维度的调节. 相机镜头垂直于激光面,相机两侧使用与相机相连的型材框架作为阻尼器,以减小变速运动造成的相机震颤.
运动控制系统的信号控制箱和控制软件为天津大学流体力学实验室制作和编写,可以通过控制伺服电机输出实现对相机运动参数的控制. 根据速度-时间曲线的不同特点,运动模式有匀加速的梯形,变加速的S型等,实验时采用运动更为平稳的S型运动,相机在经历加速运动后以匀速进入拍摄段. 数据采集系统为Dantec公司的商业PIV系统Dynamics Studio 6.8系统,与Speedsence2000系列相机配套使用.
1.4 数据降噪
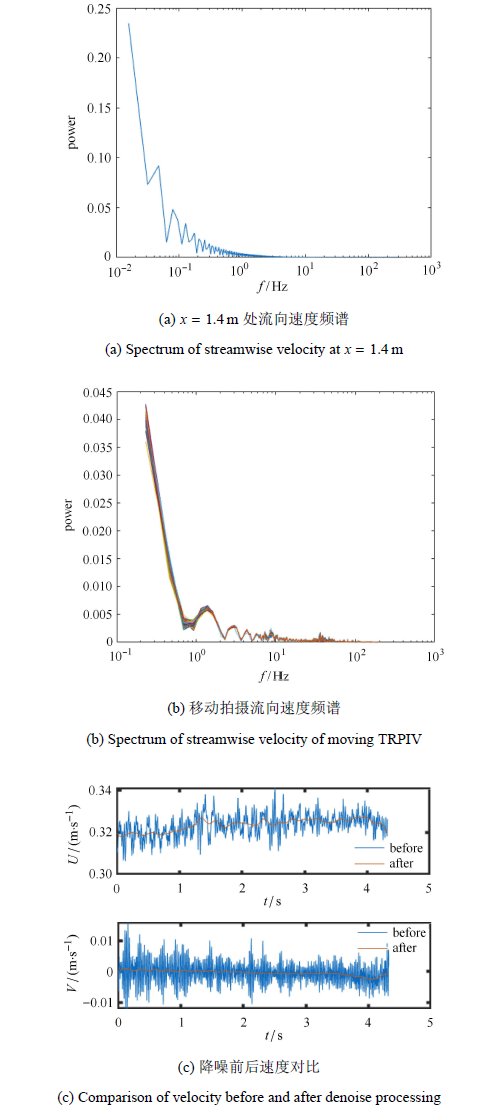
等动量区的概念基于瞬时流向速度的概率密度函数?[6, 11, 29],那么获得准确的瞬时速度场信号就是至关重要的. 本文使用移动式TRPIV系统对湍流边界层进行跟踪拍摄,虽然实验设计时已将运动时的机械振动降到最低,但相机在拍摄段进行匀速直线运动时还是不可避免的存在细微的机械振动,因此相对于固定位置相机,其采集的信号包含了相机运动中的小幅振动带来的噪声,在分析瞬时速度信号之前需要对其进行降噪处理.分别取$x = 1.4$,m和$x = 2.5$,m处静态采集瞬时速度场的自由来流部分,进行空间平均,得到自由来流部分瞬时速度空间平均值的时间序列,再沿时间方向对该序列做傅里叶变换,获得其频谱分布,图2(a)展示了$x = 1.4$,m处静态拍摄数据的频谱结果,从图中可以看到信号集中在小于5,Hz的低频区域. 对多组移动拍摄数据进行上述相同的操作, 求平均后获得其频谱分布如图2(b)所示.
图2
 新窗口打开|下载原图ZIP|生成PPT
图2截断频率选取与降噪效果
Fig. 2Truncation frequency selection and noise reduction effect
在本文实验中,相机迁移速度$U_{c} = 0.85U_{\infty}$,则以移动中的相机为参考系的自由来流速度为实际自由来流速度的0.15倍,即$0.15U_{\infty}$,那么根据多普勒效应,动态测量的自由来流速度的脉动频率应为固定测量的0.15倍,因此在动拍数据中取截断频率$f_{c}= 0.75$,Hz.对瞬时速度场中自由来流部分流场做空间平均,得到一个平均值,而对整个数据组每个瞬时的自由来流部分流场都进行空间平均操作则可得到自由来流部分空间平均值的时间序列,对该时间序列进行高通滤波,可得到脉动噪声的时间序列,而机械振动噪声也是高频的,那么对每个瞬时速度场原始信号减去噪声序列中对应于该瞬时的噪声信号则可得到降噪后的流动信号.得到的降噪后的瞬时法向速度场即为所求,得到的瞬时流向速度场再加上相机迁移速度(本次实验中$U_{c}=0.85U_{\infty})$后得到实际的瞬时流向速度场,图2(c)即反映了自由来流部分瞬时流向速度和瞬时法向速度空间平均值的时间序列在降噪处理前后的变化,其中瞬时流向速度信号加上了相机迁移速度$U_{c} =0.85U_{\infty}$.本文中的分析结果对降噪处理的截断频率并不敏感,截断频率取0.1$\sim$5,Hz依旧能得到相同的分析结论.
1.5 脉动速度的获取
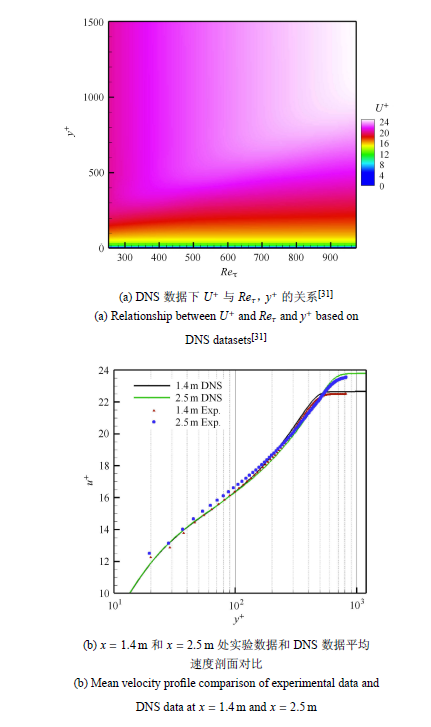
移动式TRPIV中相机跟随边界层移动,其每帧数据的采集位置都是不同的,而又无法做到在每个时刻的位置都大量采集数据获取时间平均速度场,为获得脉动速度以进行后续的分析,本文采用了DNS数据插值的方法获取平均速度场.Schlatter等?[30]做了大量不同雷诺数下的直接数值模拟, 本文使用了 其在,$Re_{\tau } =(252.25/359.38/$$492.21/671.12/830.01/974.18)$条件下的6组无量纲化速度剖面数据,在此基础上使用3次样条插值构建了无量纲化平均流向速度$U^+ $关于内尺度雷诺数$Re_{\tau } $和无量纲化壁法向位置$y^ + $的函数,即
图3(a)展示了插值结果.
图3
 新窗口打开|下载原图ZIP|生成PPT
图3DNS和实验数据中的流向速度剖面变化特点
Fig. 3Characteristics of streamwise velocity profile in DNS and experimental datasets
?rlü等?[31]在其研究中采用DNS数据指出: 随着湍流的发展,边界层厚度随雷诺数线性增大. 根据定义知道$Re_\tau = u_\tau \delta / \nu $,参考表1可以看到$u_\tau$在首尾位置的数值相差很微小,同时由于本实验的流体$\nu $是固定值,而$\delta $是$x$的线性函数,综合来看可以知道$Re_\tau$与$x$的关系也是线性的,由此可以得到本文实验中内尺度雷诺数$Re_\tau $与流向位置$x$呈线性关系,即
式中,$x$表示流向位置,$x_{1.4} $,$x_{2.5} $分别为$x = 1.4$,m和 $x = 2.5$,m位置处,$Re_{\tau x} $表示流向位置$x$处的内尺度雷诺数,$Re_{\tau 1.4} $,$Re_{\tau 2.5}$分别为$x = 1.4$,m和$x = 2.5$,m 处的内尺度雷诺数.
图3(b)展示了$x = 1.4$,m和$x = 2.5$,m两处实验数据所得无量纲化平均速度剖面与对应雷诺数下插值数据所得剖面的对比.
因此建立了以下获取脉动速度的过程:移动拍摄某一瞬时$t$对应于流向位置$x=U_{c} t$,将$x$代入式(2),得到其对应的内尺度雷诺数$Re_{\tau x} $,然后将$Re_{\tau x} $代入式(2)中,得到对应的无量纲化流向速度剖面,将剖面截取和移动拍摄窗口相同的$y^+$范围,将该剖面扩展为充分发展,平均速度与流向位置无关的与移动拍摄视窗等尺寸的流场,即流向速度剖面沿流向位置处处一致,由此得到的速度场作为该瞬时对应的平均流向速度场,以该时刻的瞬时流向速度减去该时刻的流向平均速度得到对应的流向脉动速度. 而在法向上,时间平均的法向速度场即为0,那么法向脉动速度就等于了法向瞬时速度.
2 等动量区的检测与特点描述
2.1 检测等动量区
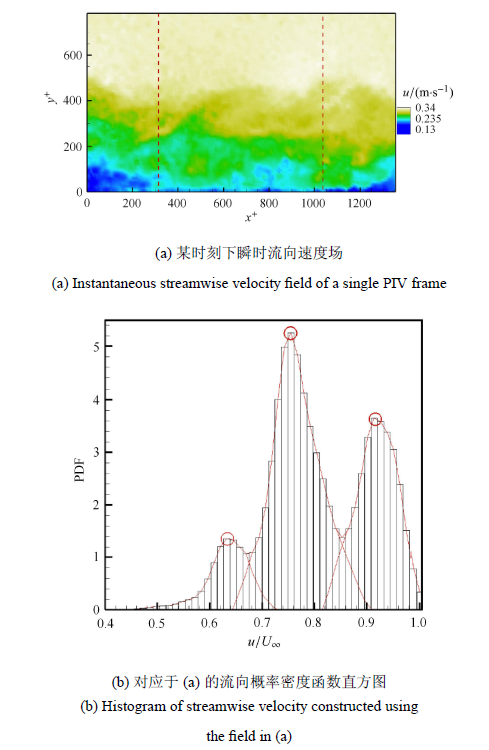
根据定义,在一个等动量区内,流体的流向速度大致相同,据此,Adrian等?[6]基于瞬时流向速度概率密度函数(probabilitydensityfunction,PDF),提出了等动量区的检测方法,即以流向速度PDF中的局部峰值来表征瞬时速度场中出现的UMZ.PDF极大值所对应的流向速度和等动量区内的流向动量密切相关,Adrian的定义中将其作为UMZ的模态速度.图4(a)展示了某一时刻下的瞬时流向速度场,对图4(a)中的检测区域做统计得到的流向速度PDF直方图,即图4(b).值得说明的是此处参照了deSilva等?[14, 32]对UMZ检测方式的改进,在统计之前首先使用湍流/非湍流分界面(turbulent/non-turbulentinterface,TNTI)去除了边界层之外的非湍流部分,避免该区域的流体带来伪模态速度,图中3个圈出的极大值对应于3个模态速度,在图2(a)中也以不同颜色显示出了与之对应的3个等动量区.图4
 新窗口打开|下载原图ZIP|生成PPT
图4等动量区检测方法说明
Fig. 4Illustration of detection criterion for UMZs
应当特别说明的是等动量区检测过程中,检测区域流向长度$L_x $的选取对结果有一定的影响,deSilva等?[14]对此 进行了深入的研究,发现高雷诺数工况下的检测以及模态速度的获取过程对$L_x$的选取更为敏感,选取范围过大过小都会 影响检测结果,更多详情讨论参见de Silva等?[14]的研究. deSilva肯定了Adrian等?[6]取边界层厚度量级的视窗流向长度作为检测区域的流向长度是合理的,他在进一步分析中也使用了这样的长度.检测区域流向长度的选取与雷诺 数相关,依据de Silva等?[14]的研究,本文选取了$L_x =\delta $作为检测区域流向长度,检测区域在视野中居中,相对 位置参见图4(a)中红色框线中间部分.此外,本文研究重点是等动量区的数量,其本身对$L_x $敏感度较低,其次本文实验雷诺数较低,进一步降低了影响,并且下文中也会对检测得到的等动量区数量信息进行降噪处理.因此,本文已选取了合适 的检测范围,并把$L_x $对检测结果的影响降到最低.
2.2 等动量区的时间特性
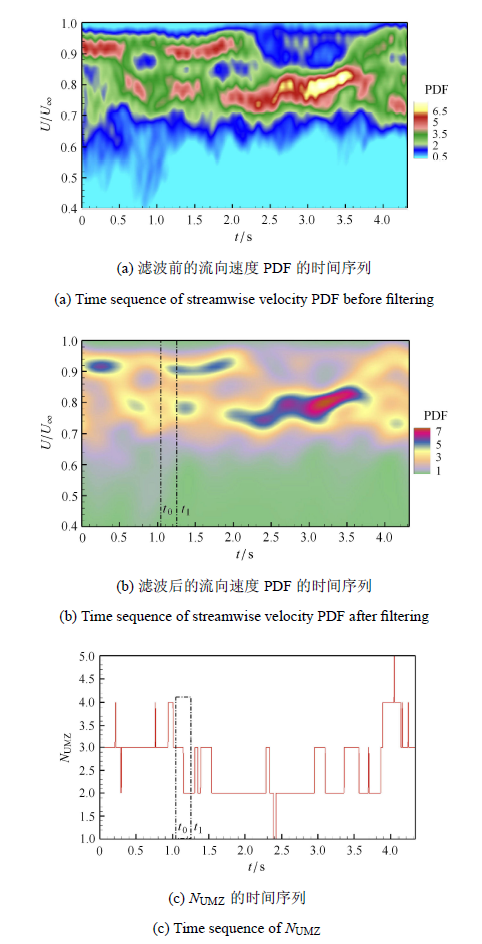
使用2.1节介绍的检测准则,对一组移动拍摄数据所有瞬时速度场进行检测,得到湍流边界层内等动量区数量($N_{UMZ} )$的时间序列,以此来分析其时间变化特点. UMZ由于其定义本身带来的截断误差和瞬时速度场中检测范围的选取带来的偶然因素等影响,直接检测得到的$N_{UMZ} $时间序列表现出强烈的震荡特点,且相对振幅很大,这也是现有对UMZ的分析常常局限于使用统计平均方法的重要原因. 图5(a)从流向速度PDF的时间序列云图的角度展示了这种高频震荡带来的影响.图5
 新窗口打开|下载原图ZIP|生成PPT
图5$N_{UMZ} $与流向速度PDF的变化
Fig. 5Changes of $N_{UMZ} $ and streamwise velocity PDF
图5
 新窗口打开|下载原图ZIP|生成PPT
图5$N_{UMZ} $与流向速度PDF的变化(续)
Fig. 5Changes of $N_{UMZ} $ and streamwise velocity PDF (continued)
$N_{UMZ}$时间序列的这种震荡特点不利于找到其真正的变化趋势和特点,因此本文首先对流向速度PDF的时间序列沿时间进行频域的低通滤波处理(与前文降噪处理相似,参见1.4节),此处根据流向速度PDF的时间序列沿时间所求频谱分布,选取了截断频率$f_{c} = 2$,Hz. 图5(b)展示了处理后的流向速度PDF的时间序列云图.然后再从处理后的流向速度PDF中检测每个瞬时的$N_{UMZ}$,图5(c)为该组动拍数据对应的$N_{UMZ}$的时间序列.这样处理的依据是流向速度PDF中某个速度范围的占比是大量采样点数据的统计结果,在时间方向上不应该有高频的震荡特点,因此将流向速度PDF沿时间方向的高频信号作为误差和噪声去除.
从图5(c)中可以看到$N_{UMZ}$在大的时间尺度下表现出的时间特性为从一个稳态变化到另一个稳态的阶梯状特点(本文所取数据为从较稳定的3变化到较稳定的2). 而$N_{UMZ}$由一个较为稳定的数量变到另一个较为稳定的数量的过程正是 本文要研究的重点,此处取了较为典型的$t =1.05$$\sim$1.25,s阶段(图5(b)和图5(c)中点划线 框部分)做分析,令$t_0 = 1.05$,s,$t_1 =1.25$,s,在其中均匀插入4个采样时刻,则采样时间间隔
包括$t_0 $和$t_1 $在内共6个采样时刻来描述其变化过程.UMZ的定义基于流向速度的PDF,那么用6个采样 点的流向速度PDF能够在统计意义上很好地反映$t_0 \sim t_1 $阶段在流向上发生的变化,图5(d)反映了这种变化.
结合图5(c)和图5(d)可以看到伴随着$N_{UMZ}$由稳定的3变化到稳定的2的过程,流向速度PDF由低值的三峰(图5(d);中绿色圆圈出的 极大值Ⅰ,Ⅱ, Ⅲ)演变为高值的双峰(极大值Ⅳ, Ⅴ),流向速度分布范围逐渐收窄,其分布愈发集中(图5(b)中$t_0\sim t_1 $阶段也清晰地显示了这种逐渐集中的变化).
分类型来看,不同速度的流体呈现出鲜明而不同的变化特点,以无量纲流向速度$U / U_{\infty}$为标准,从$t_0$到$t_1 $的过程中,表现出的不同特点如下:(1) $U / U_{\infty}$ < 0.75的低速流体的占比近似单调下降;(2)0.75 < $U / U_{\infty}$ < 0.82的中速流体占比单调增长,甚至于由双波峰之间的波谷增长为新的稳定波峰;(3) $0.82 <U / U_{\infty} < 1$的中高速流体分布走势近似整体单调左移,向中速靠拢,以$U / U_{\infty} \approx 0.91$的极大值逐渐升高和左移,3种不同特点归纳来看表现为流体速度向中速集中靠拢.
这些统计意义上的变化特点在结构上往往体现为大尺度结构的运动和演化,同一大尺度结构中的流体以相近速度进行迁移. Adrian等?[6]认为不同涡由于空间相干性构成更大尺度的流场区域,由此带来了UMZ,并进一步认为UMZ是以发卡涡和发卡涡包为代表的大尺度结构迁移和演化的结果. Laskari等?[16]的研究认为UMZ的数量与大尺度猝发事件相关. 而UMZ本身就是一种以相近动量划分的不规则的大尺度区域,由此可以看出UMZ与大尺度结构的密切关系,因此应该从大尺度结构的变化中分析$N_{UMZ}$变化的原因和机理.
3 大尺度结构对等动量区数量的影响
3.1 空间尺度分解
湍流边界层是由多尺度结构共同构成的?[4],为了区分不同尺度的结构,需要对脉动速度做尺度分解. 常见的尺度分解方法有小波分解,POD分解,空间滤波等,本文采用了基于空间傅里叶变换的空间滤波方法. 空间滤波方法与频域滤波方法类似,区别在于一个作用于时间/频率维度,一个作用于空间维度. 具体方法为首先将脉动速度沿流向进行傅里叶变换,大尺度结构流向长度一般在边界层厚度量级?[4],因此在波数空间内以$\lambda_x $作为截断波长,其中$\lambda _x / \delta = 1$,将波长小于$\lambda _x$的部分的幅值设为0,然后进行逆傅里叶变换,再取其实部即得到相应的大尺度信号,而波长小于$\lambda _x $的部分为相应的小尺度信号. 所得分解结果与Hutchins等?[29]采用泰勒冻结假设对热线风速仪的时间速度信号做尺度分解的结果相一致.3.2 对脉动速度的条件平均
在3.1节中揭示了在$N_{UMZ} $由大变小的过程中,流向速度PDF的集中化趋势. 为进一步分析变化原因,本节通过分析各个速度范围流体群的运动趋势来探究其变化过程. 首先在$(0.4\sim 0.99)U_{\infty}$速度范围内平均划分出50个二级范围,划分方式与2.1节中计算流向速度PDF对$u$的划分一致,即特别地取$u_0 = 0.4U_{\infty}$,$u_{50} = 0.99U_{\infty}$,然后以瞬时流向速度为条件对流向脉动速度做条件平均,条件平均是常用的分析手段?[33]. 以对大尺度流向脉动速度的条件平均为例,公式为
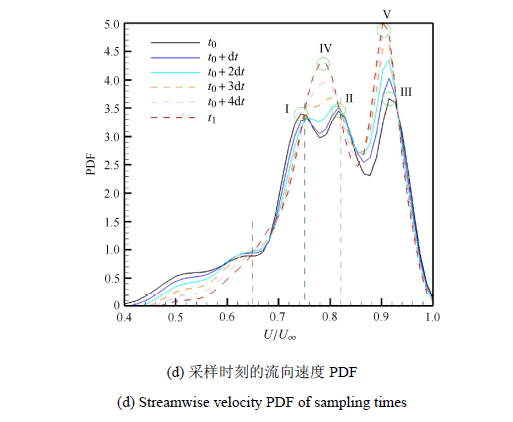
其中${u}'_{L} $为大尺度流向脉动速度. 对大尺度法向、小尺度流向、小尺度法向的计算 公式与 式(6)类似.得到的结果如图6所示.图6(a),$\sim$图6(d)分别为6个采样时刻的流向大尺度、法向大尺度、流向小尺度、流向小尺度的条件平均结果,分别用符号${u}'_{L} $,${v}'_{L} $,${u}'_{S} $,${v}'_{L} $表示.
图6
 新窗口打开|下载原图ZIP|生成PPT
图6条件平均下的不同尺度脉动速度
Fig. 6Conditional average fluctuating velocity of multiple scales
从以图6(a)为典型的图6中可以看到不同尺度和方向的结果均表现出混乱的状态. 如果把时间范围拉长之后就会发现这种看起来混乱的过程正是从一个稳态到另一个稳态的过渡变化过程,观察图6(a)和图6(b)中代表较早时刻的曲线可以发现两个明显的分类型特点:(1) $U / U_{\infty} < 0.6$的低速流体的大尺度脉动呈现${u}'_{L} <0$,${v}'_{L} > 0$的特点,对应于Q2事件,即喷射事件,作用是把低速流体带离壁面,冲向较高法向位置的中速流体中,这就在统计意义上解释了2.2节中的流向速度PDF的阶段性特点(1)和(2);(2) $U / U_{\infty} >0.8$的中高速流体的大尺度脉动呈现出${u}'_{L} > 0$,${v}'_{L} <0$的特点,对应于Q4事件,即扫掠事件,作用是把高速流体由高法向位置带向较低法向位置的中速流体中,这就在统计意义上解释了2.2节中的流向速度PDF阶段性特点(3).
然而观察图6(c)描述的流向小尺度脉动变化,可以看到几乎所有采样时刻所有流速下的流体群都表现出负的脉动速度,只有零星时刻的零星流体在条件平均之下的流向小尺度脉动有${u}'_{S} > 0$. 观察图6(d)描述的法向小尺度脉动变化,几乎只有无量纲流向速度在$0.65 < U / U_{\infty} < 0.75$范围的法向小尺度脉动速度${v}'_{S} <0$,这样的分布显然无法匹配和解释2.2节中的流向速度PDF的变化特点.
3.3 流向大尺度脉动的迁移
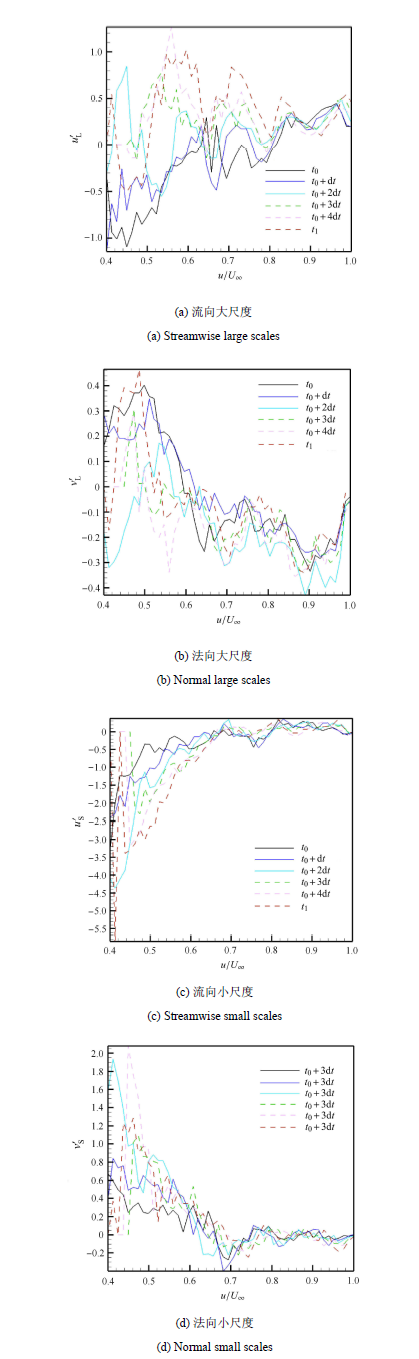
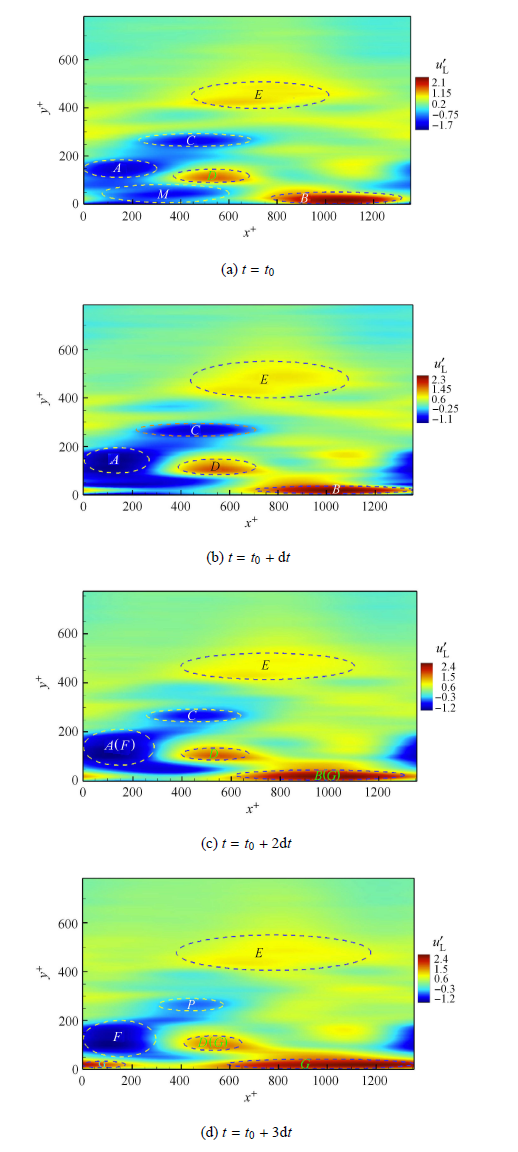
去除了脉动成分的理想状态平均流向速度场的PDF中没有极值,也检测不出任何的UMZ?[14].UMZ的流向尺度通常很大,在法向上也有一定范围跨度,其内部流体的流向速度相近.那么在空间上,相比于理想平均流场中流向速度沿法向位置的单调增长,跨越不同法向位置而内部流体流向速度高度相近的等动量区,在其内部必然存在着位于低法向位置的高速脉动和位于高法向位置的低速脉动,共同向该等动量区的中速靠拢,并组成在流向速度PDF中的极大值.湍流边界层内$N_{UMZ} $的变化应该在流向脉动速度的空间分布变化中有对应的体现.通过条件平均的方法,3.2节中已经分析得出了等动量区数量变化主要是和大尺度脉动的猝发作用相关的结论.本节将研究$N_{UMZ}$变化过程中流向大尺度脉动的空间分布变化,所分析大尺度脉动是通过空间滤波方法对脉动速度进行尺度分解得到的,具体方法参加3.2节的介绍.图7(a)$\sim$图7(f)分别展示了$t_0sim t_1 $时间段内6个采样时刻对应的流向大尺度脉动空间分布.
图7
 新窗口打开|下载原图ZIP|生成PPT
图7大尺度流向脉动速度
Fig. 7Streamwise fluctuating velocity of large scales
图7
 新窗口打开|下载原图ZIP|生成PPT
图7大尺度流向脉动速度(续)
Fig. 7Streamwise fluctuating velocity of large scales (continued)
图7(a)中圈出了$A$和$C$两个低速脉动区域,$B, D,E$三个高速脉动区域,结合图3,将几个圈出区域的脉动速度和瞬时速度进行空间区域分布的对比,再结合图5(c)中圈出的不同时刻流向速度PDF的极大值所在速度区间,可以判断:低速脉动$A$和高速脉动$B$是极大值I的组成部分;低速脉动$C$和高速脉动$D$是极大值II的组成部分;高速脉动$E$是极大值Ⅲ的组成部分.
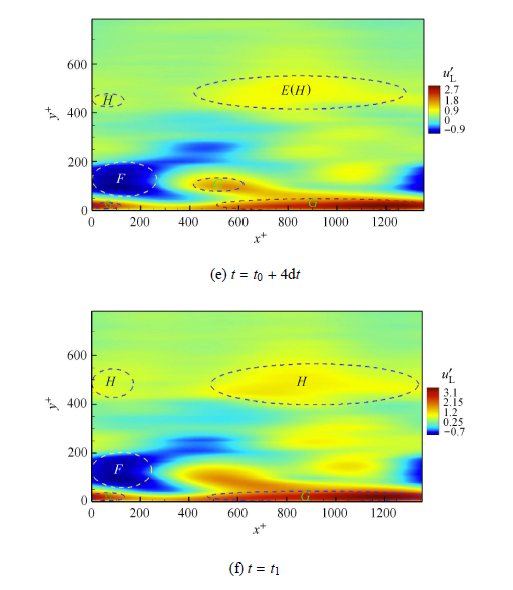
图7(f)对应的$t = t_1 $时刻$N_{UMZ} = 2$,其后的时间$N_{UMZ}$保持相对稳定,与之对应的流向速度PDF中稳定呈现两个极大值.参照图3(b)和图5(c)可以判断,图7(f)中的低速脉动$F$和高速脉动$G$是图5(c)中极大值Ⅳ的组成部分,高速脉动$H$是极大值Ⅴ的组成部分.
图7(a)$\sim$图7(f)中的高速和低速脉动区域一直处在变化之中,其中分别处于$t = t_0 $时刻的图7(a)和处于$t = t_1 $时刻的图7(f)是较为稳定的形态,图7(b)$\sim$图7(e)是过渡过程中不同时刻的状态.观察这种过渡变化可以看到低速脉动$A$逐渐扩大,$C$则逐渐缩小直至被$A$完全吸收合并,此外,图7(a)中的低速脉动$M$对应于$t = t_0 $时刻流向速度PDF中$U / U_{\infty}!<\!0.6$部分的分布,可以看到$M$也迅速被$A$所吸纳,$A$自身范围的扩大加上对$C$和$M$的吸收合并,逐渐发展为低速脉动$F$.高速脉动$B$逐渐扩大并吸收高速脉动$D$,进而演变为高速脉动$G$.而低速脉动$F$和高速脉动$G$对应于极大值IV.高速脉动$E$逐渐扩大,演变为高速脉动$H$,而$H$对应于极大值V.
由此可以看到脉动区域($A, C, M$)、($B,D$)合并和演化到脉动区域$F$和$G$的过程在脉动空间上解释了极大值I,II合并演化为极大值IV的过程,也就是2.2节中的流向 速度PDF的阶段性特点(1)和(2).脉动区域$E$扩大为$H$的过程表示了$0.82 < U / U_{\infty} <0.99$的中高速流体内中速流体占比的逐渐增加,也就在脉动空间上解释了$0.82 < U / U_{\infty} <0.99$部分的中高速流体在流向速度PDF中逐渐向中速部分偏移的过程,也就是2.2节中的流向速度PDF阶段性特点(3).
4 结论
本文通过移动式TRPIV对光滑平板湍流边界层进行了跟踪拍摄,分析了等动量区的时间特性,从大、小尺度脉动条件平均,空间分布等方面对等动量区数量变化机理进行了研究,得出以下结论:(1) 等动量区数量在大的时间尺度上表现出阶梯状特点,其变化方式为从一个稳定数值到另一个稳定数值.
(2) 等动量区数量变化与大尺度脉动关系密切,与小尺度脉动关系不大. 从统计意义讲,大尺度脉动通过猝发事件改变流向速度集中度,从而改变等动量区数量.
(3) 等动量区内部常包含不同的高低速大尺度脉动区域,不同脉动区域的扩大、缩小、融合、拆分导致了流向速度概率密度函数中极大值的变化,进而引起等动量区数量的变化.
参考文献 原文顺序
文献年度倒序
文中引用次数倒序
被引期刊影响因子
DOIURL [本文引用: 1]
DOIURL [本文引用: 2]
[本文引用: 1]
[本文引用: 1]
[本文引用: 3]
DOIURL [本文引用: 1]
DOIURL [本文引用: 9]
DOIURL [本文引用: 1]
DOIURL [本文引用: 1]
DOIURL [本文引用: 2]
DOIURL [本文引用: 1]
DOIURL [本文引用: 2]
[本文引用: 1]
[本文引用: 1]
DOIURL [本文引用: 1]

The identification of uniform momentum zones in wall-turbulence, introduced by Adrian, Meinhart & Tomkins (J. Fluid Mech., vol. 422, 2000, pp. 1-54) has been applied to turbulent channel flow, revealing a large 'core' region having high and uniform velocity magnitude. Examination of the core reveals that it is a region of relatively weak turbulence levels. For channel flow in the range Re-tau = 1000-4000, it was found that the 'core' is identifiable by regions bounded by the continuous isocontour lines of the streamwise velocity at 0.95U(CL) (95% of the centreline velocity). A detailed investigation into the properties of the core has revealed it has a large-scale oscillation which is predominantly anti-symmetric with respect to the channel centreline as it moves through the channel, and there is a distinct jump in turbulence statistics as the core boundary is crossed. It is concluded that the edge of the core demarcates a shear layer of relatively intense vorticity such that the interior of the core contains weakly varying, very low-level turbulence (relative to the flow closer to the wall). Although channel flows are generally referred to as 'fully turbulent', these findings suggest there exists a relatively large and 'quiescent' core region with a boundary qualitatively similar to the turbulent/non-turbulent interface of boundary layers, jets and wakes.
DOIURL [本文引用: 7]
DOIURL [本文引用: 1]
DOIURL [本文引用: 3]
DOIURL [本文引用: 1]
Direct numerical simulation of a turbulent boundary layer was performed to investigate the spatially coherent structures associated with very-large-scale motions (VLSMs). The Reynolds number was varied in the range Re(theta) = 570-2560. The main simulation was conducted by using a computational box greater than 50 delta(o) in the streamwise domain, where delta(o) is the boundary layer thickness at the inlet, and inflow data was obtained from a separate inflow simulation based on Lund's method. Inspection of the three-dimensional instantaneous fields showed that groups of hairpin vortices are coherently arranged in the streamwise direction and that these groups create significantly elongated low-and high-momentum regions with large amounts of Reynolds shear stress. Adjacent packet-type structures combine to form the VLSMs; this formation process is attributed to continuous stretching of the hairpins coupled with lifting-up and backward curling of the vortices. The growth of the spanwise scale of the hairpin packets occurs continuously, so it increases rapidly to double that of the original width of the packets. We employed the modified feature extraction algorithm developed by Ganapathisubramani, Longmire & Marusic (J. Fluid Mech., vol. 478, 2003, p. 35) to identify the properties of the VLSMs of hairpin vortices. In the log layer, patches with the length greater than 3 delta-4 delta account for more than 40% of all the patches and these VLSMs contribute approximately 45% of the total Reynolds shear stress included in all the patches. The VLSMs have a statistical streamwise coherence of the order of similar to 6 delta; the spatial organization and coherence decrease away from the wall, but the spanwise width increases monotonically with the wall-normal distance. Finally, the application of linear stochastic estimation demonstrated the presence of packet organization in the form of a train of packets in the log layer.
DOIURL [本文引用: 1]
[本文引用: 1]
DOIURL [本文引用: 1]
DOIURL [本文引用: 1]
A towed PIV system designed by DANTEC Measurement Technology for the Iowa Institute of Hydraulic Research towing tank is commissioned by measuring the mean velocity and Reynolds stresses at the nominal-wake plane of a model-scale ship. The mean velocities are compared with previous 5-hole pitot probe data. Uncertainty assessment following standard procedures is used to quantify the comparisons and reach conclusions regarding the quality of the data. The PIV results are analyzed with regard to axial velocity defects, axial vorticity, and level, pattern and anisotropy of turbulence. Quantitative comparisons with 5-hole pitot data shows that PIV uncertainties are about 1% lower than those for 5-hole pitot. However, data differences are larger than RSS of PIV and 5-hole pitot uncertainties for the axial and vertical velocity components, indicating unaccounted for bias and precision limits. The bias error of the pitot probe in a shear flow is discussed, and a method for reducing the bias error is suggested. The data is being used for verification and validation of RANS simulation of DTMB Model 5512.]]> A towed PIV system designed by DANTEC Measurement Technology for the Iowa Institute of Hydraulic Research towing tank is commissioned by measuring the mean velocity and Reynolds stresses at the nominal-wake plane of a model-scale ship. The mean velocities are compared with previous 5-hole pitot probe data. Uncertainty assessment following standard procedures is used to quantify the comparisons and reach conclusions regarding the quality of the data. The PIV results are analyzed with regard to axial velocity defects, axial vorticity, and level, pattern and anisotropy of turbulence. Quantitative comparisons with 5-hole pitot data shows that PIV uncertainties are about 1% lower than those for 5-hole pitot. However, data differences are larger than RSS of PIV and 5-hole pitot uncertainties for the axial and vertical velocity components, indicating unaccounted for bias and precision limits. The bias error of the pitot probe in a shear flow is discussed, and a method for reducing the bias error is suggested. The data is being used for verification and validation of RANS simulation of DTMB Model 5512.]]> A towed PIV system designed by DANTEC Measurement Technology for the Iowa Institute of Hydraulic Research towing tank is commissioned by measuring the mean velocity and Reynolds stresses at the nominal-wake plane of a model-scale ship. The mean velocities are compared with previous 5-hole pitot probe data. Uncertainty assessment following standard procedures is used to quantify the comparisons and reach conclusions regarding the quality of the data. The PIV results are analyzed with regard to axial velocity defects, axial vorticity, and level, pattern and anisotropy of turbulence. Quantitative comparisons with 5-hole pitot data shows that PIV uncertainties are about 1% lower than those for 5-hole pitot. However, data differences are larger than RSS of PIV and 5-hole pitot uncertainties for the axial and vertical velocity components, indicating unaccounted for bias and precision limits. The bias error of the pitot probe in a shear flow is discussed, and a method for reducing the bias error is suggested. The data is being used for verification and validation of RANS simulation of DTMB Model 5512.]]> A towed PIV system designed by DANTEC Measurement Technology for the Iowa Institute of Hydraulic Research towing tank is commissioned by measuring the mean velocity and Reynolds stresses at the nominal-wake plane of a model-scale ship. The mean velocities are compared with previous 5-hole pitot probe data. Uncertainty assessment following standard procedures is used to quantify the comparisons and reach conclusions regarding the quality of the data. The PIV results are analyzed with regard to axial velocity defects, axial vorticity, and level, pattern and anisotropy of turbulence. Quantitative comparisons with 5-hole pitot data shows that PIV uncertainties are about 1% lower than those for 5-hole pitot. However, data differences are larger than RSS of PIV and 5-hole pitot uncertainties for the axial and vertical velocity components, indicating unaccounted for bias and precision limits. The bias error of the pitot probe in a shear flow is discussed, and a method for reducing the bias error is suggested. The data is being used for verification and validation of RANS simulation of DTMB Model 5512.]]>
DOIURL [本文引用: 1]
DOIURL [本文引用: 1]
DOIURL [本文引用: 1]
[本文引用: 1]
[本文引用: 1]
[本文引用: 1]
[本文引用: 1]
[本文引用: 1]
[本文引用: 1]
URL [本文引用: 1]
在低速风洞中来流速度一定的情况下使用IFA300恒温热线风速仪测量了光滑表面和两种不同尺寸的脊状表面湍流边界层平均速度分布剖面,并验证了试验段湍流发展的充分性;通过应用Spalding壁面公式使用最小二乘法精准拟合了实验测量的边界层内层速度分布曲线,得到了湍流边界层壁面摩擦速度并进一步求得湍流壁面摩擦应力,较准确地计算出脊状表面的虚拟原点位置,并通过与对数律公式拟合结果比较分析,证实了该方法更加准确有效. 最后分别计算了3种实验模型的湍流边界层动量损失厚度. 通过对比脊状表面与光滑表面动量损失厚度和壁面摩擦应力,反映了动量损失厚度的大小与壁面摩擦应力的大小具有一致性,充分证实了脊状表面在湍流中具有一定的减阻效果.
[本文引用: 1]
DOIURL [本文引用: 2]
DOIURL [本文引用: 1]
[本文引用: 1]
DOIURL [本文引用: 1]
[本文引用: 1]
[本文引用: 1]
