HTML
--> --> -->In the present paper, the fission fragment mass yields (FMY) are obtained by an approximate solution of the eigenproblem of a three-dimensional collective Hamiltonian, of which the coordinates correspond to the fission, neck, and mass-asymmetry modes. The model presented here is described in detail in Refs. [11-13]. The potential energy surfaces (PES) of fissioning nuclei are obtained by the macroscopic-microscopic (mac-mic) method, in which the Lublin-Strasbourg Drop (LSD) model [14] has been used for the macroscopic part of the energy (
The paper is organized in the following way. In Sect. II, we first present the details of the shape parametrization and the theoretical model. Then we show the collective potential energy surface evaluated within the mac-mic model for the selected isotopes, and our estimates of the fission barrier heights. The calculated FMYs are compared with the existing experimental data in Sect. III. The estimates of FMYs for Th isotopes and their dependence on two adjustable parameters are further discussed in detail in Sect. IV. Conclusions and perspectives of further investigations are presented in Sect. V.
2
A.Fourier nuclear shape parametrization
A typical shape for a nucleus on its way from saddle to scission configuration is shown in Fig. 1, where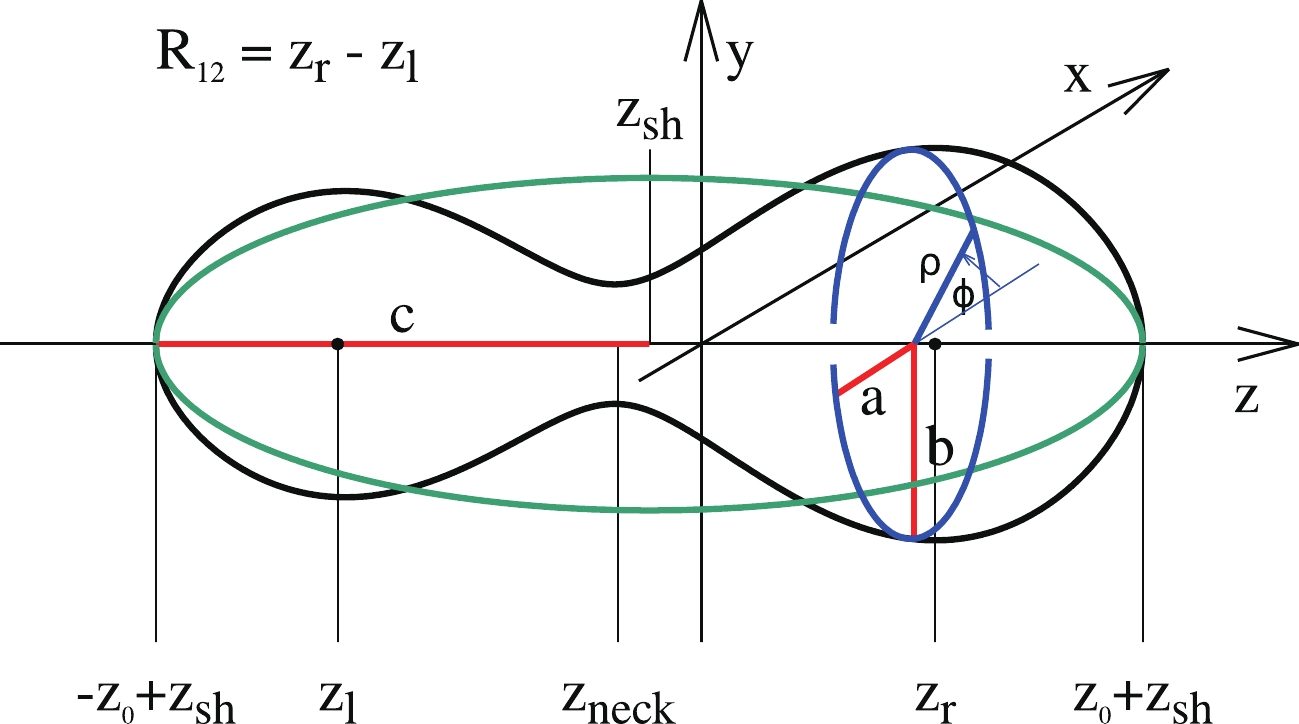 Figure1. (color online) Shape of a very elongated fissioning nucleus.
The function
$ \begin{aligned}[b] \rho_s^2(z) =\;& R_0^2\sum\limits_{n = 1}^\infty \left[ a_{2n} \cos\left(\frac{(2n-1) \pi}{2} \, \frac{z-z_{sh}}{z_0}\right)\right.\\& +\left. a_{2n+1} \sin\left(\frac{2 n \pi}{2} \, \frac{z-z_{sh}}{z_0}\right) \right]\, . \end{aligned} $  | (1) |
Contrary to the frequently used spherical harmonics expansion (cf. e.g., Refs. [8, 9]), the Fourier series converges on a realistic shape for the nuclei much earlier [17, 18] and only the few first terms are needed in practical use. Although one can work directly with these Fourier expansion coefficients, treating them as free deformation parameters, it is more suitable to use their combinations
$ \left\{ \begin{array}{l} q_2 = a_2^{(0)}/a_2 - a_2/a_2^{(0)}, \\[1ex] q_3 = a_3, \\[1ex] q_4 = a_4+\sqrt{(q_2/9)^2+(a_4^{(0)})^2}, \\[1ex] q_5 = a_5-(q_2-2)a_3/10, \\[1ex] q_6 = a_6-\sqrt{(q_2/100)^2+(a_6^{(0)})^2} \;\;. \end{array} \right. $  | (2) |
Non-axial shapes can easily be obtained assuming that, for a given value of the z-coordinate, the surface cross-section (the blue dashed oval in Fig. 1) has the form of an ellipse with half-axes
$ \varrho_s^2(z,\varphi) = \rho^2_s(z) \frac{1-\eta^2}{1+\eta^2+2\eta\cos(2\varphi)} \quad \rm{with} \quad \eta = \frac{b-a}{a+b}\; , $  | (3) |
2
B.Potential energy surfaces
The nuclear potential energies of actinide nuclei are evaluated in the following equidistant grid-points in the 4D collective space built on the $ \begin{aligned}[b] q_2 &= -0.60\; (0.05)\; 2.35 \, ,\\ q_3 &= 0.00\; (0.03)\; 0.21 \, ,\\ q_4 &= -0.21\; (0.03)\; 0.21 \, ,\\ \eta\; &= 0.00\; (0.03)\; 0.21 \, . \end{aligned} $  | (4) |
A typical PES for actinides is shown in Fig. 2, where two cross-sections,
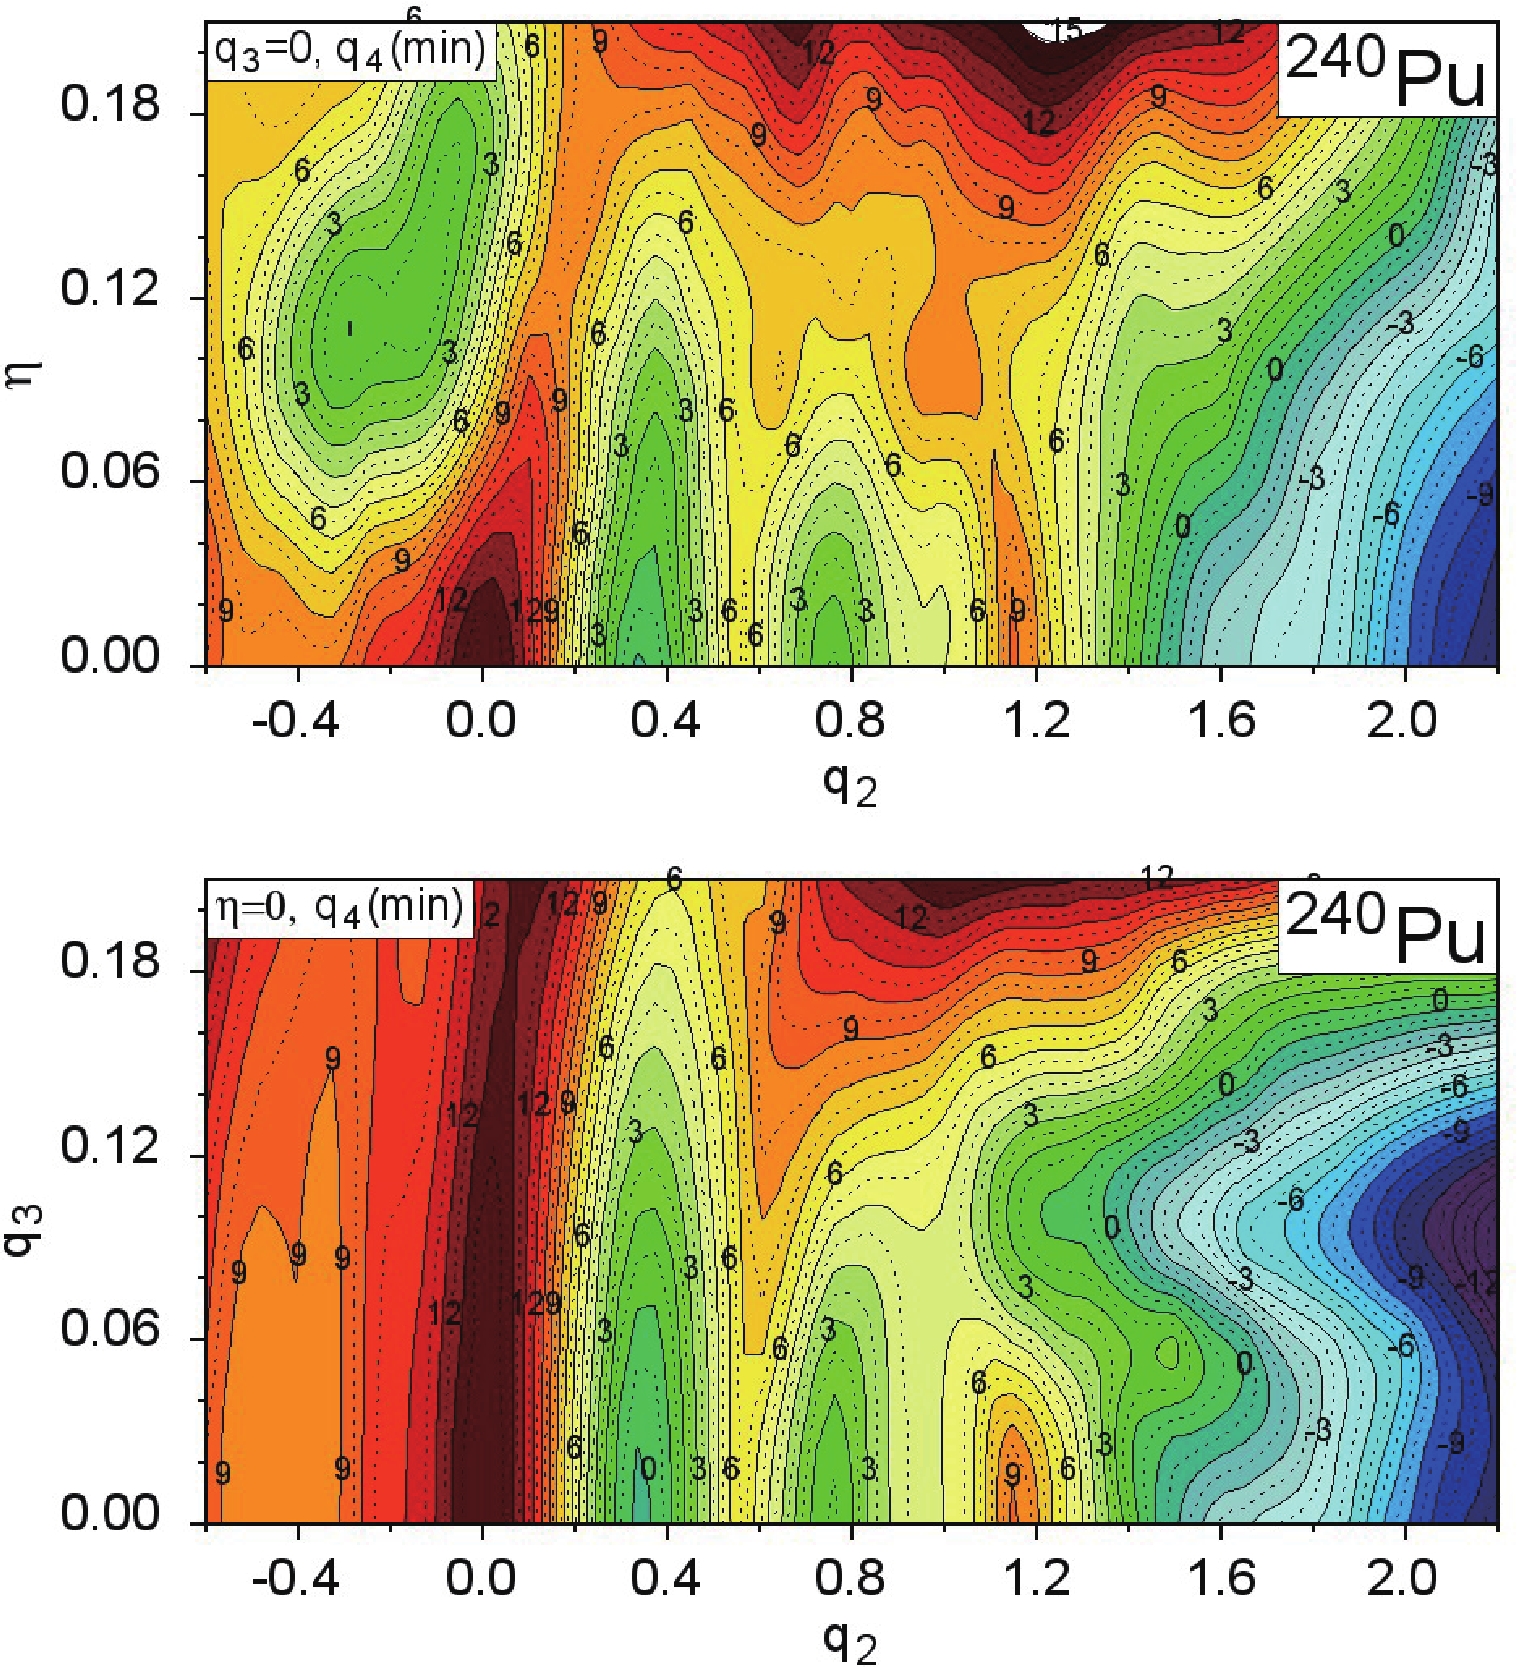 Figure2. (color online) Potential energy surface of
 The first (
 Figure3. (color online) Fission barrier heights of even-even actinide nuclei in our 4D mac-mic model.
 $ E_{\rm barr} = M_{\rm mac}^{\rm sadd}- M_{\rm g.s.}^{\rm exp}\; , $  | (5) |
Using the LSD model [14] to evaluate the macroscopic mass, one obtains the Ў®?wi?teckiЎҜ estimates of barrier heights, which deviate from the experimental data only by 310 keV on average, as shown in Fig. 4. This means that additional work has to be done to improve the estimates of the ground-state masses, to give a better fit of the pairing strength in particular. Our Ў°universalЎұ pairing force [27], used in the present work, reproduces on average the pairing gaps of nuclei from different mass regions, but it might be that it does not perfectly reproduce the pairing properties in actinides.
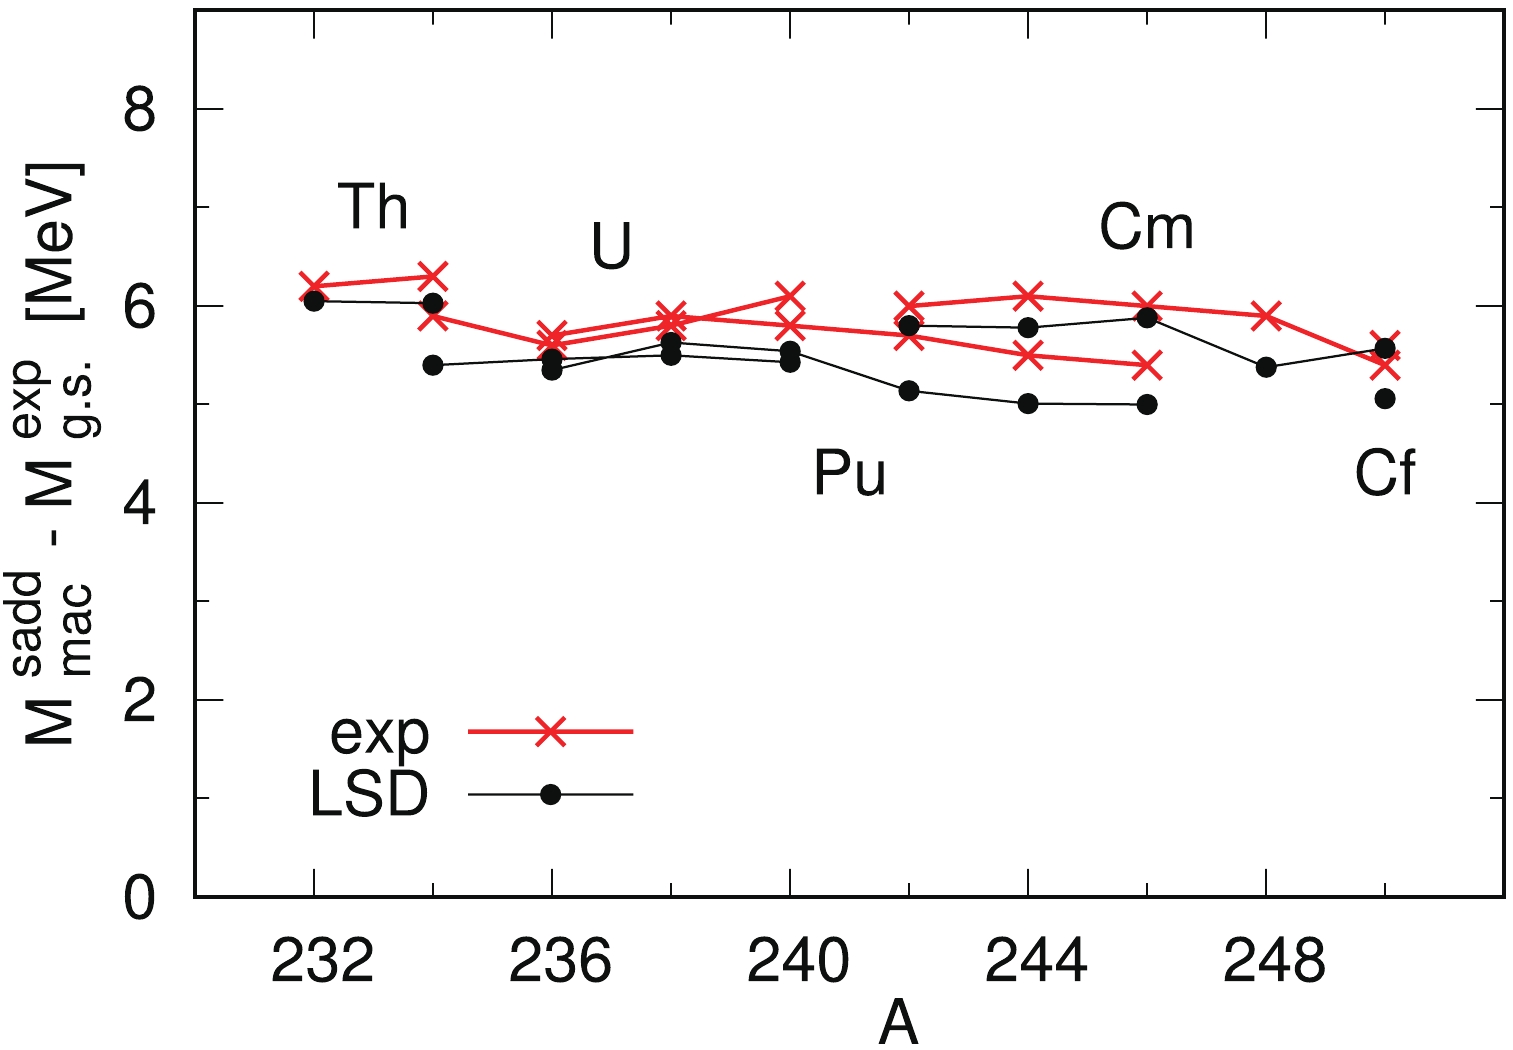 Figure4. (color online) Fission barrier heights of even-even actinide nuclei evaluated using the topographical theorem and the LSD model, compared with the experimental barrier heights as a function of mass number A [30].
2
C.Simple collective model for fission
The present research is a continuation and extension of our previous work [11-13], where a more detailed description of the collective fission model was given. The fundamental idea of this approach is the use of the Born-Oppenheimer approximation (BOA) to separate the relatively slow motion towards fission, mainly in the $ \Psi_{nE}(q_2,q_3,q_4) = u_{nE}(q_2)\,\phi_n(q_3,q_4;q_2)\; . $  | (6) |
To determine the
$ W(q_3,q_4;q_2) = |\Psi(q_2,q_3,q_4)|^2 = |\phi_0(q_3,q_4;q_2)|^2\; . $  | (7) |
$ W(q_3,q_4;q_2)\propto \exp{\frac{V(q_3,q_4;q_2)-V_{\rm min}(q_2)}{T^*}}\; , $  | (8) |
$ T^* = E_0/{\rm tanh}(E_0/T)\; . $  | (9) |
To obtain the FMY for a given elongation
$ w(q_3;q_2) = \int W(q_3,q_4;q_2) {\rm d}q_4\; . $  | (10) |
$ P(q_2,q_3,q_4) = \frac{k_0}{k}\,P_{\rm neck}(R_{\rm neck})\; , $  | (11) |
$ P_{\rm neck}(R_{\rm neck}) = \exp{[-\log(2)(R_{\rm neck}/d)^2]}\; , $  | (12) |
$ \frac{\hbar^2 k^2}{2\bar{M}(q_2)} = E_{\rm kin} = E-E^*-V(q_2) \; , $  | (13) |
$ \bar{M}(q_2) = \mu [1+11.5\,(B_{\rm irr}/\mu -1)]\left(\frac{\partial R_{12}} {\partial q_2}\right)^2 \; . $  | (14) |
$ w(q_3;q_2) = \int W(q_3,q_4;q_2) P(q_2,q_3,q_4) {\rm d}q_4 \; , $  | (15) |
$ w'(q_3;q_2) = w(q_3;q_2)\frac{1-\int\limits_{q'_{2}<q_2} w(q_3;q'_2) {\rm d}q'_2} {\int w(q_3;q'_2) {\rm d}q'_2}\; . $  | (16) |
$ Y(q_3) = \frac{\int w'(q_3;q_2) {\rm d}q_2}{\int w'(q_3;q_2) {\rm d}q_3 \, {\rm d}q_2}\; . $  | (17) |
So, there are only two free parameters in the above model, namely the zero-point energy
A typical dependence of the fission fragment mass yield on these two adjustable parameters is shown in Fig. 5, where the FMY of
 Figure5. (color online) Fragment mass yield of
 In general, the theoretical estimates of FMY depend weakly on the choice of the free parameters
$ I(E_0,d) = \sum\int\limits_0^A |Y_{\rm exp}(A_{\rm f})-Y_{\rm th}(A_{\rm f};E_0,d)| {\rm d}A_{\rm f} \; , $  | (18) |
It is well known that the FMY of a given nucleus is mainly determined by its PES properties at large deformations. Typical examples of PES for
The fission fragment mass yields obtained in our model are presented in Figs. 6 to 9. Some empirical data for the FMY have been obtained for the fission of excited nuclei. In such cases, we take the excitation energy of nucleus (
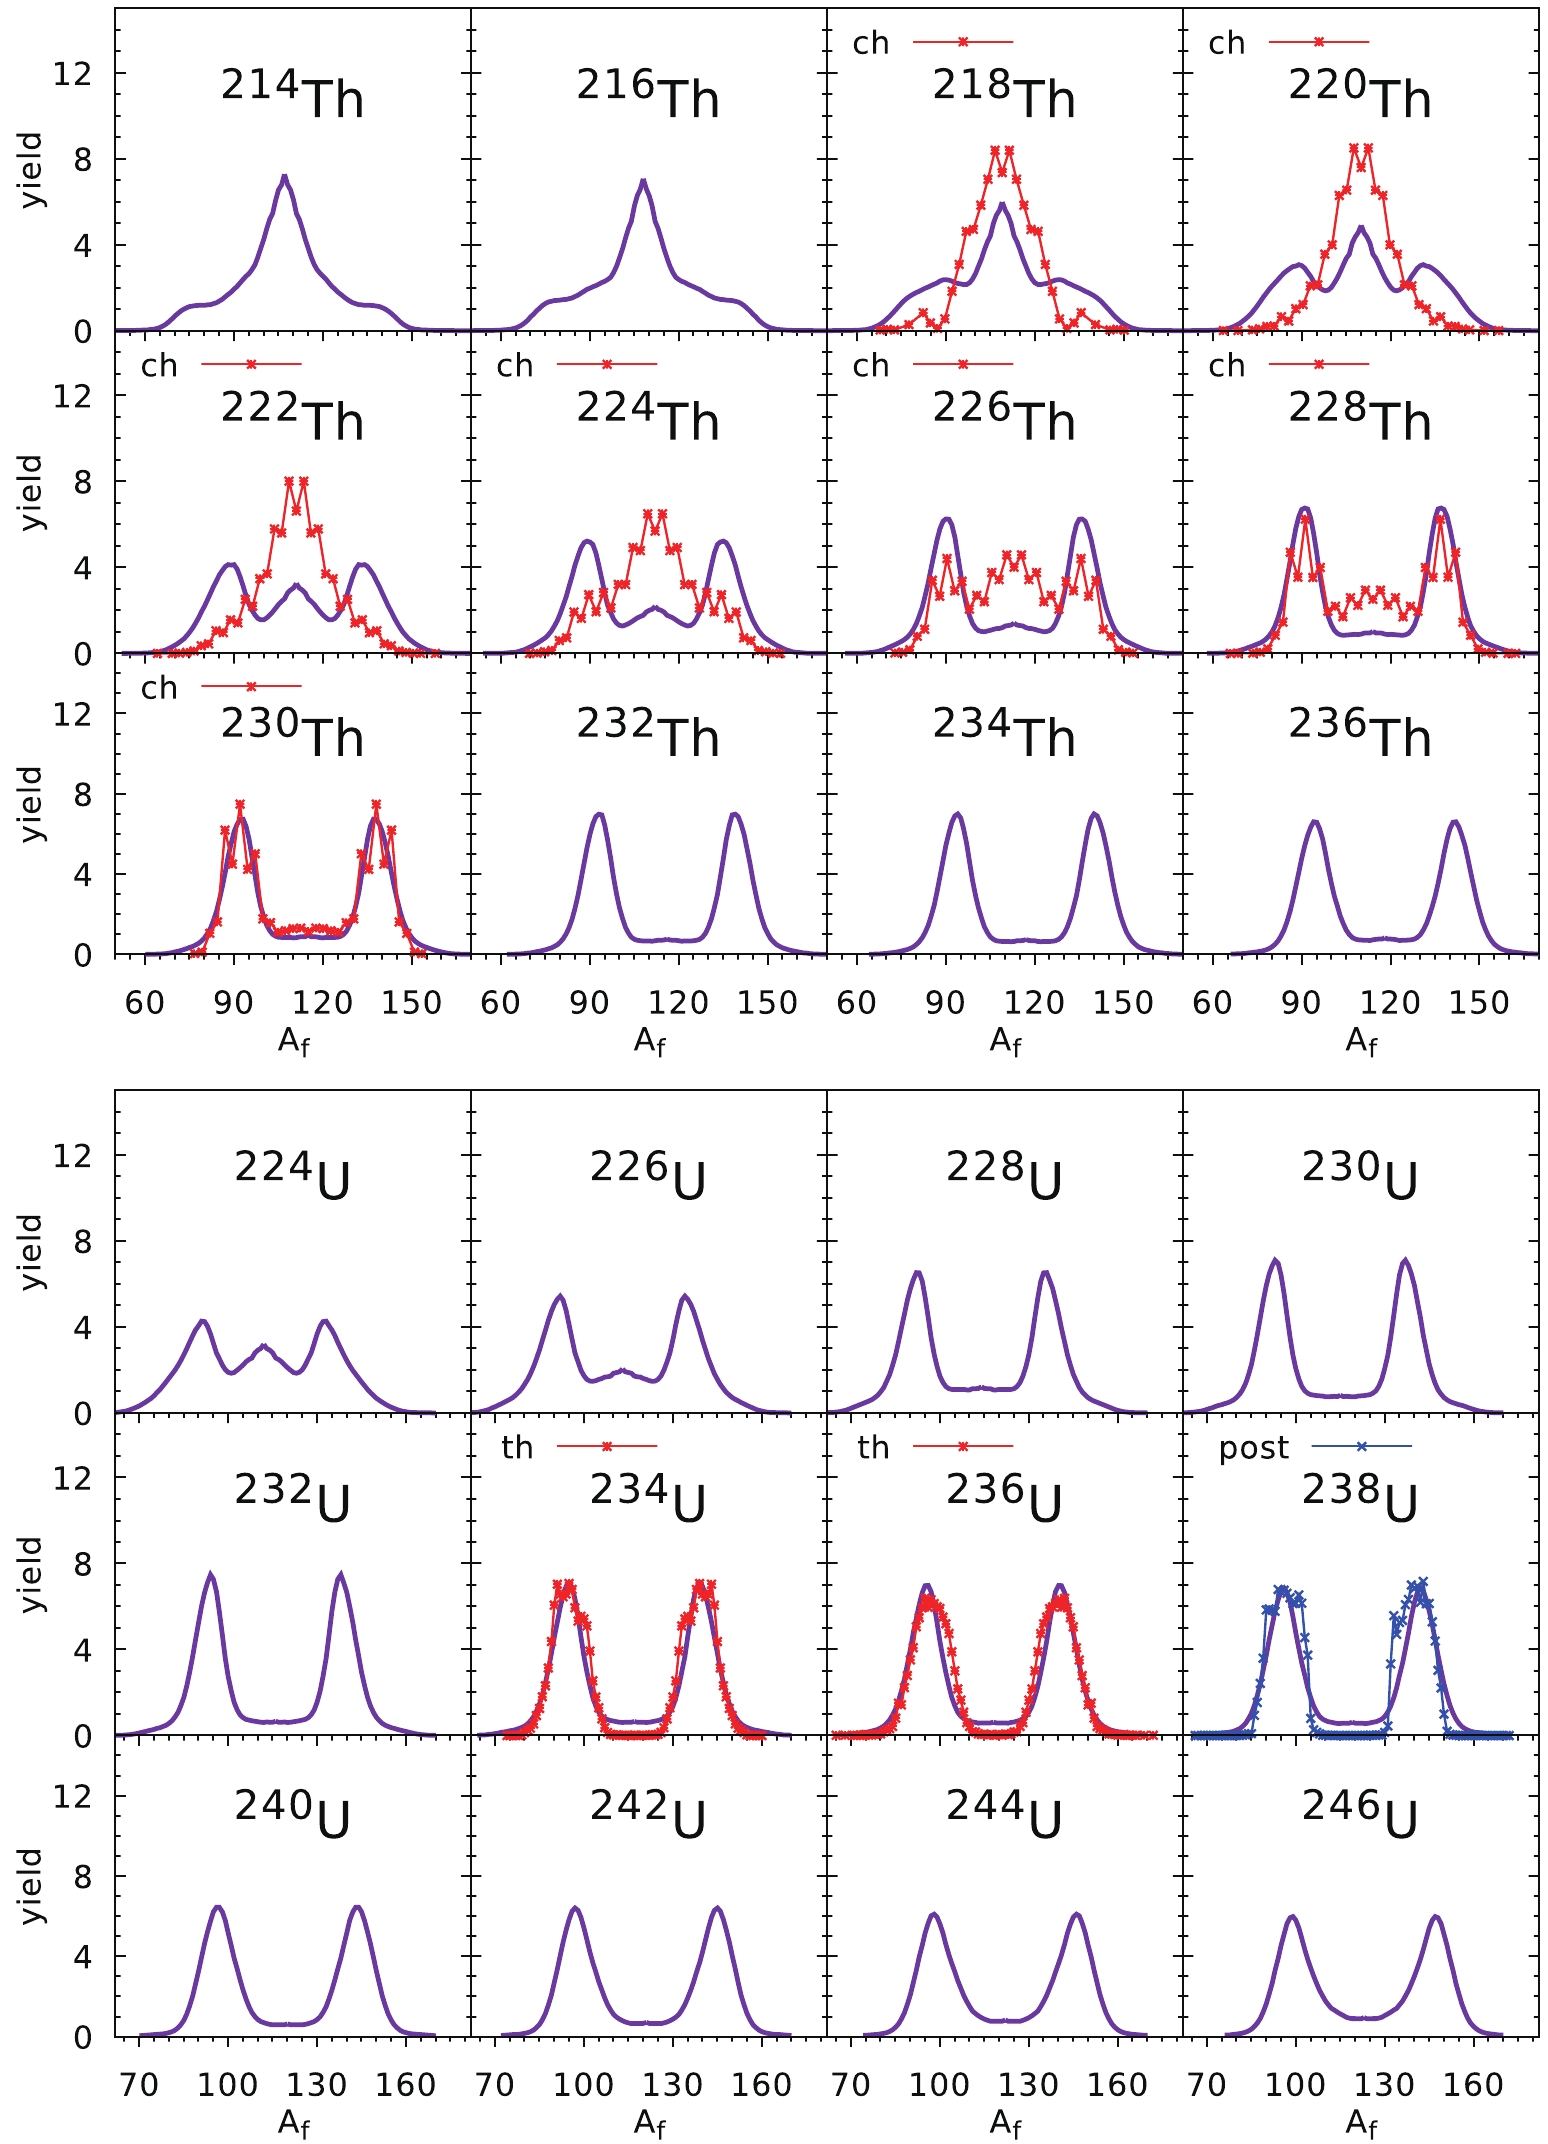 Figure6. (color online) Fission fragment mass yields of Th (top part) and U (bottom part) isotopes. Experimental data (red stars) for Th isotopes are extracted from the charge-yields of Refs. [34, 35] while the mass yields for U isotopes (botton part) are taken from Refs. [36, 37] for the thermal neutron induced fission (th). To guide the eye, for
 $ V_{\rm mic}(T) = \frac{V_{\rm mic}(T = 0)}{1+\exp{(T-1.5)/0.3}}\; , $  | (19) |
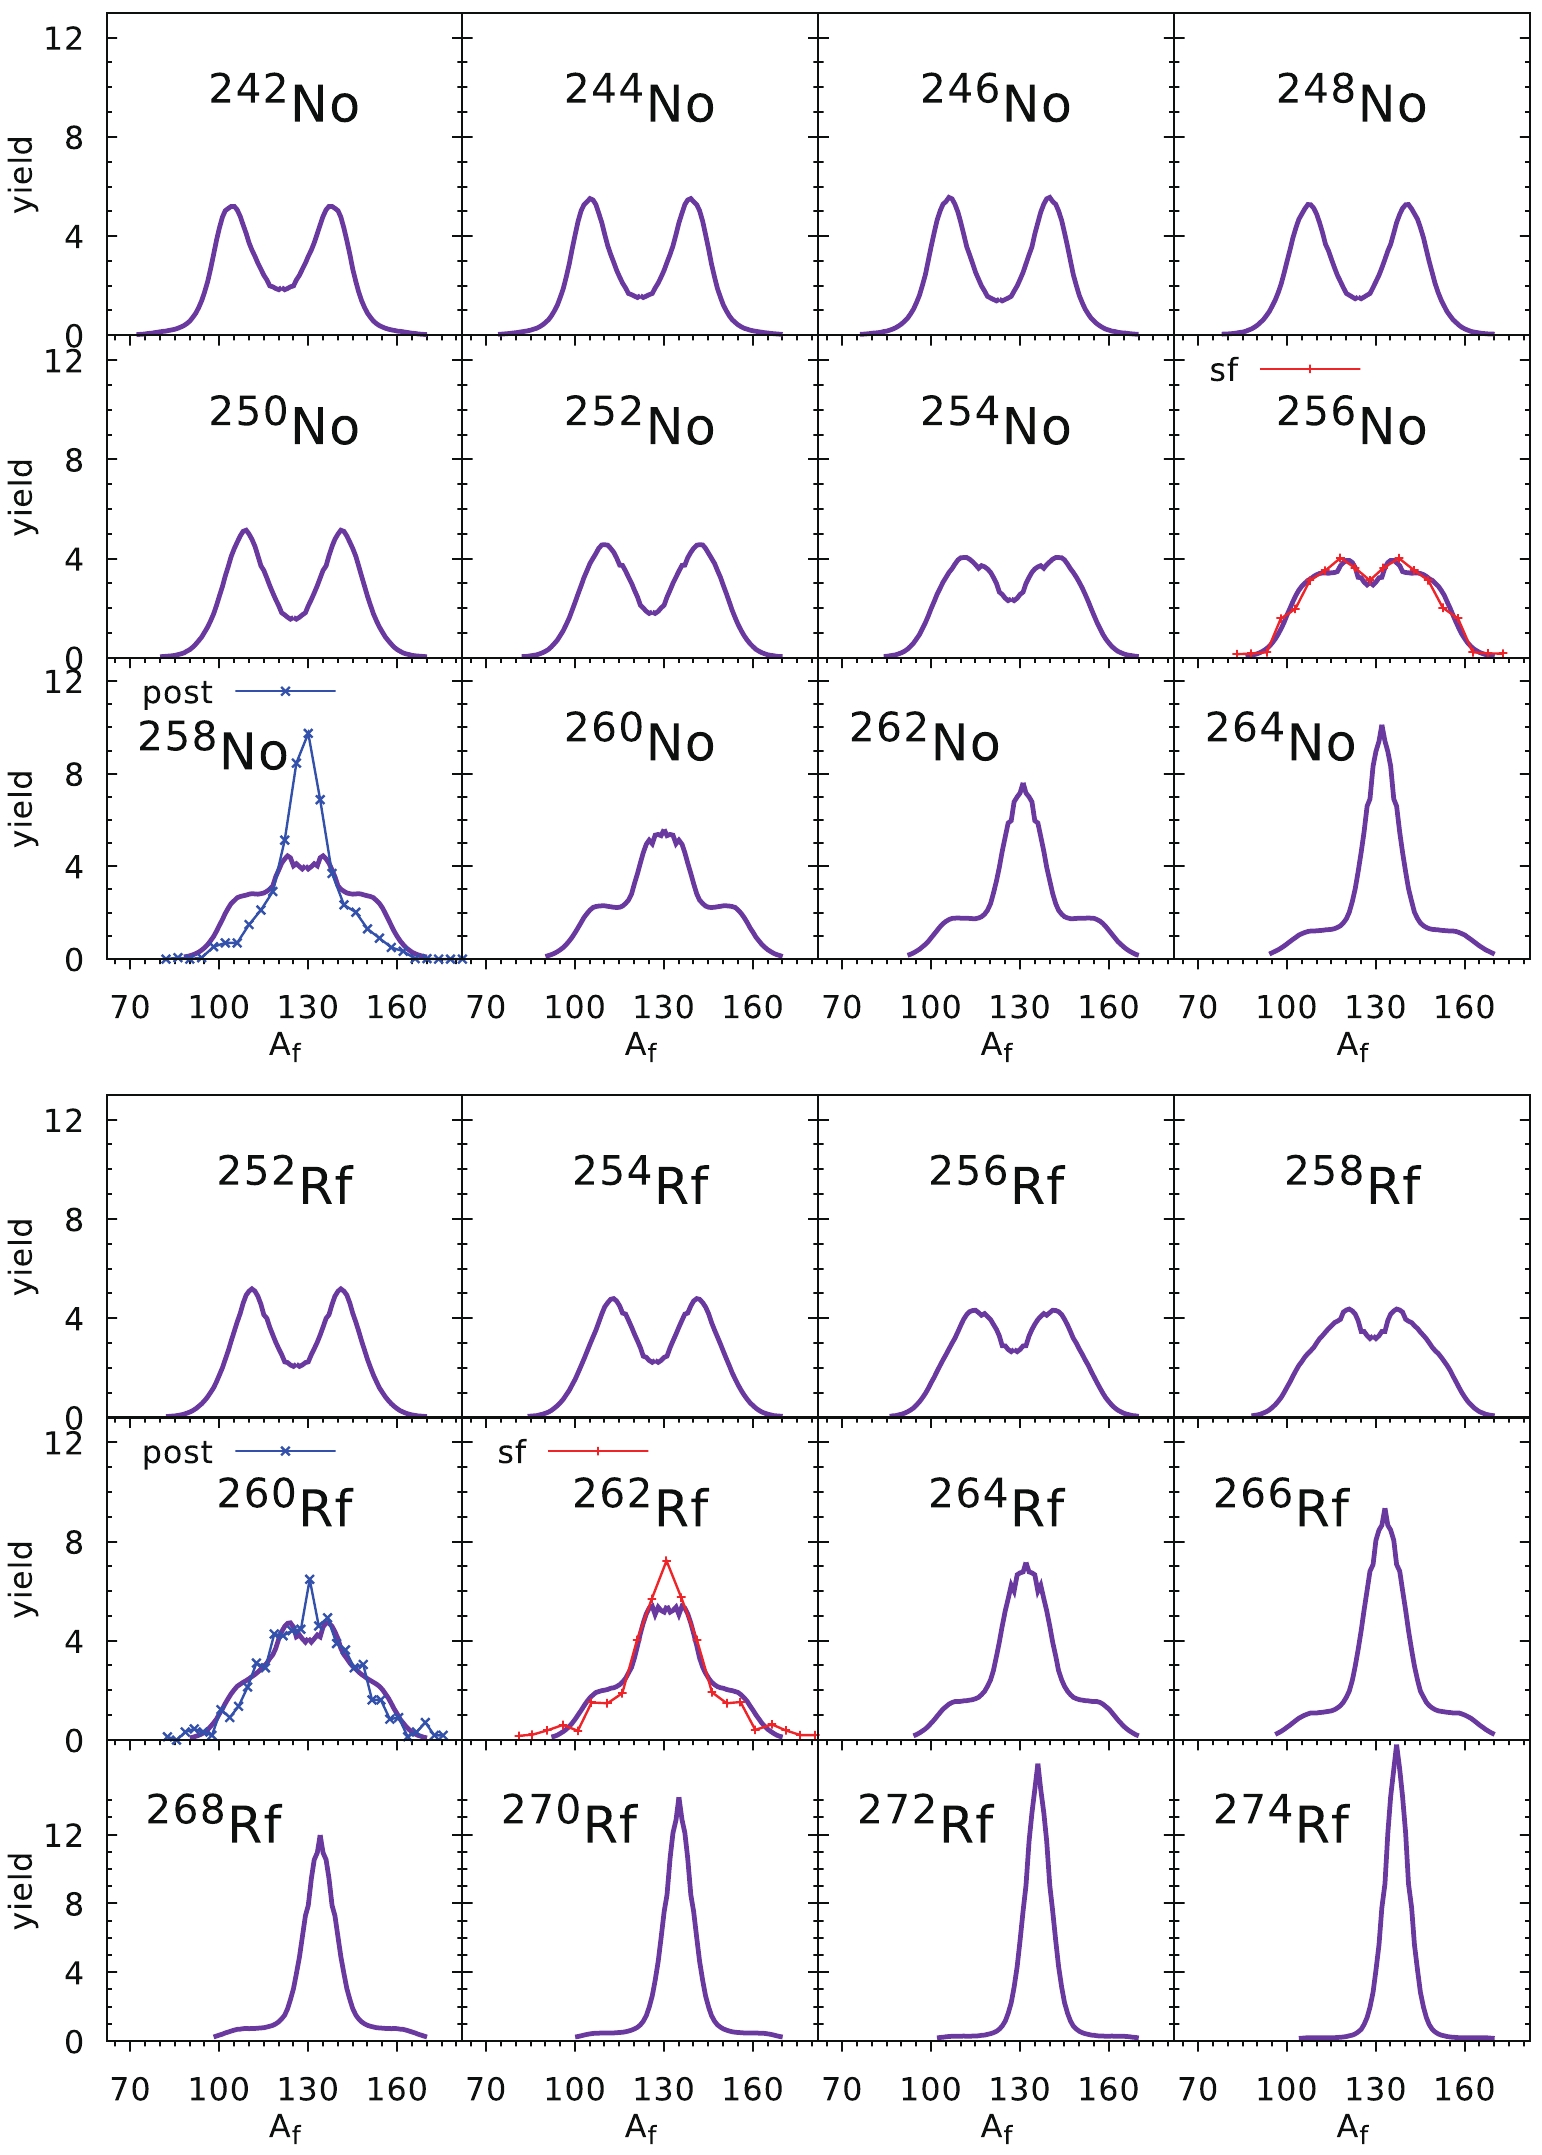 Figure9. (color online) Fission fragment mass yields of No (top) and Rf (bottom) isotopes. Experimental data (crosses) are taken from Refs. [41-43].
The prediction of the FMYs for Pu and Cm isotopes are compared with the experimental data in Fig. 7. The pre-neutron experimental yields for Pu [38] and
 Figure7. (color onlne) Fission fragment mass yields of Pu (top part) and Cm (bottom part) isotopes. Experimental data (red stars) are taken from Ref. [38] for the Pu chain and from Refs. [3, 39] for Cm nuclei.
The estimates of the FMY for the Cf and Fm chains of isotopes are shown in Fig. 8. All experimental data correspond to spontaneous fission, but only for
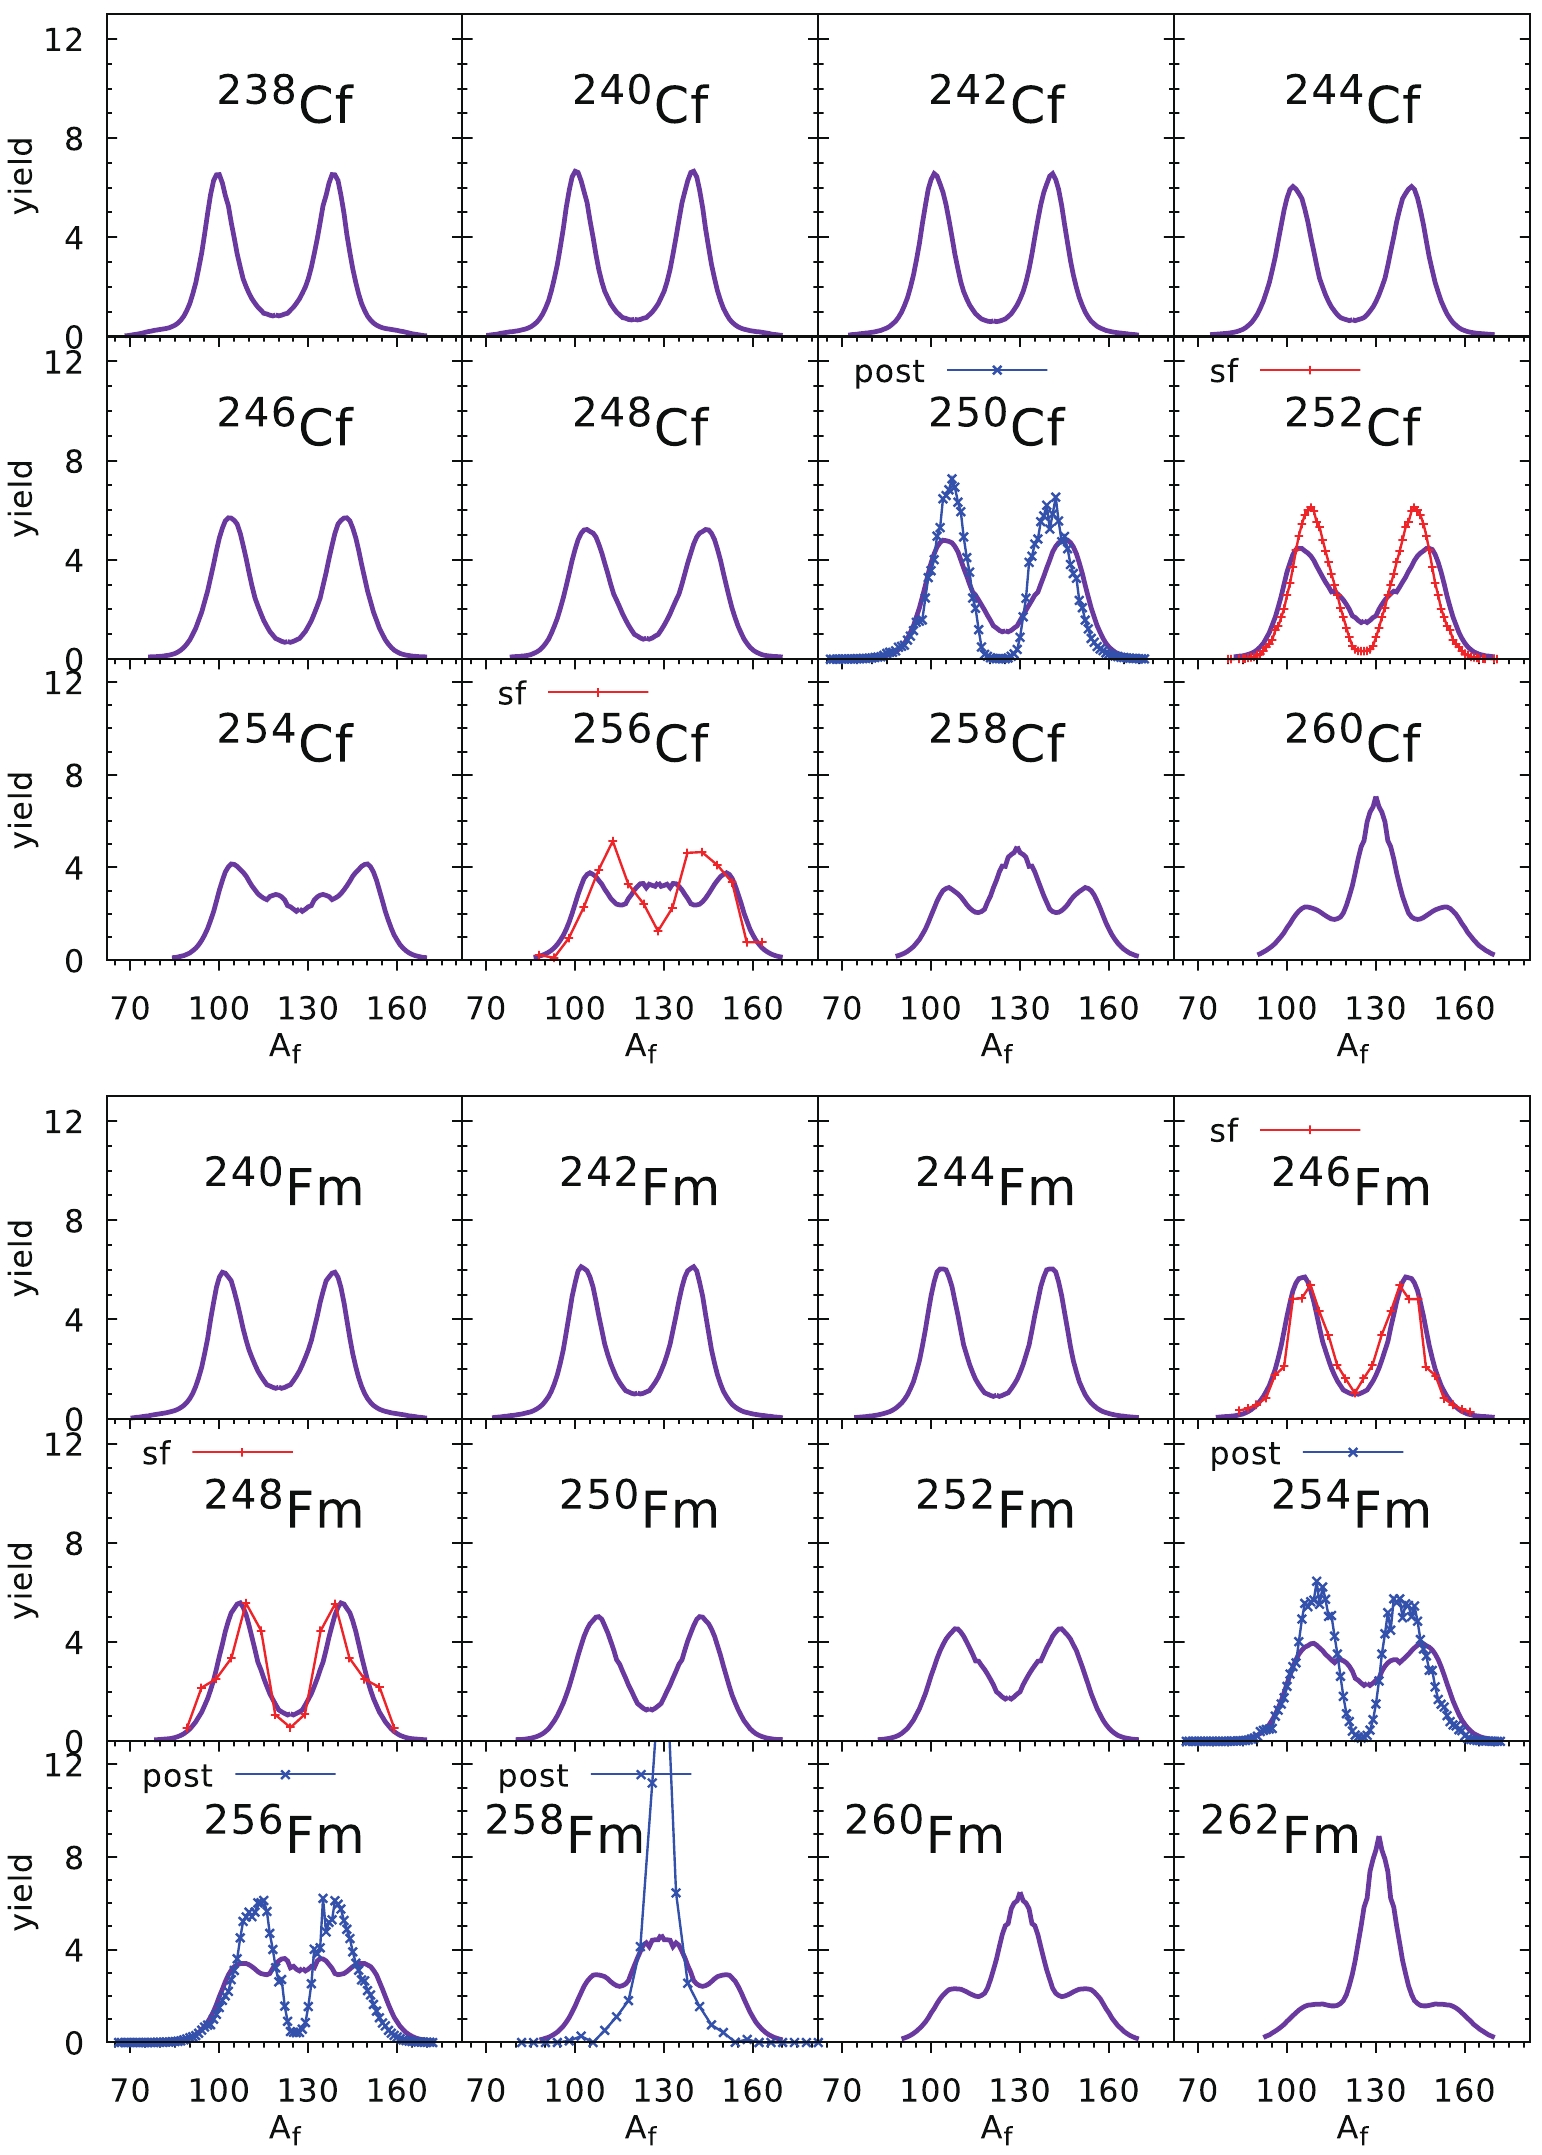 Figure8. (color online) Fission fragment mass yields of Cf (top) and Fm (bottom) isotopes. Experimental data for pre-neutron yields (red stars) are taken from Refs. [37, 40] while the post-neutron yields (blue crosses) come from Ref. [3, 41].
The overall good quality of our predictions in a broad mass region of the actinide elements is probably because in very heavy nuclei, the fission barrier is very short, and the fission valley forms very early, i.e., at a relatively small elongation of the nucleus. The opposite situation occurs in the thorium nuclei, where the fission barriers are very broad. Figure 10 presents the fission valley potential V as a function of the elongation parameter
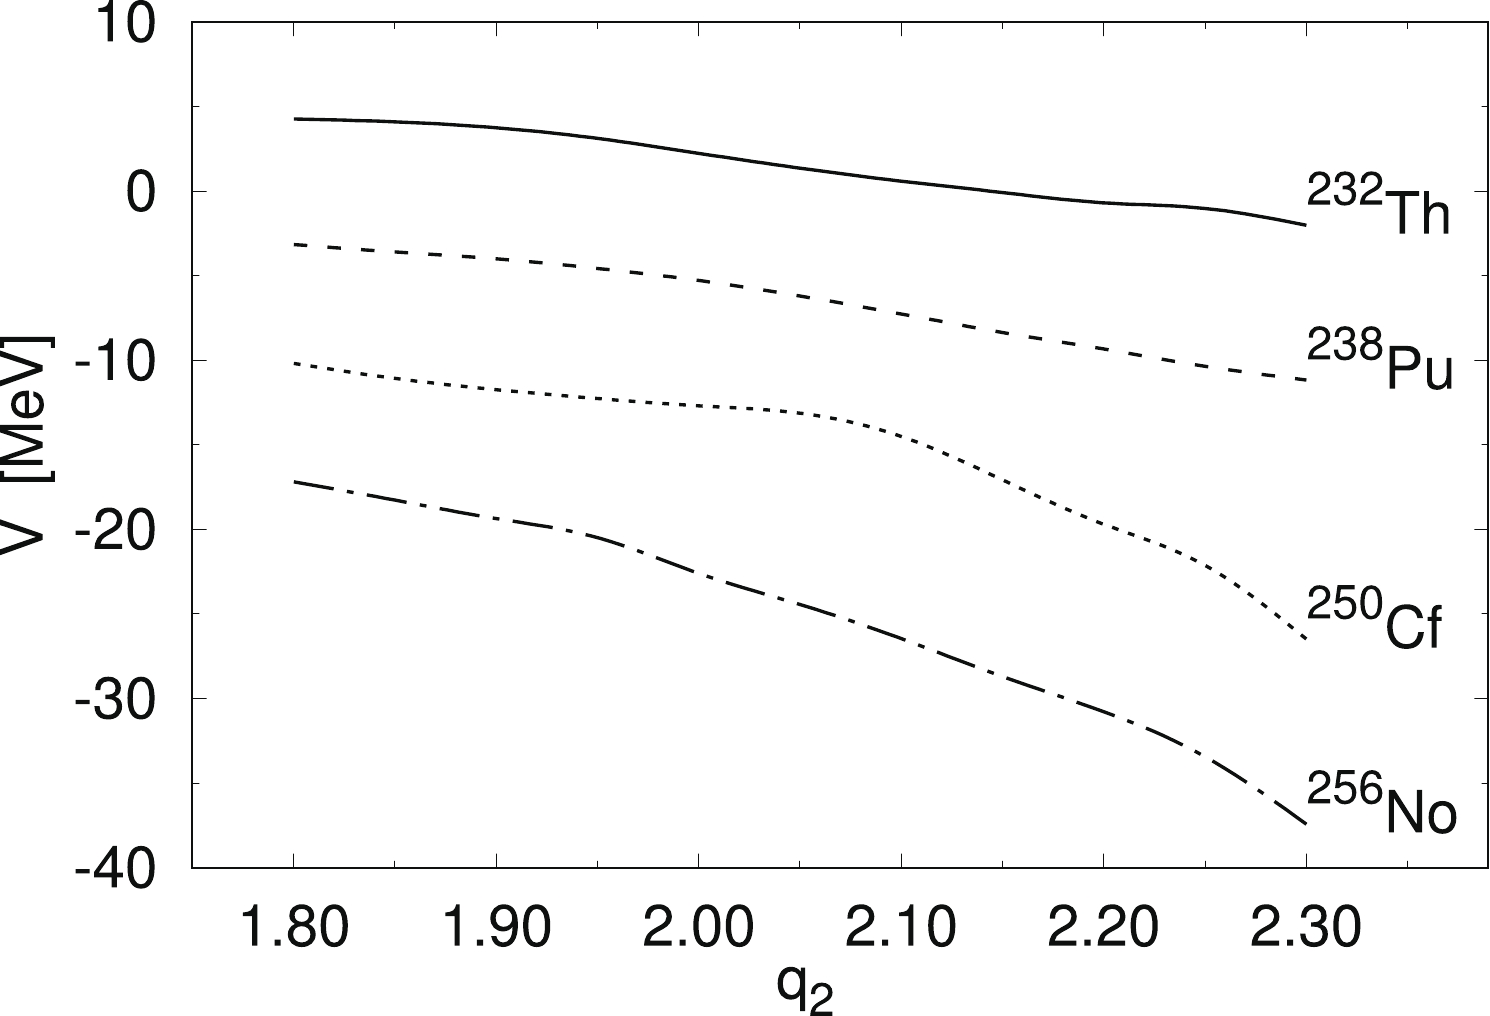 Figure10. Potential corresponding to the bottom of fission valley as a function of the elongation parameter
  Figure11. (color online) Potential energy surface cross-sections of
 In
 Figure12. (color online) Potential energy surface cross-sections of
 Two minima, one corresponding to the symmetric (
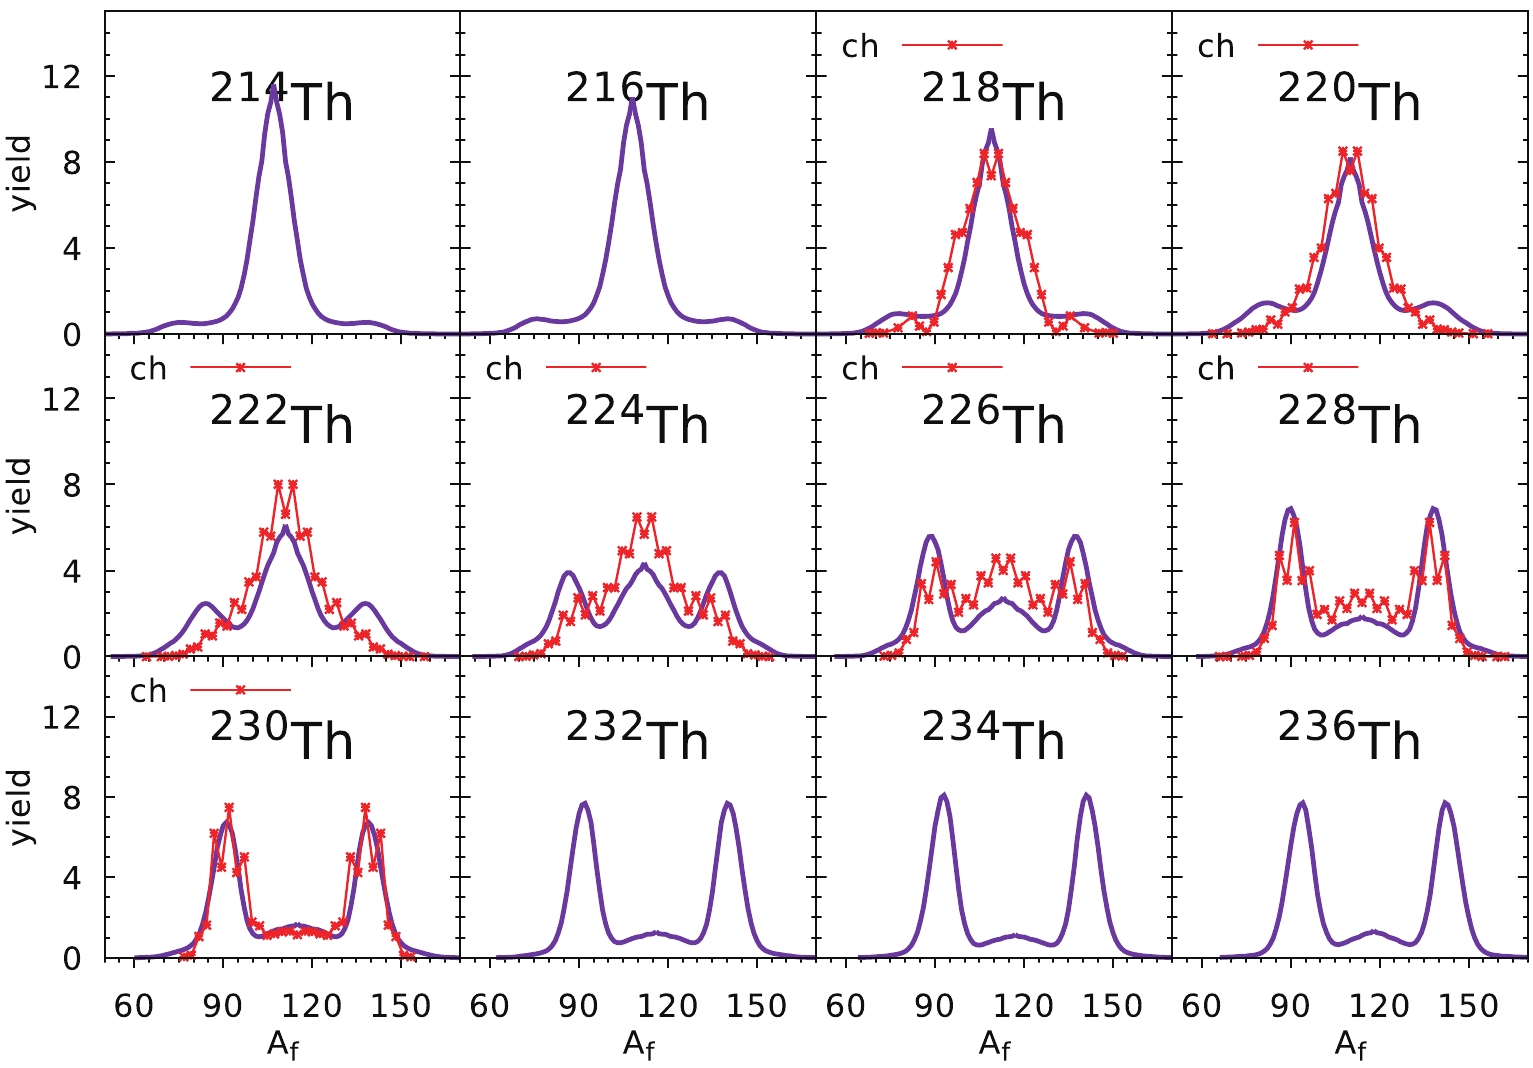 Figure13. (color online) Fission fragment mass yields of Th isotopes reproduced by using constants
 Ўс The overall agreement of the theoretical FMY estimates with the experimental data indicates that the mac-mic model with the LSD energy for the macroscopic smooth part and the shell and pairing corrections evaluated based on the Yukawa-folded single-particle potential gives a good description of the potential energy surfaces of actinide nuclei;
Ўс The three-dimensional set of the Fourier deformation parameters used to describe the shape of fissioning nuclei is fully capable of producing a wide variety of the shapes of nuclei on their way to fission;
Ўс The collective 3D model based on the Born-Oppenheimer approximation and comprising elongation, mass asymmetry, and neck modes reproduces the main features of the fission fragment mass yield data well;
Ўс The Wigner function used to approximate the probability distribution related to the neck and mass asymmetry degrees of freedom simulates this distribution properly for low-energy fission; and
Ўс A neck-breaking probability depending on the size of the neck has to be introduced to improve the agreement of our FMY estimates with the experimentally measured values.
Our mac-mic model and the collective 3D approach, which couples fission mode, neck, and mass asymmetry collective vibrations, can describe the main features of the fission process in actinide nuclei. The estimated fission barrier heights do not deviate much from their experimental values. The measured fission fragment mass yields are also reproduced satisfactorily. On the other hand, one has to treat the presented collective model as a kind of rough tool which allows the FMY to be obtained by a relatively quick calculation. To get more precise results, one has to use more advanced models in which the whole fission dynamics and the energy dissipation are taken into account. Such calculations may use Langevin dynamics (cf. Ref. [10]) or the improved quantum molecular dynamics model (ImQMD). The latter method has been successfully applied to describe the fission process in heavy ion induced fission reactions, where the excitation energy increases, possibly leading to a shorter fission time scale and even to the occurrence of ternary fission [44, 45].
The Langevin type calculations, profiting from the PES generated in a mac-mic approach together with the 3D Fourier shape parametrization, as well as the use of the self-consistent method, are being carried out in parallel by our group.
