HTML
--> --> -->Many theoretical models have been proposed for nuclear fission: 1) the multi-dimensional dynamical method [17-23], based on the Langevin framework of nuclear shape dynamics for understanding the fission process; 2) the density functional theory (DFT) [24-29], in which nuclear dynamics is modeled by propagating a collective wave packet on the potential-energy surface; 3) the macroscopic-microscopic model [2, 3, 7, 30-32], which exploits the strongly damped character of nuclear dynamics and models a random walk on the five-dimensional potential-energy surface, utilizing the similarity between the nuclear shape evolution and Brownian motion; 4) and the scission point model [4, 33-37], which assumes statistical equilibrium at the scission point in the fission process, in which the overall energy at the scission point is a function of the neutron number, the proton number, and the quadruple deformation parameter. The quantum many-body nature of the problem makes it challenging to understand fission; nevertheless, thus far, considerable progress has been made [24].
Current theories of fission posit that the multiple observed modes in the fission process correspond to various valleys, from the saddle point to the scission point, on the potential energy surface of the parent nucleus, with different surface landscapes for different nuclei [38-40]. For actinides, there are three main fission modes: 1) the standard I (S1) mode, 2) the standard II (S2) mode, and 3) the superlong (SL) mode. However, experiments have mostly focused on one observable, such as the mass distribution, charge distribution, total kinetic energy, and cross-section of the fission fragments. Moreover, many experimental results have been accumulated [41-43]. In theoretical analysis, however, the single observable description frequently requires integrating other variables within the range of possible values. Therefore, it is insensitive to the local structure of the potential energy surface of the parent nucleus. Different fission paths cannot be distinguished as well. Naturally, the correlation between the different observable characteristics is of considerable significance to the further extraction of fission information.
In 1970, in the neutron-induced fission of
Given the above, little is known about the relationships between the multi-parameters of fission fragments. Therefore, we built a time projection chamber detector based on the gas electron multiplier (GEM) process, for experimental observations. Using this, quantitative multi-parameter measurements of fission fragments become possible [45, 46]; thus, an effective method is offered for understanding the nuclear structure. Meanwhile, a theoretical investigation of each observable characteristic of fission fragments was conducted in the dissertation by one of the co-authors, using a simple two-dimensional scission-point model (TDSPM). Compared with the traditional scission-point model, the simplified TDSPM only considers the ground state deformation of the analyzed nucleus, and tries to select the experimental values when selecting the liquid-drop energy, making the calculation process simpler and ensuring the accuracy of the calculated results.
We focus on investigating the fission-fragment charge, mass, and TKE distributions of light actinides at low excitation energies, using the simplified TDSPM. Based on the concept of the dinuclear system (DNS), the interaction potential energy of two fragments is analyzed by considering the tip-to-tip orientation at the scission point of the fission process. The driving energy and the quasi-fission barrier of the DNS are also described. The remainder of this paper is organized as follows. In Sec. II, we present the theoretical framework of the simplified TDSPM based on the DNS. In Sec. III, the fission-fragment distributions of electromagnetic and neutron-induced nuclear fission processes are described. The calculation results agree well with existing experimental data, including the recent experimental results on the fission yields of the isotone chain
A.DNS
In a typical fission process, the Coulomb force keeps the system evolving from a quasi-spherical or slightly deformed compound nucleus to two separated fragments that move away from each other [34]. In the present dynamical model, the scission point is a particular point in this evolutionary process at which a compound nucleus breaks into two fragments, and the wave function of any nucleon can spread to each fission fragment. However, each pair of the fission fragments constitutes an independent system, without external energy exchange. In addition, each pair is a local system, with relatively independent properties, such as mass and proton numbersThe shape of an axial-symmetric nucleus can be expressed in spherical coordinates as
$ { \Re_{{L,H}}(\beta,\theta) = c(\beta_{{L,H}})R_{{0L,0H}}\left[1+\sqrt{\frac{5}{4\pi}}P_{2}({\rm{cos}} \theta_{L,H})\right],} $  | (1) |
For two nuclei that are quite close to each other, the interaction potential based on the dynamic deformation can be expressed as the sum of the Coulomb potential
$ \begin{aligned}[b] V(\beta_L,\theta_L,\beta_H,\theta_H,r) =& V_{\rm N}(\beta_L,\theta_L,\beta_H,\theta_H,r)\\ & +V_{\rm C}(\beta_L,\theta_L,\beta_H,\theta_H,r), \end{aligned} $  | (2) |
For the nuclear potential
$ \begin{aligned}[b] V_{\rm N}(\beta_L,\theta_L,\beta_H,\theta_H,r) = & C_0\Bigg\{F_{\rm ex}\int\rho_L({{r}})\rho_H({{r-R}}){\rm d}{{r}} \\ & + \frac{F_{\rm in}-F_{\rm ex}}{\rho_0}\Bigg[\int\rho^{2}_L({{r}})\rho_H({{r-R}}){\rm d}{{r}} \\ & + \int\rho_L({{r}})\rho^2_H({{r-R}}){\rm d}{{r}}\Bigg]\Bigg\}, \end{aligned} $  | (3) |
$ F_{\rm in,ex} = f_{\rm in,ex}+f^{'}_{\rm in,ex}\frac{N_L-Z_L}{A_L}\frac{N_H-Z_H}{A_H}, $  | (4) |
$ \rho_L({{r}}) = \frac{\rho_0}{1+\exp(({{r}}-\Re_L(\beta_L))/a_{\rho_L})}, $  | (5) |
$ \rho_H({{r}}) = \frac{\rho_0}{1+\exp((|{{r-R}}|-\Re_H(\beta_H))/a_{\rho_H})}, $  | (6) |
The Coulomb potential
$ \begin{aligned}[b] V_{\rm C}(\beta_L,\theta_L,\beta_H,\theta_H,r) =& \frac{Z_LZ_He^2}{r}+\left(\frac{9}{20\pi}\right)^\tfrac{1}{2}\left(\frac{Z_LZ_He^2}{r^3}\right)^2 \\ & \times \sum\limits_{i = L,H}\Re_i^2\beta_{i}P_2({\rm cos}\theta_i)+\left(\frac{3}{7\pi}\right)^\tfrac{1}{2}\left(\frac{Z_LZ_He^2}{r^3}\right)^2\times \sum\limits_{i = L,H}\Re_i^2[\beta_{i}P_2({\rm cos}\theta_i)]^2. \end{aligned} $  | (7) |
In addition, according to the lowest energy principle, the tip-to-tip orientation is always taken into account in the DNS framework. Compared with other orientations, it exhibits a relatively high internal fusion barrier and a lower external Coulomb barrier evolving along the r-direction, which increases the probability of fission. Therefore, the driving potential of the DNS relative to the parent nucleus can be expressed as
$\begin{aligned}[b] U(Z_i,A_i,E_i^{*},R_m) = & V(R_m)-U(Z_{CN},A_{CN},E_{CN}^{*})\\ & +U(Z_L,A_L,E_L^{*})+U(Z_H,A_H,E_H^{*}), \end{aligned} $  | (8) |
$ {\delta U_{\rm sh}(Z_i,A_i,E_i^{*}) = \delta U_{\rm sh}(Z_i,A_i,E_i^{*} = 0)\exp(-E^*_i/E_d)}, $  | (9) |
$ E^*(Z_i,A_i) = E^{*}_{CN}-U(Z_i,A_i,E_i^{*},R_m). $  | (10) |
2
B.TDSPM
To accurately estimate the information pertaining to fission fragments using the simplified TDSPM, the semiempirical formula for pre-neutron emission fission yields with different charges and mass numbers was obtained [4, 33]. For relative primary yields under different specific conditions, the following expression is used: $ Y(Z_i,A_i,E^{*}) = N_0\exp{\left[-\frac{U(R_m)+B_{\rm qf}(Z_i,A_i)}{T}\right]}, $  | (11) |
$ Y(A_i,E^{*}) = \sum\limits_{Z_i}Y(Z_i,A_i,E^{*}), $  | (12) |
$ Y(Z_i,E^{*}) = \sum\limits_{A_i}Y(Z_i,A_i,E^{*}). $  | (13) |
It is appropriate to calculate the TKE of fission fragments within the simplified TDSPM. We assume that all interaction energies transform into the kinetic energy of fission fragments in the fission process. The mean TKE as a function of the mass number
$ \langle {\rm{TKE}} \rangle (A_i,E^{*}) = \frac{\sum\nolimits_{Z_i} {\rm{TKE}} (Z_i,A_i,E^{*})Y(Z_i,A_i,E^{*})}{\sum\nolimits_{Z_i}Y(Z_i,A_i,E^{*})} $  | (14) |
$ \langle {\rm{TKE}} \rangle (Z_i,E^{*}) = \frac{\sum\nolimits_{A_i} {\rm{TKE}} (Z_i,A_i,E^{*})Y(Z_i,A_i,E^{*})}{\sum\nolimits_{A_i}Y(Z_i,A_i,E^{*})}, $  | (15) |
$ \begin{aligned}[b] {\rm{TKE}}(Z_i,A_i,E^{*}) & = V(\beta_L,\theta_L,\beta_H,\theta_H,R_b) \\ &= V(Z_i,A_i,R_m)+B_{qf}(Z_i,A_i).\end{aligned} $  | (16) |
$ R_{sp} = \frac{1.4}{1.16}[R_L(\beta_L,\theta_L = 0)+R_H(\beta_H,\theta_H = 0)]+1 {\rm fm}. $  | (17) |
A.Potential energy of the DNS
To obtain more information on fission fragments and to better understand the configuration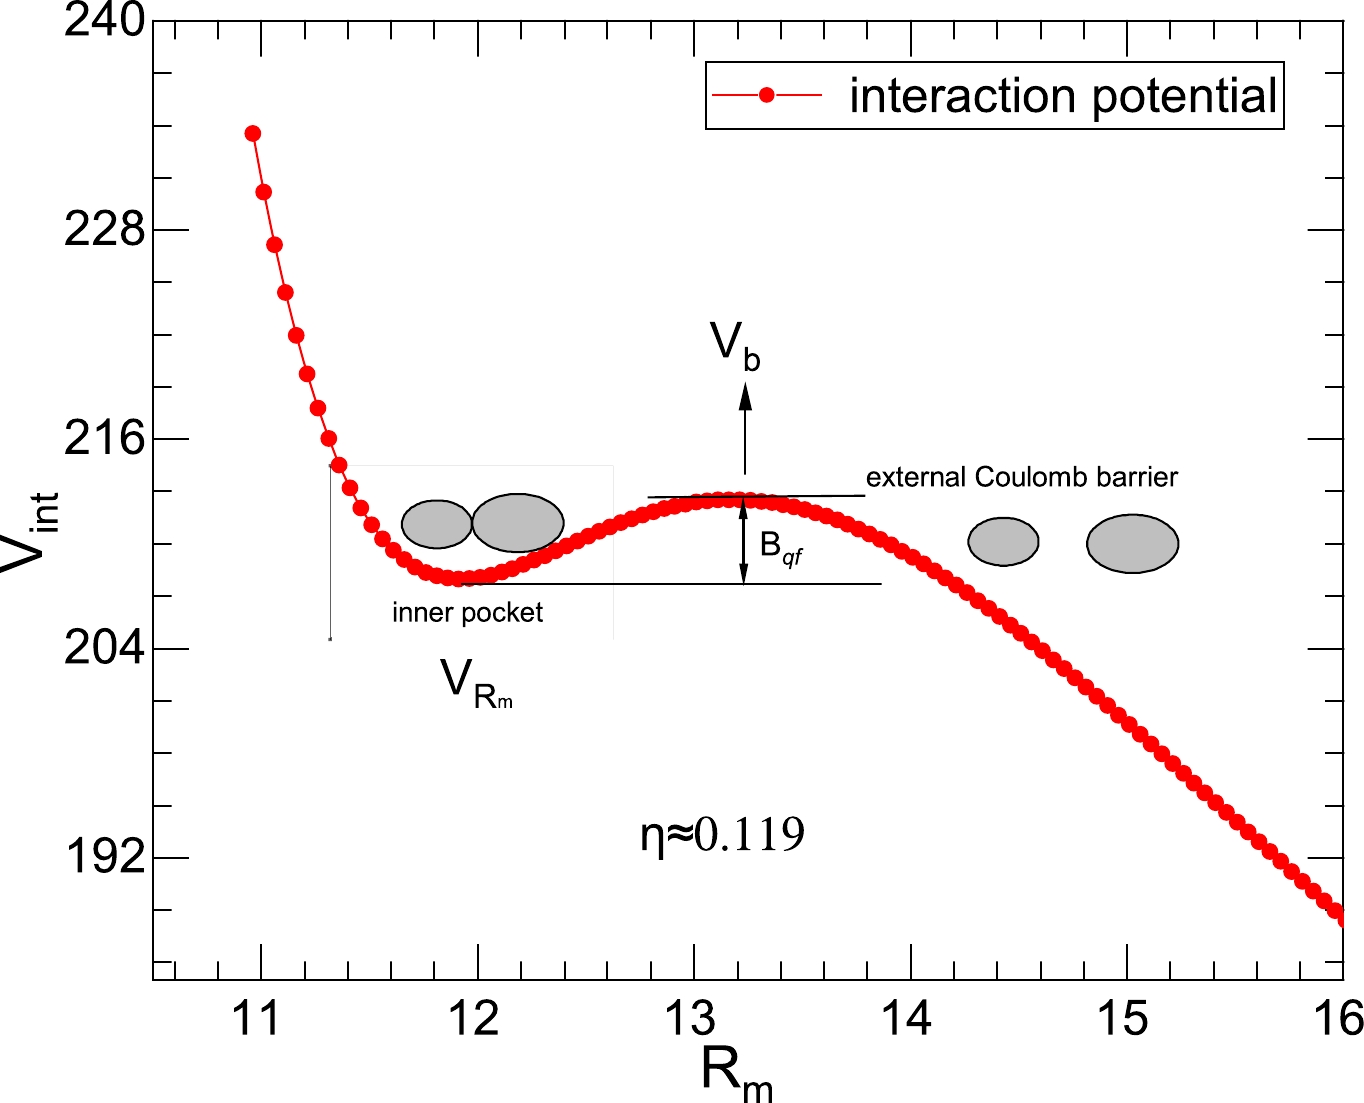 Figure1. (color online) The interaction potential of the configuration
 Similarity, in Fig. 2, we perform the calculation for the reaction
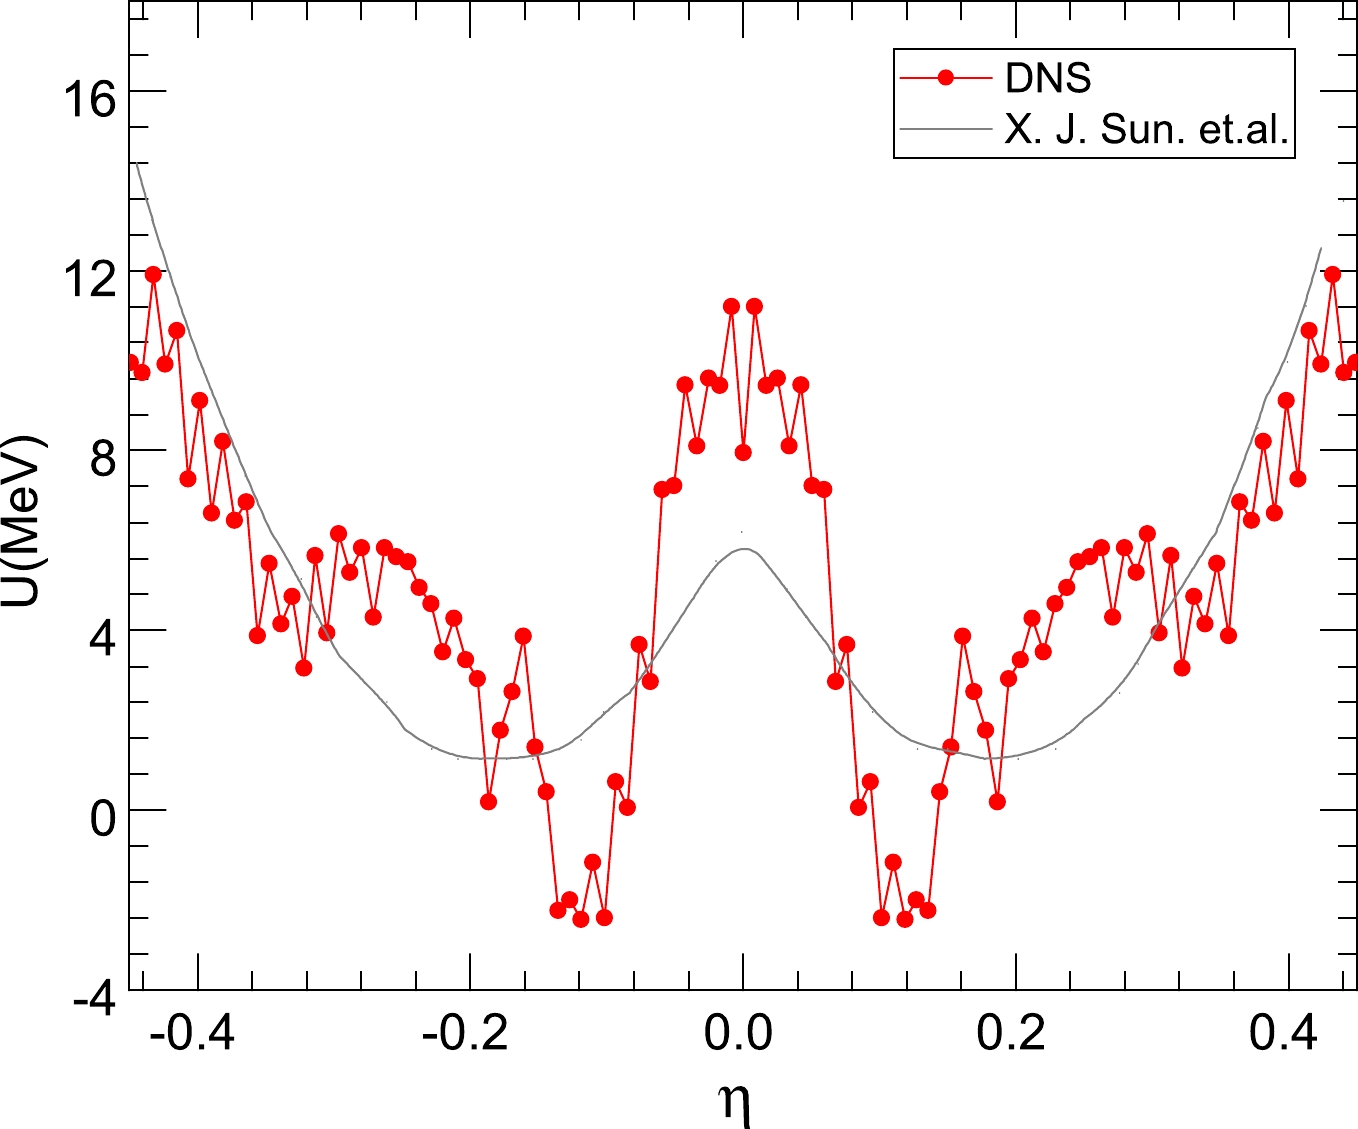 Figure2. (color online) The driving potential for the reaction
 In addition, it is noteworthy that the driving energy can respond to the fission yields from different angles. There are two valleys in Fig. 2 that represent the part of the asymmetric fission corresponding to the mass asymmetry
Moreover, the driving energy is related to the local excitation energies of independent systems in the simplified TDSPM. The excitation energy is input into the driving energy of the DNS as a parameter of the shell damping effect, which is also taken into consideration. It affects the value of the driving energy
2
B.Charge and mass distributions
The quantitative description of fission yields has practical value for nuclear energy studies. To accurately estimate the fission yield information, within the framework of the simplified TDSPM based on the ground states of nuclei, we investigated the mass, charge, and kinetic-energy distributions of fission fragments at low excitation energies, considering the tip-to-tip orientation. Moreover, the total yields of fission fragments have been normalized to 200%.Based on this, Fig. 3 shows the experimental and calculated charge distributions for electromagnetic and neutron-induced fissions. The black circles represent the experimental results. Considering the charge conservation, we assume that no protons are released during the fission process; the results calculated using the simplified TDSPM are shown with red points in Fig. 3. There are some significant discrepancies in Fig. 3(a)-(c) between theoretical results and experimental results. The theoretical peak positions are significantly closer to those for symmetrical fission products. However, the widths are narrower for two peaks, and the magnitudes are larger. This can be attributed to the following: (1) over-simplified description of the binding energy; (2) only the ground state deformation of the nucleus is considered; (3) shell correction is inappropriate. On the other hand, neutron-induced fission
 Figure3. (color online) The charge distributions of fission fragments. (a) The reaction of
 At the same time, we compare the results with M?ller's theory [blue curve in Fig. 3], whose calculations are much better than the results obtained using the simplified TDSPM in terms of the peak position, peak magnitude, and peak width. However, as shown in Fig. 3, the substantial difference between M?ller’s theory and ours is noticeable. M?ller’s theory only provides approximately smooth curves for the charge distributions in nuclear fission. The yields of even-Z nuclei calculated using the simplified TDSPM are more significant than those of the neighboring odd-Z nuclei. This shows that the odd-even effect plays an important role in the fission process and adds some oscillations to the smooth parts of charge distributions. Meanwhile, it does not change the smooth parts of the fission distributions appreciably, which is important.
Similarly, in Fig. 4, the mass distributions are predicted for reactions of the electromagnetic-induced fission of
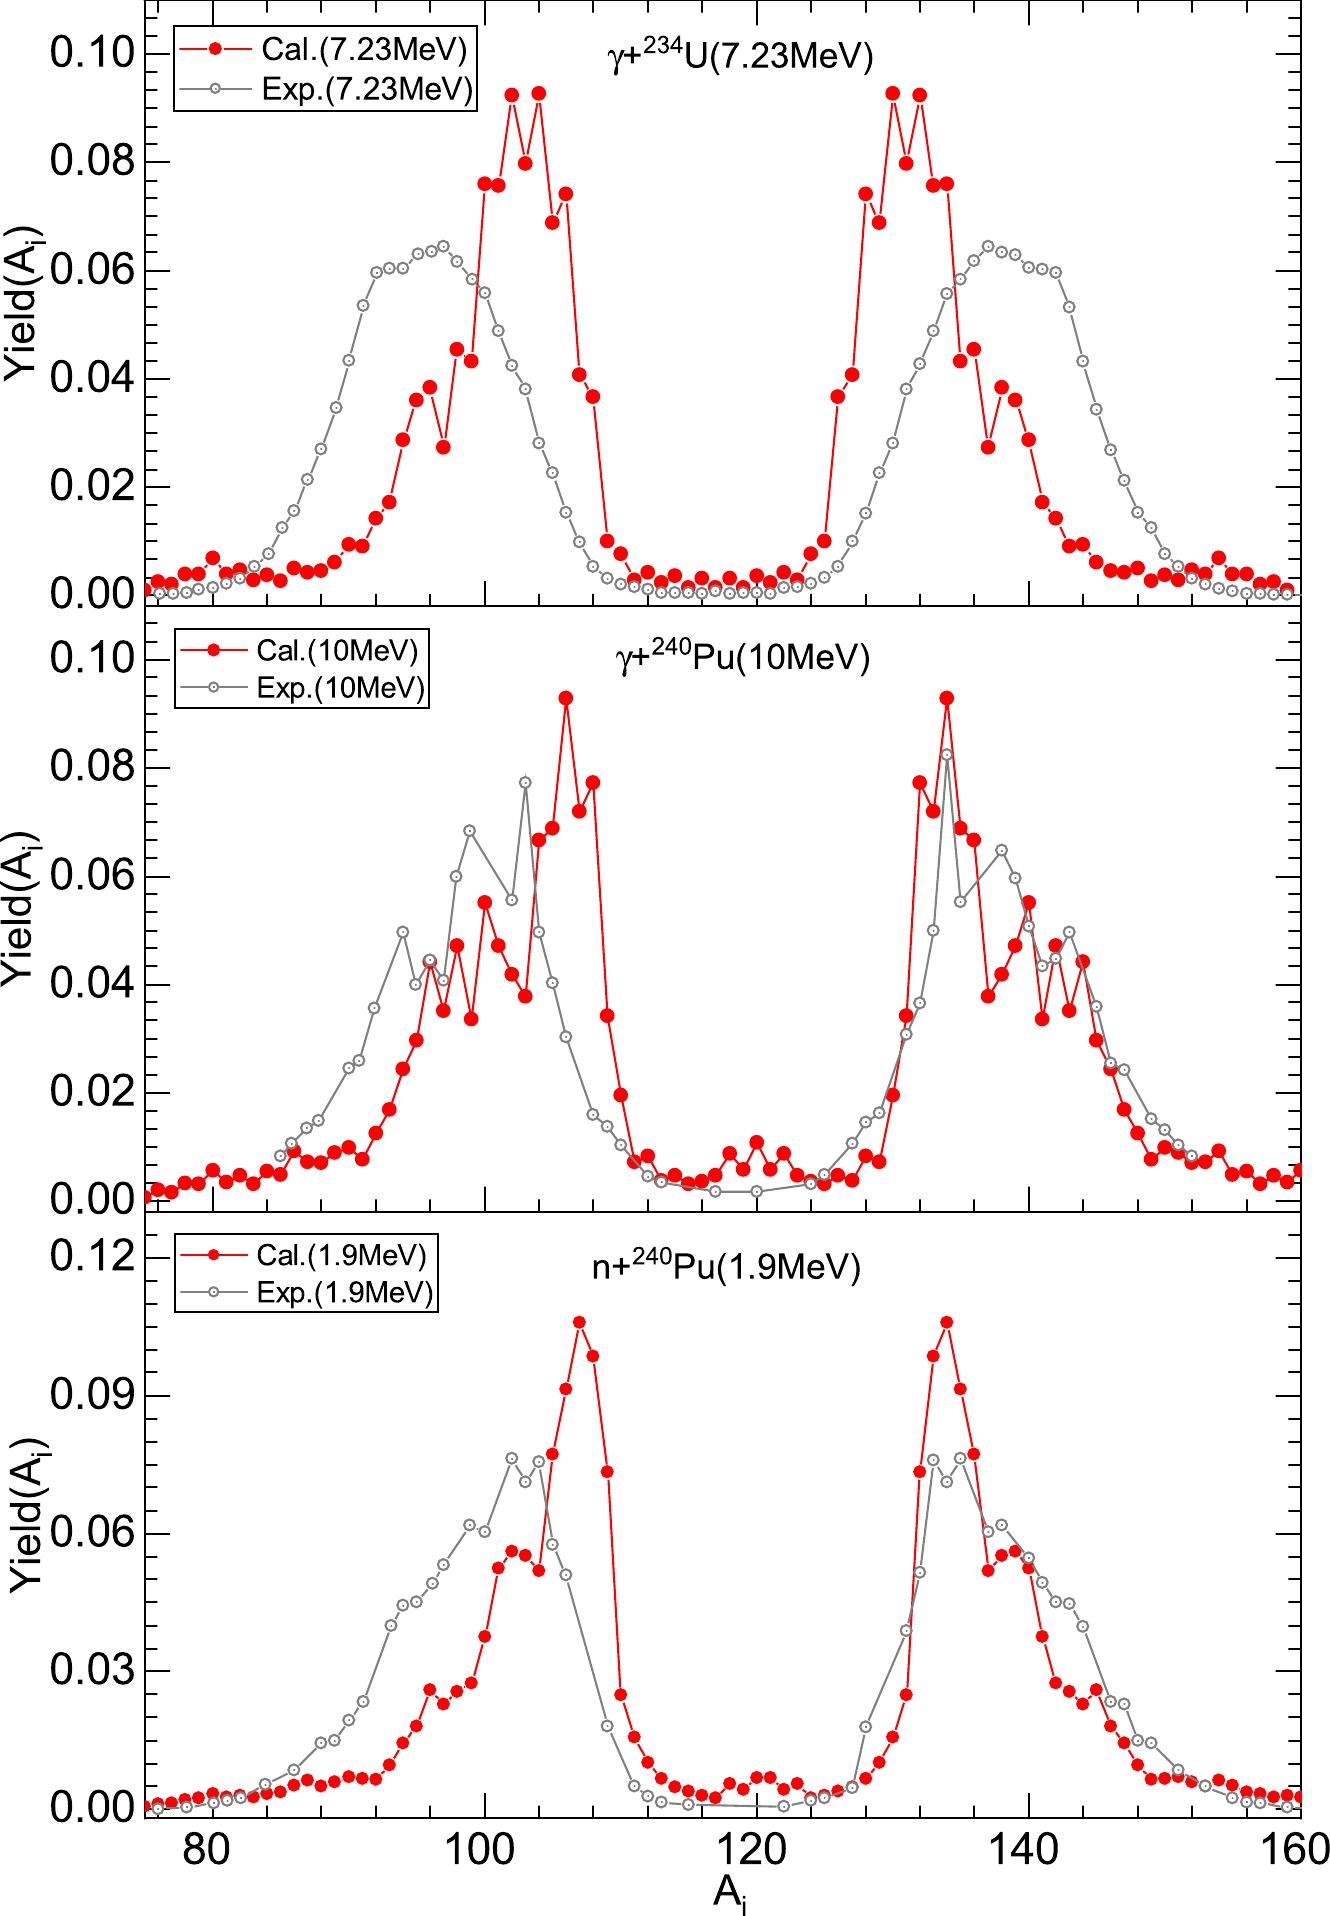 Figure4. (color online) Comparison of the calculated mass distributions with experimental data. (a) The reaction of the electromagnetic-induced fission of
 2
C.Fission yields of the isotone chain
To study the fission-fragment charge and mass distributions of the isotone chain, we consider some fission systems-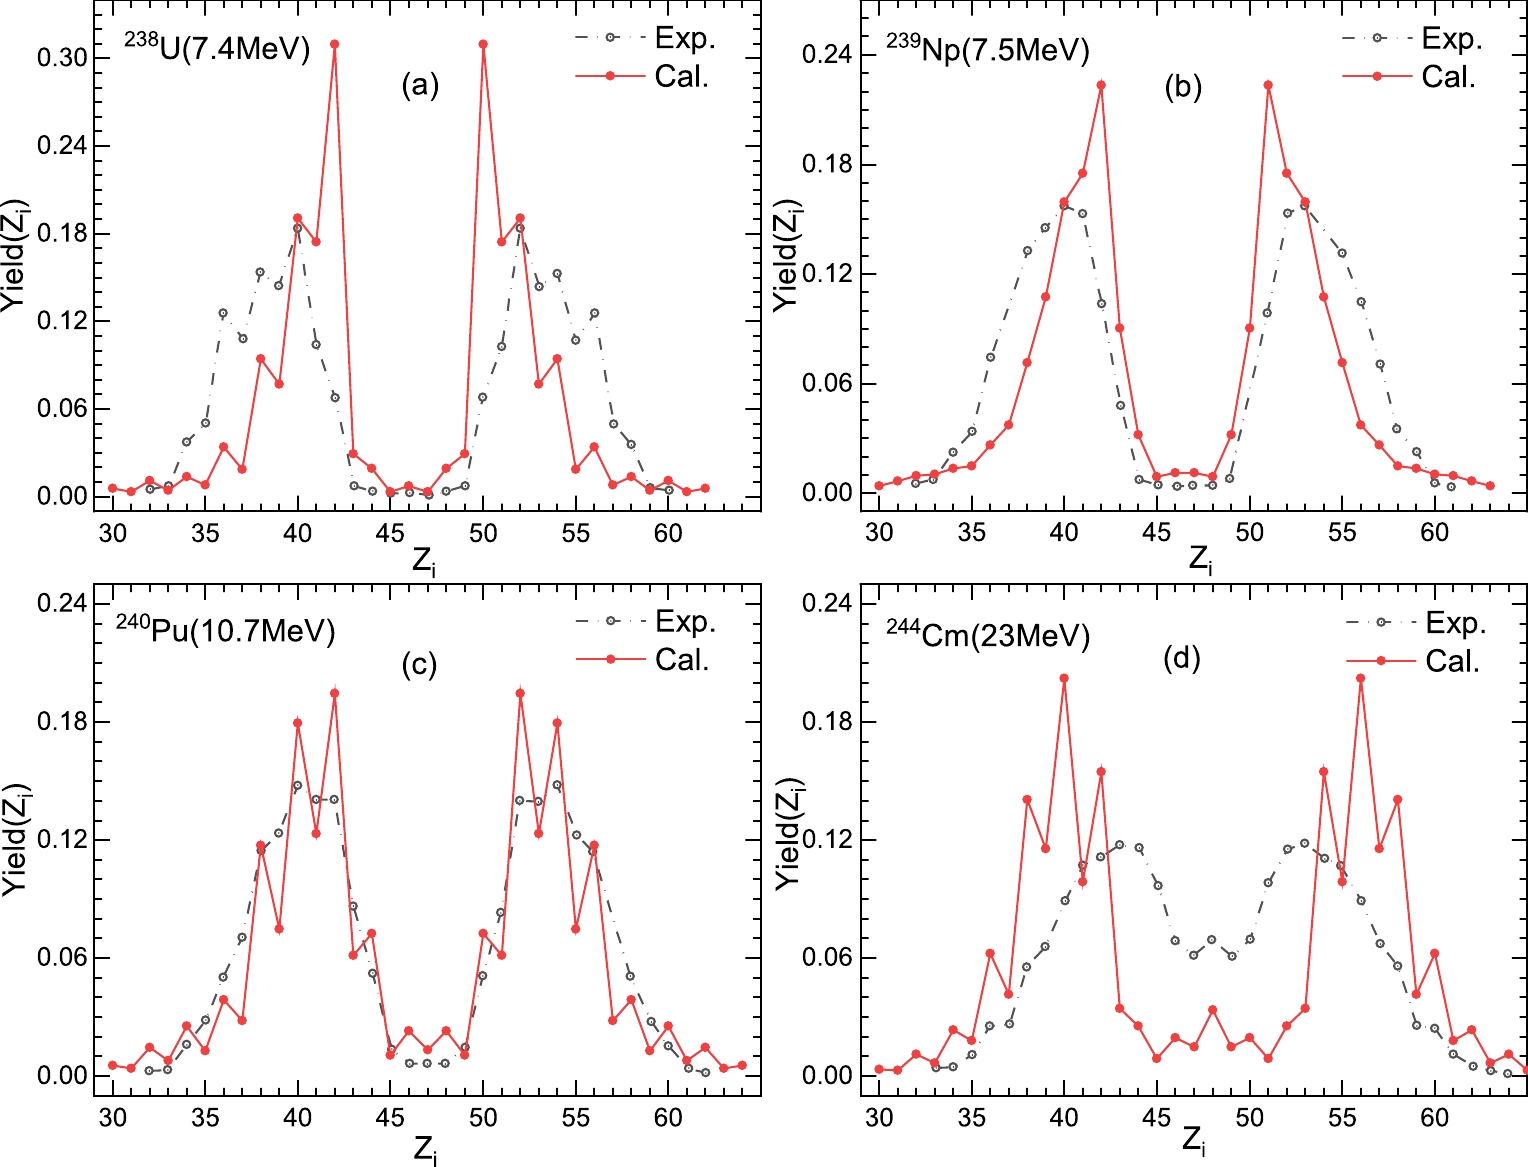 Figure5. (color online) The calculated charge distributions of isotone chains at low excitation energies, in which the neutron number N is equal to 146, and the fission nuclei are
  Figure6. (color onlinr) The same as Fig. 5, but for mass distributions of isotone chains. A simple correction was applied to the corresponding experimental data to account for the neutron evaporation in the fission process.
The difference between the experimental and theoretical results indicates that the shell damping effect is overstated for fission-fragment distributions. However, this comparison reveals a good agreement despite the above statement, which is sufficient for exploring fission-fragment distributions. Moreover, the dependence of the isotone-fission system on the excitation energy
2
D.Thermal neutron induced fission of $ ^{239} $![]()
![]()
Pu
Interestingly, one of the apparent observations from Fig. 3 to Fig. 6 is that for plutonium, the calculated results are consistent with the experimental data, specifically with respect to the charge distribution. This suggests the correctness of the calculation method for neutron-induced and electromagnetic-induced plutonium reactions.In light of the above, we tested the universality of the simplified TDSPM for describing the fission-fragment distributions of plutonium. Utilizing the excellent agreement of the calculated results with the experimental data, in Fig. 7, we compare the calculated charge and mass distributions with the experimental yields [58-60]; for comparison, we also show the results of other theoretical calculations [61] for the thermal neutron-induced fission of
 Figure7. (color online) The reaction of thermal neutron-induced fission of 239Pu. (a) Comparison of the charge distribution calculated using the TDSPM with the experimental data [58, 59] and other theoretical calculations [61]. (b) The calculated mass distribution is compared to the experimental data [60].
2
E.TKE as a function of the mass distribution
It is instructive to analyze the energy dependence of observable characteristics, for electromagnetic and neutron-induced fission cases. Fig. 8 shows a comparison between the different data sets for the TKE, for different mass distributions, for the fission reaction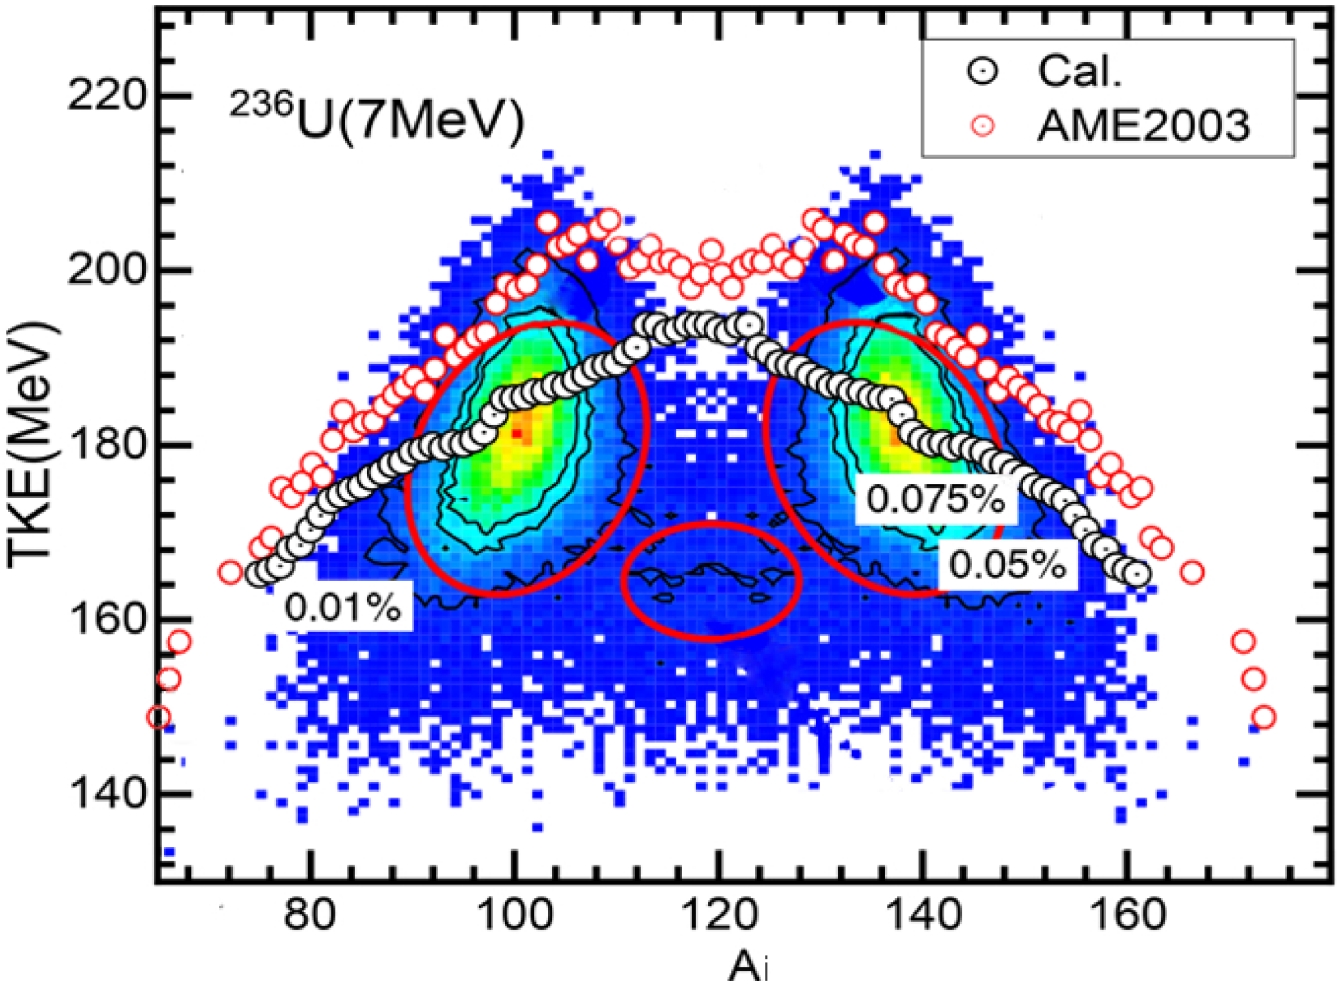 Figure8. (color online) Mass dependence of the TKE for the reaction of
 To illustrate the relation between the TKE and mass distributions, Fig. 8 compares our calculated TKE results with previously reported theoretical results [21] for the fission reaction
However, for the symmetrical fission component, the calculated results are above the corresponding TKE of fission fragments. This indicates that our theory can not accurately calculate the SL mode. However, for the S1 and S2 modes, as shown by the mass distributions in Fig. 4, Fig. 6, and Fig. 7, there is a small bump near the peaks of the mass distributions (where
The theoretical results were in perfect agreement with experimental data with respect to the peak position, width, and magnitude. Especially for charge distributions, the odd-even effect of nuclei was well explained, with the corresponding distributions exhibiting jagged shapes. For mass distributions, however, the predictive power was slightly weaker. Finally, the energy dependence of mass distributions was also calculated, and the results were compared with those from other works. Based on the DNS, the mass, charge, and kinetic-energy distributions were accurately calculated within the framework of the TDSPM. The theoretical fission yield curves for lighter actinides were found to agree well with experimental data.
