HTML
--> --> -->Large scale analyses of global OMPs have been performed for elastic scattering involving light projectiles, namely neutrons, protons, deuterons, helium-3, tritons, and alpha-particles [1-6]. For heavy-ion elastic scattering, the study of OMPs is still in a developing stage and far from satisfactory. On the one hand, the experimental data on elastic scattering for reactions induced by heavy ions are insufficient. On the other hand, the exhibited angular distributions involving heavy-ion elastic scattering and the resultant optical model parameters are quite different from those observed for light ions. This is because the composite nature of the system makes the nuclear reaction mechanism more complicated as the result of mutual excitations, such as breakup or transfer reactions [7, 8].
In particular, the 12C nucleus is one of the most important and interesting nuclei for nuclear structure and nuclear reaction physics. To date, all the existing OMPs for 12C have been constructed for individual targets and few energy points. They are only applicable to special reactions and cannot predict other reactions, for which there are no experimental data available. Systematic analyses of a large body of scattering data have enabled us to find systematic behavior of the potential parameters according to variations in the mass and charge of the target nucleus as well as the incident energy. In recent years, experimental facilities have been intensively developed, and a larger quantity of experimental data has been analyzed for reactions induced by 12C. It is therefore crucial to establish a reliable global OMP over wide energy and mass ranges to survey the unknown properties of nuclear reactions and nuclear structure mechanisms for 12C.
In the present study, we analyze the elastic-scattering angular distributions together with the total reaction cross section data for reactions induced by 12C over a wide range of incident energies and target masses to obtain the 12C global phenomenological OMP. The new global OMP is constructed with the aim of systematically describing the elastic scattering of 12C.
The paper is organized as follows. In Sec. 2, we present the method and formalism used in the present work. The new global OMP is further determined and discussed. In Sec. 3, a comparison between the results and experimental data is performed, and a detailed analysis is provided. Sec. 4 contains the main conclusions.
2.1.Form of the optical model potential
The optical model potential is generally composed of a real part, an imaginary part, and a Coulomb potential: $ \begin{array}{l} V(r,E) = V_{\rm R}(r,E)+{\rm i}[W_{\rm S}(r,E)+W_{\rm V}(r,E)]+V_{\rm C}(r), \end{array} $  | (1) |
The Woods-Saxon form factor is adopted in our analyses for both the real and imaginary parts of the global OMP. The real part and the surface absorption and volume absorption imaginary parts of the OMP are respectively expressed as
$ \begin{array}{l} V_{\rm R}(r,E) = -\dfrac{V_{\rm R}(E)}{1+\exp[(r-R_{\rm R})/a_{\rm R}]}, \end{array} $  | (2) |
$ \begin{array}{l} W_{\rm S}(r,E) = -4W_{\rm S}(E)\dfrac{\exp[(r-R_{\rm S})/a_{\rm S}]}{\{1+\exp[(r-R_{\rm S})/a_{\rm S}]\}^{2}}, \end{array} $  | (3) |
$ \begin{array}{l} W_{\rm V}(r,E) = -\dfrac{W_{\rm V}(E)}{1+\exp[(r-R_{\rm V})/a_{\rm V}]}, \end{array} $  | (4) |
The energy-dependent potential depths
$ \begin{array}{l} V_{\rm R}(E) = V_{0}+V_{1}E+V_{2}E^{2}, \end{array} $  | (5) |
$ \begin{array}{l} W_{\rm S}(E) = W_{0}+W_{1}E, \end{array} $  | (6) |
$ \begin{array}{l} W_{\rm V}(E) = U_{0}+U_{1}E. \end{array} $  | (7) |
$ \begin{array}{l} V_{\rm C}(r) = \left\{ \begin{aligned} & \dfrac{zZe^{2}}{2R_{\rm C}}\left(3-\dfrac{r^{2}}{R^{2}_{\rm C}}\right) &\quad r<R_{\rm C}, \\ & \dfrac{zZe^{2}}{r} & \quad r\geqslant R_{\rm C}, \end{aligned} \right. \end{array} $  | (8) |
2
2.2.Parametrization of the optical model potential
Experimental data for 12C elastic scattering for nuclei from 24Mg to 209Bi below 200 MeV are analyzed in the present work. All the data were obtained from the nuclear database EXFOR at www-nds.iaea.org/exfor/exfor.htm. Details of these data are listed in Table 1.| target | ELab /MeV | Ref. |
| 24Mg | 16.0,17.0,18.5,19.5,22.0,23.5,24.0 | [13] |
| 40.0 | [14] | |
| 28Si | 25.0,29.0,30.0,32.0,34.0,36.0,40.0,46.0 | [15] |
| 49.3,70.0,83.5 | [16] | |
| 59.0,66.0 | [17] | |
| 186.4 | [18] | |
| 19.0,21.0,23.0 | [19] | |
| 27.0 | [20] | |
| 23.0,24.0,25.0,27.0,28.0,29.0,29.86,31.29 | [21] | |
| 32S | 16.86,17.86,18.86,19.86,20.87,21.87,22.87 | [22] |
| 35.78 | [23] | |
| 39K | 54.0,63.0 | [24] |
| 40Ca | 50.96 | [25] |
| 180.0 | [26] | |
| 42Ca | 49.89 | [25] |
| 48Ca | 47.13 | [25] |
| 50Cr | 65.0,73.5,140.0 | [27] |
| 56Fe | 60.0 | [28] |
| nat.Fe | 124.5 | [29] |
| 58Ni | 26.0,27.0,27.5,28.0,28.5 | [30] |
| 60.0 | [31] | |
| nat.Ni | 124.5 | [29] |
| 64Ni | 48.0 | [32] |
| 90Zr | 66.0 | [33] |
| 90.0 | [34] | |
| 120.0,180.0 | [26] | |
| 91,94,96Zr | 66.0 | [33] |
| 92Zr | 66.0 | [35] |
| 92Mo | 60.0,90.0 | [34] |
| 116-120,122,124Sn | 66.0 | [33] |
| 194,198Pt | 73.5 | [36] |
| 208Pb | 54.5,55.5,56.0,56.5,57.0 | [30] |
| 58.9,60.9,62.9,64.9,69.9,74.9,84.9 | [37] | |
| 118.0 | [38] | |
| 180.0 | [26] | |
| 209Bi | 58.9,59.9,60.9,61.9,62.9,63.9,65.9,69.9,74.9,87.4 | [39] |
| 118.0 | [38] |
Table1.The elastic-scattering angular distributions database for 12C projectiles. E is the incident energy for different targets in the laboratory system.
As noted in our previous works [9-11], all these elastic scattering data are fitted simultaneously using the improved APMN code [12]. The 12C OMP parameters are optimized by minimizing
$ \begin{array}{l} \chi^{2} = \dfrac{1}{N}\displaystyle\sum\limits_{i = 1}^{N}\left[\dfrac{\sigma_{i}^{\rm th}-\sigma_{i}^{\rm ex}}{\Delta\sigma_{i}^{\rm ex}}\right]^{2}, \end{array} $  | (9) |
| parameter | value | unit |
  | 277.772 | MeV |
  | ?0.278 | |
  | ?0.0001 | MeV?1 |
  | 56.059 | MeV |
  | ?0.0546 | |
  | 5.0 | MeV |
  | 0.279 | |
  | 1.158 | fm |
  | 0.0273 | fm |
  | 1.161 | fm |
  | 1.627 | fm |
  | 1.1 | fm |
  | 0.770 | fm |
  | 0.851 | fm |
  | 0.545 | fm |
Table2.Global OMP parameters for 12C projectiles
3.1.Elastic-scattering angular distributions
The elastic-scattering angular distributions of the reactions induced by 12C are calculated using the present global OMP and are systematically analyzed by comparing the theoretical results with the corresponding experimental data. For light heavy ion systems, the total mass number of the projectile and target is usually less than fifty ( Figure1. Comparison of the calculated elastic-scattering angular distributions with the experimental data [13, 14] for 24Mg.
For the 12C + 28Si system, the OMP calculations of the elastic-scattering angular distribution are also compared with different experimental data [15-20], as shown in Fig. 2. It is clear that the experimental angular distributions are smooth below 30.0 MeV. Moreover, no oscillation is observed at the incident energies of 21.0 and 23.0 MeV, especially for backward-angles [19]. The results calculated by the global OMP thus reproduce the experimental data well. However, between 32.0 and 40.0 MeV, the experimental data for the angular distributions exhibit an upward trend above
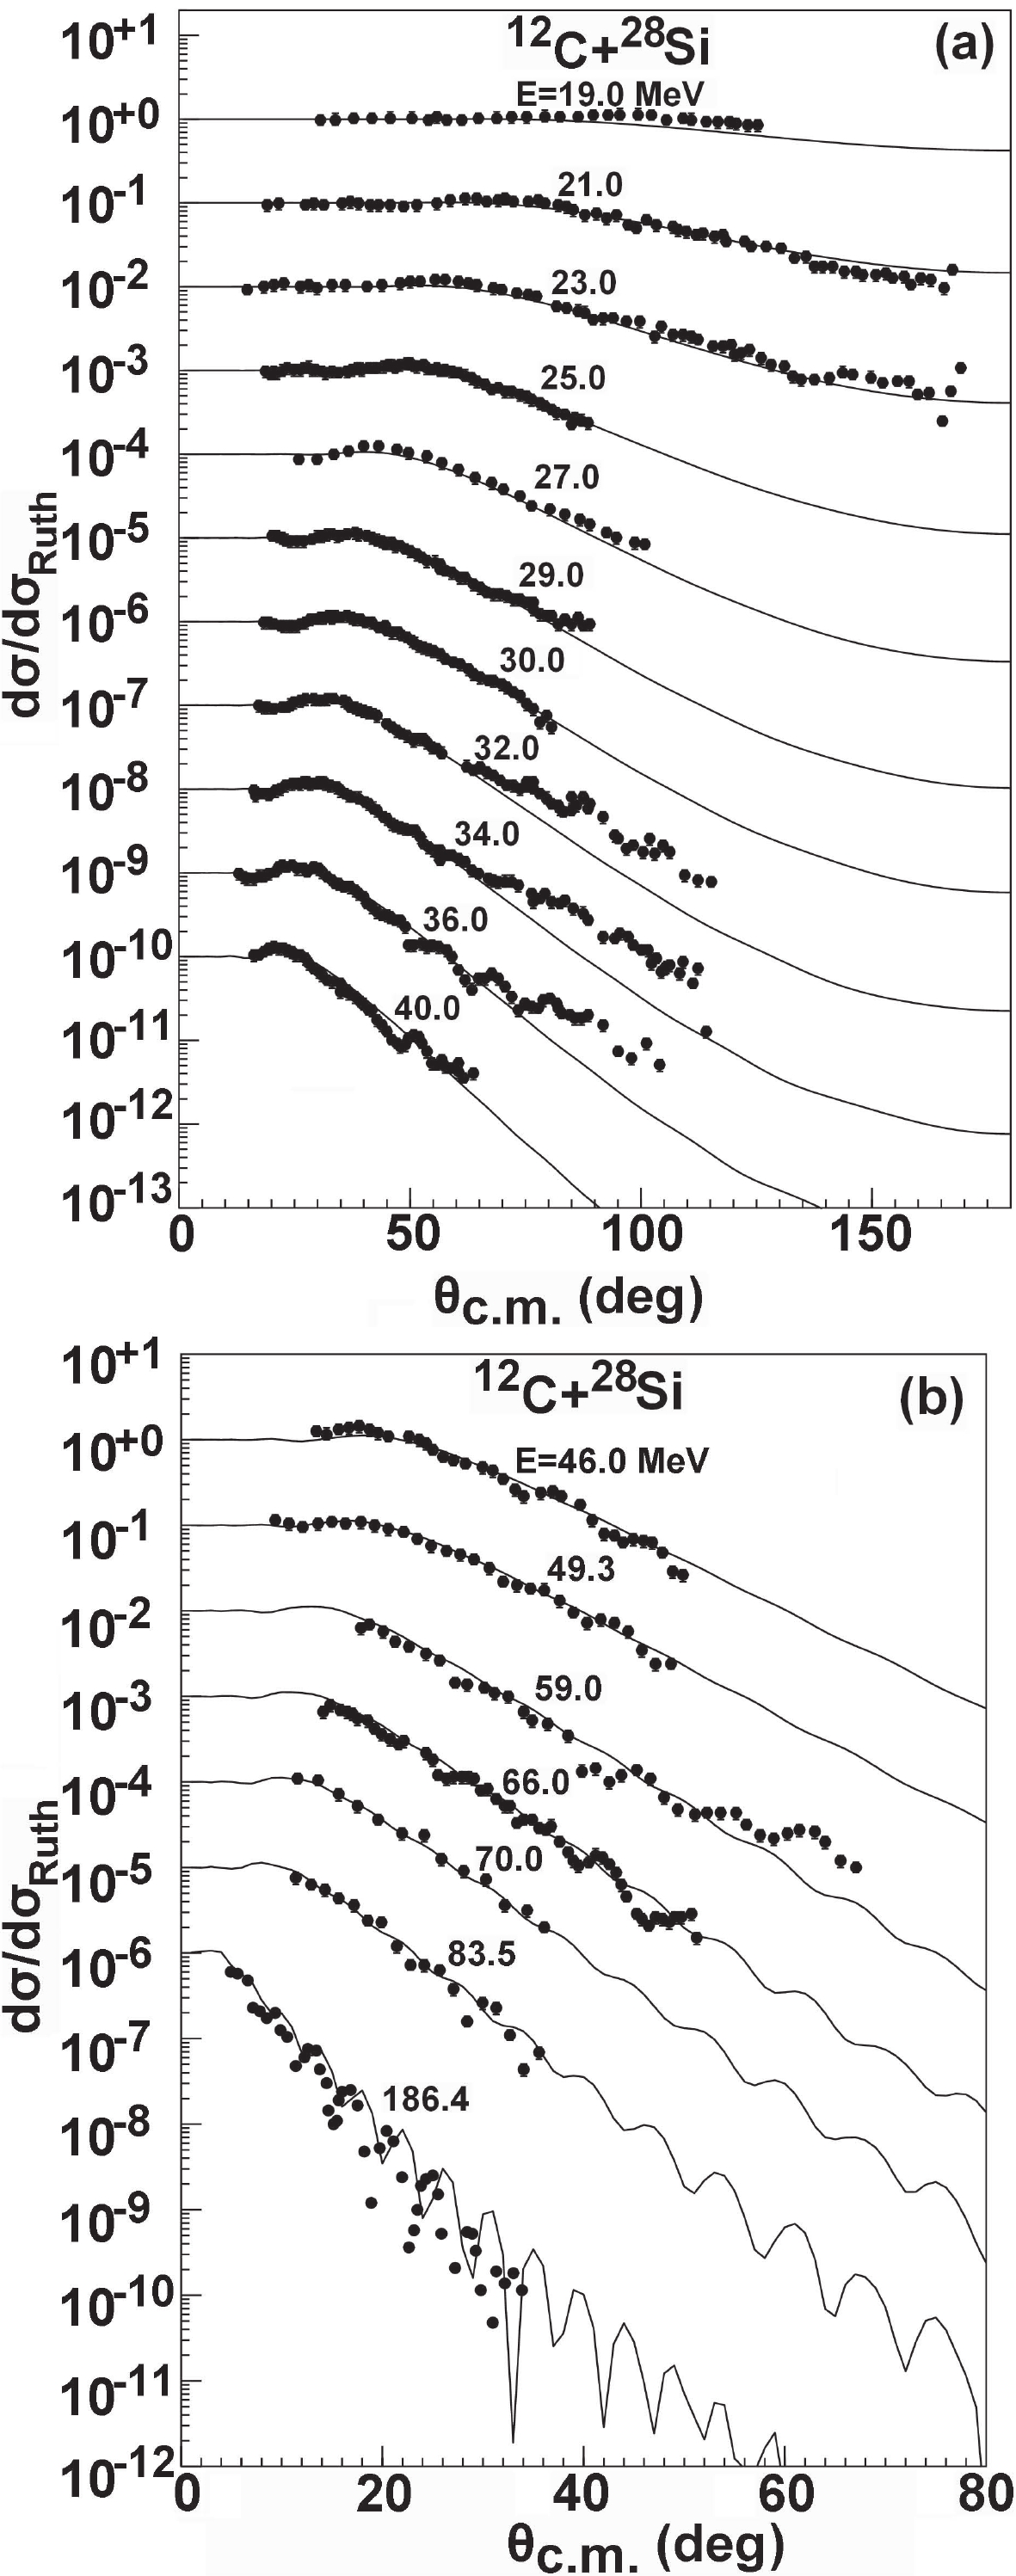 Figure2. Same as Fig. 1, but for 28Si [15-20].
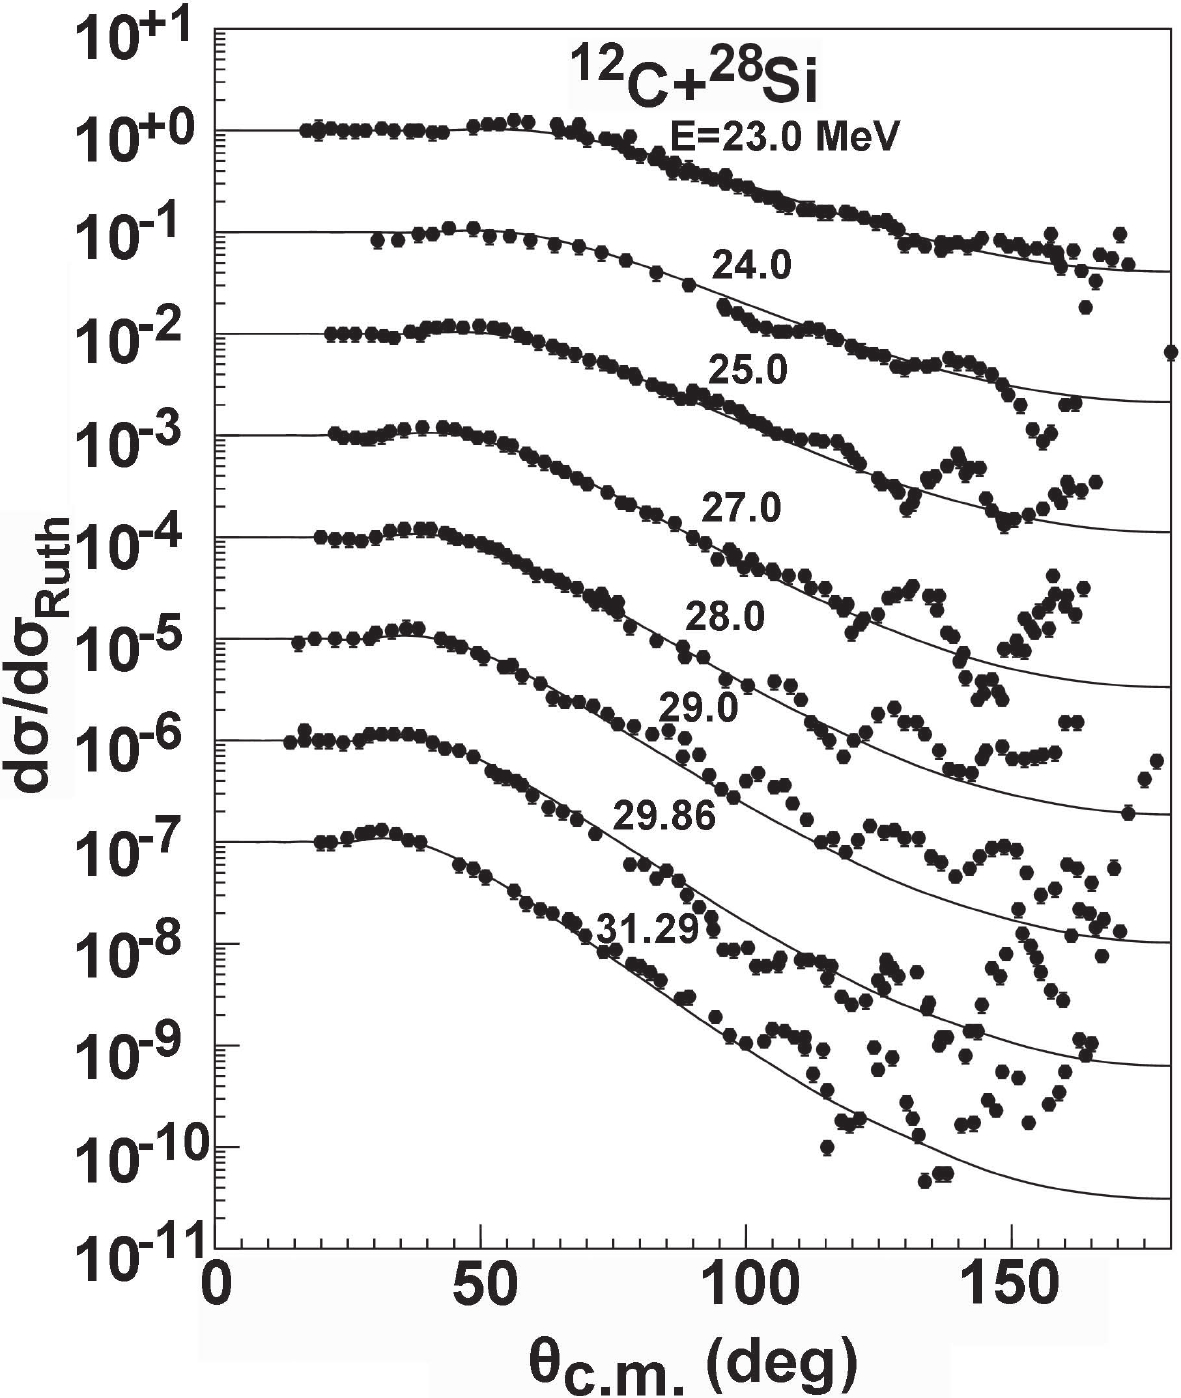 Figure3. Same as Fig. 1, but for 28Si [21].
The results of our global OMP analysis of the elastic-scattering angular distribution for 32S are shown in Fig. 4. The data in Ref. [22] are only for the angular distributions in the range from
In general, a similarity among the experimental measurements is that weak and strong oscillations and occasional irregular structures are clearly exhibited for the light targets 24Mg, 27Al, 28Si, and 32S at different incident energies. The global OMP cannot reasonably describe oscillating behaviors in backward-angles since these light nuclei are considered to exhibit significant
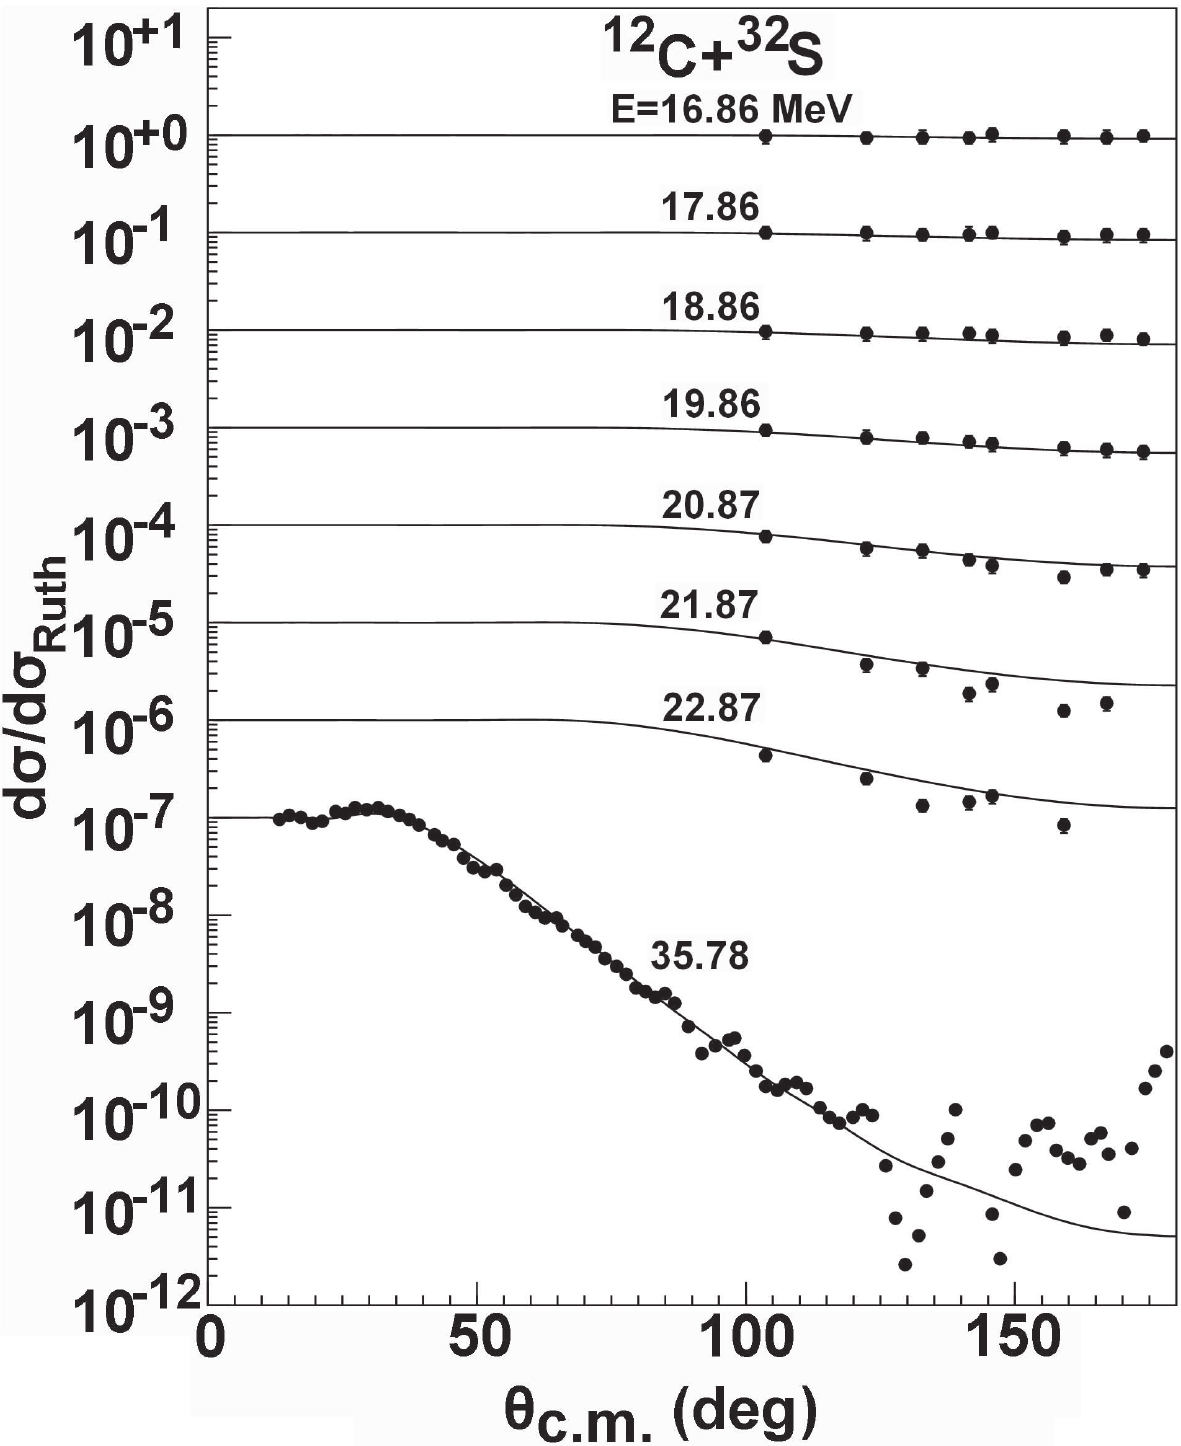 Figure4. Same as Fig. 1, but for 32S [22, 23].
Figure 5 presents the fit of the calculations to the experimental data [25, 26] for 40Ca at incident energies of 50.96 and 180.0 MeV and compares the predictions and experimental data [26] at 300.0 and 420.0 MeV. Finally, it provides comparisons for isotopes,
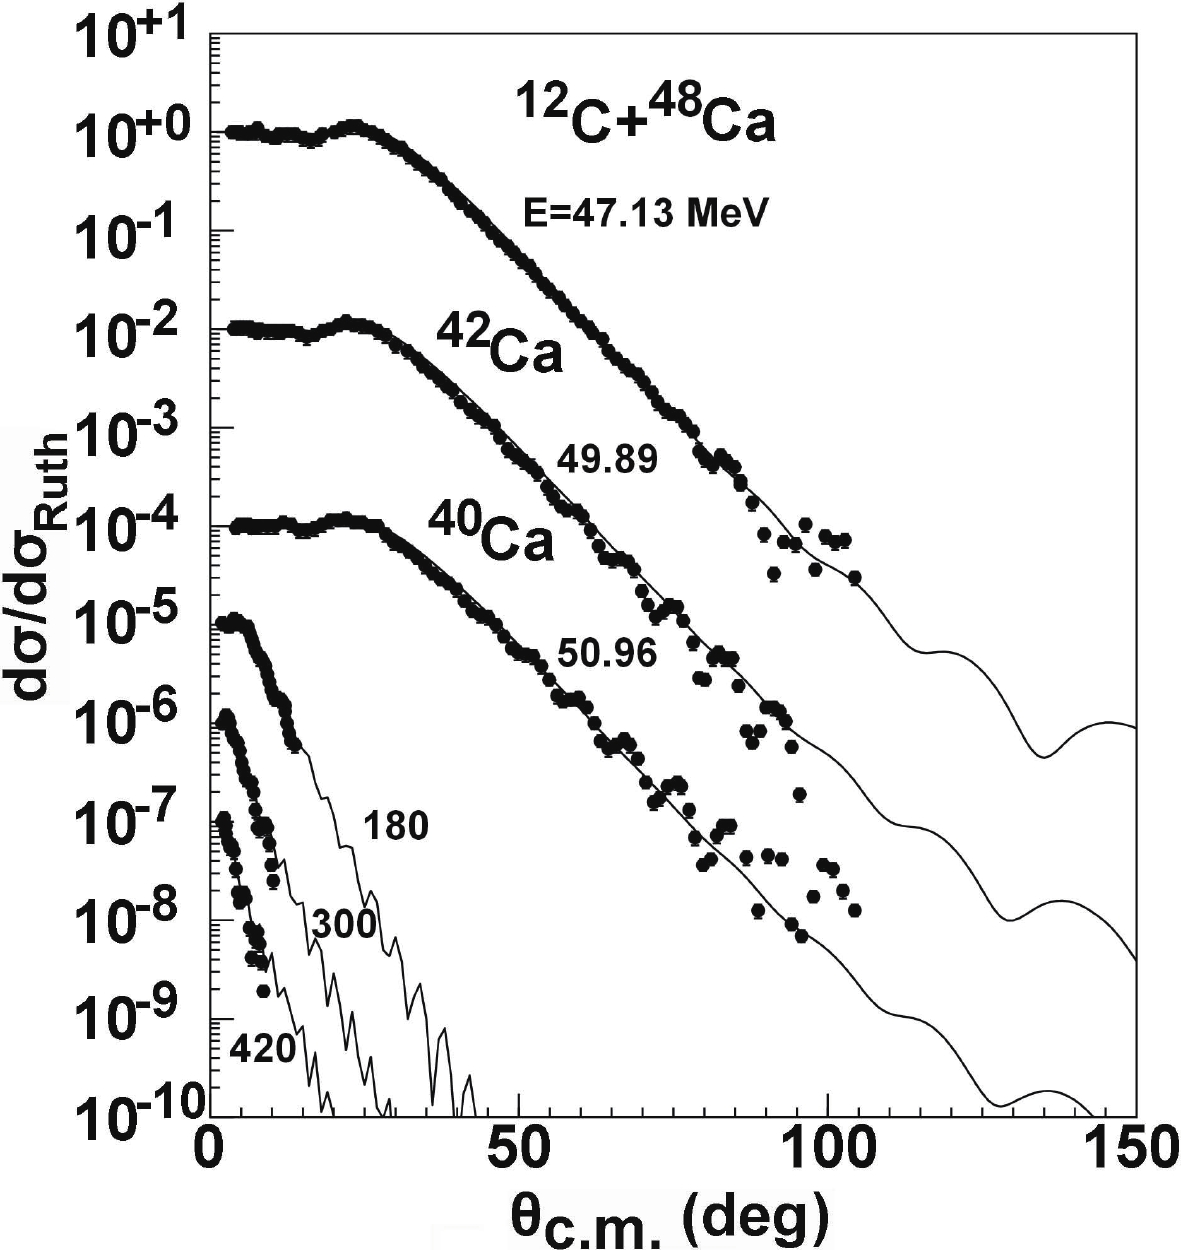 Figure5. Same as Fig. 1, but for
 The calculations of the elastic angular distributions for 39K, 50Cr, and 56Fe are shown in Fig. 6. This comparison indicates that a reasonable fit with the experimental data [24, 27-29] is obtained using the global OMP except for 56Fe at the incident energy of 60.0 MeV, for which the calculations are slightly larger than the measurements [28]. In Fig. 7, we compare the elastic angular distribution calculated using the obtained global OMP with the corresponding experimental data [29-31] at different incident energies for the reaction of 12C + 58Ni. A good description of the elastic scattering cross section data is obtained at the incident energies of 26.0, 27.0, 27.5, 28.0, 28.5, and 124.5 MeV, while the calculation at 60.0 MeV is smaller than the data in Ref. [31].
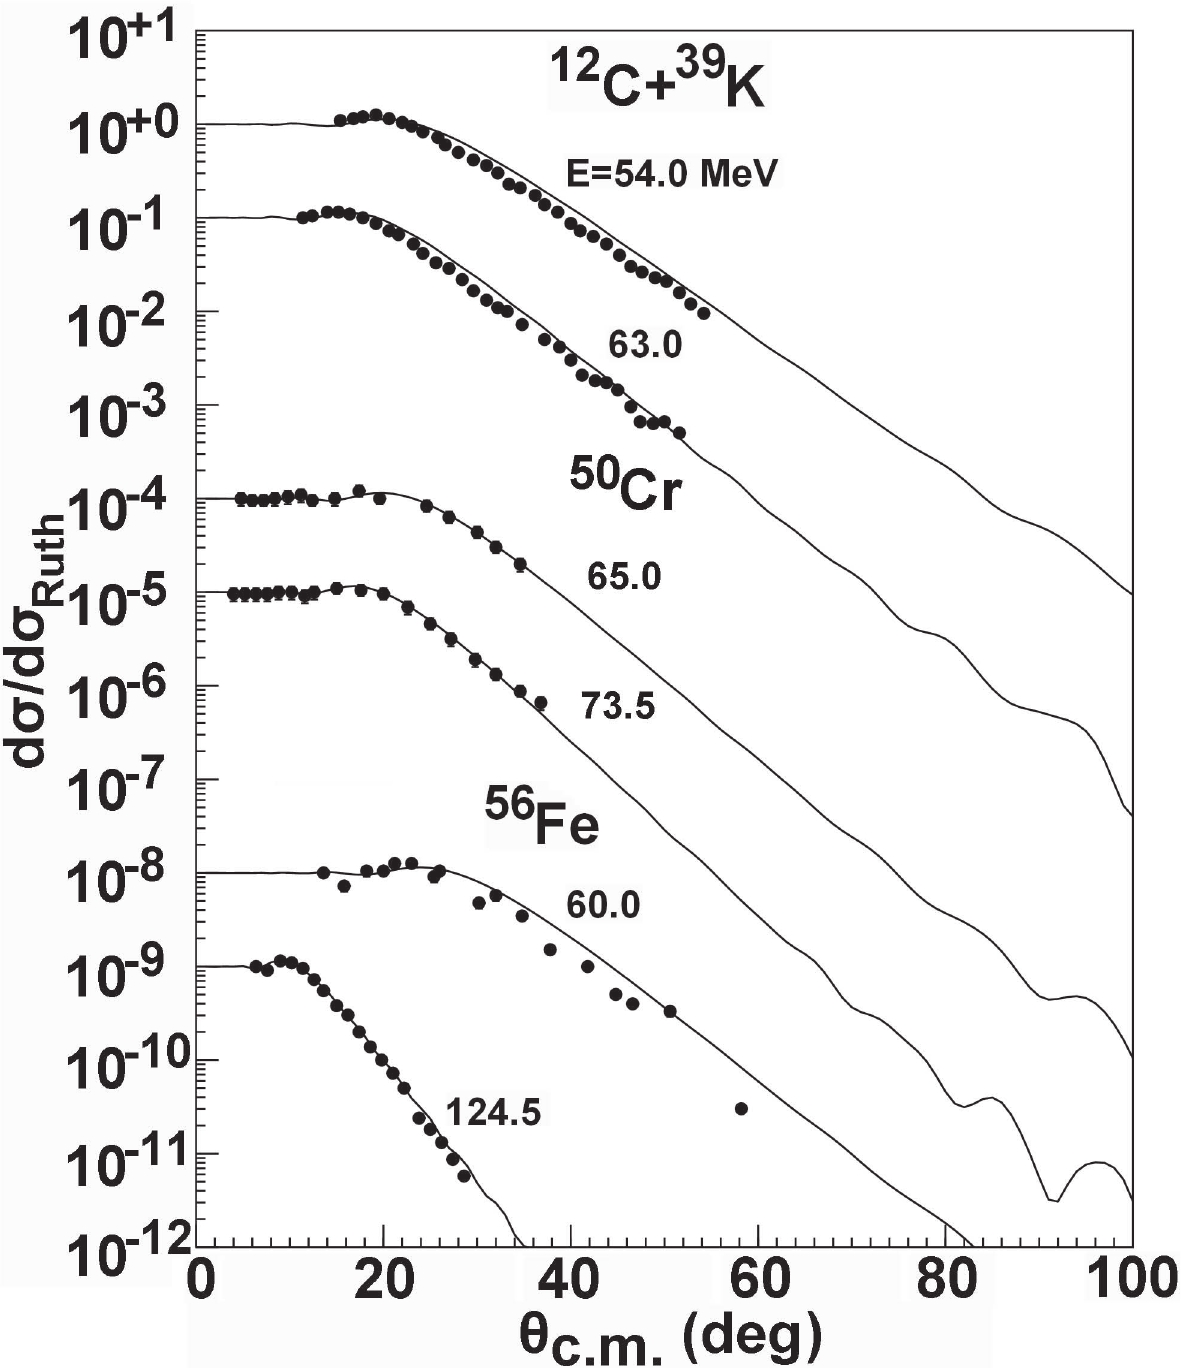 Figure6. Same as Fig. 1, but for 39K, 50Cr, and 56Fe [24, 27-29].
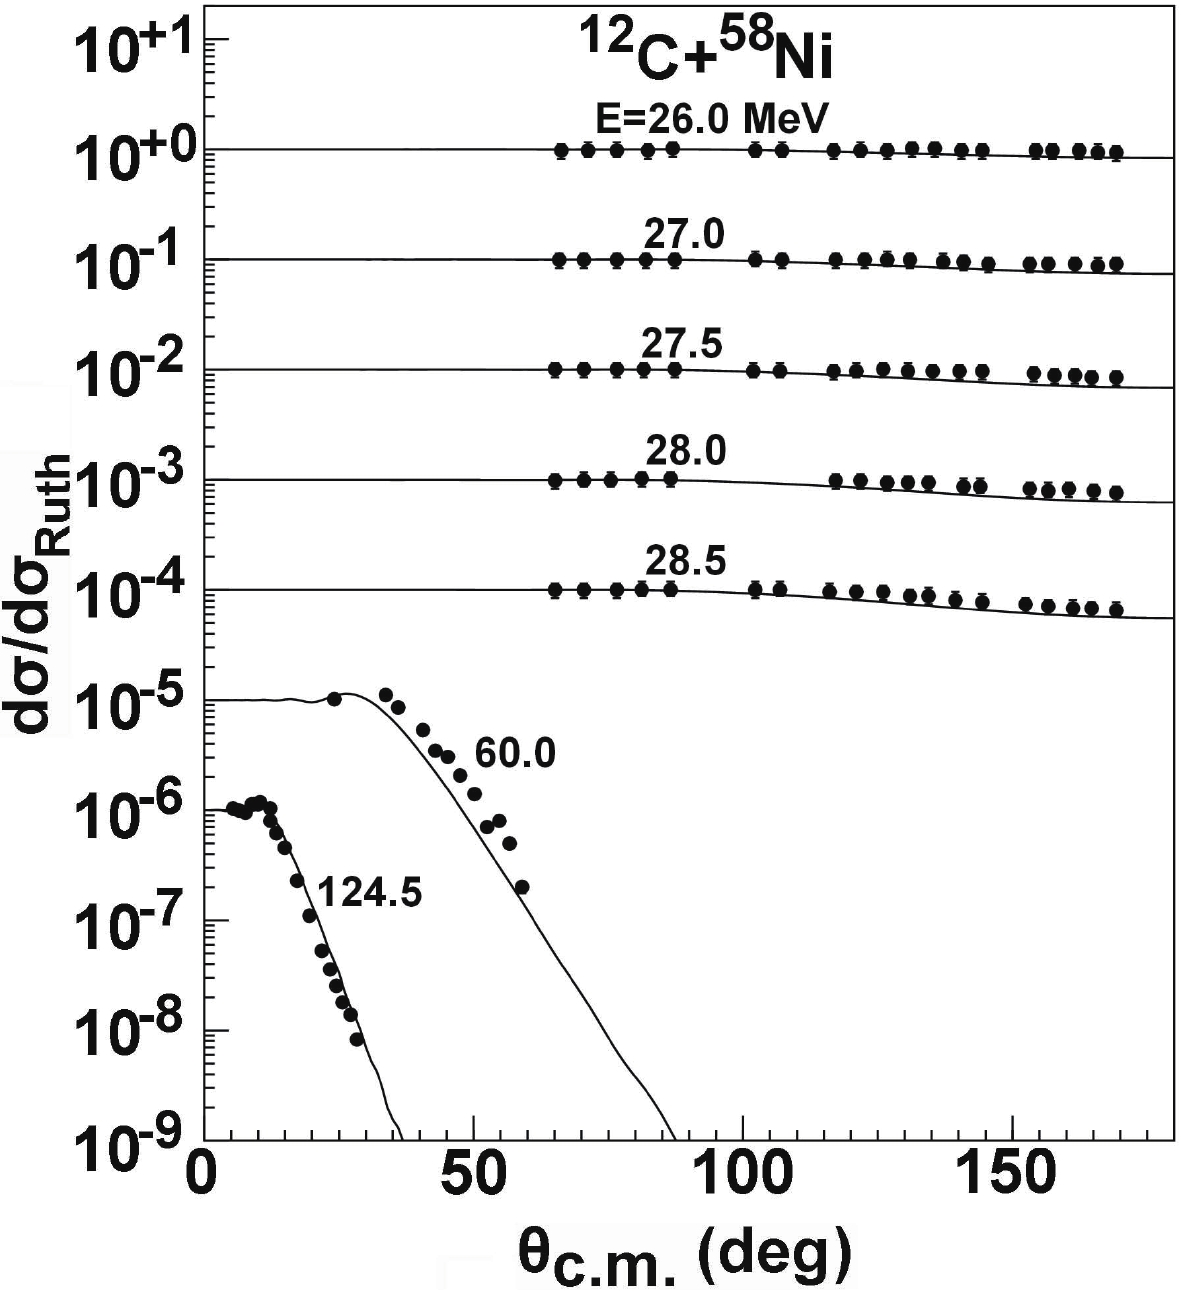 Figure7. Same as Fig. 1, but for 58Ni [29-31].
The elastic-scattering angular distributions are also calculated using the obtained global OMP for some medium mass targets. For the 12C + 90Zr system, the calculations are compared with the corresponding experimental data [26, 33, 34], and they are in good agreement with the existing experimental data at all incident energies. These results are presented in Fig. 8.
 Figure8. Same as Fig. 1, but for 90Zr [26, 33, 34].
For 64Ni targets, the elastic-scattering angular distributions were only measured at one energy point. Figure 9 presents the comparison between the calculations and the measurements [32] at 48.0 MeV. Good agreement on the elastic angular distribution is obtained between them. We compare the elastic angular distributions of 92Mo with the data [34] in Fig. 9. The calculations are very consistent with the corresponding experimental data at 60.0 and 90.0 MeV.
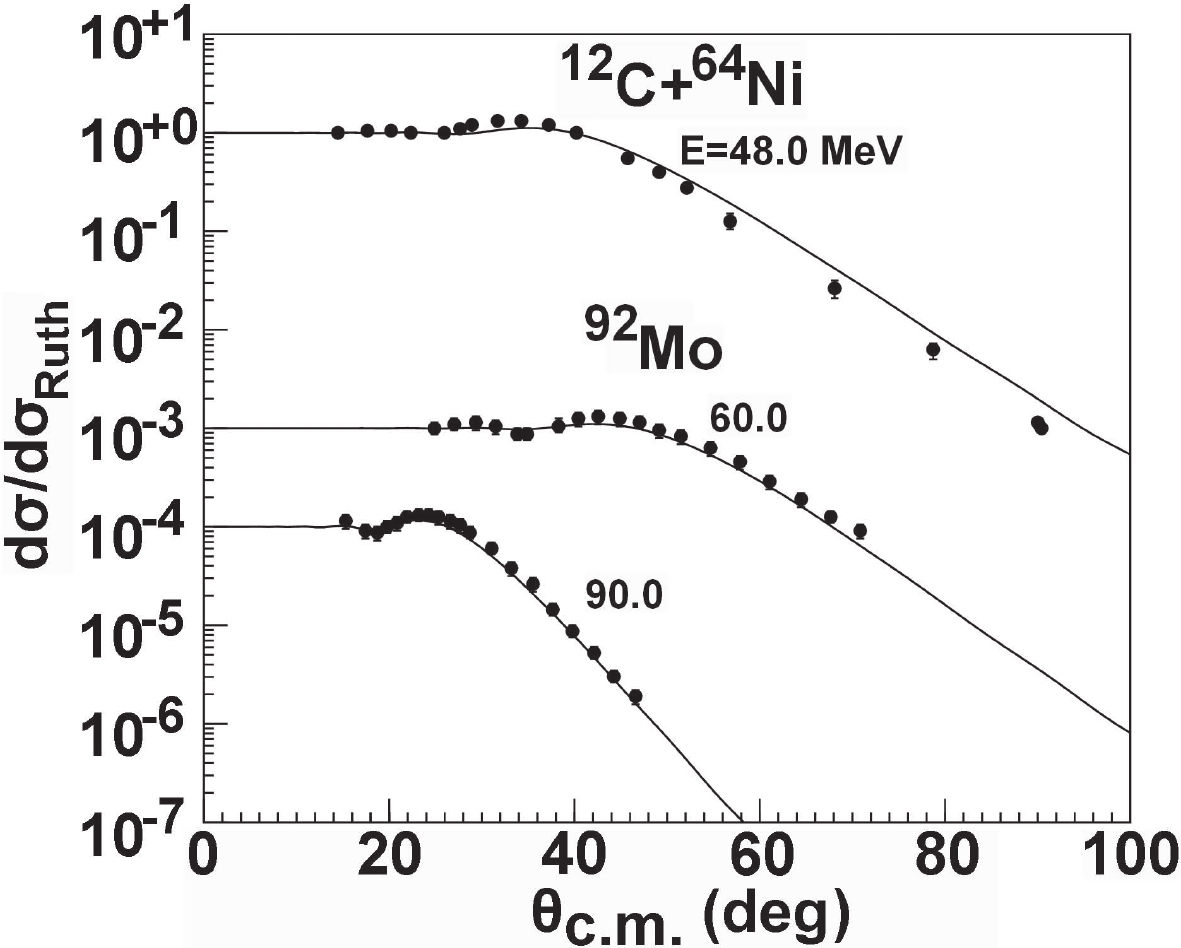 Figure9. Same as Fig. 1, but for 64Ni and 92Mo [32, 34].
For heavier targets, the angular distributions are also calculated from the global OMP. Figure 10 provides comparisons of the calculations with the corresponding experimental data for 208Pb [26, 30, 37, 38] at incident energies from 54.5 to 420 MeV. Across this energy range, the global OMP gives a good approximation to these data. Similarly, for 209Bi, the agreement between the calculations and the experimental data [38, 39] is very good from 58.9 to 118.0 MeV. This result is displayed in Fig. 11.
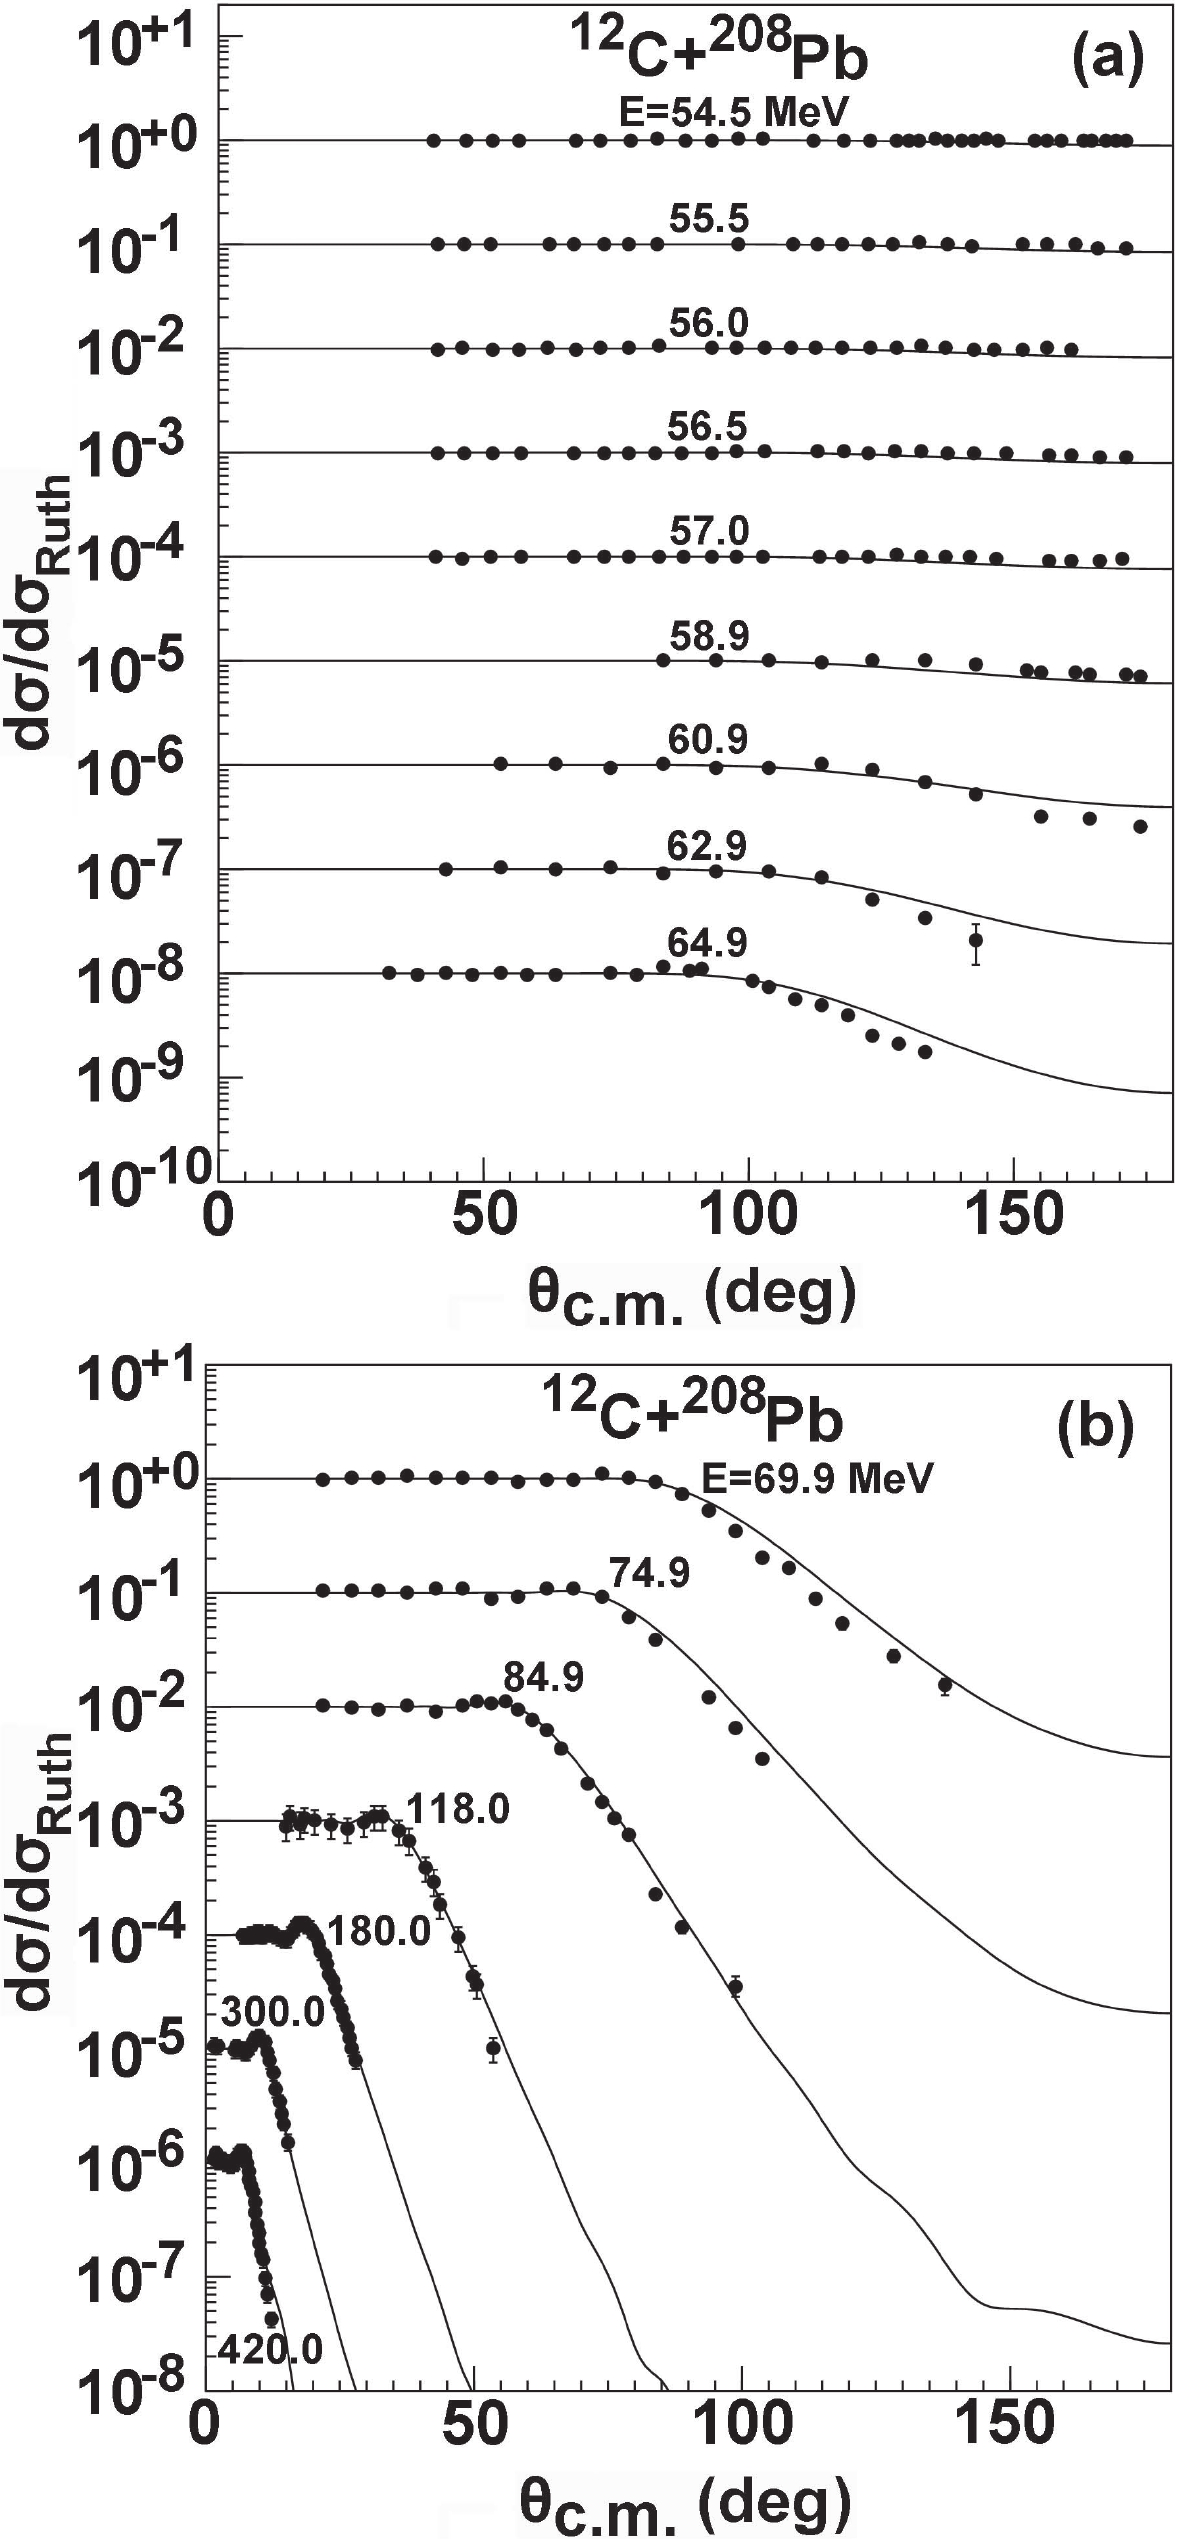 Figure10. Same as Fig. 1, but for 208Pb [26, 30, 37, 38].
 Figure11. Same as Fig. 1, but for 209Bi [38, 39].
The angular distributions of the elastic scattering for different targets are also measured at the same incident energy. The full curves in Fig. 12 illustrate the comparison between the global OMP calculations and the data [33, 35] at an incident energy of 66.0 MeV for the isotopic chains of
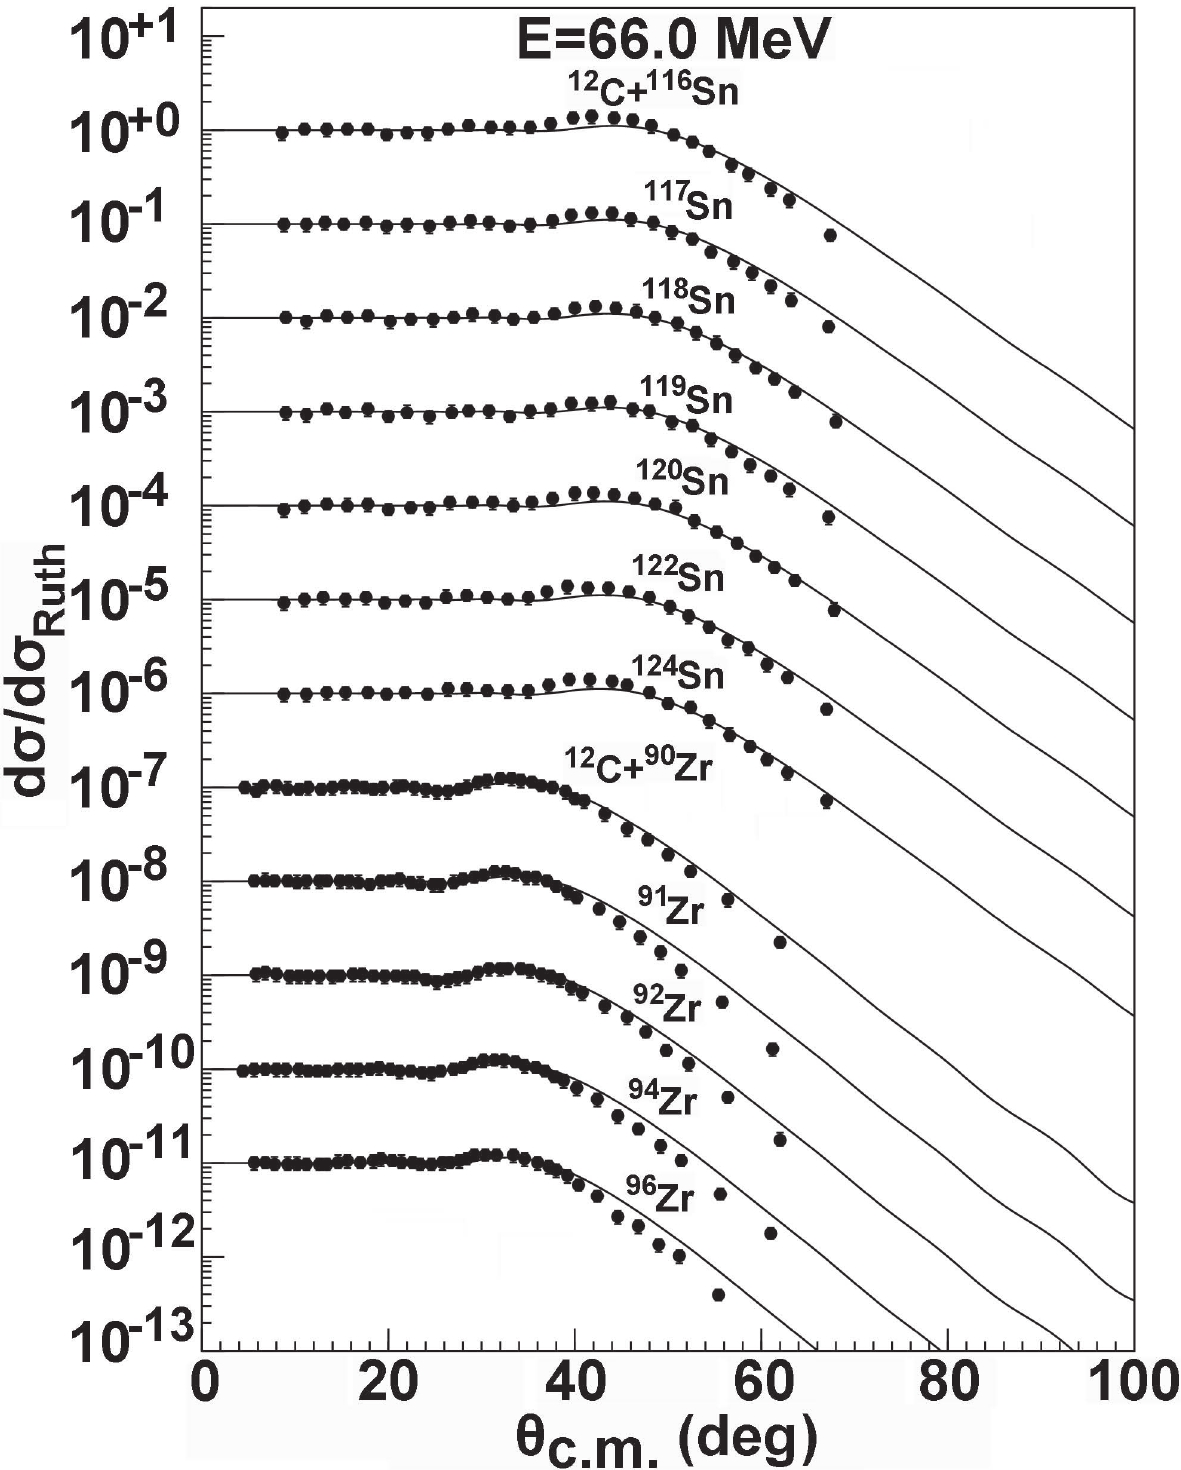 Figure12. Calculated elastic-scattering angular distributions compared with the experimental data [33, 35] at incident 12C energies of 66.0 MeV.
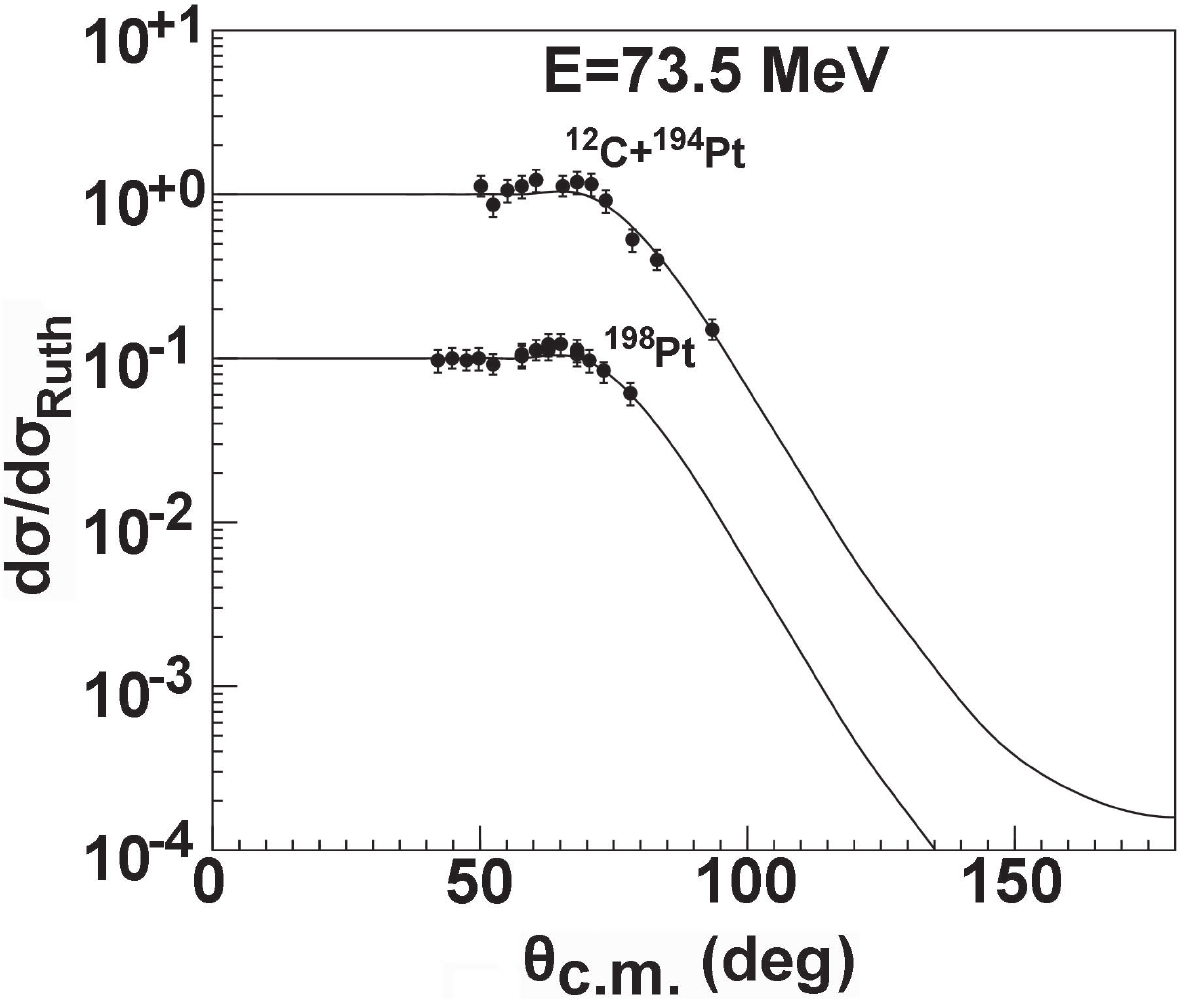 Figure13. Same as Fig. 12, but for 73.5 MeV [36].
The elastic scattering of 12C ions by
 Figure14. Calculated elastic-scattering angular distributions at the same incident angle compared with the experimental data [38] for different targets.
For the 12C + 197Au system, the quasi-elastic scattering angular distributions are also measured in the energy range from 56 to 82 MeV [46]. A comparison between the predictions and the existing experimental data is presented in Fig. 15. It is found that the calculations agree well with the experimental values except for those at 82 MeV. Moreover, the experimental data of quasi-elastic scattering angular distributions include elastic scattering and contributions from inelastic scattering and neutron transfer.
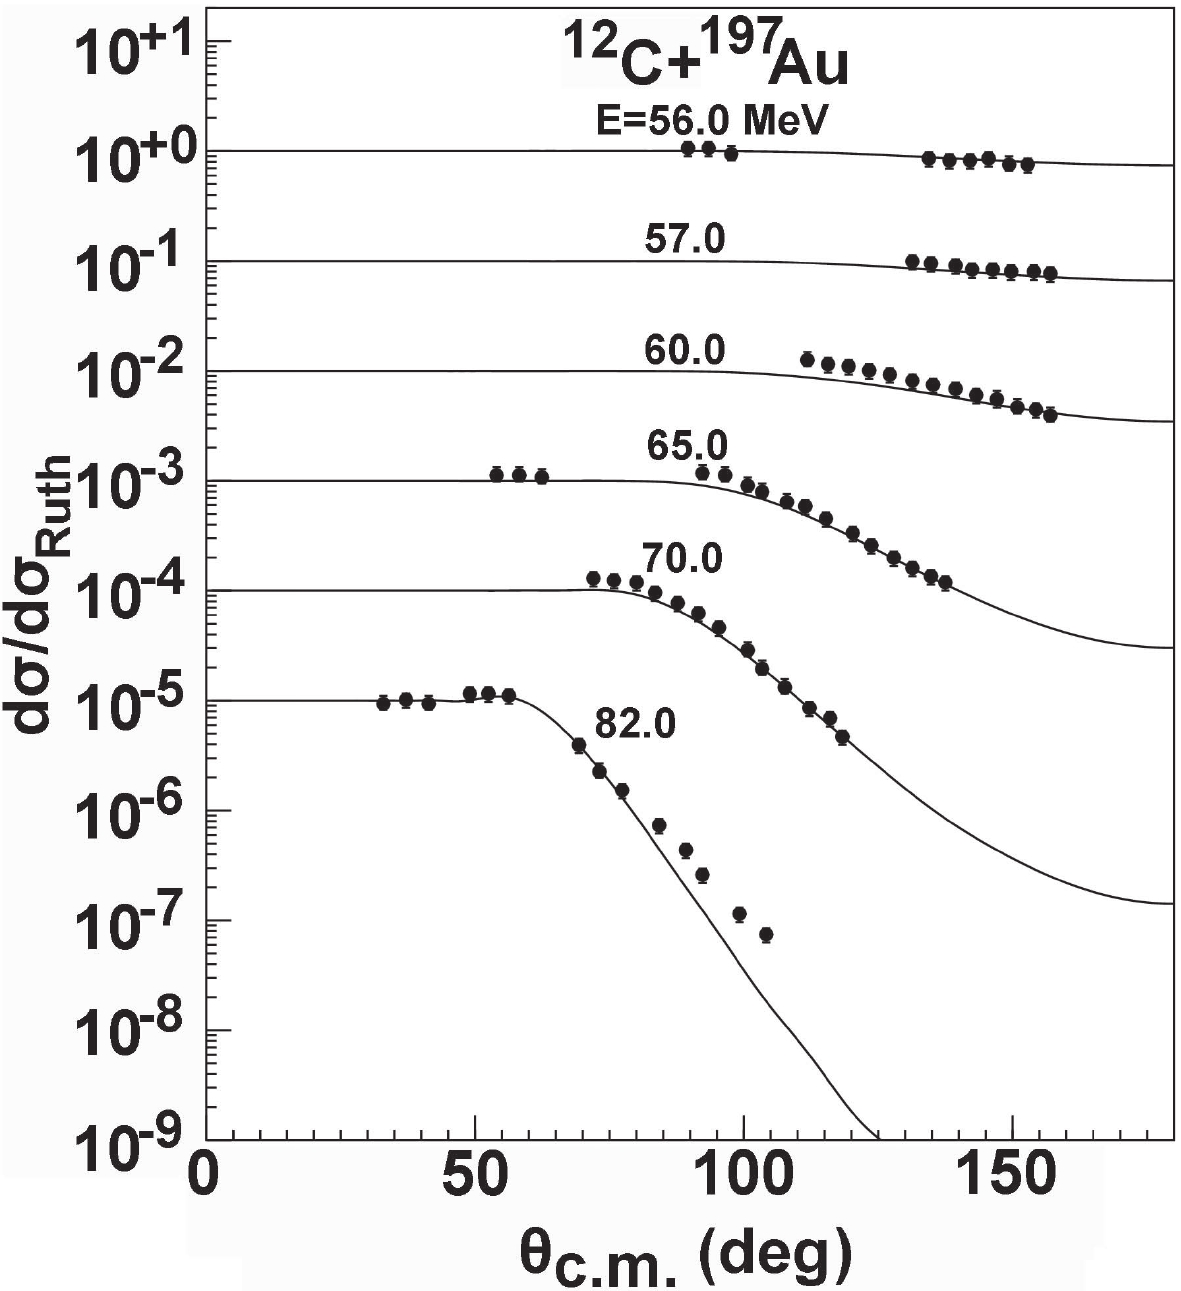 Figure15. Comparison between the predictions of the optical model and the experimental data for the quasi-elastic scattering angular distributions of 197Au [46].
The angular distributions for actinides are also predicted and compared with the corresponding experimental data. The results for 236U are shown in Fig. 16. As can be seen from the figure, a good theoretical fit to the experimental data [47] is obtained.
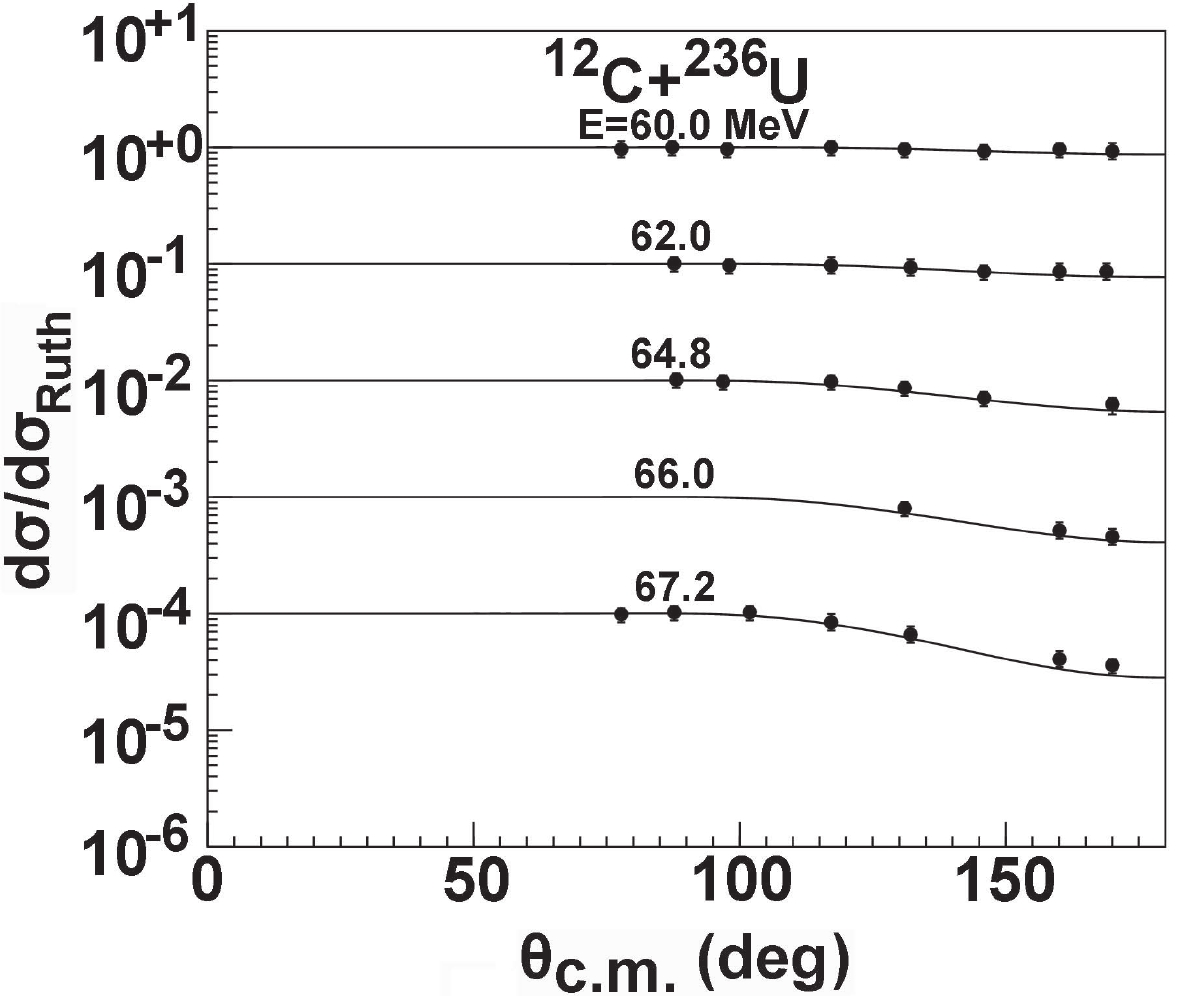 Figure16. Comparison between the predictions of the optical model and the experimental data for the elastic scattering angular distributions of 236U [47].
2
3.2.Reaction cross sections
The total reaction cross section is also an important observable in the optical model and is further investigated using the global OMP. The total reaction cross sections for 27Al and 28Si are predicted and compared with the existing experimental data; the predicted results are consistent with almost all of the data [48-52]. The total reaction cross sections for 40Ca and 56Fe are also calculated using the global OMP. Compared with the corresponding experimental data [26, 48], the calculations fit the data well in the error range for these targets. The results for 28Si and 40Ca are shown in Fig. 17.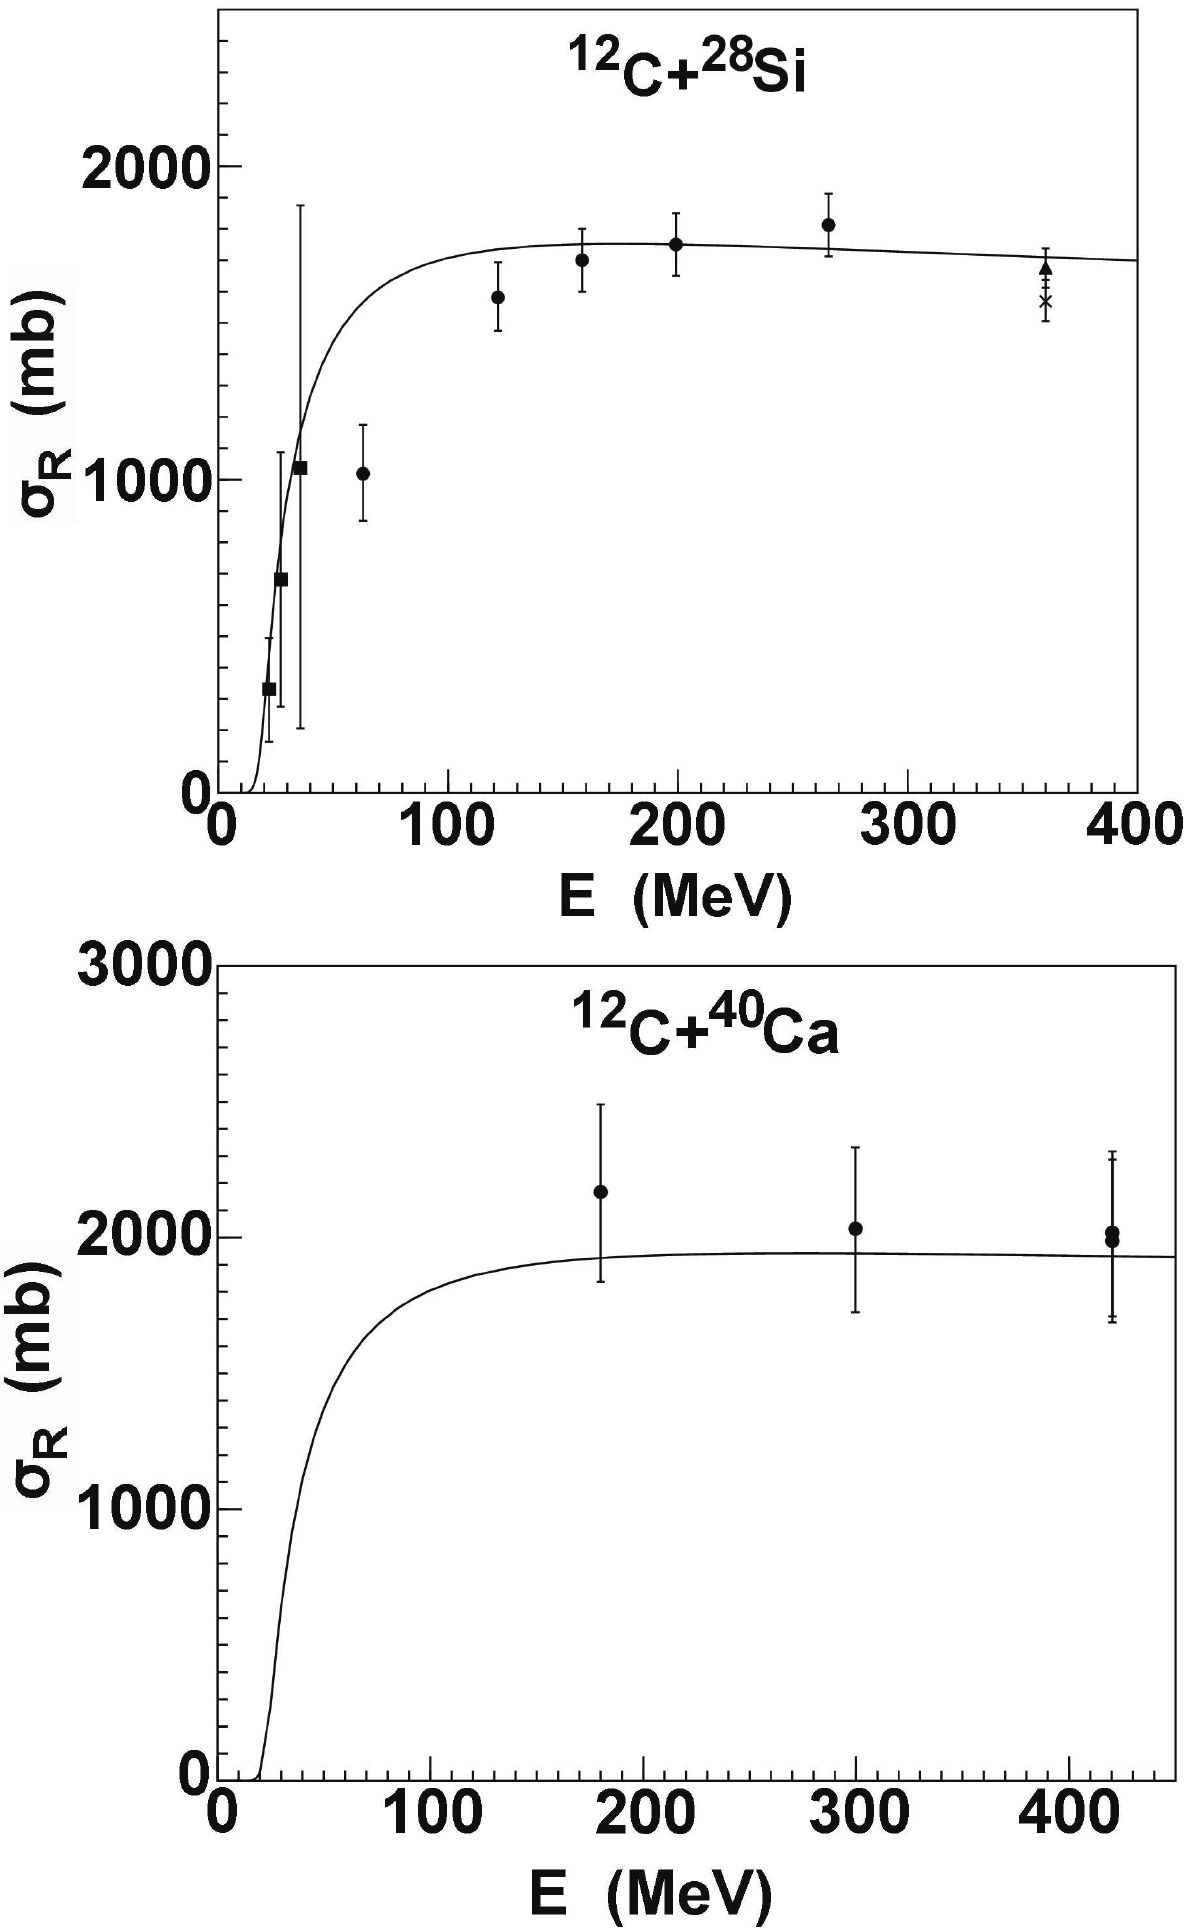 Figure17. Comparison between the optical model calculations and the experimental data [26, 49-52] of 12C reaction cross sections for 28Si and 40Ca.
For copper targets, the total reaction cross sections are measured for
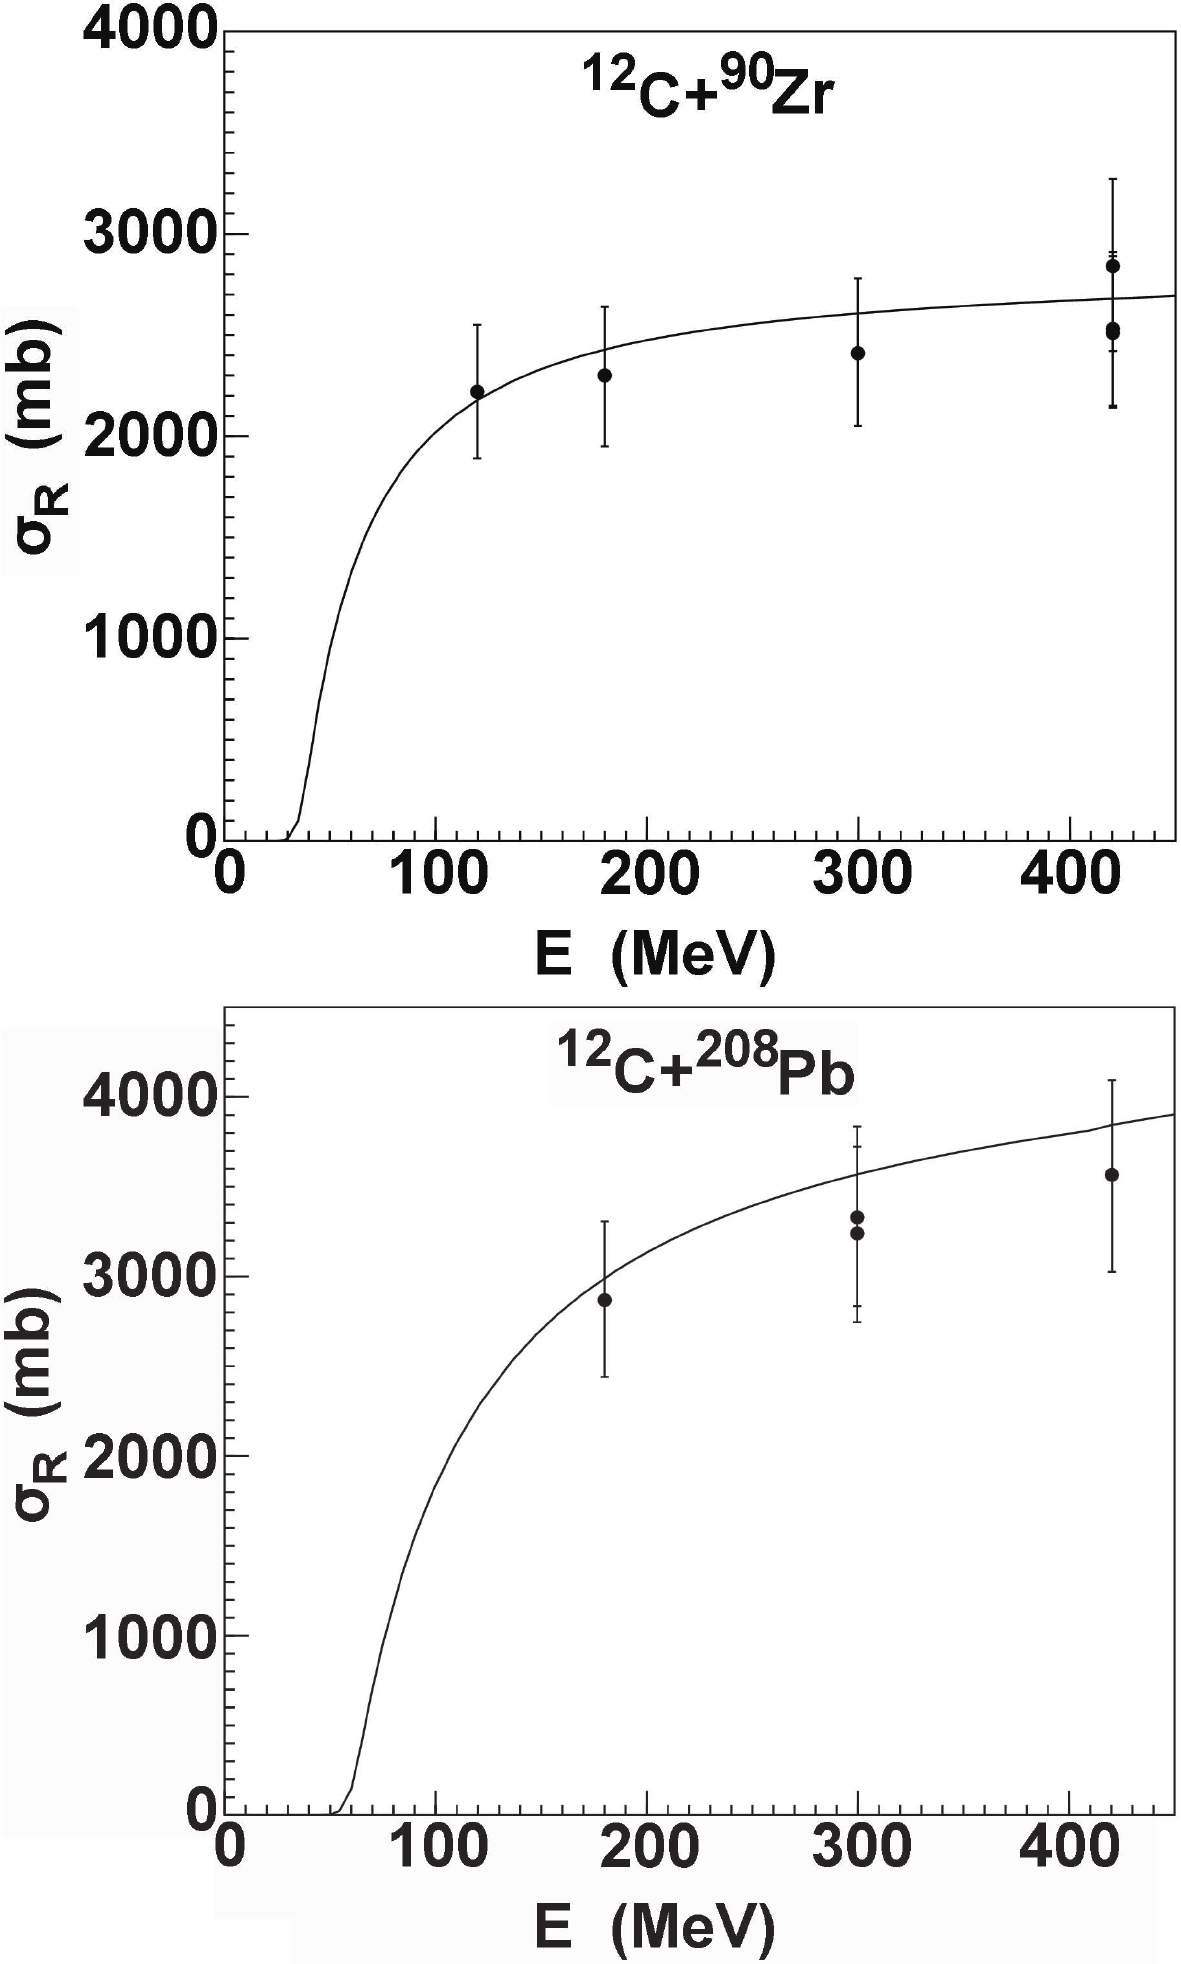 Figure18. Same as Fig. 17, but for 90Zr and 208Pb [26].
To further investigate the structure of 12C, we compare the total reaction cross sections calculated for different systems. Among these systems are combinations of stable and unstable weakly bound nuclei 9Be [9] and 6Li [10], halo nuclei 6,8He [54], and
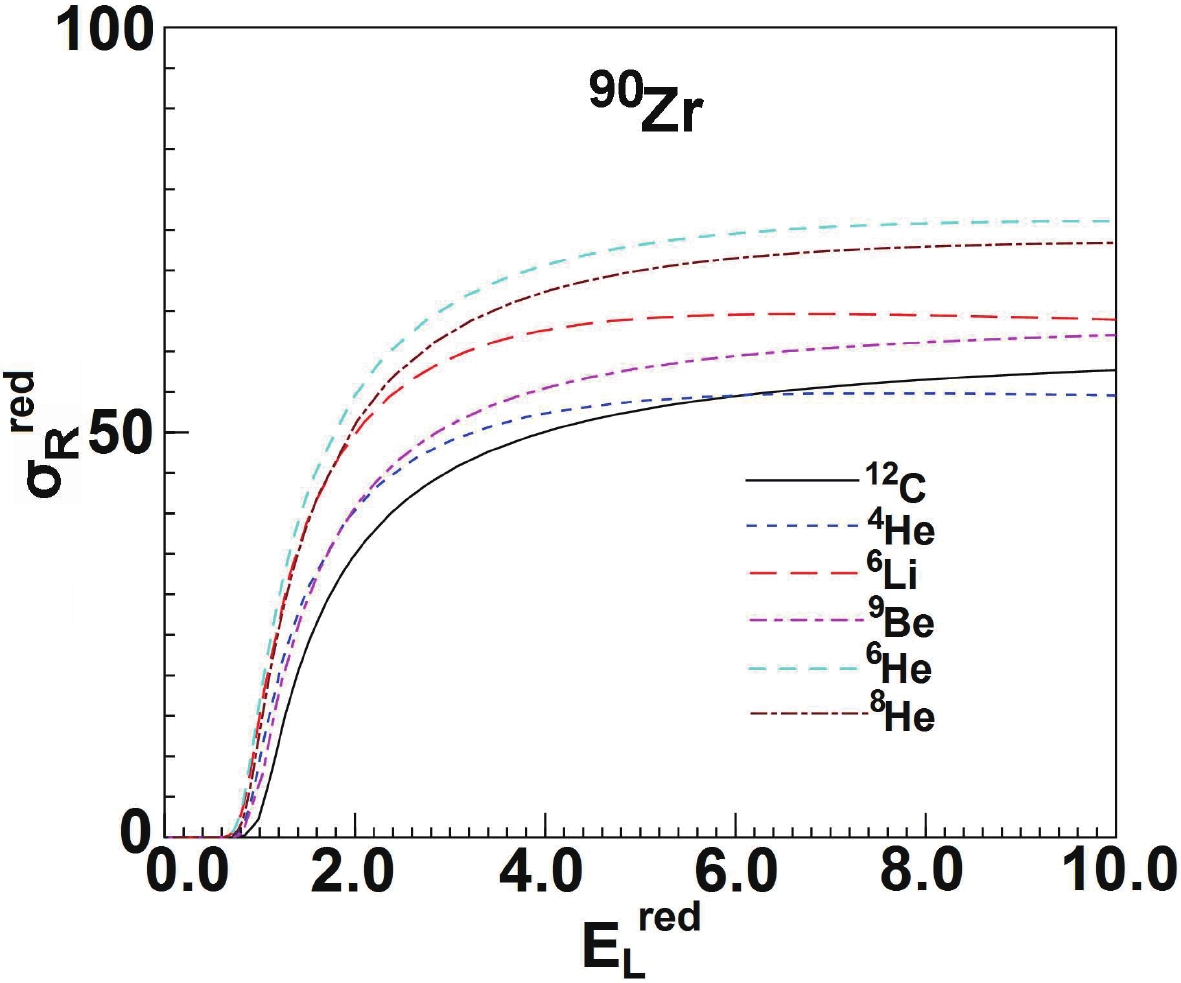 Figure19. (color online) Comparison of the total reaction cross sections for different projectiles on the medium mass target 90Zr.