


HTML
--> --> -->Disintegration of an unstable heavy/superheavy nucleus into three fission fragments, by ignoring neutrons and other types of radiation, is termed a cold ternary fission [6–12]. Ternary fission is an appropriate tool to study the behavior of a nuclear system at the scission point of a fissioning nucleus.
True ternary fission, in which the parent nucleus breaks up into three fragments with comparable (large) masses, occurs very rarely in some heavy/superheavy nuclei with high fissility parameters [13,14]. This type of ternary fission has been studied extensively in refs. [15–25], but all of its theoretical characteristics are still not well understood.
By using the double-folding nuclear potential, a coplanar three-cluster approach was introduced into the study of the cold ternary fission of 252Cf accompanied by an
According to Sǎndulescu et al. [37, 38], cold ternary fission can be considered like a process of cluster radioactivity; i.e., a large number of nucleons are re-arranged in a cold process from the ground state of the parent to the ground state of the three final products.
Without considering the cluster preformation factors, Sǎndulescu et al. [39–42] have calculated the isotopic yields in the cold ternary fission of 248Cm, using the double-folding potential plus M3Y nucleon-nucleon forces. Later, Florescu et al. [43] developed this model by including the preformation probability of 4He and 10Be that accompany the ternary fission of 252Cf.
In the framework of the cluster picture, and as an extension of the preformed cluster model (PCM) [44], the 'Three-Cluster Model' (TCM) was introduced for studying the ternary fission process [45]. This model has been used extensively to investigate the different theoretical aspects of ternary fission for various isotopes of Cf, U, Pu and Cm [46–51].
Despite the macroscopic approach of the three-cluster model, its predictions and the obtained results are in good agreement with the available experimental data and other models [52–60].
In our first publication [61], we studied the cold ternary fission of 250Cm by using the three-cluster model in the equatorial geometry and considering the light charged particle as the fixed third fragment. In our second paper [62], a relatively heavy nucleus (34Mg) is considered as the third fixed fragment, and is compared to the results with the light fragments in ternary fission of 242Pu. The obtained results revealed that ternary fission of 242Pu accompanied by 34Mg occurs with very low probability in the equatorial configuration. In our recent investigation [63], the equatorial and collinear configurations in the ternary fission of 242Pu accompanied by a relatively heavy (A= 14) fragment were compared. We also compared there the results which were obtained using the proximity and Yukawa plus exponential potentials as the nuclear part of the total potential.
In the present study, we focus on the true ternary fission of 242Pu in a defined region of mass and charge of the three fragments. The new aspect of this study is the variation of both the charge and mass numbers for all three fragments, which means that the area of investigation is expanded considering all possible combinations in the considered region of true ternary fission. Both equatorial and collinear geometries are considered, and the kinetic energies of the fragments for the most favorable fragmentations are calculated.
In Section 2, the theoretical framework of TCM is presented. The obtained results are presented and discussed in Section 3. Finally, a summary of the present study along with the concluding remarks is provided in Section 4.
$ V = \sum\limits_{i = 1}^{3}\sum\limits_{j>i}^{3}{(m^i_x+V_{Cij}+V_{Nij})}. $  | (1) |
$ V_{Cij} = \frac{Z_i Z_j e^2}{C_{ij}}, $  | (2) |
$ {C_{ij} = C_i+C_j+s_{ij}}. $  | (3) |
$ {C_x} = {R_x}\left[1-\left(\frac{b}{R_x}\right)^2\right], $  | (4) |
$ R_x = 1.28A_x^{1/3}-0.76+0.8 A_x^{-1/3} $  | (5) |
In the present study, the latest version of the proximity nuclear potential (Prox2010) [66] is used. According to this version of the proximity potential,
$ V_{Nij}(s) = V_{Pij}(s) = 4 \pi b \gamma \overline{C} \Phi\left(\frac{s}{b}\right). $  | (6) |
$ \gamma = 1.25284[1-2.345(N-Z)^2/A^2] \quad {\rm MeV/fm}^2, $  | (7) |
$ \overline{C} = \frac{C_i C_j}{C_i+C_j}. $  | (8) |
$ \Phi(\xi) = \Bigg\{ \begin{array}{lc} -1.7817+0.9270 \xi+0.0169 \xi^2-0.05148 \xi^3 & {\rm{for}} \quad 0\leqslant\xi\leqslant 1.9475 \\ -4.41 \exp(-\xi/0.7176) & {\rm{for}} \quad \xi>1.9475. \end{array} $  | (9) |
On the other hand, in the collinear configuration with
$ s_{12} = 2(C_3+s), $  | (10) |
$ Q = M-\sum\limits_{i = 1}^{3}{m_i}, $  | (11) |
The relative yield of a fragmentation channel is calculated using
$ Y(A_i,Z_i) = \frac{P(A_i,Z_i)}{\sum{P(A_i,Z_i)}}, $  | (12) |
$ P = \exp\left\{-\frac{2}{\hbar}\int^{s_2}_{s_1}{\sqrt{2\mu(V-Q)}{\rm d}s}\right\}. $  | (13) |
The reduced mass of the three fission products is defined as
$ \mu = m \left(\frac{A_1 A_2 A_3}{A_1 A_2+A_1 A_3+A_2 A_3}\right), $  | (14) |
A scheme of the ternary fragments in equatorial and collinear geometries is shown in Fig. 1. The touching configuration in this figure (s = 0), is related to the first turning point in the integral of Eq. (13).
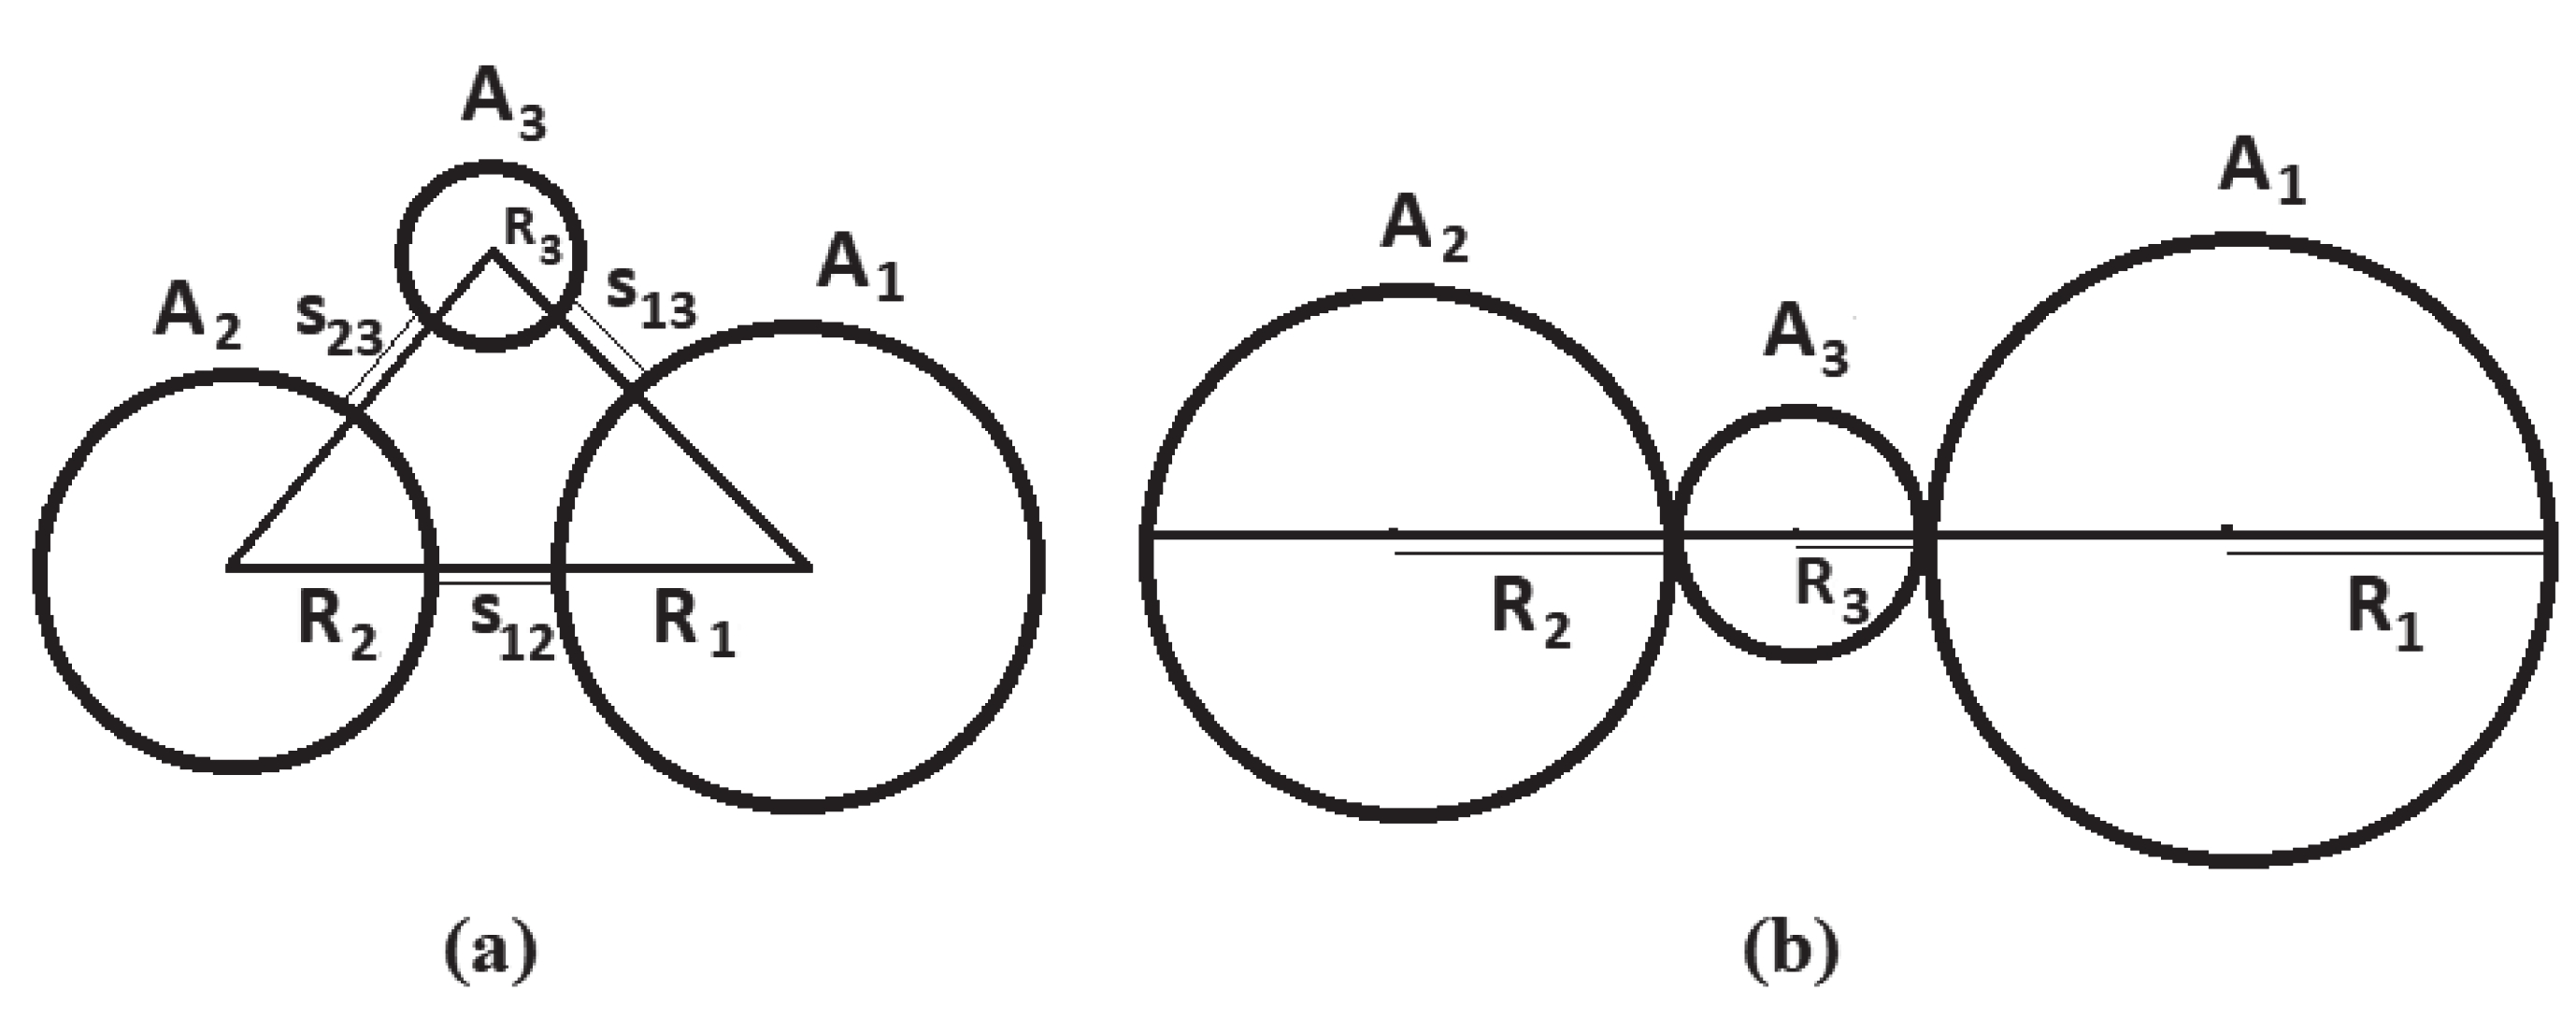 Figure1. A scheme of the ternary fission fragments (a) equatorial configuration for separated fragments (
In the second step, for each group, all possible combinations with different mass numbers are listed. In each of the 14 groups, about 300 subgroups were identified. Subsequently, the interaction potentials, Q-values, penetration probabilities and relative yields were calculated for each individual fragmentation in the collinear (with the lightest fragment in the middle of the arrangement) and equatorial geometries. Note that interaction potentials are calculated in the touching-fragment configuration.
Due to the huge amount of data, presentation of all calculated results is virtually impossible. Therefore, to be able to compare the results, the minimum of potential was chosen in each category.
The Q-values and minimum interaction potentials in the collinear and equatorial geometries are presented in Table 1. As is evident from this table, in this region of mass and charge numbers, the potential barriers of collinear configurations are lower than the equatorial ones. This result has been verified with the results presented in Refs. [13, 47, 48]. Also, in most combination groups, there is at least one fragment with a neutron and/or proton closed shell (bold numbers in Table 1).
| Z1 | Z2 | Z3 | Z1 | Z2 | Z3 | Z1 | Z2 | Z3 | Q/MeV | Vtot - collinear/MeV | Vtot - equatorial/MeV |
| 32 | 31 | 31 | 82 | 79 | 81 | 50 | 48 | 50 | 240.3094 | 78.1659 | 100.605 |
| 32 | 32 | 30 | 82 | 82 | 78 | 50 | 50 | 48 | 243.032 | 74.4898 | 97.7208 |
| 33 | 31 | 30 | 83 | 81 | 78 | 50 | 50 | 48 | 239.4991 | 77.9527 | 101.1142 |
| 33 | 32 | 29 | 83 | 82 | 77 | 50 | 50 | 48 | 238.313 | 77.4297 | 101.9928 |
| 33 | 33 | 28 | 83 | 83 | 76 | 50 | 50 | 48 | 235.6672 | 78.0857 | 103.7011 |
| 34 | 30 | 30 | 84 | 78 | 80 | 50 | 48 | 50 | 239.7981 | 76.8431 | 99.9926 |
| 34 | 31 | 29 | 84 | 81 | 77 | 50 | 50 | 48 | 236.8043 | 78.8 | 102.739 |
| 34 | 32 | 28 | 86 | 82 | 74 | 52 | 50 | 46 | 239.0969 | 75.2326 | 100.4867 |
| 35 | 30 | 29 | 87 | 78 | 77 | 52 | 48 | 48 | 234.6038 | 80.6331 | 104.5678 |
| 35 | 31 | 28 | 87 | 81 | 74 | 52 | 50 | 46 | 234.6986 | 79.3986 | 104.4263 |
| 36 | 29 | 29 | 90 | 75 | 77 | 54 | 46 | 48 | 232.6591 | 82.0497 | 105.9731 |
| 36 | 30 | 28 | 90 | 78 | 74 | 54 | 48 | 46 | 235.621 | 78.0305 | 102.8422 |
| 37 | 29 | 28 | 93 | 75 | 74 | 56 | 46 | 46 | 230.2699 | 82.7749 | 107.2704 |
| 38 | 28 | 28 | 94 | 74 | 74 | 56 | 46 | 46 | 230.4843 | 81.81 | 105.7355 |
Table1.Q-values and minimum interaction potentials for 14 groups of
In the group
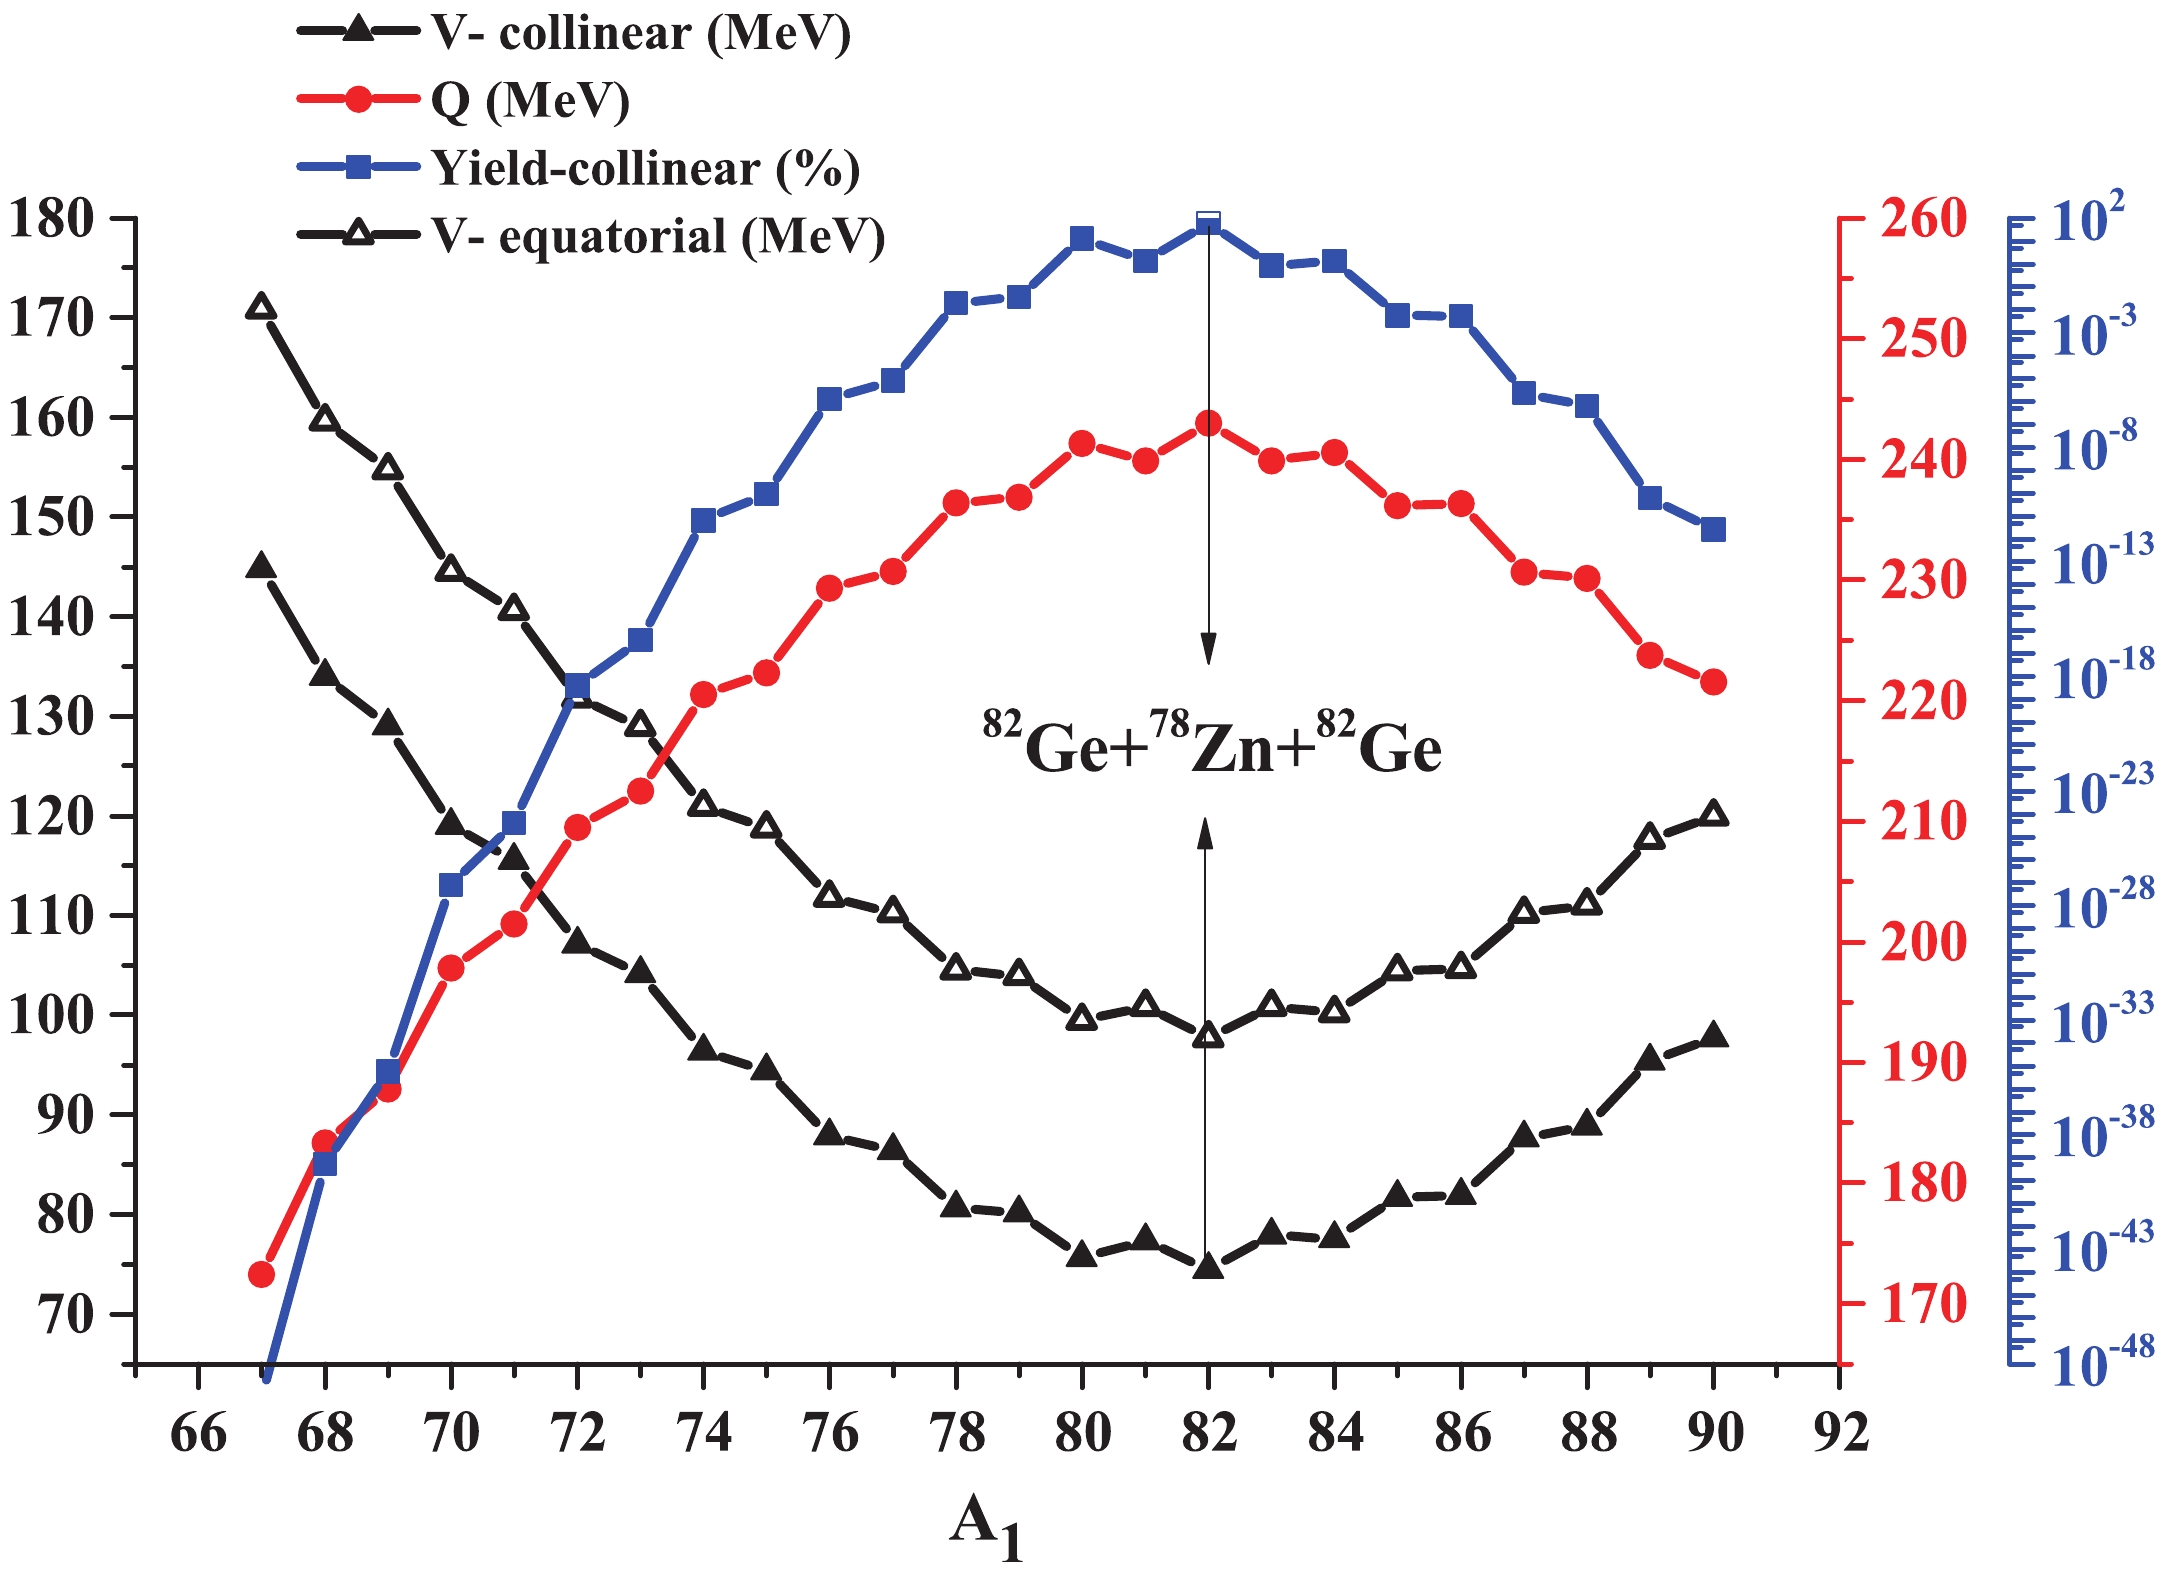 Figure2. (color online) Interaction potentials in the collinear and equatorial configurations (left vertical axis), Q-values (right vertical axis), and relative yields in the collinear geometry (logarithmic axis) for the combinations with
 From Fig. 2, it is obvious that an increase of the Q-value and relative yield is equivalent to a decrease of the interaction potential, and vice versa. However, this equivalence is not always valid. In Fig. 2, the Z values are constant in all considered combinations. If both Z and A vary among different combinations, one may see that there is no specific relation between the Q-values and relative yields or interaction potentials (see subsection 3.1).
In Fig. 2, the minimum of the interaction potential and the maximum of the yields and Q-values occurs for the combination
 Figure3. (color online) Contour map of the Q-values for all possible combinations of the breakup
  Figure4. (color online) Contour map of the interaction potentials (collinear geometry) for all possible combinations of the breakup
 From an analysis of Table 1 one can conclude that: (1) even-mass fragments have lower potential barriers than the odd-mass ones (in agreement with [46, 47, 67, 68]); (2) neutron closed shell structures are more important than the proton closed shells for lowering the potential barrier (compatible with [45, 69]); (3) the closed shell structure of the heaviest fragment plays a key role for the more favorable channels (in agreement with [69]); (4) fragments with smaller difference of mass numbers have lower potential barriers and higher Q-values compared to other fragmentations (upper and lower rows of Table 1).
2
3.1.Comparison between true and Tin-accompanied ternary fission of $ \bf ^{242}{\rm Pu} $![]()
![]()
In this part of the study, we consider a double magic nucleus (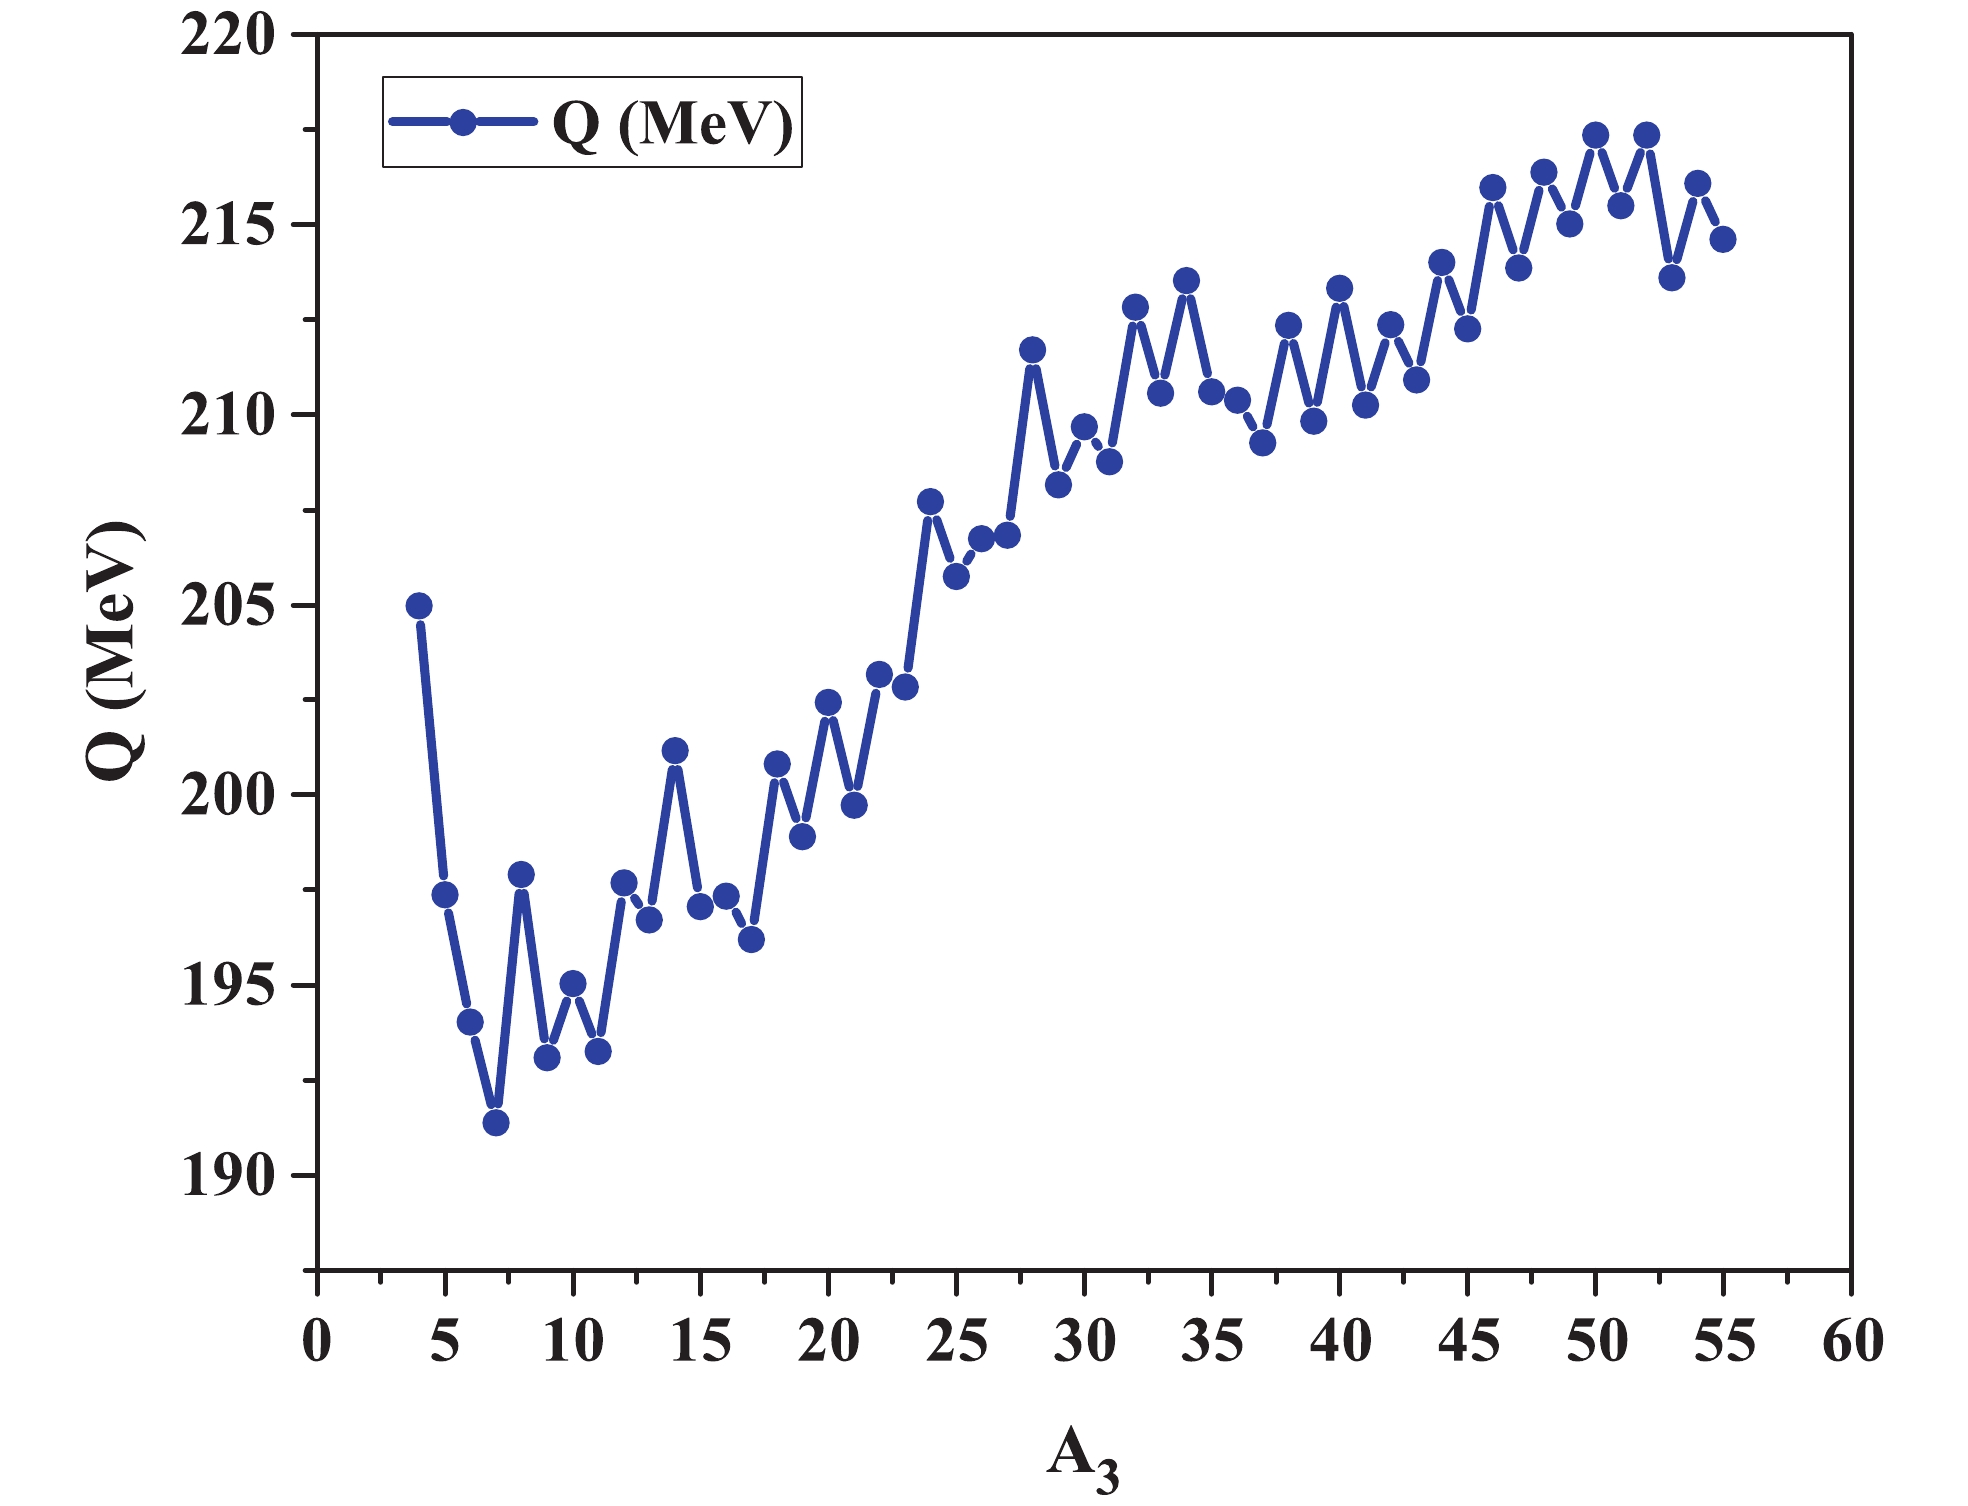 Figure5. (color online) Q-values for the breakup
 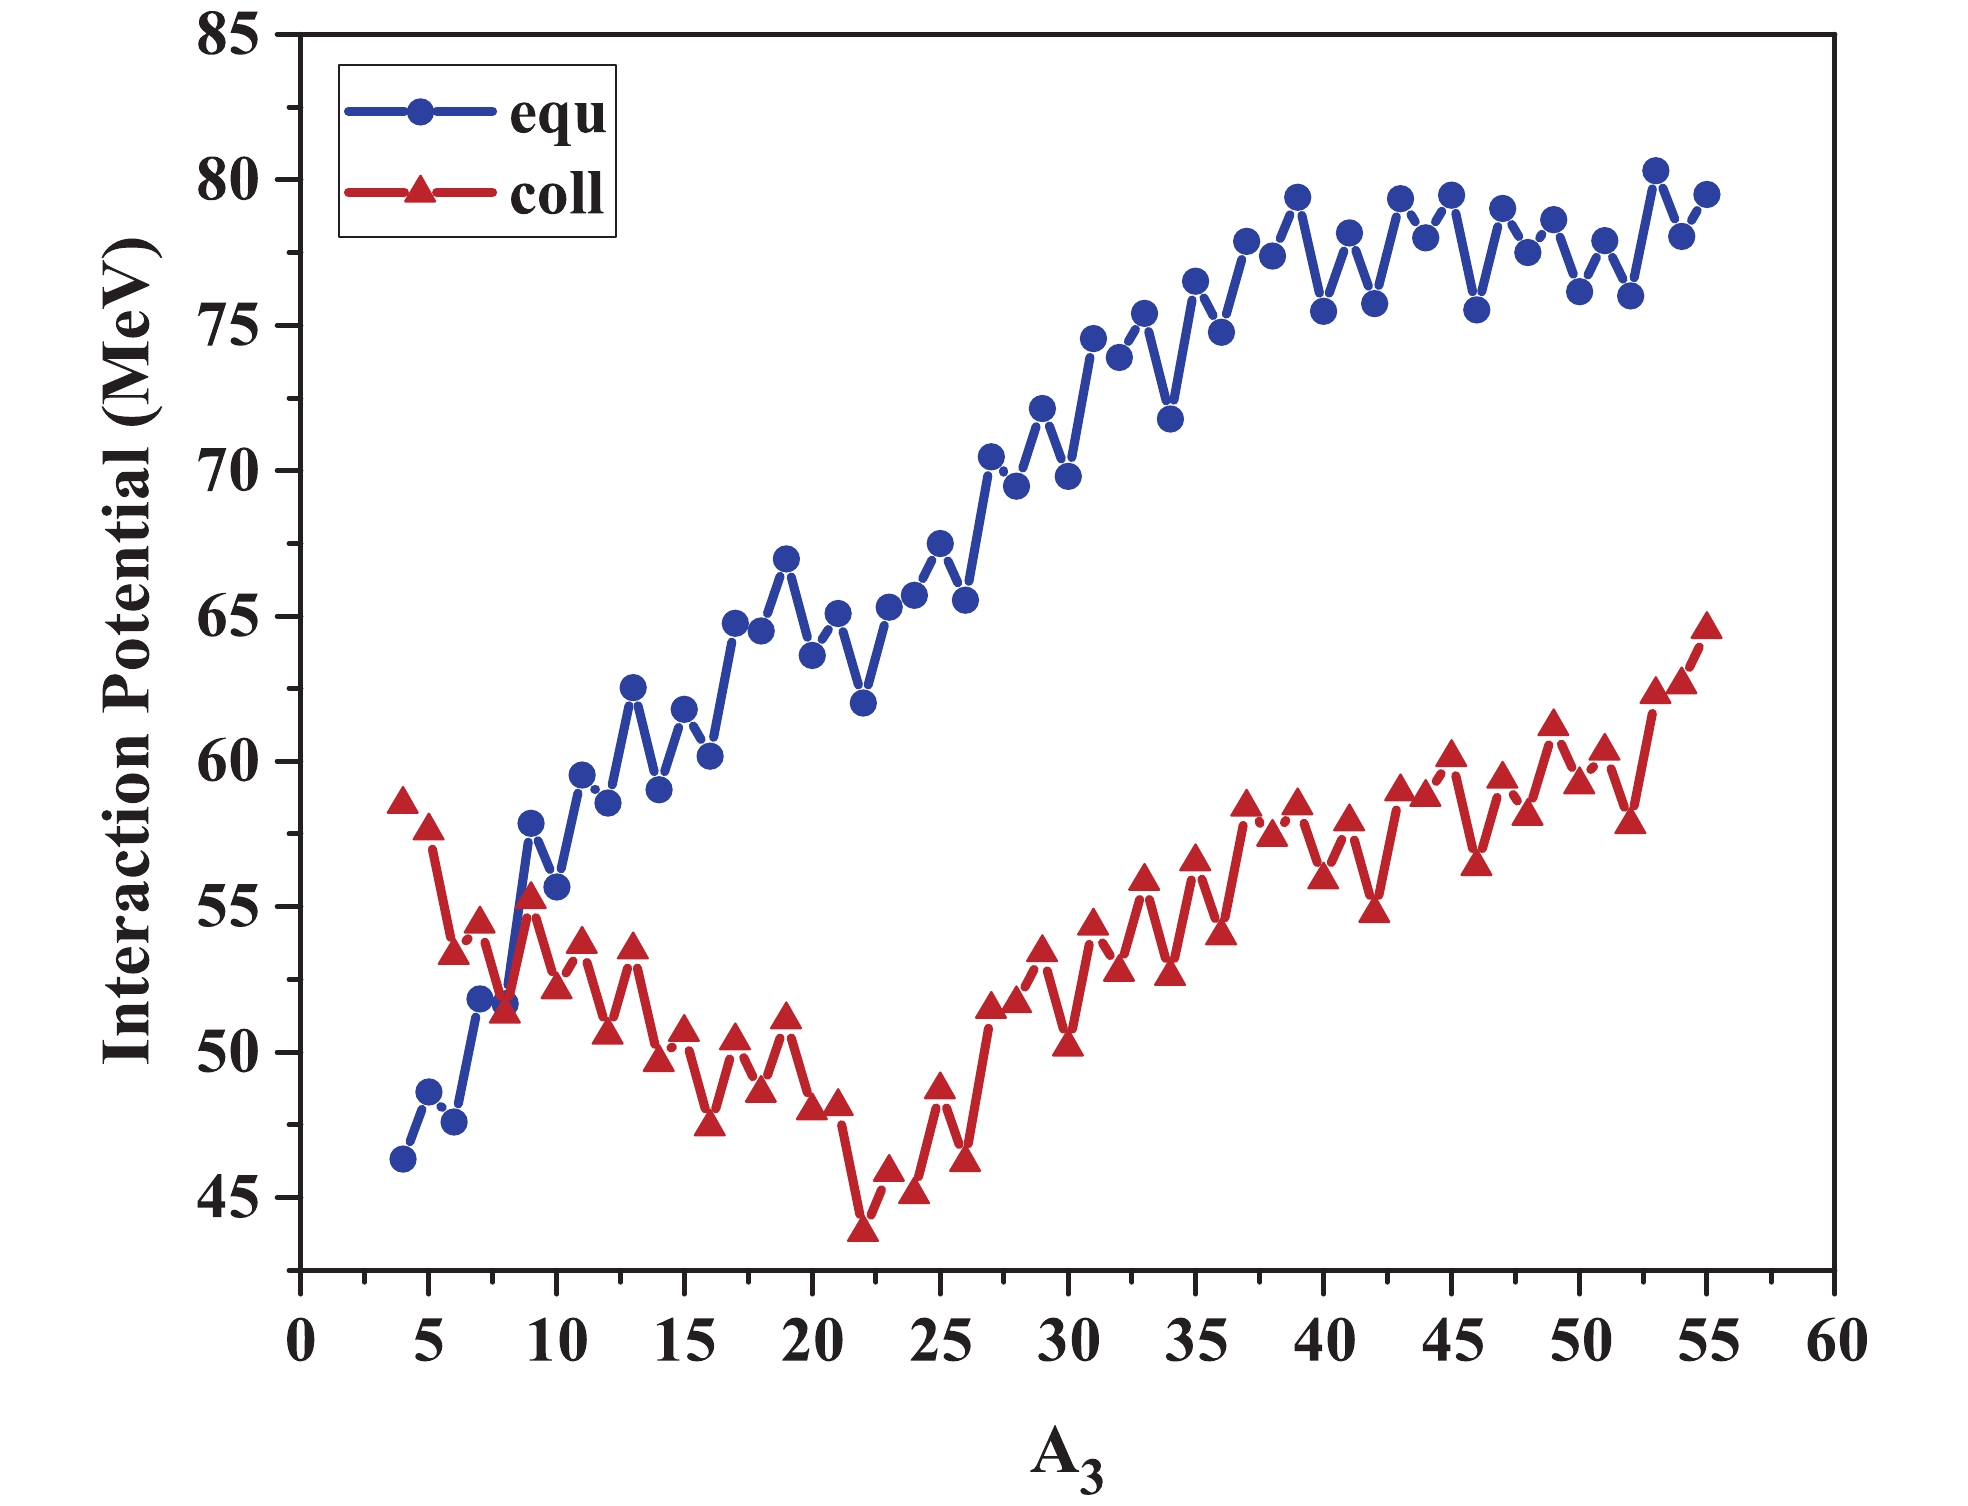 Figure6. (color online) Charge minimized interaction potentials for the breakup
 It can be seen in Fig. 6 that collinear geometry has a lower potential barrier than the equatorial geometry, except for very light third fragment. The lowest barrier in collinear geometry is obtained for the combination
Variation of the potential barrier (
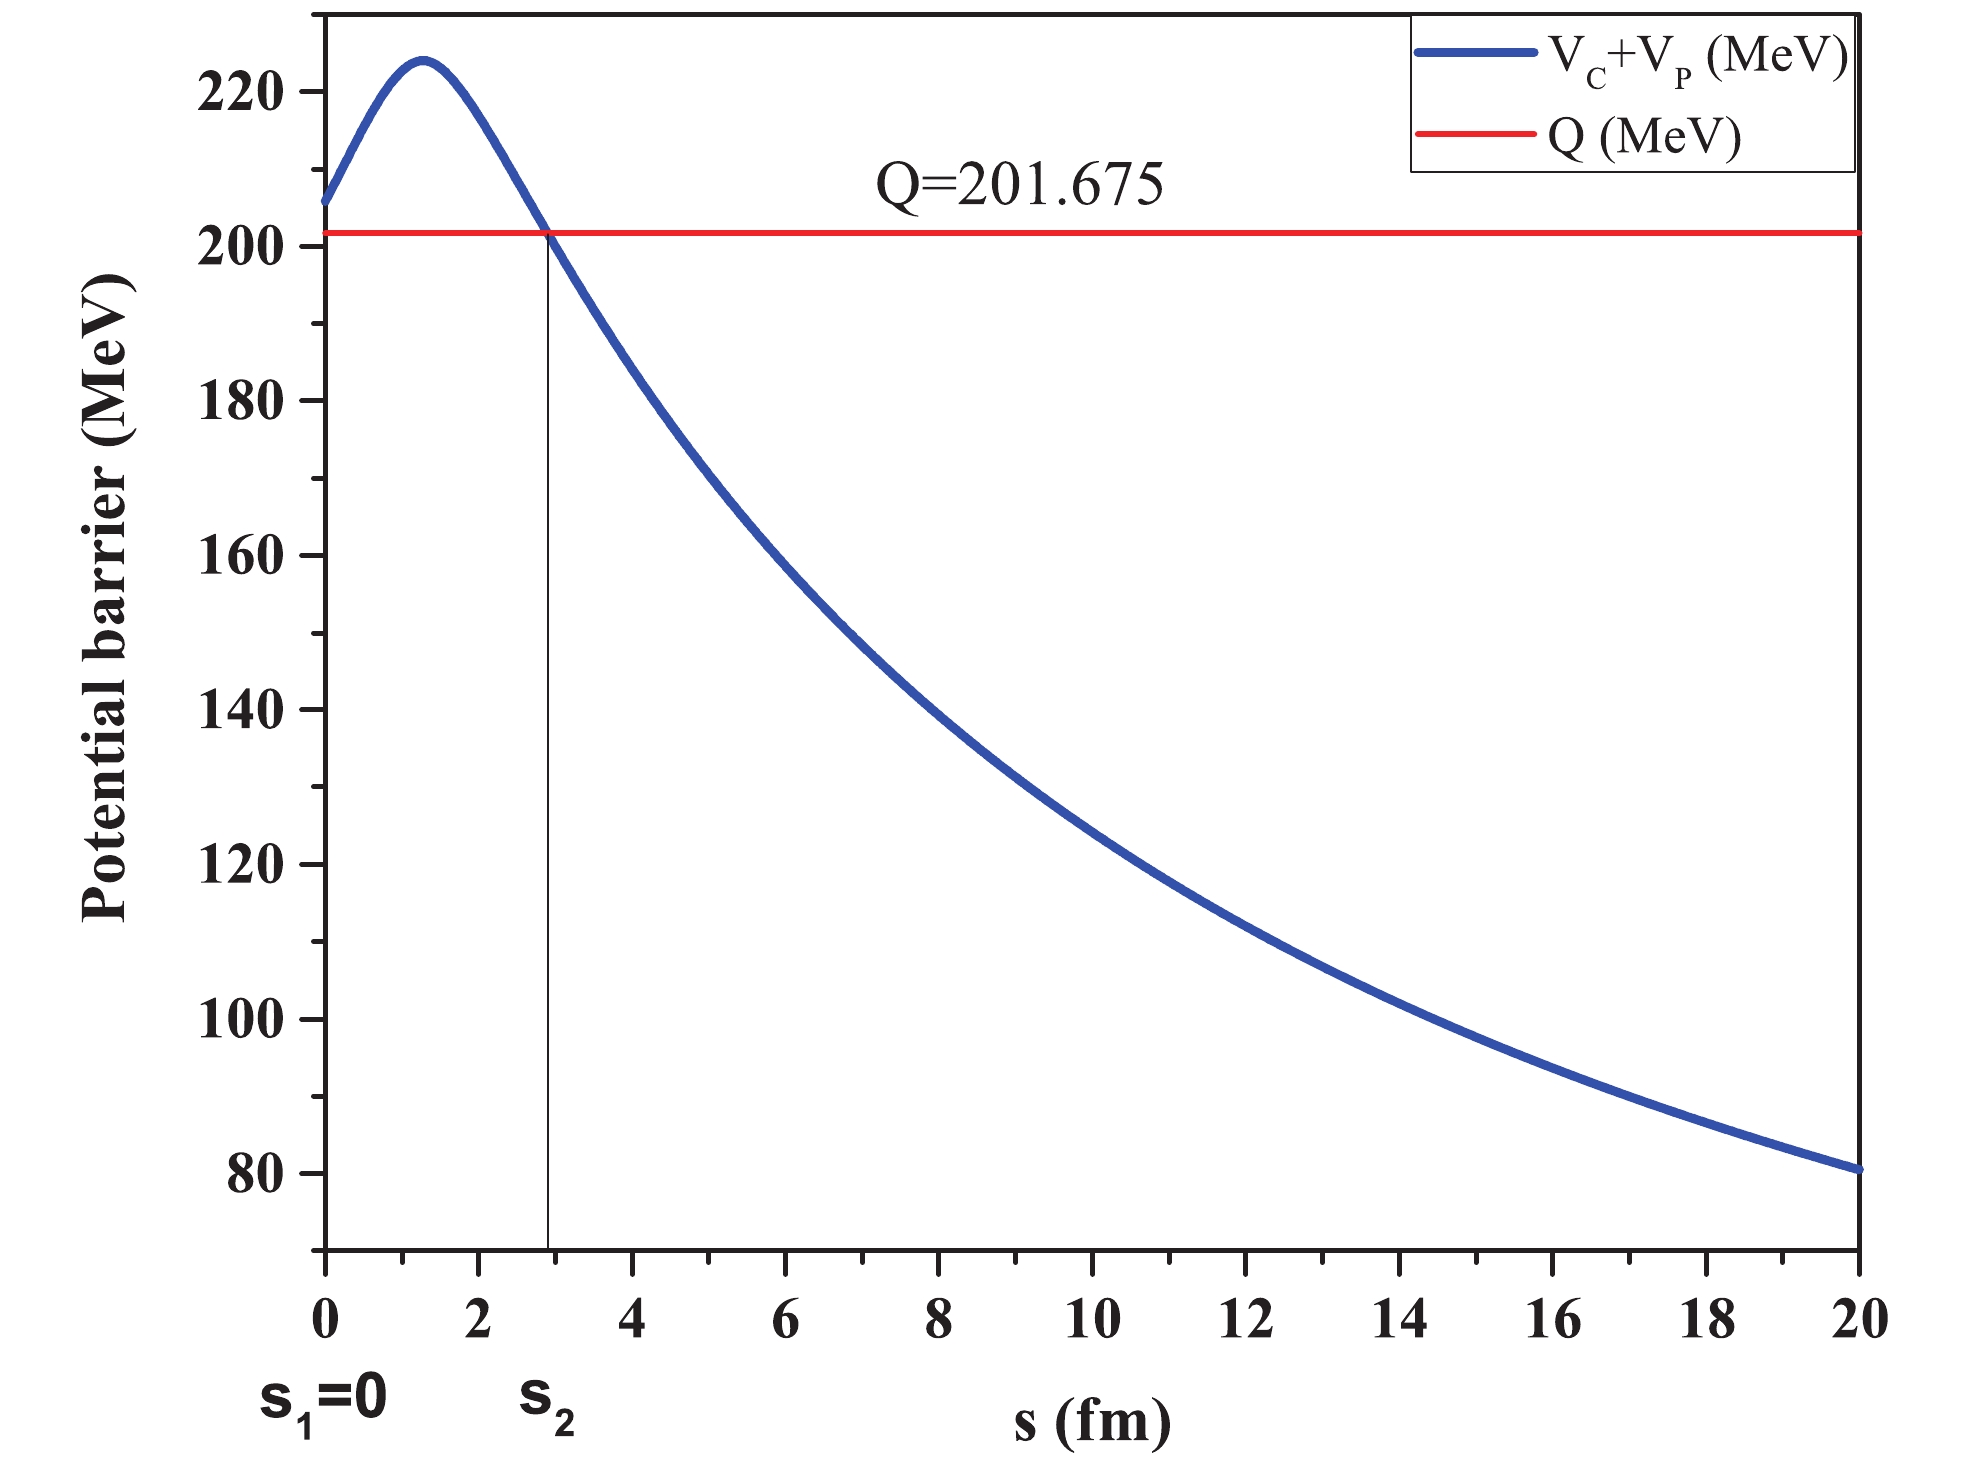 Figure7. (color online) Potential barrier
 In Fig. 8, the interaction potentials in the region of true ternary fission (
 Figure8. (color online) Comparison of the potential barriers for true ternary fission and Tin-accompanied ternary fission of
 In order to get a better visual comparison, seven groups with different
 Figure9. Comparison of the minimum interaction potentials for true and Tin-accompanied ternary fission of
 2
3.2.Kinetic energy of the fragments in the group $ Z_1=32 $![]()
![]()
, $ Z_2=32 $![]()
![]()
, and $ Z_3=30 $![]()
![]()
In order to calculate the kinetic energies of the fragments, we concentrate on the fragmentation $ Q_I = M_x(A)-[m_x(A_1)+m_x(A_{23})]. $  | (15) |
$ Q_{II} = m_x(A_{23})-[m_x(A_2)+m_x(A_3)]. $  | (16) |
In the first step, the velocity of the composite nucleus is obtained using
$ v_{23} = +\sqrt{\left(\frac{2m_1}{m_1+m_{23}}\right)\left(\frac{Q_I}{m_{23}}\right)}, $  | (17) |
$ v_1 = -\sqrt{\left(\frac{2m_{23}}{m_1+m_{23}}\right)\left(\frac{Q_I}{m_1}\right)}. $  | (18) |
For the velocities of fragments 2 and 3 in the second step, we have
$ v_2 = \frac{m_2 m_{23} v_{23}\pm\sqrt{\zeta^2}}{m_2^2+m_2 m_3}, $  | (19) |
$ \begin{split} \zeta^2 =& m_2^2 m_{23}^2 v_{23}^2-[(m_2^2+m_2 m_3)\\&\times(m_{23}^2 v_{23}^2- 2 m_3 Q_{II}- m_3 m_{23} v_{23}^2)]. \end{split}$  | (20) |
$ v_3 = -\left[\frac{m_2 v_2- m_{23} v_{23}}{m_3}\right]. $  | (21) |
The kinetic energies of the fragments
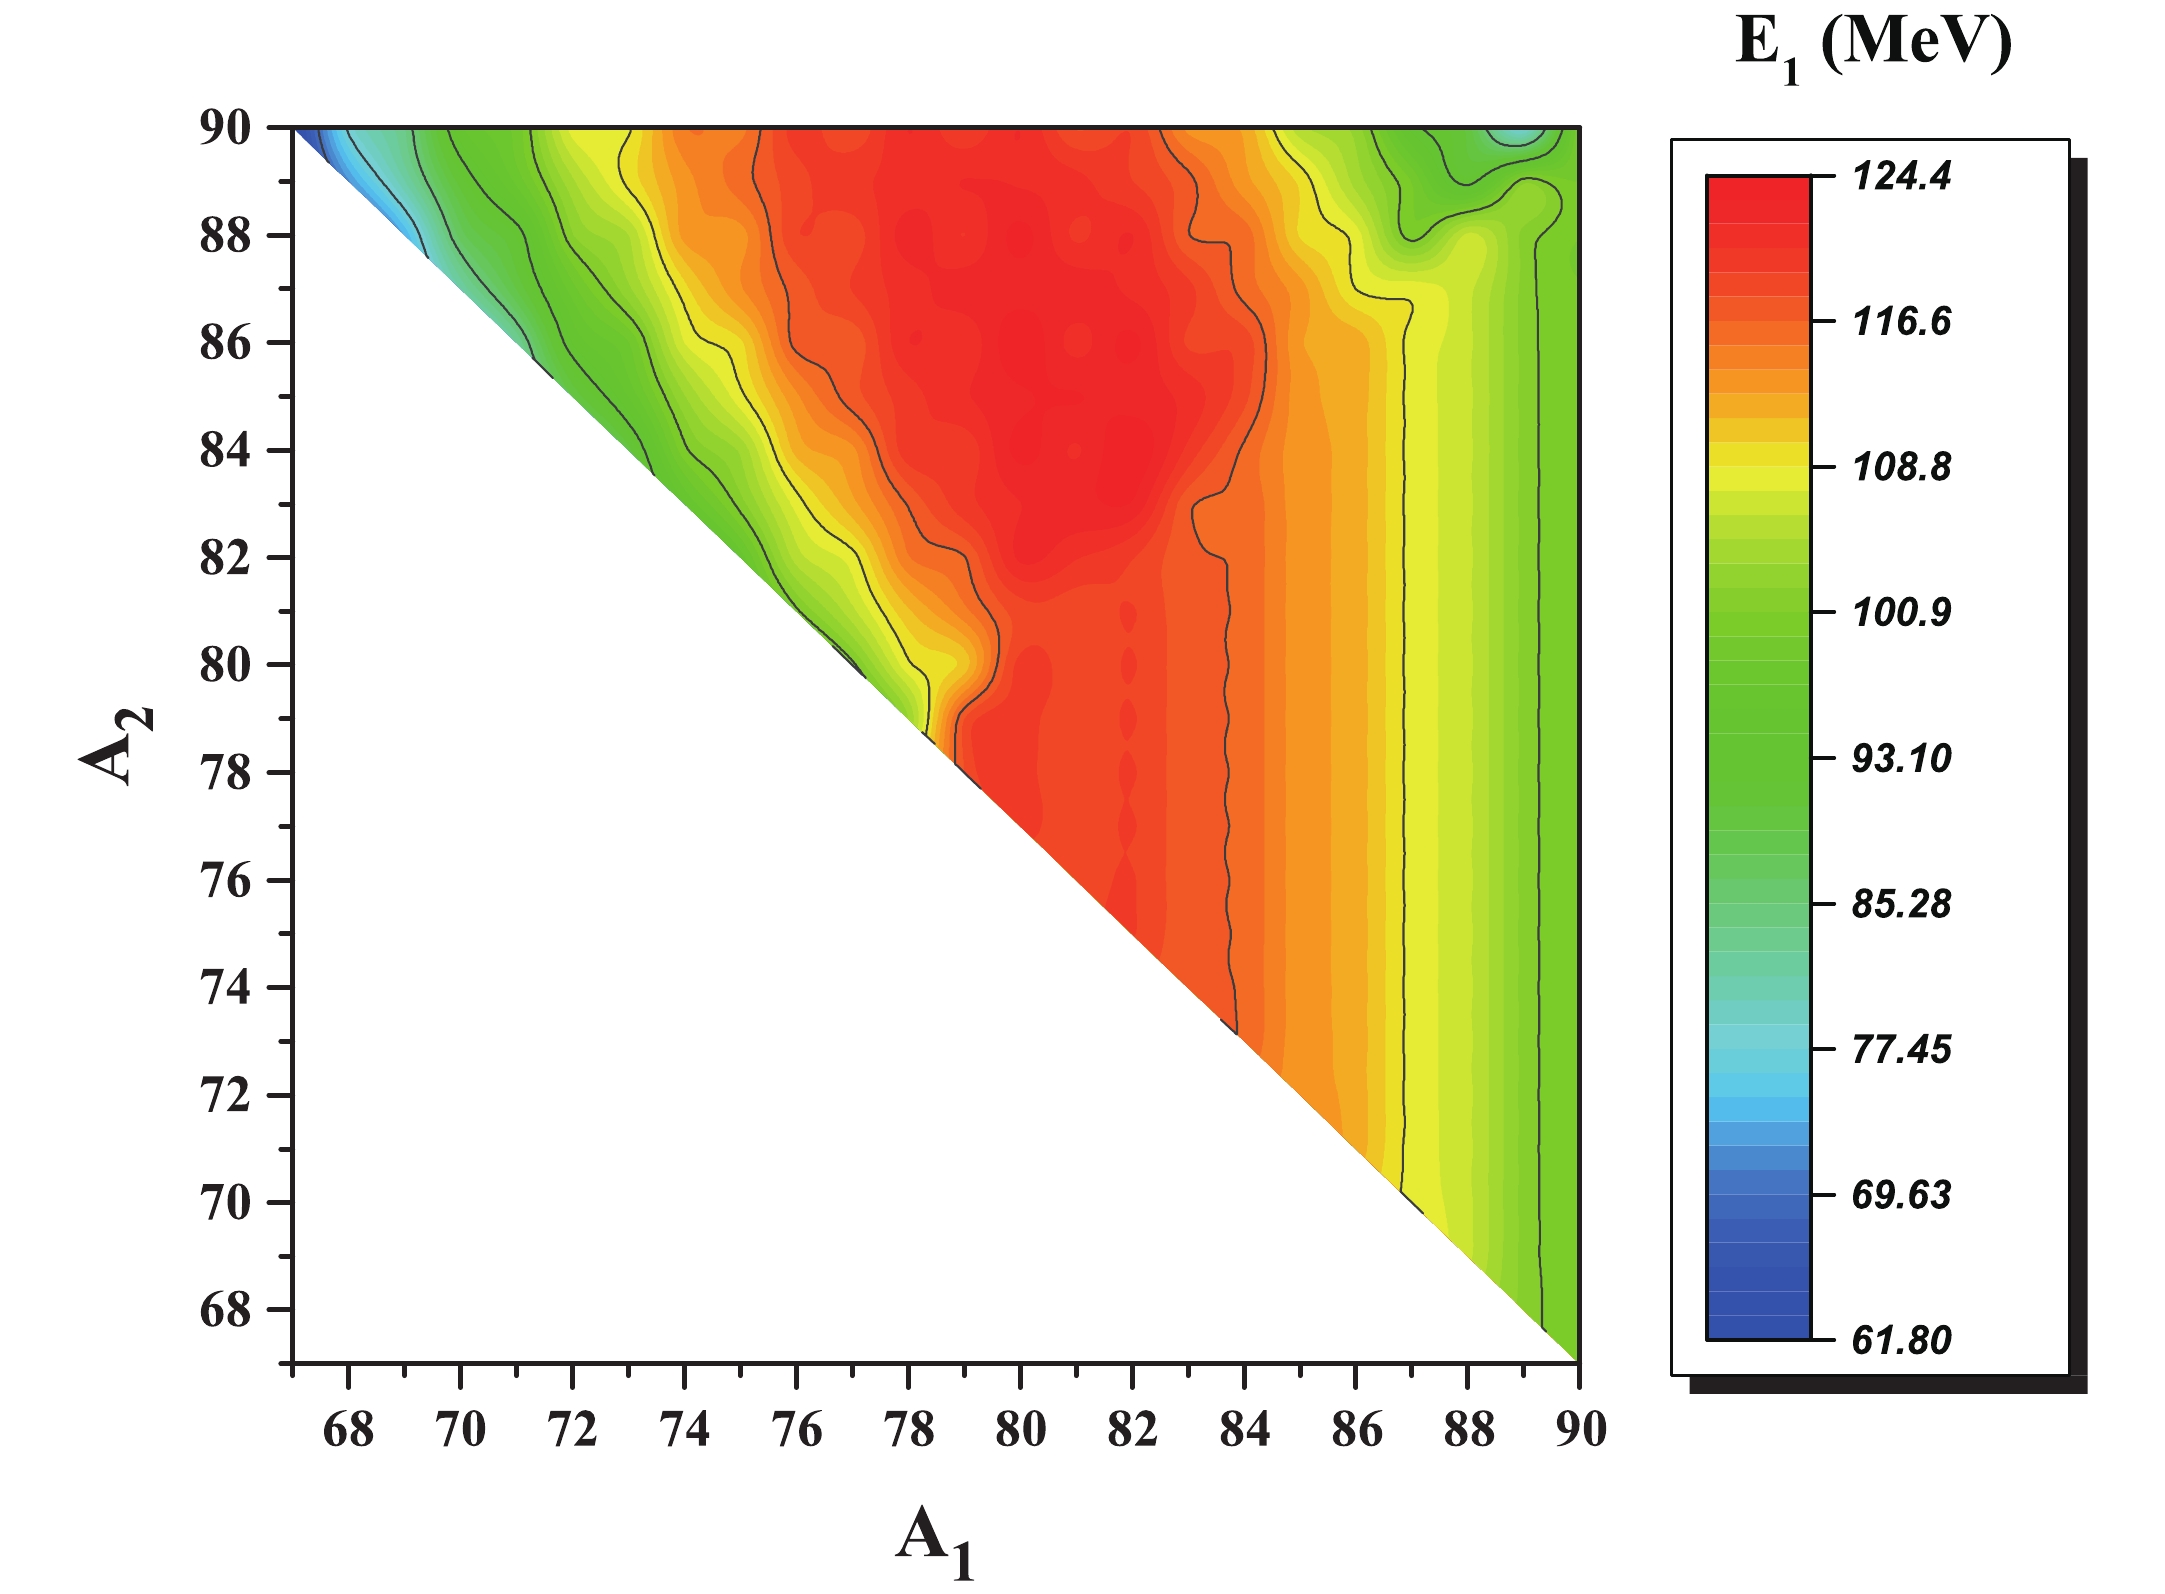 Figure10. (color online) Kinetic energy of the fragment
 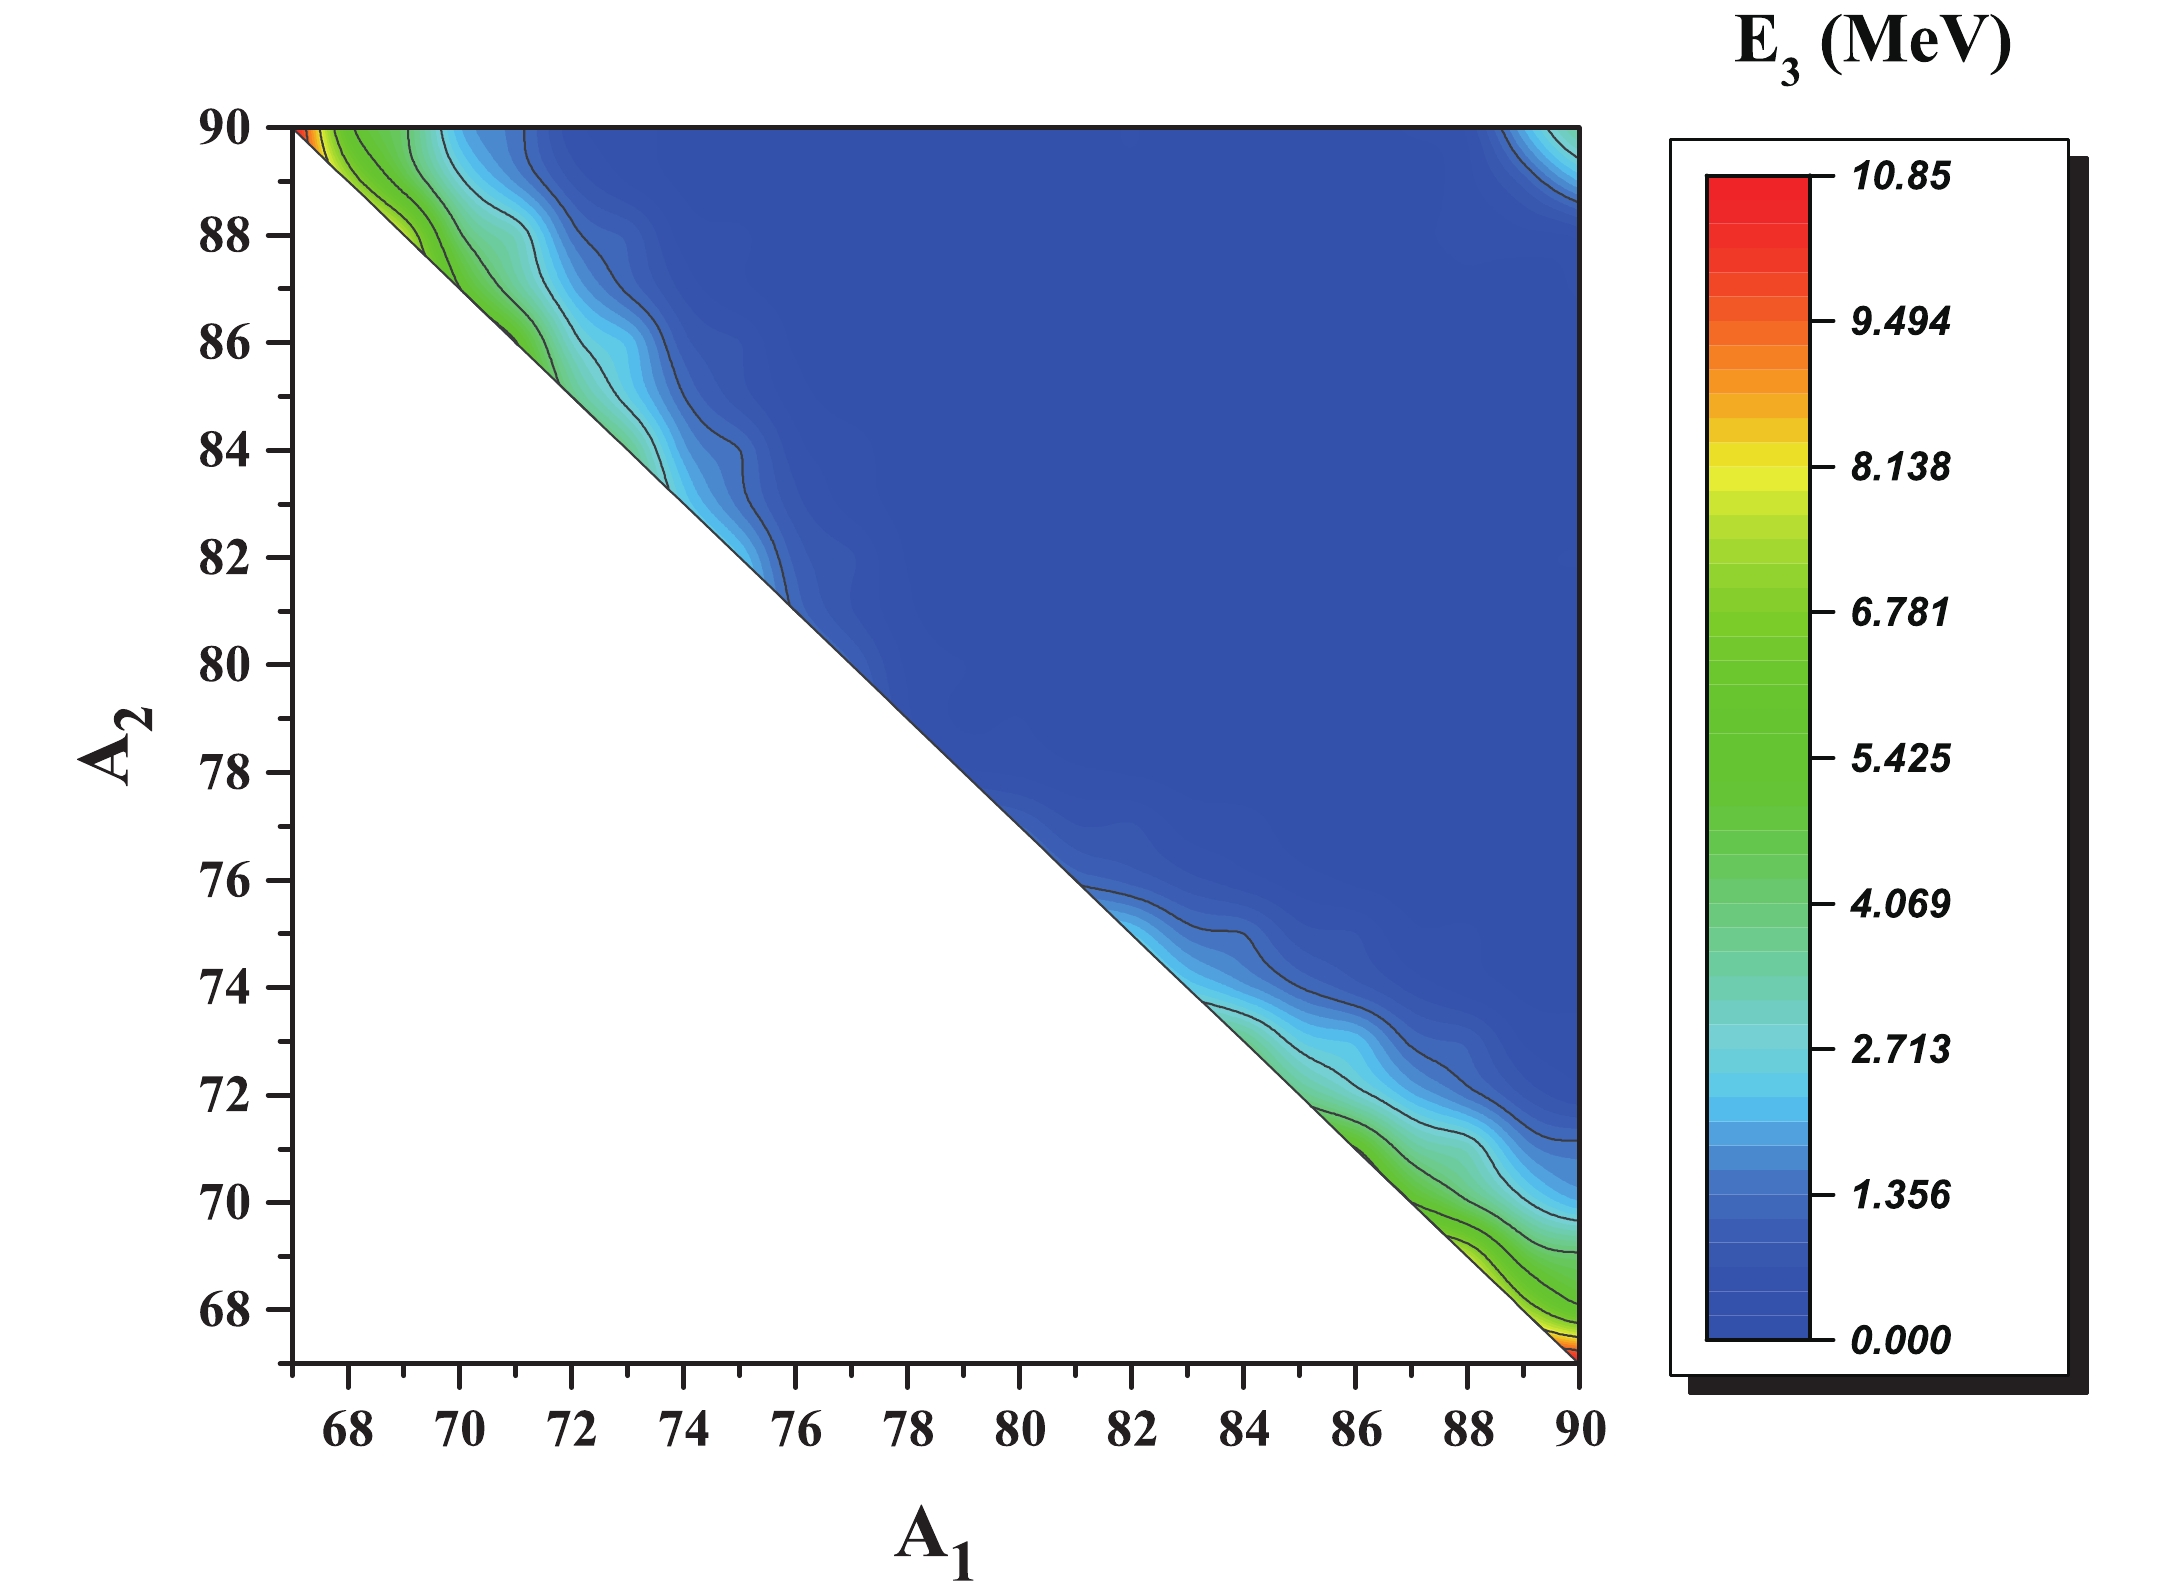 Figure11. (color online) Kinetic energy of the fragment
 As is clear from Fig. 11, the light fragment that is located in the middle of the collinear arrangement takes a very small part of the total kinetic energy, and the major part of the total kinetic energy is removed by the other two fragments. This observation could be the reason why the light fragment has escaped experimental detection. This result is in agreement with Ref. [49].
The kinetic energies of the fragments for the combinations mentioned in Fig. 2 are presented as a two dimensional graph in Fig. 12. The relative yields, Q-values and total kinetic energies of this group are also listed in Table 2. One may observe that the Q-values and total kinetic energies for each fragmentation in Table 2 are almost equal. This result is due to the assumption that ternary fission is a cold process.
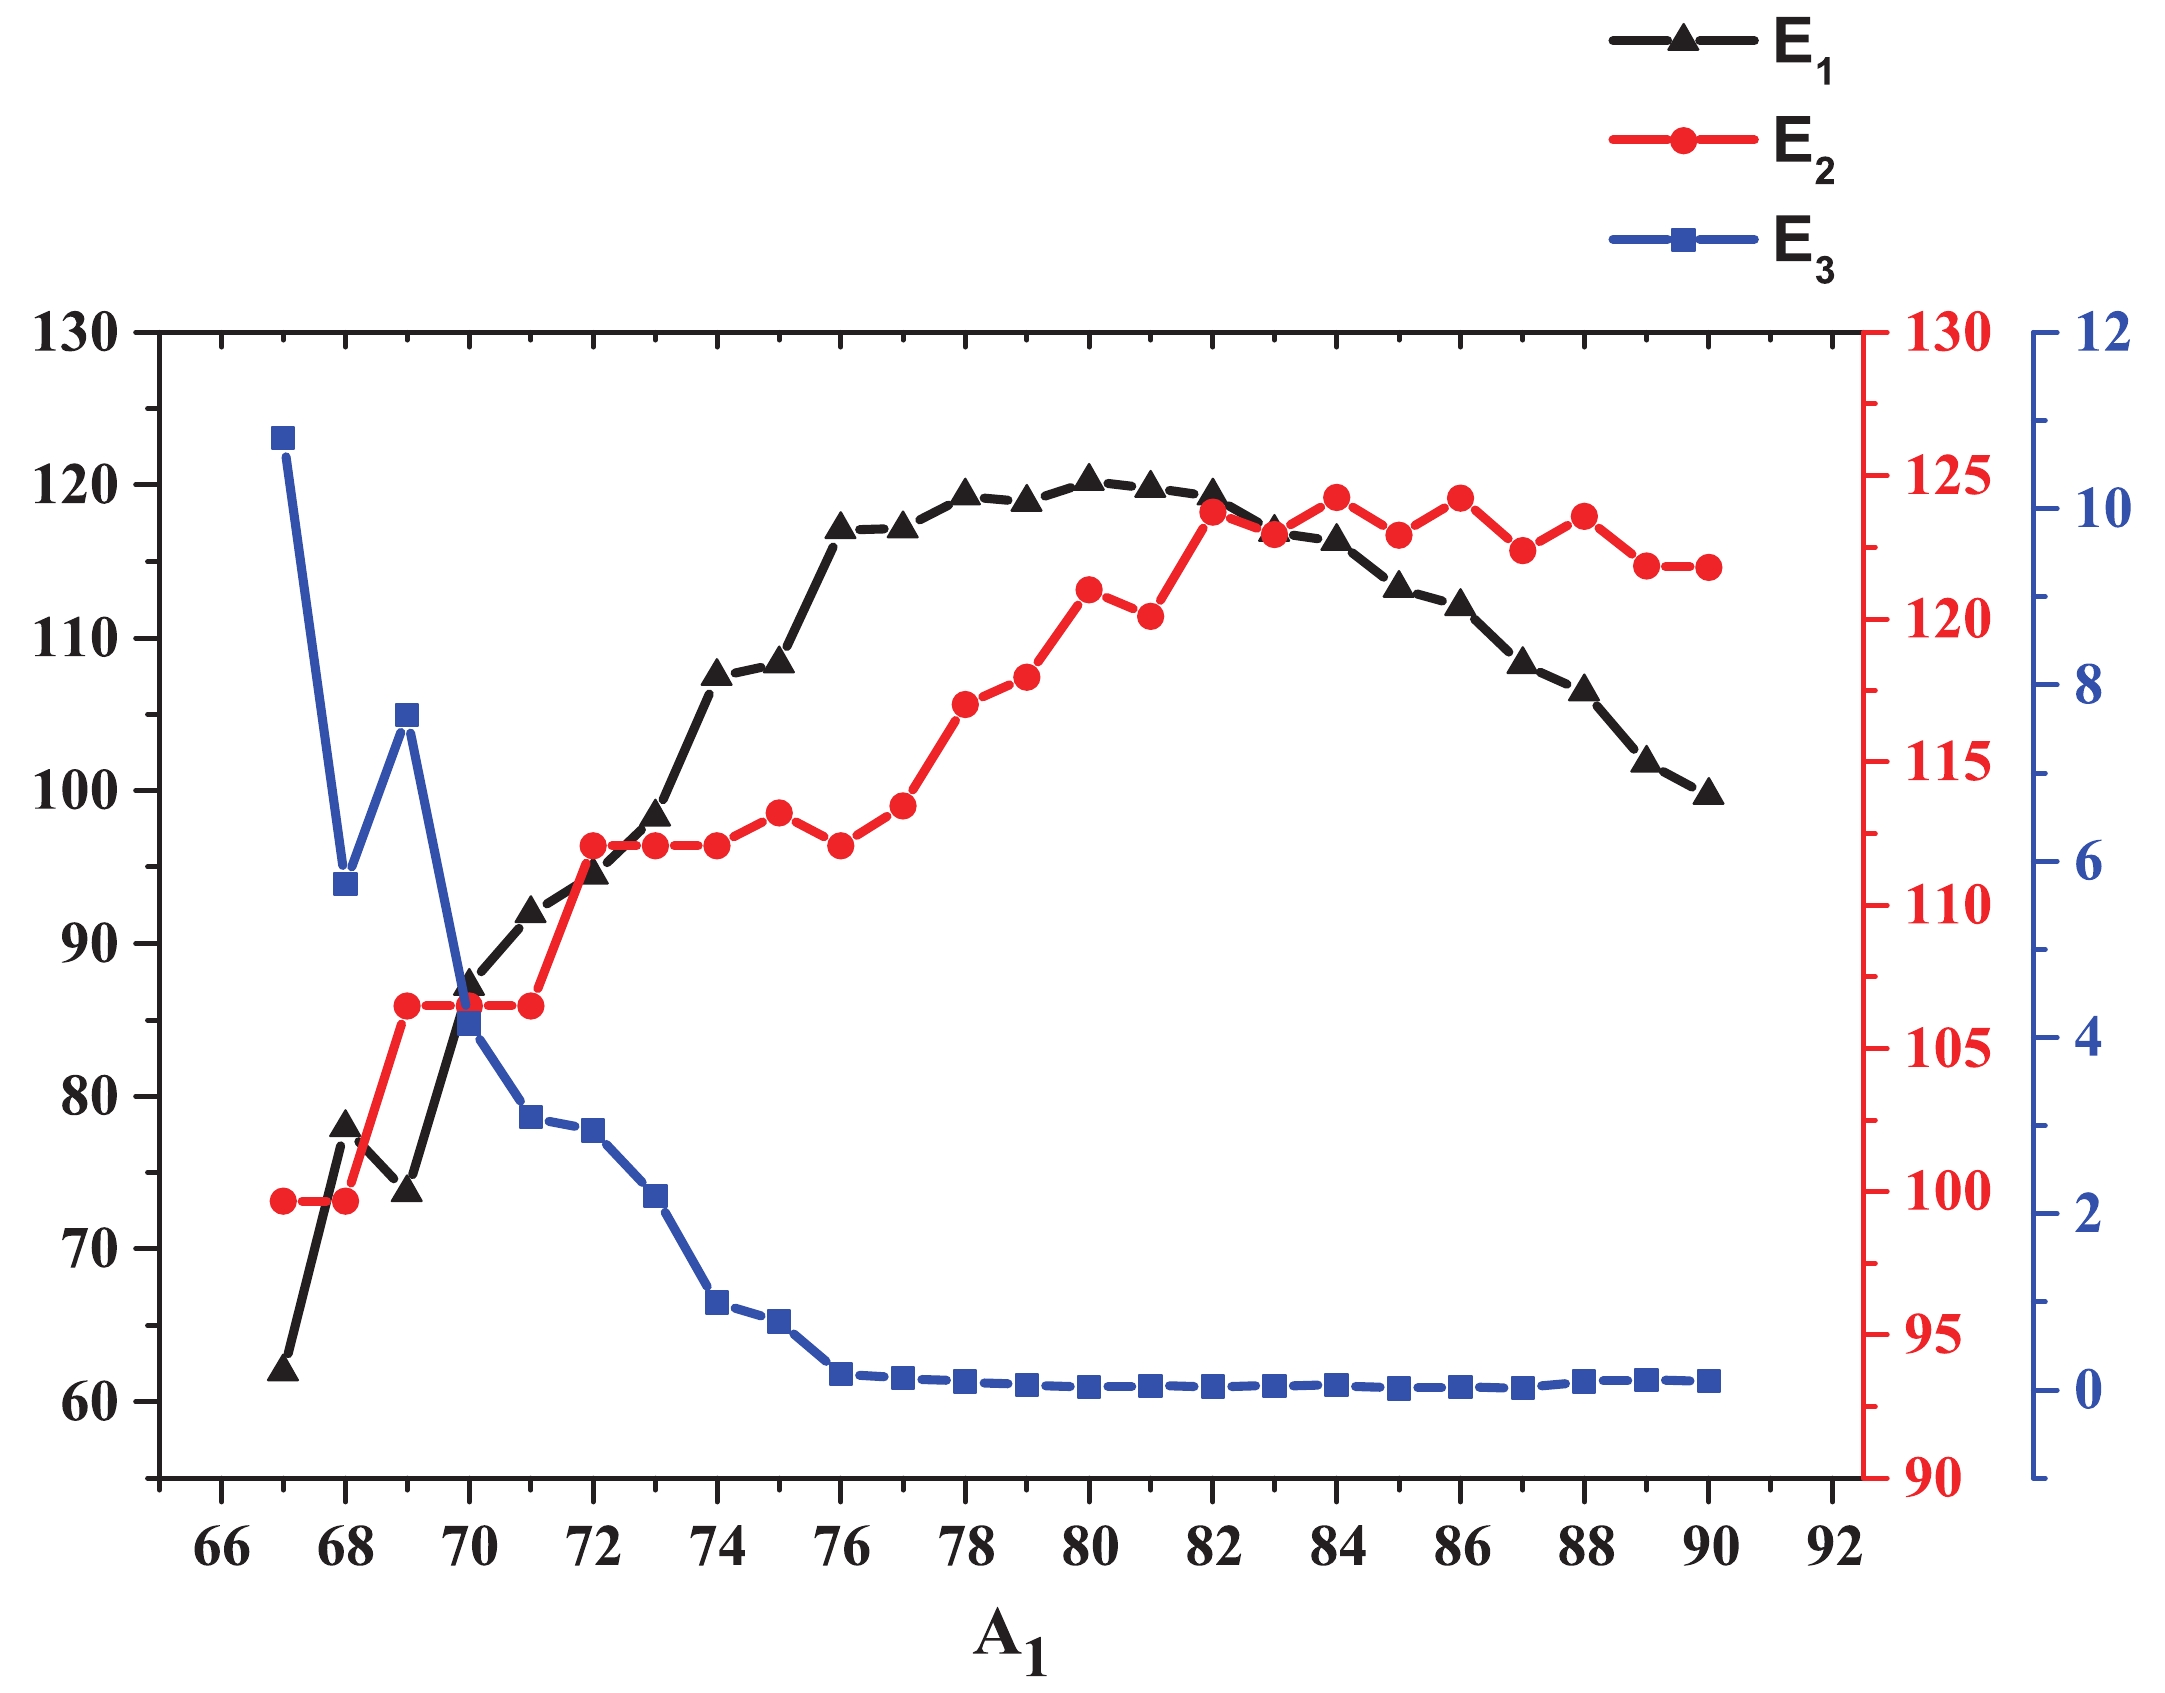 Figure12. (color online) Kinetic energies of the fragments
 | A1 | A2 | A3 | relative yield – collinear (%) | relative yield – equatorial (%) | Q /MeV | total kinetic energy /MeV |
| 67 | 90 | 85 | 0.000 | 0.000 | 172.437 | 172.438 |
| 68 | 90 | 84 | 0.000 | 0.000 | 183.327 | 183.329 |
| 69 | 88 | 85 | 0.000 | 0.000 | 187.799 | 187.801 |
| 70 | 88 | 84 | 0.000 | 0.000 | 197.830 | 197.832 |
| 71 | 88 | 83 | 0.000 | 0.000 | 201.505 | 201.506 |
| 72 | 86 | 84 | 0.000 | 0.000 | 209.474 | 209.476 |
| 73 | 86 | 83 | 0.000 | 0.000 | 212.516 | 212.517 |
| 74 | 86 | 82 | 0.000 | 0.000 | 220.511 | 220.512 |
| 75 | 85 | 82 | 0.000 | 0.000 | 222.309 | 222.310 |
| 76 | 86 | 80 | 1.26×10?6 | 0.000 | 229.340 | 229.341 |
| 77 | 85 | 80 | 8.34×10?6 | 0.000 | 230.703 | 230.704 |
| 78 | 84 | 80 | 1.98×10?2 | 1.25×10?3 | 236.377 | 236.379 |
| 79 | 83 | 80 | 3.66×10?2 | 2.78×10?3 | 236.874 | 236.875 |
| 80 | 82 | 80 | 13.00 | 5.23 | 241.318 | 241.319 |
| 81 | 82 | 79 | 1.39 | 0.457 | 239.858 | 239.859 |
| 82 | 82 | 78 | 61.7 | 92.1 | 243.032 | 243.033 |
| 83 | 82 | 77 | 0.817 | 0.512 | 239.899 | 239.901 |
| 84 | 82 | 76 | 1.38 | 1.68 | 240.585 | 240.586 |
| 85 | 80 | 77 | 5.79×10?3 | 8.85×10?4 | 236.166 | 236.167 |
| 86 | 80 | 76 | 5.17×10?3 | 1.25×10?3 | 236.317 | 236.318 |
| 87 | 79 | 76 | 2.28×10?6 | 0.000 | 230.632 | 230.633 |
| 88 | 80 | 74 | 6.11×10?7 | 0.000 | 230.151 | 230.152 |
| 89 | 79 | 74 | 0.000 | 0.000 | 223.735 | 223.737 |
| 90 | 78 | 74 | 0.000 | 0.000 | 221.557 | 221.559 |
Table2.Calculated data for the breakup
However, it is found that the Tin-accompanied ternary fission of
The kinetic energies of the fragments in the group
