 ,, 许有鹏,, 高斌, 周才钰南京大学地理与海洋科学学院,南京 210023
Variations of hydrological connectivity regulated by sluices in a delta plain
LU Miao,, XU Youpeng,, GAO Bin, ZHOU CaiyuSchool of Geography and Ocean Science, Nanjing University, Nanjing 210023, China通讯作者:
收稿日期:2020-05-18修回日期:2021-03-25
| 基金资助: |
Received:2020-05-18Revised:2021-03-25
| Fund supported: |
作者简介 About authors
陆苗(1990-), 女, 安徽蚌埠人, 博士生, 主要从事水文水资源方面研究。E-mail:

摘要
关键词:
Abstract
Keywords:
PDF (4163KB)元数据多维度评价相关文章导出EndNote|Ris|Bibtex收藏本文
本文引用格式
陆苗, 许有鹏, 高斌, 周才钰. 平原河网区水利工程调控下水文连通变化. 地理学报, 2021, 76(11): 2685-2696 doi:10.11821/dlxb202111007
LU Miao, XU Youpeng, GAO Bin, ZHOU Caiyu.
1 引言
在城镇化进程加快以及水利工程建设干扰下,平原河网水系的布局及连通程度都发生了变化,造成了区域水循环受阻、洪水宣泄不畅、调蓄能力下降、河湖健康退化等问题,严重威胁着区域生产、生活及生态安全。河网水系连通逐渐成为区域防洪、供水和生态安全的重要基础及关键问题[1,2]。河网水系连通在很大程度上受到水系结构特征的影响。随着河网水系结构研究的不断深入[3,4,5],生态学、水文学及地貌学等不同领域的****开始关注和重视河网水文连通问题[6,7]。国内关于水文连通的研究主要集中在宏观层面的水系连通,强调河流、湖泊、水库与湿地等不同水体之间的自然或人为的空间联系和水流连续性,并要满足水资源配置、区域调洪蓄水、水生态环境改善等方面的生活生产需求[8,9]。为此,国家将河湖连通工程上升到江河治理的重大战略层次上,将河湖水系连通作为中国一项重要治水方针。而国外主要侧重于在微观层面上,利用水文过程观测[10]、水文模型模拟[11]、地形连通控制[12]及连通指标构建[13,14]等方法,定量评价水文连通对流域水文、生态及地貌的影响研究[15,16]。其中,在评价大尺度平原河网时,常用的方法是构建水文连通指标,包括河网水系地貌形态连通指标,如基于图论的水系环度、节点连接率和网络连接度等[17],以及河网水文动态连通指数,如基于水位波动差的纵向连通指数等[18]。然而,河网水系连通是一个不断变化的过程。汛期与非汛期时水闸调度规则各不相同,受人类规律性调控干预后,水流连通渠道的畅通情况会发生周期性改变,从而使河网水系的水文连通特征发生规律性响应。已有指标多是基于水系结构的“静态”连通,动态模拟河网水文连通性的研究较少,特别是针对水利工程建设及人为调度等动态连通的探讨尚不完善。因此,在当前洪涝灾害趋于频繁的背景下,亟需开展水利工程调控下平原河网水文连通研究。
平原河网地区水系连通的基础是水系格局与地貌形态,但水闸等水利工程的建设及其调度能力和调度策略是影响河网水系水文连通结果的重要因素。为此,本文在现有水系结构连通的基础上,结合概率统计理论,以“水闸通过概率—水系分流能力—区域水文连通”为主线,将水利工程的运行纳入水文连通的评价体系,提出一种新的水文连通评价指数,探讨人为调度影响下的汛期与非汛期的水文连通动态变化,以期为评价平原河网区的水文连通提供新思路。
2 研究区概况与研究方法
2.1 研究区与数据
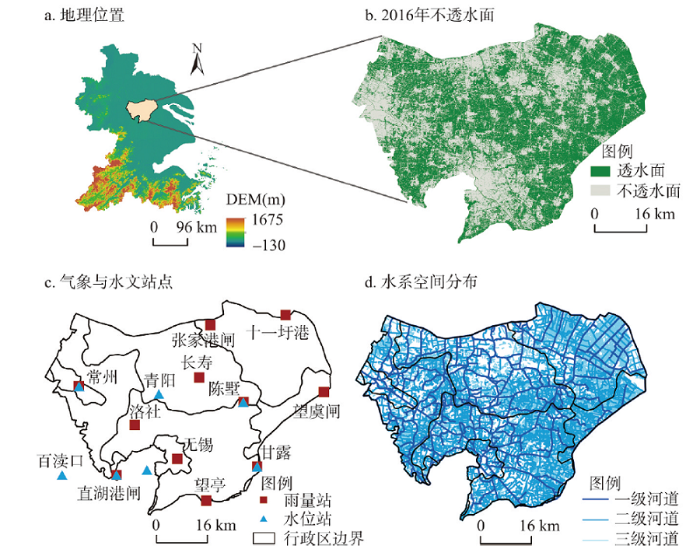
2.1.1 研究区概况 武澄锡虞区是中国太湖流域的一个典型水利分区,位于长江三角洲核心地带的平原水网区,北临长江,依靠长江大堤抵御长江洪水,南滨太湖,依靠环太湖大堤阻挡太湖高水。区域总面积约3615 km2(含沙洲自排区416 km2),水域面积约248 km2(图1a)。武澄锡虞区地势平坦,水道坡度极小,河道纵横交错,水系结构极为复杂。研究区河湖水系连通格局既包含了具体的河网水系形成的河网通道,也包含了水利工程影响下的河网水体流动体系,对于解决防洪排涝和水生态环境之间的矛盾具有重要作用。然而大量的水利工程,使得水系连而不通的现象在该区域也较为常见。此外,武澄锡虞区是一个典型的平原河网区,受到人为调控因素强烈,河网水系结构和水文连通发生剧烈的变化,由此导致的洪涝灾害和水环境问题已引起了国内外各界的广泛关注[19,20]。图1
 新窗口打开|下载原图ZIP|生成PPT
图1武澄锡虞区概况
Fig. 1The descriptions of the study region location, spatial distribution of impervious region in 2016, spatial distribution of hydrometeorological stations, and river network
2.1.2 数据来源与处理 本文所用的21世纪10年代水系数据主要来源于研究区1∶50000电子地形图,并基于2014年高空间分辨率遥感影像进行校核、修正与更新。由于研究区地势低平,河道纵横,流域边界模糊,难以按照Strahler、Shreve等规则进行河流分级[21,22]。因此,根据河流水系的自然属性及管理功能,将河道分为3级:1级河流(主干河流)宽度一般大于20 m;2级河流(一级支流)宽度一般为10~20 m;3级河流(二级支流)宽度小于10 m[23]。其中,主干河流在河网中主要起到引排水功能,而支流在河网中主要起到汇水与调蓄功能。水闸数据来源于全国第一次水利普查结果。2016年不透水面数据来源于全球高空间分辨率(30 m)人造表面逐年动态数据产品(
2.2 研究方法
本文将水利工程的运行纳入水文连通的评价体系,提出一种新的水文连通评价指数,适用于评价区域水文连通受到水闸调度影响下汛期与非汛期的变化程度。然后,通过反映地理要素空间集聚性的Getis-Ord Gi*指数来探测水文连通的空间分异性。最后,利用水位波动变化的干流连通指数对研究结果进行检验。2.2.1 平原河网区水文连通评价 本文中水文连通的主要涵义为:在自然和人工形成的江河湖库水系基础上,维系满足一定功能目标的水流路径畅通性,以维持相对稳定的流动水体及其联系的物质循环的状况[24,25]。在人为调控下平原水网地区河流水流路径的畅通性主要受到以下影响:① 水利工程的影响,体现在水利工程根据调度规则的开启与关闭;② 水系通道的分流能力,体现在水系分支与水流路径数量;③ 水利工程对水文连通的影响具有累积效应[25]。考虑到泵站对水文连通的影响研究对数据要求较高(如泵站位置、装机容量和开启时间等)且难以获取,本文仅将水闸工程纳入河网水文连通评价中。同时,由于平原河网区范围较大、水闸众多,每个水闸开启时间、高度等数据难以获取,因此本文主要考虑的是水闸工程受调度影响下的闸门开关概率,从宏观上来评价水文连通变化。
目前开展水文连通评价研究主要以行政区、水利分区等大尺度为主[3, 26-27],空间尺度过大难以刻画水文连通的空间分异性,特别是反映在城镇化背景下水文连通的空间分布。近年来,有****利用格网尺度来描述水系的空间分布特征,能够精细地描述水系结构的空间分异性[23, 28]。另外,由于太湖平原的水闸工程数量太多,其河网连通指数的计算量十分庞大。为此,本文将大尺度的平原河网集水区,分解成小尺度的格网,再将每个格网中的水文连通解析成点(水闸)、线(水系通道)、面(河网连通),分尺度逐步进行评价。
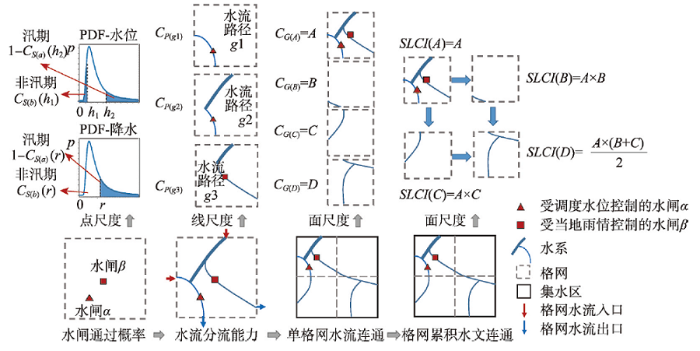
本文以格网为评价单元,通过“水闸通过概率、水流路径分流能力及河网连通”逐步评价不同调度规则影响下,汛期及非汛期水文连通的动态变化。研究思路如图2所示,具体计算流程如下。
图2
 新窗口打开|下载原图ZIP|生成PPT
图2研究思路示意图
Fig. 2Schematic diagram of research idea
(1)最优评价格网尺度。格网化水文连通最重要的是选择适合研究区水系的最优评价单元尺度。最佳统计单元的确定属于典型的变点分析问题。累积和方法是一种常用的判断格网最优尺度的方法,可以快速确定数据序列的增长速度拐点,即为最佳统计单元。节点连接率是指与河网中每一个节点相连的平均河链数量,可表征河网中节点之间连通的难易程度。故本文选择水系的节点连接率作为判断最优格网尺度的水系指标。具体地,通过计算节点连接率序列各数值与该序列算术平均值之差的累积和,其最大值出现的拐点位置,即为最优格网尺度,计算公式如下[29]:
式中:{Xi}是一系列不同格网尺度计算得到的节点连接率;
(2)水闸通过概率。有研究利用水闸开关评价水文连通时,将所有水闸工程的通过率均假定为50%[26, 30-31]。但是经过实地考察与走访,水闸工程的开启受到水闸调度规则的影响。调度规则中的当地暴雨事件与超过河道警戒水位事件的发生,主要受到气象水文事件发生频率的控制。非汛期时一些水闸工程一般会保持开放以维持水流通畅;而汛期时城市大包围及环湖水闸会关闭,沿江水闸会开启排水以防洪减灾。基于上述实际情况,本文从概率统计的角度,将气象水文事件发生的随机性转移到水闸开启的可能性,计算水闸工程依据一定的调度规则开启的概率即为水闸通过概率,其计算公式如下:
式中:F(x)为某站长时间水位或降水序列的最优概率密度函数;x是调度规则中控制水闸开关的暴雨与警戒水位阈值;CS(k)为水闸k的水闸通过概率,取值范围是[0, 1]。Kolmogorov-Smirnov检验法具有分布无关性的优点,且适用于多样本量序列[32,33,34]。F(x)可以通过Kolmogorov-Smirnov检验法选择适合某区域降雨与水位数据的最优拟合函数。
以具体的调度规则为例,受调度水位控制的水闸的调度规则为:① 非汛期时,当水位低于h1m,开闸引水,则该闸的水闸通过概率为CS(k)(h1);② 汛期时,当水位超过h2m,开闸排水,则该闸的水闸通过概率为1-CS(k)(h2)。受当地雨情控制的水闸的调度规则为:① 非汛期时,当日降水小于r mm,该闸保持开放,则该闸的水闸通过概率为CS(k)(r);② 汛期时,当日降水大于r mm,该闸为防洪会关闸,则该闸的水闸通过概率为1-CS(k)(r)。
(3)水流路径分流能力。在单个格网中,水流从入口到出口的过程中,除了受到水闸的阻隔,还会通过不同的路径,经过不同的水系分支。水系分支会影响水流的分流能力。根据水闸通过概率及水系分支个数,计算单个路径的分流能力,即为水流路径分流能力,其计算公式如下:
式中:m'为格网单元中上游入口到下游出口途径河道g分支的节点个数,本文中河流分支一般为2;n为河道g上的水闸个数;CP(g)是河道g的水流路径分流能力,CP(g)∈[0, 1]。
(4)格网化水文连通评价指数。水闸对水文连通的影响具有累积效应。在一个相对独立的子流域或者平原集水区中,水系连通会受到上游河道水闸的影响,且水流通过路径越多,水文连通程度越好。首先,计算单个格网中所有水流路径的分流能力即为格网的水流路径连通程度。然后,在同一个集水区中综合考虑自身格网以及上游相邻格网的水流路径连通程度,即为格网化水文连通评价指数(Sluice Longitudinal Connectivity Index, SLCI)。
在一个集水区内,若一个格网的位置为(i, j),则该格网的水文连通程度为自身格网与上游位置在(i-1, j)与(i, j-1)格网的水流路径连通程度的乘积的平均值。计算公式如下:
式中:N是格网l水流路径的总个数;CG(l)是格网l的水流路径连通程度;(i, j)是格网l位置的行列号;SLCI(i, j)为格网化水文连通评价指数,SLCI(i, j) ∈[0, 1]。该指数越接近于1,说明该格网水文连通程度越高。
2.2.2 Getis-Ord Gi*指数 Getis-Ord Gi*指数是一种常用的探测地理要素空间分异性的方法。本文利用该指数探测河网水系连通是否存在高值或者低值的空间集聚。高值区表示河网水系连通较高(大于平均值)的集聚区域,低值区表示河网水系连通较低(小于平均值)的集聚区域。该指数的计算公式如下[35]:
式中:n是研究区格网总数;xi和xj分别为格网i与格网j的水文连通值;wi, j是格网i与格网j之间的空间权重;E(Gi*)与var(Gi*)分别是Gi*值的数学期望与方差;Z(Gi*)是Gi*值的标准化值。Z(Gi*)可以反映水文连通高值与低值的空间集聚度。Z(Gi*)越大,说明河网水文连通的高值越集聚,属于高值区;Z(Gi*)越小,说明河网水文连通的低值越集聚,属于低值区。
2.2.3 干流连通指数 平原河网地区地势十分平坦且河流纵横交错,导致相邻观测站点之间水位的联系十分紧密。干流连通指数(Longitude Functional Connectivity Index, LFCI)是基于相邻水文站点间水位涨跌幅的差异的水文连通指数[12, 36]。本文利用日尺度水位数据,计算研究区典型水位站月尺度LFCI与年尺度汛期与非汛期LFCI,对研究结果进行验证。计算公式如下[12]:
式中:ΔLab为相邻观测站点a和b之间的水位涨跌幅之差;Lai、Laj、Lbi和Lbj分别为相邻观测站点a和b在i和j时段的水位;LFCI为平原河网地区相邻观测站点之间的水文连通指数(0 < LFCI ≤ 1);LFCI越接近0时水文连通性越差,而越接近1水文连通性越好。
3 结果与讨论
3.1 格网最优尺度
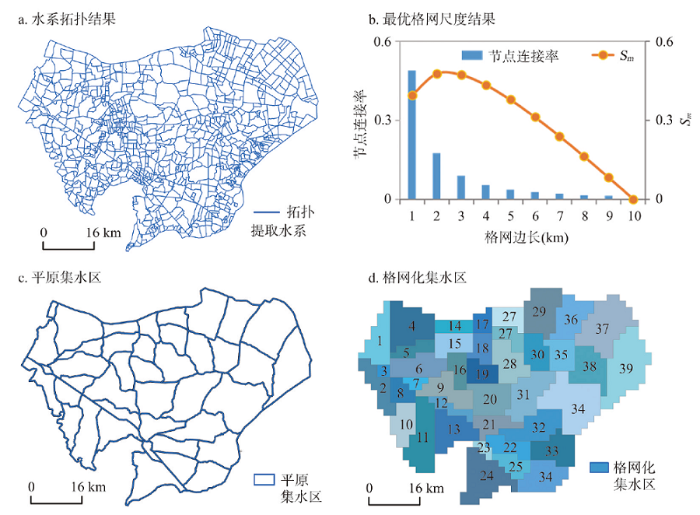
基于上述构建的方法,本文对武澄锡虞区的水文连通进行评价。经过拓扑检查,抽取结构上相连的水系作为评价对象,如图3a所示。在计算不同格网尺度(边长为1 km, 2 km, …, 10 km)中水系的节点连接率之后,利用累积和法确定最优格网尺度。由图3b可知,Sm随着格网尺度的扩大,呈现先上升再下降的趋势,拐点在2 km×2 km处出现,说明以2 km为边长的格网为最优格网尺度,此结果与文献[28]研究结果一致。由于平原河网区集水区划分困难,本文利用主干河道并参考其他研究的划分结果[37,38],将研究区分为不同的集水区,再将集水区划分成格网单元。根据骨干河道划分的集水区如图3c所示,以2 km×2 km格网化单元如图3d所示。图3
 新窗口打开|下载原图ZIP|生成PPT
图3水系拓扑提取结果、最优格网尺度结果、平原集水区空间图和格网化集水区划分结果
Fig. 3The results of structurally connected rivers, optimal grid scale, plain catchments and catchments with 2 km×2 km grids
3.2 平原河网水文连通动态评价
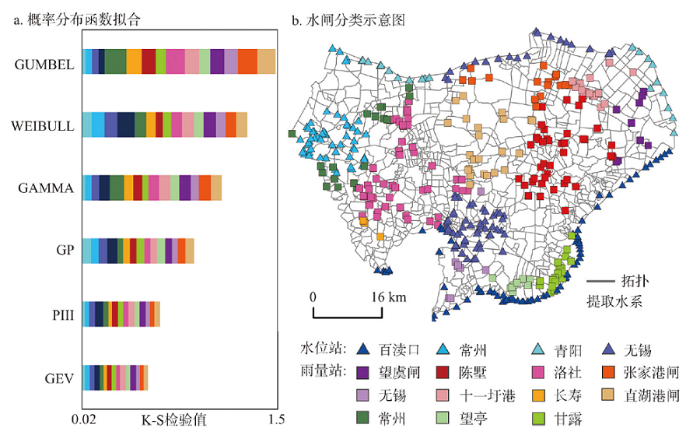
3.2.1 水闸通过概率结果 在计算水闸通过概率之前,需要选择拟合研究区降雨与水位数据的最优概率分布函数。本文从常用于水文事件的概率分布函数中,如广义极值(GEV)、帕累托(GP)、皮尔逊Ⅲ型(P-Ⅲ)、韦布尔(Weibull)、伽马(Gamma)及耿贝尔(Gumbel)等分布中,利用Kolmogorov-Smirnov检验法(K-S检验)选择适合研究区降雨与水位数据的最优拟合函数。K-S检验值越小,说明该函数拟合效果就越好。从K-S检验值的各站点累积值(图4a)可见,GEV函数对各站点的K-S检验值相比其他函数较小,说明GEV函数拟合效果较好,可以用于计算水闸通过概率。图4
 新窗口打开|下载原图ZIP|生成PPT
图4不同概率分布函数拟合结果和研究区水闸分类示意图
Fig. 4The fitting results of different probability distribution functions and schematic diagram of sluice classification
武澄锡虞区汛期时间为每年5—9月,非汛期为10月至第二年4月。根据野外考察与当地水文部门调研,目前武澄锡虞区基本形成了“北排长江、南排太湖、东排望虞河、沿运河下泄”的防洪除涝格局。然而,当地的水闸工程开启与关闭的时间并不确定。一般来说,水闸工程在泄洪和换水时会被开启,而其余时间内会被关闭。基于上述实际情况,参考《太湖流域洪水调度方案》与《太湖流域引江济太调度方案》,本文将水闸工程的调度方案在一定程度上进行了概化。
位于环太湖与望虞河的水闸受太湖水位(百渎口站)的调控,沿江水闸根据其所在区域分别受常州站、无锡站及青阳站水位的调控,常州、无锡城市大包围枢纽分别受常州站与无锡站水位的调控。调度规则中警戒水位值如表1所示。位于其他区域的水闸则根据当地雨情调控,降水r值定为达到暴雨级别的50 mm。根据河道概化结果,水闸空间分布如图4所示,图中标注了各个水闸所受控制的雨量站与水位站。
Tab. 1
表1
表1受水位站调度控制的水闸通过概率结果
Tab. 1
| 水位站 | K-S检验值 | h1(m) | h2(m) | CS(k)(h1)非汛期 | 1-CS(k)(h2)汛期 |
|---|---|---|---|---|---|
| 青阳 | 0.04 | 3.3 | 3.7 | 0.25 | 0.39 |
| 常州 | 0.03 | 3.5 | 4 | 0.30 | 0.30 |
| 无锡 | 0.04 | 3.2 | 3.6 | 0.31 | 0.31 |
| 百渎口 | 0.04 | 2.9 | 3.5 | 0.02 | 0.35 |
新窗口打开|下载CSV
利用公式(3)计算的水闸通过概率结果如表1、表2所示,分别以水位站与雨量站名称显示。例如,江阴枢纽、白屈港枢纽、张家港闸、十一圩港闸等水闸工程位于长江(无锡段),一般受无锡站水位的调度控制,非汛期时当无锡站水位低于3.2 m时,开闸引水,该水闸非汛期时的水闸通过概率为0.31;汛期时当无锡站水位高于3.6 m时,开闸排水,该水闸汛期时的水闸通过概率为0.31。当一个水闸的运行是受当地雨情影响,若该水闸位于常州雨量站附近,汛期时当常州站降水高于50 mm时,即当地雨情达到暴雨级别,该闸为了防洪会关闸,此时该水闸的水闸通过概率为0.17。而非汛期时,一般雨情达不到暴雨级别,该闸保持开放,保持河流连通,此时该水闸的水闸通过概率为0.83。
Tab. 2
表2
表2受雨量站当地雨情控制的水闸通过概率结果
Tab. 2
| 雨量站 | r(mm) | CS(k)(r)非汛期 | 1-CS(k)(r)汛期 | 雨量站 | r(mm) | CS(k)(r)非汛期 | 1-CS(k)(r)汛期 |
|---|---|---|---|---|---|---|---|
| 常州 | 50 | 0.83 | 0.17 | 十一圩港 | 50 | 0.84 | 0.16 |
| 直湖港闸 | 50 | 0.83 | 0.17 | 望亭 | 50 | 0.85 | 0.15 |
| 陈墅 | 50 | 0.85 | 0.15 | 望虞闸 | 50 | 0.84 | 0.16 |
| 甘露 | 50 | 0.85 | 0.15 | 无锡 | 50 | 0.83 | 0.17 |
| 洛社 | 50 | 0.83 | 0.17 | 张家港闸 | 50 | 0.83 | 0.17 |
| 长寿 | 50 | 0.85 | 0.15 |
新窗口打开|下载CSV
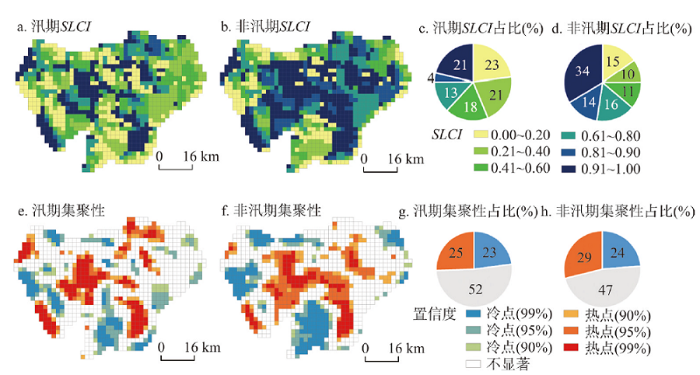
3.2.2 水文连通评价结果 基于上述水闸通过概率结果,根据公式(4)~(6)计算得到的水文连通指数SLCI值的空间分布如图5a、5b所示。非汛期时水文连通程度整体高于汛期时水文连通程度,特别是在武澄锡虞区中部及东部区域。水文连通指数SLCI值在0~0.2、0.2~0.4、0.4~0.6、0.6~0.8以及0.8~1.0范围内的地区占比如图5c、5d所示。汛期水文连通指数SLCI值在小于0.6的格网个数比非汛期多25.8%,而汛期水文连通指数SLCI值大于0.6的格网个数比非汛期少25.7%。同时,武澄锡虞区非汛期时SLCI均值为0.66,汛期时SLCI均值为0.50,非汛期水文连通程度平均比汛期高32%。
图5
 新窗口打开|下载原图ZIP|生成PPT
图5汛期与非汛期水文连通的空间分布及异质性分布
Fig. 5Spatial distributions and the significant spatial heterogeneity of flood connectivity and non-flood connectivity
此外,如图5e、5f所示,基于Getis-Ord Gi*指数得到的汛期与非汛期水文连通程度的空间分异性较为相似。非汛期水文连通低值区面积占区域面积的24%,SLCI均值为0.25,而汛期时,水文连通低值区面积占区域面积的23%,SLCI均值为0.16。非汛期水文连通高值区面积占区域面积的29%,SLCI均值为0.93,而汛期水文连通高值区面积占区域面积的25%,SLCI均值为0.87。整体上,非汛期时的水文连通集聚空间范围比汛期时高5%。特别地,通过与图1b研究区不透水面分布图对比,发现汛期与非汛期水文连通的高值区主要分布在不透水面覆盖低的城镇化程度较低的区域,低值区主要分布在不透水面覆盖高的城镇化程度较高的中心地区,在常州市与无锡市中心城区地区较为明显。
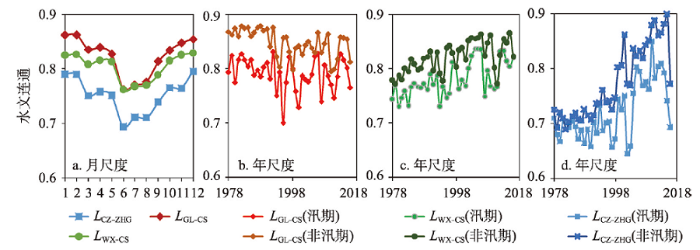
为验证研究结果的合理性,月尺度与年尺度干流连通指数(LFCI)的结果如图6所示。LCZ-ZHG为常州站与直湖港闸之间的水文连通性,代表高度城镇化地区的水文连通性;LWX-CS为无锡站与陈墅站之间的水文连通性,代表中度城镇化地区的水文连通性;LGL-CS为甘露站与陈墅站之间的水文连通性,代表郊区的水文连通性。在图6a中,5—9月汛期时LCZ-ZHG、LGL-CS与LWX-CS的值较其他月份低,且月尺度的LCZ-ZHG明显低于LGL-CS,也说明城市区域的水文连通比郊区差。在图6b~6d中,年尺度的LCZ-ZHG、LGL-CS与LWX-CS在非汛期时的值较其汛期时高,说明非汛期时的水文连通程度较汛期时高。该结果与本文发现的结果较为一致,可在一定程度上说明本方法及结果的可信度。
图6
 新窗口打开|下载原图ZIP|生成PPT
图6月尺度与年尺度汛期与非汛期LFCI指数变化
Fig. 6Variations of monthly and annual LFCI in flood and non-flood seasons
另外,1978—2016年间LCZ-ZHG呈现出明显的上升趋势,但在近几年有显著下降的趋势,而LGL-CS与LWX-CS变化不明显。一般对于自然水系来说,其水文连通程度与自身水系结构相关,若出现较大趋势的变化,很有可能是受到人类活动的影响[39]。近年来,在城市化等人类活动的影响下,河网水系的数量、形态和结构发生了剧烈的变化。同时在城市核心区域建设了防洪大包围工程,如常州市防洪运北大包围,该工程于2008年开始建设,2013年基本建成。这可能是导致2013—2016年LCZ-ZHG呈现持续下降的主要原因。城市防洪大包围建设提高了城市中心区防洪除涝标准,但其主要工程措施为城区骨干河道整治和闸泵建设,河道建闸在一定程度上切断了城市内河与外围河流湖荡的连通,使得原本就连通的河网水系出现了连通不畅甚至完全阻断的情况,水文连通情况会变差。
4 结论与展望
针对平原河网区水闸遍布、水文连通难以模拟的问题,在现有水系结构连通的基础上,提出一种适用于平原河网区人为调控作用下的水文连通评价指数,从“水闸通过概率—水系分流能力—区域水文连通”逐步探讨水文连通动态变化。本文将水闸开关可能性转换为暴雨或警戒水位发生事件的随机性,来评价平原河网区的水文连通,具有以下特点:① 在评价体系中纳入水闸工程对水文连通的调控,根据不同调度规则,能够反映汛期与非汛期的水文连通程度变化;② 相比以往计算单元为行政单元的方法,本方法以格网为评价单元,可以更为精细地反映水文连通的空间分异性,后续可以用来与一些地理空间要素结合分析,如土地利用等,为探究自然环境与水文连通之间的关系提供支持。然而,人类活动与水文连通的关系较为复杂。首先,水利工程具有不同的功能,使得其实际调度更为复杂,通常有水量调度、洪水调度、生态调度等方式。其次,人类活动与河湖水系连通之间是一种相互作用、交互耦合的关系。一方面,在社会经济发展过程中,河湖水系连通发生改变,水系问题显现;另一方面,河湖水系连通格局的改变及其提供的服务功能,反过来会影响社会经济发展。社会经济发展系统与河湖水系连通系统之间的影响非常复杂,不是单向的作用。因此,水文连通评价仍是一个复杂的科学问题,未来研究应围绕水利工程不同的功能及其调度方式进一步深入探讨水利工程对水文连通的影响。
参考文献 原文顺序
文献年度倒序
文中引用次数倒序
被引期刊影响因子
DOI:10.1111/1752-1688.12631PMID:30078985 [本文引用: 1]

Interest in connectivity has increased in the aquatic sciences, partly because of its relevance to the Clean Water Act. This paper has two objectives: (1) provide a framework to understand hydrological, chemical, and biological connectivity, focusing on how headwater streams and wetlands connect to and contribute to rivers; and (2) review methods to quantify hydrological and chemical connectivity. Streams and wetlands affect river structure and function by altering material and biological fluxes to the river; this depends on two factors: (1) functions within streams and wetlands that affect material fluxes; and (2) connectivity (or isolation) from streams and wetlands to rivers that allows (or prevents) material transport between systems. Connectivity can be described in terms of frequency, magnitude, duration, timing, and rate of change. It results from physical characteristics of a system, e.g., climate, soils, geology, topography, and the spatial distribution of aquatic components. Biological connectivity is also affected by traits and behavior of the biota. Connectivity can be altered by human impacts, often in complex ways. Because of variability in these factors, connectivity is not constant but varies over time and space. Connectivity can be quantified with field-based methods, modeling, and remote sensing. Further studies using these methods are needed to classify and quantify connectivity of aquatic ecosystems and to understand how impacts affect connectivity.
[本文引用: 1]
[本文引用: 1]
[本文引用: 2]
[本文引用: 2]
DOI:10.11821/dlxb201601006 [本文引用: 1]
Based on the river system data in the 1960s, 1980s and 2010s, the indicator system of quantitative description of river systems change characteristics was established, then the spatial-temporal changes of river systems and its relationship with urbanization in Jiaxing over the past 50 years was analyzed. Results indicated that: (1) Over the past half century, river systems of Jiaxing showed a decline trend. Specifically, the river development coefficient, river density and water surface ratio decreased by 58.91%, 28.94% and 14.09%, respectively. However, the degradation of the river systems varies in different urbanization stages. (2) In the whole urbanization process, the spatial differences of the changes of the river development coefficient and main river area length ratio were extremely large, and the spatial differences of the changes of the river density and water surface ratio were larger, but the spatial differences of the changes of the box dimension and river sinuosity were relatively small. (3) The decline trend of the river development coefficient, box dimension and river density was more significant in the urban area than that in the suburbs and outer suburbs, the decline trend of the water surface ratio was more significant in the outer suburbs than that in the suburbs and urban area, and the decline trend of the river sinuosity was more significant in the suburbs than that in the urban area and outer suburbs, but the spatial change trend of the main river area length ratio was insignificant. (4) The impacts of urbanization on river systems changes were extremely significant, and the changes of river systems were more drastic in higher urbanization level regions, but the impacts of urbanization on main river area length ratio and river sinuosity were larger than that on river development coefficient and river density.
[本文引用: 1]
[本文引用: 1]
[本文引用: 1]
DOI:10.1002/(ISSN)1099-1085URL [本文引用: 1]
[本文引用: 1]
[本文引用: 1]
[本文引用: 1]
[本文引用: 1]
[本文引用: 1]
[本文引用: 1]
[本文引用: 1]
DOI:10.1002/hyp.v26.18URL [本文引用: 1]
DOI:10.1016/j.earscirev.2013.02.001URL [本文引用: 3]
[本文引用: 1]
[本文引用: 1]
[本文引用: 1]
[本文引用: 1]
DOI:10.1016/j.scitotenv.2018.10.139URL [本文引用: 1]
DOI:10.1016/j.jhydrol.2017.11.005URL [本文引用: 1]
[本文引用: 1]
[本文引用: 1]
DOI:10.1007/s10661-011-1934-9PMID:21400244 [本文引用: 1]
Methods to characterize hydrological connectivity at riparian wetlands are necessary for ecosystem management given its importance over ecosystem structure and functioning. In this paper, we aimed to describe hydrological connectivity at one Ebro River reach (NE Spain) and test a method to perform such characterization. Continuous surface water level and temperature data were recorded at five riparian wetlands during the period October 2006-June 2007. Combining water level and temperature, we classified the examined wetlands in three groups, which mainly differed in the dominant water source during different flood stages. Firstly, a comparison of water level fluctuations in riparian wetlands with those in the river channel during events with different characteristics was used to describe hydrological connectivity. Such comparison was also used to extract quantitative hydrological connectivity descriptors as the wetland response initiation time. Secondly, water temperature series were divided in phases with different average, range and daily oscillation, and these parameters were interpreted for each phase to identify dominant flowpaths. By doing so, a more complete description of hydrological connectivity was achieved. Our method provided useful insights to describe hydrological connectivity using a qualitative approach that can be expanded if required to include quantitative parameters for studies of biotic assemblages or ecosystem processes.
DOI:10.11821/dlxb201505012 [本文引用: 1]
Spatial and temporal variations of river systems in the Yangtze River Delta (YRD) during the 1960s-2010s were investigated based on streams derived from the topographic map in the 1960s, 1980s and 2010s. A list of indices, drainage density (Dd), water surface ratio (WSR), the ratio of area to length of main river (R), evolution coefficient of branch river (K) and box dimension (D), were classified into three types (quantitative, structural, and complex indices) and used to quantify the variation of stream structure. Results showed that: (1) quantitative indices (Dd, WSR) presented a decreasing trend in the past 50 years, and Dd in Wuchengxiyu, Hangjiahu and Yindongnan decreased by about 20%. Structurally, the Qinhuai river basin was characterized by a significantly upward R, and K value in Hangjiahu went down dramatically by 46.8% during the 1960s-2010s. A decreasing tendency in D was found to dominate the YRD, and decreasing magnitude in Wuchengxiyu and Hangjiahu peaked for 7.8%, and 6.5%, respectively in the YRD. (2) Urbanization affected the spatial pattern of river system, and areas with a high level of urbanization exhibited least Dd (2.18 km/km2), WSR (6.52%), K (2.64) and D (1.42), compared with moderate and low levels of urbanization. (3) Urbanization also affected the evolution of stream system. In the past 50 years, areas with high level of urbanization showed a compelling decreasing tendency in quantitative (27.2% and 19.3%) and complex indices (4.9%) and trend of enlargement of main rivers (4.5% and 7.9% in periods of the 1960s-1980s and 1980s-2010s). (4) Expanding of urban land, construction of hydraulic engineering and irrigation and water conservancy activities were the main means.
[本文引用: 1]
DOI:10.1007/s11769-012-0570-9URL [本文引用: 1]
DOI:10.1016/j.landurbplan.2013.02.008URL [本文引用: 1]
[本文引用: 1]
DOI:10.11821/dlxb201801009 [本文引用: 2]
To reveal the impact of rapid urbanization on river system in a river network plain, characteristic indexes of river system, such as grid river density, development coefficient of tributary and fractal dimension, were used to evaluate the temporal and spatial changes of river system in Suzhou City from 1980s to 2010s, based on topographic map in 1:50000 scale and remote sensing image in 30m scale. The results were as following: The length of river system was decreased by 10.55%. From view of each order river, the length of 1st order river was increased by 3.24%, while that of 2nd order river and 3rd order river was decreased by 18.87% and 11.76%, respectively. The grid river density of river system was mainly decreased across most area of this region, and the change trend between main river and tributary was opposite in space, i.e., the grid river density of main river was mostly increased, while that of tributary was mostly decreased. The development coefficient of tributary and fractal dimension of river system respectively changed from 3.36 to 2.78 and 1.70 to 1.63, which indicated that the structure and morphology of river system became simplified. The attenuation of river system became remarkable when the land urbanization rate was greater than 40%. The response to land urbanization for each order river was different. Overall, 1st order river experienced a slight increase, to enhance the capability of flood control and drainage. When the land urbanization rate was less than 40%, some 2nd order rivers were occupied by farmland, and many 3rd order rivers were dug to improve the capacity of drainage and irrigation. When the land urbanization rate was greater than 40%, a lot of tributaries were buried and converted to construction land. And the lower the order river, the more severe the attenuation was.
[本文引用: 2]
DOI:10.1016/j.scitotenv.2018.09.170URL [本文引用: 1]
DOI:10.1002/ldr.v29.8URL [本文引用: 2]
DOI:10.1016/j.jhydrol.2018.09.060URL [本文引用: 2]
[本文引用: 1]
[本文引用: 1]
[本文引用: 2]
[本文引用: 2]
[本文引用: 1]
[本文引用: 1]
DOI:10.1890/12-1564.1URL [本文引用: 1]
DOI:10.1007/s10980-008-9283-yURL [本文引用: 1]
DOI:10.1016/j.scitotenv.2019.03.413URL [本文引用: 1]
DOI:10.1175/MWR3326.1URL [本文引用: 1]
[本文引用: 1]
[本文引用: 1]
DOI:10.1111/gean.1992.24.issue-3URL [本文引用: 1]
DOI:10.1016/j.scitotenv.2017.12.088URL [本文引用: 1]
[本文引用: 1]
[本文引用: 1]
[本文引用: 1]
[本文引用: 1]
DOI:10.11821/dlxb202007011 [本文引用: 1]
The natural river system, which is inherently interconnected, is an essential resource for human and economic society. Beyond water, and the flows of substance (e.g. sediment, contaminant), energy (e.g. streamflow velocity), and information (e.g. livelihood and activity) are exchanged in an interconnected river system. However, under the joint influences of natural evolution and human activities, the natural river system has been and is being changed. Particularly, water-related human activities in recent years are frequent and highly intensified, such as the water allocation projects and man-made reservoirs. Therefore, research on the evaluation of human activities affecting the interconnected river system network (IRSN) is needed to technically support the relevant practices. This study analyzed the affecting factors of IRSN from two perspectives: natural perspective and social perspective. The processes of human activities affecting the IRSN were theoretically explained. On this basis, both the positive and negative influences of human activities on IRSN were summarized in three aspects: interconnected-river-system-network function relationship, rivers-lake-system natural function, and interconnected-river-system-network function. To this end, the study proposed a quantitative evaluation method to assess human activities affecting the IRSN in the above three aspects. As the Huaihe River basin was severely influenced by human activities, we applied the evaluation method in this basin. Results show that human activities contributed to the interconnected-river-system-network function, meaning that possible influences on water scarcity and flood protection were generated in improving the complexity of man-made river system. Meanwhile, slight negative influences on the rivers-lake-system natural function were reported, as downstream aquatic life and surrounding environment were affected by the flow changes of water, substance and information. Together with characteristics of the Huaihe River basin, the overall quantitative evaluation results suggested that stepping up the efforts to protect the environment could further positively influence the IRSN in the Huaihe River basin. This study sheds new light on our understanding and quantitative evaluation of the influence of human activities on the IRSN.
[本文引用: 1]
