 ,, 马平易, 李文青, 杜昱璇西北师范大学地理与环境科学学院,兰州 730070
Spatiotemporal changes of supply and demand relationships of ecosystem services in the Loess Plateau
ZHAO Xueyan,, MA Pingyi, LI Wenqing, DU YuxuanCollege of Geography and Environment Science, Northwest Normal University, Lanzhou 730070, China收稿日期:2020-06-22修回日期:2021-03-25
| 基金资助: |
Received:2020-06-22Revised:2021-03-25
| Fund supported: |
作者简介 About authors
赵雪雁(1971-), 女, 甘肃武都人, 博士, 教授, 主要从事生态经济研究。E-mail:

摘要
关键词:
Abstract
Keywords:
PDF (12821KB)元数据多维度评价相关文章导出EndNote|Ris|Bibtex收藏本文
本文引用格式
赵雪雁, 马平易, 李文青, 杜昱璇. 黄土高原生态系统服务供需关系的时空变化. 地理学报, 2021, 76(11): 2780-2796 doi:10.11821/dlxb202111013
ZHAO Xueyan, MA Pingyi, LI Wenqing, DU Yuxuan.
1 引言
“人类世”以来,人类活动对生态系统干扰日益加剧,生态系统服务功能衰减[1],人类福利水平遭受严峻挑战。保护生态环境、维持人类福祉已成为国际科学研究计划的重点关注内容,继千年生态系统评估项目、生物多样性公约、生态系统服务政府间科学政策平台后,联合国在《改变我们的世界:2030年可持续发展议程》中进一步将“保护、恢复和促进可持续利用陆地生态系统、可持续管理森林、防治荒漠化、制止和扭转土地退化现象、遏制生物多样性的丧失”作为全球可持续发展目标之一[2]。随着工业化与城市化的快速推进,中国出现了国土空间开发失衡、资源约束趋紧、环境污染严重、生态系统退化等一系列问题,显著影响生态系统服务供需平衡,严重威胁到国家与区域生态安全[3]。为确保生态系统与社会系统健康协调发展,国务院先后颁布《全国主体功能区规划》《全国生态功能区划》《中国落实2030年可持续发展议程国别方案》等文件,明确提出构建国家和区域生态安全格局;“十九大”报告也提出“要提供更多优质生态产品以满足人民日益增长的优美生态环境需要”。因此,急需厘清生态系统服务供需关系及其空间匹配状况,为促进生态系统综合管理、自然资源合理配置、国土空间格局优化提供参考。生态系统服务供给和需求反映了生态系统服务从自然生态系统向人类社会系统流动的动态过程,对实现生态安全和社会经济可持续发展具有重要推动作用[4],这已成为国际生态系统服务研究的热点问题。早期生态系统服务供需研究主要关注生态系统供需概念的界定与研究框架的完善,且更重视生态系统服务供给[5];近年来主要关注生态系统服务供需量化及空间化、供需平衡、供需空间分布等[3, 6, 7-9]。其中,生态系统服务供需量化主要采用生态过程模拟、生态价值当量法、土地利用估计、专家评估矩阵法、生态模型等方法[1, 10-13];供需平衡研究则多采用生态供需比、需求率、供需协调度等方法[14,15,16]。研究尺度也从街道、流域、山区、盆地等中小尺度扩至国家、全球等尺度[7, 17-20],例如,Ala-Hulkko等[10]通过量化粮食供给与需求,绘制了欧洲生态系统服务供求关系图;Wang等[6]提出生态系统服务供给指数(ESPI)和土地开发指数(LDI)以反映中国生态系统服务供需状况;Wolff等[20]绘制了全球范围内人类对动物授粉、野生药用植物和户外休闲的需求空间图。总体来看,已有研究多关注生态系统服务供需关系静态特征,较少关注生态系统服务供需的时空格局及空间匹配关系演变;多关注生态系统服务综合研究,对不同类型生态系统服务的关注较少。
黄土高原地处黄河中游,属于半湿润区向半干旱区过渡地带,承担着重要的生态服务功能,在为区内提供粮食生产、水源涵养、土壤保持等生态系统服务的同时,也向其他区域外溢生态系统服务,尤其向黄河下游提供水源涵养、土壤保持等服务。该区也是中国多民族交汇地带以及贫困人口集中区,面临全面脱贫和保护生态的双重任务,厘清该区生态系统服务供需匹配关系不仅对促进黄土高原可持续发展至关重要,也对促进黄河流域的生态保护和高质量发展具有重要推动作用。自1999年实施退耕还林工程以来,黄土高原生态系统整体向健康方向发展[21],但也面临区域产水量下降、植被恢复不稳定和局部区域粮食短缺等问题[22],这直接影响着黄土高原生态安全与可持续发展。
鉴于此,本文利用InVEST模型、ArcGIS、GeoDa软件,在模拟黄土高原粮食供应、水源涵养、碳固存、土壤保持服务供需量的基础上,分析各类生态系统服务供需的时空格局变化特征,揭示各生态系统服务供需数量及其空间匹配状况的动态变化,旨在为黄土高原修复生态环境、优化国土空间格局提供科学依据与借鉴。
2 研究方法与数据来源
2.1 研究区
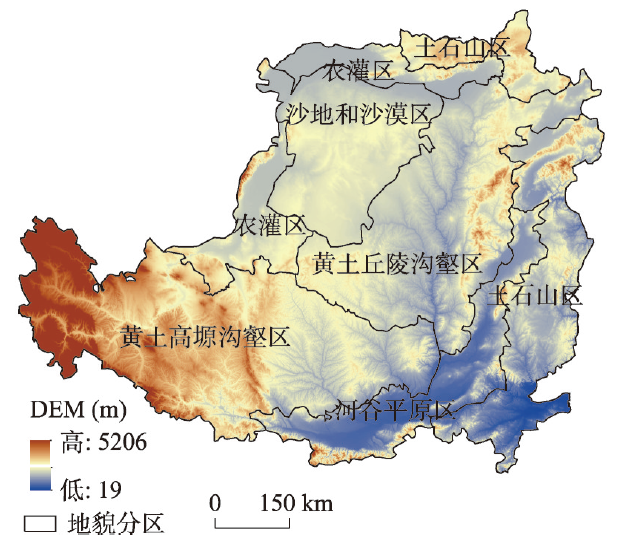
黄土高原位于33°43′N~41°16′N、100°54′E~114°33′E,地处黄河流域中游,包括山西、内蒙古、河南、陕西、甘肃、宁夏、青海共7省(自治区)45市(州、盟)341县(旗),土地面积约65万km2。该区地势西北高,东南低,海拔19~5206 m,地貌类型多样,包括6大地貌类型区[23](图1)。气候以干旱半干旱大陆性季风气候为主[24],年均气温为4~12℃,年均降水量约600 mm,且降水在时间和空间分布上极不均匀。极端气候已成为制约黄土高原生态修复的重要因素之一。作为土壤侵蚀最严重的区域之一,国家虽采取了一系列防治措施,但仍存在局部水量短缺问题[24],使整个区域的生态系统脆弱性加剧[22]。同时,该区还承载着1.18亿人口,经济的高速发展和城镇化进程的不断加快,对生态环境造成严重干扰,加剧了人地矛盾。因此,评价生态系统服务供需匹配关系、提高生态系统服务供给能力对该区实现可持续发展至关重要。图1
 新窗口打开|下载原图ZIP|生成PPT
图1黄土高原位置
注:基于自然资源部标准地图服务网站GS(2016)2923号标准地图制作,底图边界无修改。
Fig. 1Location of the Loess Plateau
2.2 数据来源
基础数据包括:① 土地利用数据、归一化植被指数(NDVI)、人口密度栅格数据源自中国科学院资源环境科学数据中心(2.3 研究方法
2.3.1 生态系统服务供需评估(1)粮食供应服务。粮食供应服务是当地居民生活的物质基础,也是生态系统重要的供给服务。鉴于农作物产量与NDVI间存在显著的线性关系[27],本文将粮食的总产量按照栅格NDVI值与耕地总NDVI值的比值来分配[14],确定各栅格的粮食供给能力,并由此估算研究区粮食供应服务的供给量;粮食需求量包括口粮、饲料用粮、种子用粮、工业用粮、损耗等消费量[28]。计算公式如下:
式中:Gx为栅格x的粮食产量;Gsum为粮食总产量;NDVIx为栅格x的NDVI值;NDVIsum为研究区耕地的NDVI值之和;Dcpx为栅格x的粮食需求量;Dpercrop为人均粮食需求量[28];ρxpop为栅格x的人口密度。
(2)水源涵养服务。黄土高原是中国水资源严重贫乏地区,水资源影响着该区可持续发展。本文利用InVEST模型的Water Yield模块计算水源涵养服务的产水量,具体计算过程详见参考文献[13,14]。水需求量指人均用水量和人口密度的乘积。计算公式如下:
式中:Dwx为栅格x的水需求量;Dperwater为人均用水量,包括人均农业、工业、生活和生态用水量[14]。
(3)碳固存服务。碳固存服务供给量应用InVEST模型的Carbon模块进行评估。碳固存服务需求量一般采用碳排放量作为指标,本文基于人均碳排放量与栅格化后的人口密度来计算碳固存服务的需求量。计算公式如下:
式中:Scx为栅格x的总碳固存量;Cabove、Cbelow、Csoil、Cdead分别为栅格x的地上生物碳、地下生物碳、土壤有机碳、死亡有机物;Dcx为栅格x的碳固存服务需求量;Dpercarbon为人均碳排放量;Dsum为各省碳排放总量;ρ为各省常住人口数。
(4)土壤保持服务。土壤保持量利用InVEST模型的SDR模块进行计算。土壤保持服务需求量指人类期望能够被治理的实际土壤侵蚀量。本研究使用修正的土壤流失通用方程对区域土壤保持量与侵蚀量进行估算。具体计算公式如下:
式中:SEDRETx为栅格x的土壤保持量;RKLSx为栅格x的土壤潜在侵蚀量;USLEx为栅格x的土壤实际侵蚀量;R为降雨侵蚀因子;K为土壤侵蚀因子;LS为坡长—坡度因子;P为水土保持因子;C为植被覆盖因子。汇流累积量阈值根据区域实际情况取1000。
2.3.2 生态系统服务供需比 利用生态系统服务供需比可揭示生态系统服务供应与需求之间的关系[13]。计算公式如下:
式中:ESDR是生态系统服务供需比;S和D分别是生态系统服务的供给量和需求量,Smax与Dmax分别是供给量、需求量的最大值。ESDR>0表示生态系统服务供大于求,ESDR<0表示供不应求,ESDR = 0表示供需平衡状态。
2.3.3 生态系统服务供需空间匹配 采用Z-score标准化方法[16]对生态系统服务供需量进行标准化,根据象限分异确定4种匹配模式并将其空间可视化,具体包括:高高空间匹配(高供给—高需求)、低低空间匹配(低供给—低需求)、低高空间错位(低供给—高需求)、高低空间错位(高供给—低需求)。
2.3.4 生态系统服务供需比空间格局测度 利用探索性空间数据分析,通过局部Moran's I指数,揭示黄土高原生态系统服务供需的分布格局,分析具体空间要素与周围要素之间的差异程度及其显著性[5]。
3 结果分析
3.1 生态系统服务供需的时空特征
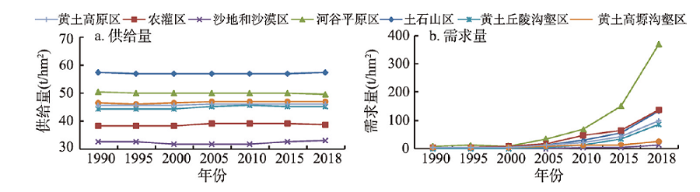
3.1.1 粮食供应服务供需的时空特征 1990—2018年黄土高原粮食生产能力呈上升趋势(图2a),单位面积粮食供给量从1.3 t/hm2升至2.3 t/hm2,增幅高达77%。其中,1990—1995年单位面积粮食供给量略有下降,降幅为7.58%,但1995—2018年粮食供给量呈上升趋势,增幅高达78.08%。期间,不同区域粮食供给量增幅呈河谷平原区>土石山区>高塬沟壑区>丘陵沟壑区>农灌区>沙地和沙漠区的趋势。1990—2018年黄土高原单位面积粮食需求量呈上升趋势(图2b),从0.4 t/hm2升至0.5 t/hm2,增幅为25%。期间,不同区域粮食需求量增幅呈河谷平原区>土石山区>农灌区>高塬沟壑区>丘陵沟壑区>沙地和沙漠区的趋势。图2
 新窗口打开|下载原图ZIP|生成PPT
图21990—2018年黄土高原粮食供给量与需求量变化趋势
Fig. 2Trends of crop supply and demand in the Loess Plateau from 1990 to 2018
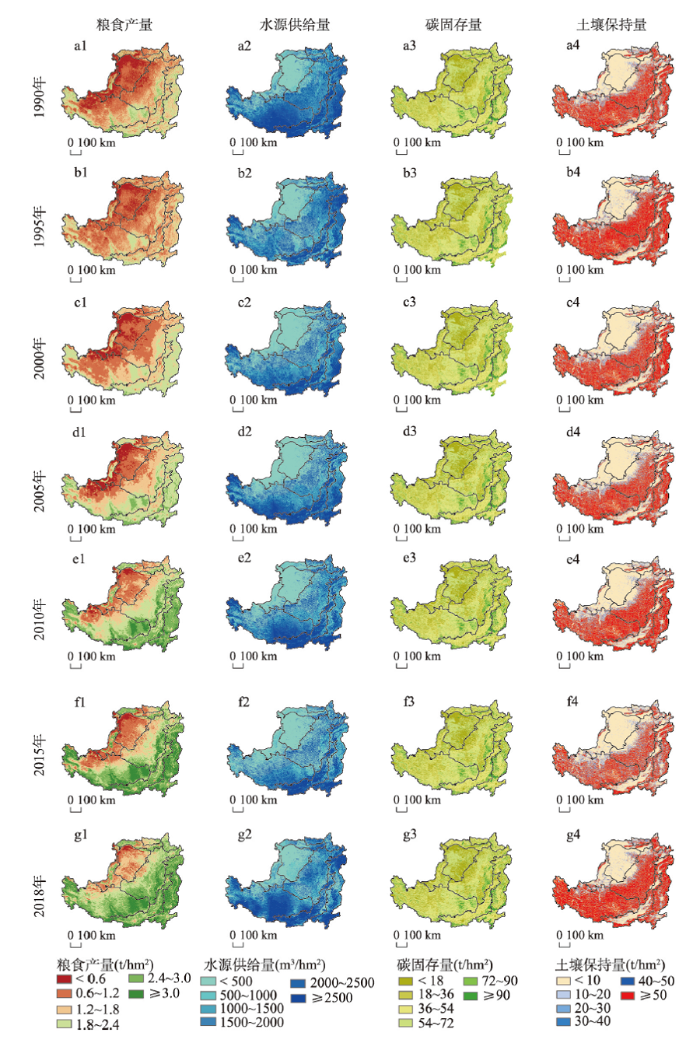
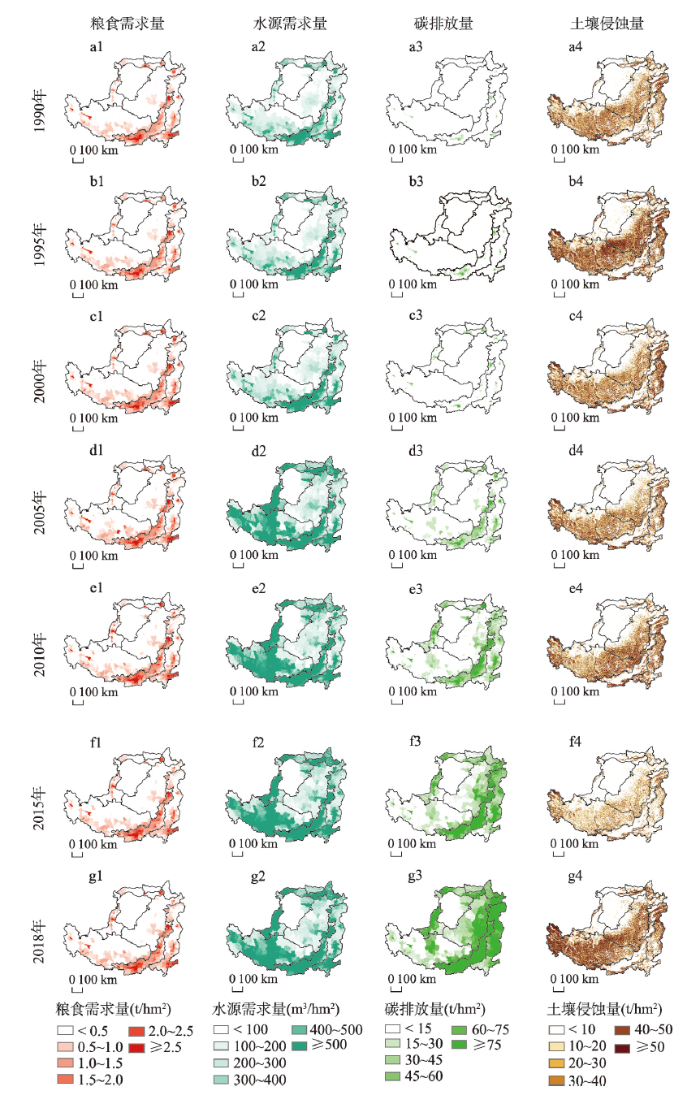
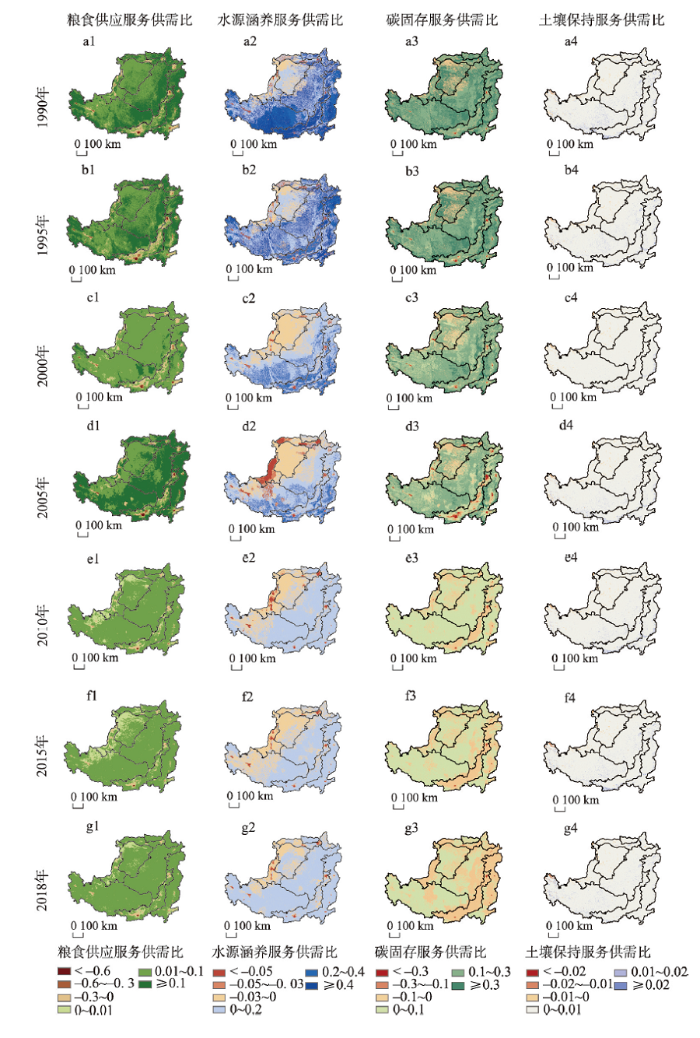
从空间分布来看,1990—2018年黄土高原粮食供给量呈“东南高,西北低”的分布格局(图3),高值区趋于扩张,且由东南向西北逐渐推进。其中,1990—1995年粮食供给量高值区趋于收缩,低值区趋于扩张;但1995—2018年与之相反,且高值区分布于汾渭平原、高塬沟壑区东、西部等耕地资源较为集中的地区,而低值区位于沙地和沙漠区及部分农灌区。期间,黄土高原粮食需求量呈“四周高、中间低”的分布格局(图4),高值区呈点状分布于汾渭平原、黄河流域附近人口密集地区,且逐渐扩张;低值区呈面状分布于沙地和沙漠区、丘陵沟壑区、高塬沟壑区北部等人口分布较为分散的地区。
图3
 新窗口打开|下载原图ZIP|生成PPT
图31990—2018年黄土高原生态系统服务供给量空间格局
Fig. 3Spatial pattern of various ecosystem services supply in the Loess Plateau from 1990 to 2018
图4
 新窗口打开|下载原图ZIP|生成PPT
图41990—2018年黄土高原生态系统服务需求量空间格局
Fig. 4Spatial pattern of various ecosystem services demands in the Loess Plateau from 1990 to 2018
3.1.2 水源涵养服务供需的时空特征 1990—2018年黄土高原水源涵养服务在波动中下降(图5a),单位面积水源供给量从2251 m3/hm2降至2006 m3/hm2,降幅达10.88%。期间,河谷平原区、高塬沟壑区水源涵养服务波动较剧烈,其他区域波动较小。1990—2018年黄土高原单位面积水源需求量总体呈上升趋势(图5b),单位面积水源需求量从204 m3/hm2升至618 m3/hm2,增幅为203%。具体来看,1990—2015年单位面积水源需求量呈上升状态,增幅为205%,2015—2018年趋于下降,降幅仅为0.8%。期间,不同区域水源需求量均呈上升趋势,其中,农灌区水源需求量变幅最大,高塬沟壑区次之。
图5
 新窗口打开|下载原图ZIP|生成PPT
图51990—2018年黄土高原水源涵养服务供给量与需求量变化趋势
Fig. 5Trends of supply and demand of water conservation service in the Loess Plateau from 1990 to 2018
1990—2018年黄土高原水源供给量总体呈“东南高,西北低”的分布格局(图3),其高值区趋于收缩,而低值区逐渐扩张,期间波动较大,这主要与区域内降水和潜蒸散量有关。具体来看,1990—1995年水源供给量高值区由南部移至东北部;1995—2010年水源供给量高值区由东北部移至南部,且逐渐扩张,高塬沟壑区水源供给量增加尤为显著;2010—2015年水源供给量高值区又趋于收缩,在高塬沟壑区收缩尤为明显;2015—2018年水源供给量高值区有所扩张。1990—2018年黄土高原水源需求量总体呈“四周高,中间低”的分布格局(图4),期间,高值区一直处于扩张状态,且由散布于河谷平原区、土石山区、农灌区、高塬沟壑区的点状分布转变为在黄土高原四周的连续环状分布。
3.1.3 碳固存服务供需的时空特征 1990—2018年黄土高原单位面积碳固存量在波动中上升(图6a),从45.73 t/hm2升至46.06 t/hm2,增幅为0.72%。期间,不同区域单位面积碳固存量变化较小,土石山区的单位面积碳固存量最高,河谷平原区次之,沙地和沙漠区最低。1990—2018年黄土高原单位面积碳排放量呈显著上升趋势(图6b),从2.91 t/hm2升至98.31 t/hm2,增长了33倍。期间,河谷平原区的增幅尤为明显,且单位面积碳排放量最高,最低为沙地和沙漠区。
图6
 新窗口打开|下载原图ZIP|生成PPT
图61990—2018年黄土高原碳固存服务供给量与需求量变化趋势
Fig. 6Trends of supply and demand of carbon sequestration service in the Loess Plateau from 1990 to 2018
1990—2018年黄土高原碳固存量呈“东南高、西北低”的分布格局(图3),高值区呈点状分散式小幅扩张,主要分布于太行山以西、吕梁山以东的植被覆盖度高的地区。期间,黄土高原碳排放量高值区也不断扩张(图4),由点状分布变为连续的环状分布,使该区碳排放量呈“四周高、中间低,东南高于西北”的分布格局。
3.1.4 土壤保持服务供需的时空特征 1990—2018年黄土高原单位面积土壤保持量在波动中上升(图7a),从116 t/hm2升至188 t/hm2,增幅为62.07%。期间,除沙地和沙漠区外,各区域土壤保持能力变幅剧烈。1990—2018年黄土高原单位面积土壤侵蚀量总体也呈上升趋势(图7b),从23 t/hm2升至39 t/hm2,增幅为69.57%。其中,高塬沟壑区单位面积土壤侵蚀量最高,变幅也最剧烈,沙地和沙漠区最低。
图7
 新窗口打开|下载原图ZIP|生成PPT
图71990—2018年黄土高原土壤保持服务保持量与侵蚀量变化趋势
Fig. 7Trends in retention and erosion of soil conservation service in the Loess Plateau from 1990 to 2018
黄土高原土壤保持量总体呈“东南高、西北低”的分布格局(图3)。具体来看,1990—1995年黄土高原东南部土壤保持量增强,且高值区向西北部扩张,沙地和沙漠区土壤保持能力有所改善;但1995—2015年土壤保持量高值区大幅收缩;2015—2018年土壤保持量增强,高塬沟壑区、丘陵沟壑区增强尤为明显,且高值区不断向西北扩张。期间,黄土高原土壤侵蚀严重区主要集中于沟壑区(图4),其空间分布变化趋势与土壤保持量基本一致。
3.2 生态系统服务供需的数量匹配特征
1990—2018年黄土高原粮食供应服务供需比在波动中下降(图8a),从0.097降至0.022,降幅为77.32%,总体供大于求。其中,2005年黄土高原粮食供需比达到最高。期间,黄土高原粮食供应服务供不应求区趋于缩小,呈点状分布于汾渭平原、农灌区、土石山区等人口密集区域,且供大于求的区域范围趋于扩大(图9)。图8
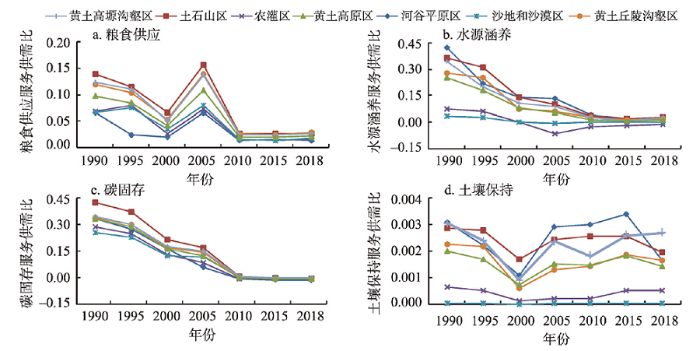 新窗口打开|下载原图ZIP|生成PPT
图81990—2018年黄土高原各项生态系统服务供需比变化趋势
Fig. 8Trends of supply-demand ratio of various ecosystem services in the Loess Plateau from 1990 to 2018
图9
 新窗口打开|下载原图ZIP|生成PPT
图91990—2018年黄土高原各项生态系统服务供需比的空间格局
Fig. 9Spatial pattern of supply-demand ratio of various ecosystem services in the Loess Plateau from 1990 to 2018
1990—2018年黄土高原水源涵养服务供需比总体呈下降趋势(图8b),降幅为94%,且总体处于供大于求阶段。期间,农灌区、沙地和沙漠区水源涵养服务存在供不应求状态,而其他区域均处于供大于求状态。具体来看,1990—2005年水源涵养服务供不应求区持续扩张,且集中在东南部呈点状分布、西北部呈面状分布;2005年后,水源涵养服务供不应求区趋于收缩(图9)。
1990—2018年黄土高原碳固存服务供需比总体呈现下降趋势(图8c),从0.331降至 -0.003,降幅超过100%。其中,1990—2010年碳固存服务处于供大于求阶段,而2015—2018年处于供不应求阶段。具体来看,沙地和沙漠区、高塬沟壑区一直处于供大于求态势,其他区域在2010年后转变为供不应求态势。期间,黄土高原碳固存服务供大于求区趋于收缩,而供不应求区趋于扩张,且由分散分布转变为条带状分布于黄土高原四周及中间腹地(图9)。
1990—2018年黄土高原土壤保持服务供需比在剧烈变动中趋于下降(图8d),降幅为28.59%,且一直处于供大于求态势。其中,2000年处于土壤保持服务供需比最低值,且土壤保持服务供不应求区呈点状分布于鄂尔多斯高原和海北州北部(图9)。
3.3 生态系统服务供需的空间匹配特征
1990—2018年黄土高原粮食供应服务以低低空间匹配区为主(图10),高低空间错位区次之。期间,高高空间匹配区分布于黄土高原东南部及高塬沟壑区南部,面积占比由22%降至20%;低高空间错位区分散分布于河谷平原、农灌区、高塬沟壑区西南部等人口密集区,面积占比由9%降至6%;低低空间匹配区集中分布于黄土高原西北部,面积占比由43%降至37%;高低空间错位区则集中分布于该区东部及南部,面积占比由26%升至37%。图10
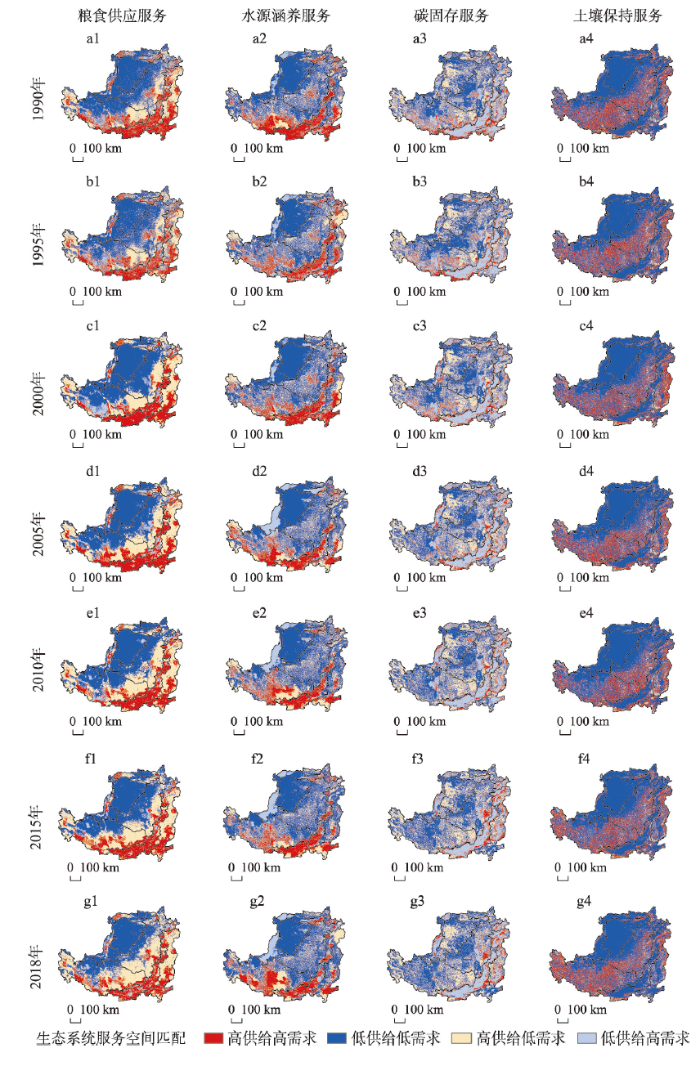 新窗口打开|下载原图ZIP|生成PPT
图101990—2018年黄土高原生态系统服务空间匹配关系
Fig. 10Spatial matching relationships of supply and demand of ecosystem services in the Loess Plateau from 1990 to 2018
黄土高原水源涵养服务以低低空间匹配区为主(图10)。其中,高高空间匹配区分布于高塬沟壑区腹地、河谷平原区及土石山区,面积占比由19%降至17%;低高空间错位区分布于农灌区,面积占比由10%升至11%;低低空间匹配区集中分布于沙地和沙漠区、丘陵沟壑区、北部的农灌区及土石山区、高塬沟壑区部分区域,面积占比由49%降至48%;高低空间错位区分布于土石山区北部、高塬沟壑区部分区域,面积占比由21%升至24%。
黄土高原碳固存服务以低低空间匹配区为主,高低空间错位区次之(图10)。其中,高高空间匹配区分散分布于东部,范围趋于收缩,面积占比由9%降至7%;低高空间错位区集中于河谷平原腹地,面积占比由21%降至18%;低低空间匹配区集中于西北部,面积占比由39%升至42%;高低空间错位区分布于沙地和沙漠区、高塬沟壑区东部,且逐渐向外扩张,面积占比由30%升至33%。
黄土高原土壤保持服务以低低空间匹配区为主(图10)。其中,高高空间匹配区位于丘陵沟壑区、高塬沟壑区腹地,面积占比由18.84%降至18.05%;低低空间匹配区位于西北地区、河谷平原、豫西北地区及土石山区,面积占比由68.11%升至68.70%;低高、高低空间错位区呈零散分布,面积占比均较低。
3.4 生态系统服务供需比的空间集聚特征
为进一步揭示黄土高原生态系统服务供需比的空间集聚特征,对生态系统服务供需比进行空间自相关分析。1990—2018年黄土高原粮食供应、水源涵养、碳固存服务供需比的Moran's I指数均呈波动下降趋势,土壤保持服务供需比的Moran's I指数呈波动上升趋势(图11),说明前3类生态系统服务供需比的空间集聚性逐渐减弱,而土壤保持服务供需比的空间集聚性逐渐增强。图11
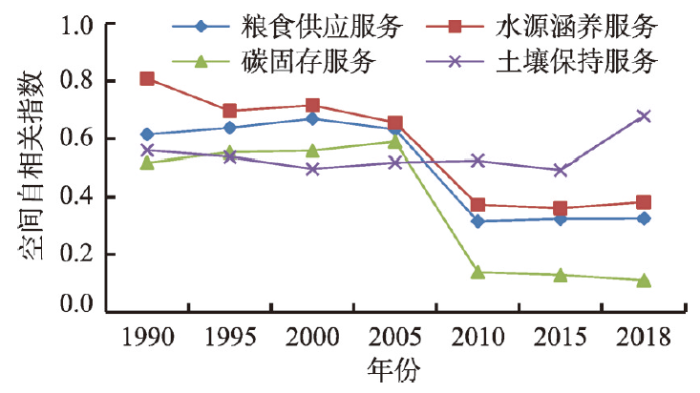 新窗口打开|下载原图ZIP|生成PPT
图111990—2018年黄土高原各项生态系统服务空间自相关指数
Fig. 11Spatial Moran's I of various ecosystem services in the Loess Plateau from 1990 to 2018
1990—2018年黄土高原各县区的粮食供应、水源涵养、碳固存服务供需比均以高高集聚为主,而土壤保持服务以低低集聚和高高集聚为主(图12)。其中,1990—2018年黄土高原粮食供应服务供需比的高高集聚区主要分布于汾渭平原、高塬沟壑区西部;碳固存服务供需比的高高聚集区由太行山以西吕梁山以东地区、陕西以及甘肃以东地区扩至高塬沟壑区、丘陵沟壑区西部等区域;土壤保持服务供需比的高高集聚区分布于黄土高原的南部和东部,低低集聚区分布于沙地和沙漠区和农灌区,且范围逐渐收缩;1990—1995年水源涵养服务供需比的高高集聚区由高塬沟壑区中部移至黄土高原东北部,2000—2018年则由拉脊山、六盘山、汾河地区移至黄土高原南部和山西大同。
图12
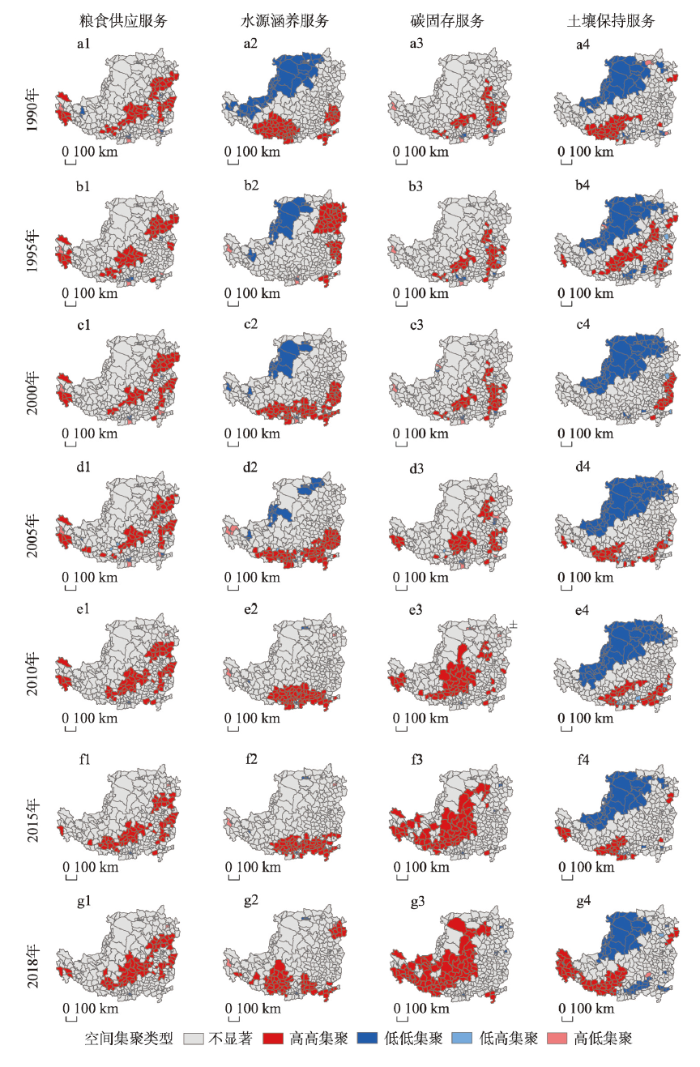 新窗口打开|下载原图ZIP|生成PPT
图121990—2018年黄土高原各项生态系统服务供需比的空间集聚
Fig. 12Spatial agglomeration of supply-demand ratio of various ecosystem services in the Loess Plateau from 1990 to 2018
4 结论与讨论
4.1 结论
黄土高原既是中国“两屏三带”的重要组成部分,也是重要的土壤保持生态功能区,气候变化、复杂地形以及国家政策干预在一定程度上增加了生态系统服务供需变化的复杂性。本文基于多源数据,应用InVEST模型等空间分析工具模拟黄土高原生态系统服务供需量,识别生态系统服务供需数量匹配及空间匹配类型,并分析生态系统服务供需比的空间集聚特征,得出以下结论:(1)1990—2018年,黄土高原除水源涵养服务供给量外,其他生态系统服务供需量均呈上升趋势,且各生态系统服务供给量及土壤保持服务需求量均呈“东南高、西北低”的分布特征,而粮食供应、水源涵养、碳固存服务需求量呈“四周高、中间低”的分布特征。
(2)黄土高原各生态系统服务供需比均呈下降趋势。其中,粮食供应、土壤保持、水源涵养服务一直保持供大于求的态势,而碳固存服务存在供不应求态势。在空间分布上,粮食供应、碳固存服务在黄土高原四周人口密集区供不应求,腹地供大于求;黄土高原水源涵养服务在西北部供不应求,东南部供大于求;土壤保持服务供不应求区集中于鄂尔多斯高原及海北州北部。
(3)黄土高原各生态系统服务供需均以低低空间匹配为主。除水源涵养服务低高空间错位区呈扩张趋势外,其余均呈缩小趋势。
(4)粮食供应、水源涵养、碳固存服务供需比空间分布均以高高集聚为主,而土壤保持服务以低低集聚和高高集聚为主。除土壤保持服务供需比空间集聚性有所增强外,其他生态系统服务供需比空间集聚性均呈减弱趋势。
4.2 讨论
本文综合分析了1990—2018年黄土高原4项生态系统服务供需关系的时空格局变化,研究发现,除水源涵养服务供给量呈波动下降外,其他生态系统服务供给量均呈波动上升趋势,这与黄土高原降水量年际变化、植被覆盖率变化有关。该区随着降水量增加、农业科技发展成熟和耕地资源的高效利用,粮食单产稳定提高[29];自水土保持工程、三北防护林、退耕还林等一系列政策实施以来,该区生态环境有所改善,植被覆盖率大幅提高[30],固碳、土壤保持能力有所提升,但也存在水资源日益紧缺等问题,这与以往研究结果一致[13]。研究还发现,2000—2018年黄土高原各生态系统服务需求量均呈上升趋势,这与该区人口增加、城市化水平提升、经济发展等有关。与1990年相比,2018年人口增幅为24%,城市化水平提高115%,人均GDP增幅为35%,这均导致生态系统服务需求量的增加。研究还发现,黄土高原各生态系统服务供需比均呈下降趋势,且以低低空间匹配为主,主要原因是这些区域生态环境非常脆弱,严重制约着生态系统服务的供给,同时人口分布稀疏、社会经济发展水平低,对生态系统服务需求也较低。未来,应加大保护并恢复低低空间匹配区自然生态系统,控制人类不合理活动,促进产业与农户生计转型,增强区域发展潜力。黄土高原生态系统服务供需高高空间匹配区集中于经济发展速度快、生态环境良好、人口较为密集的区域,未来应适当控制这些区域人口规模,建立绿色、节约型经济体系,减轻人类对生态系统压力。生态系统服务高低空间错位区集中于黄土高原的林区和草原,这些区域生态系统服务供给量较高,未来应着力维护自然生态系统的完整性,严禁滥砍滥伐、过度放牧等不合理资源利用行为。此外,汾渭平原是碳固存服务低高空间错位最为集中地区,面积约占黄土高原的21%,人口约占黄土高原的40%,人地矛盾尖锐,未来应减少人类活动对自然生态系统干扰,提升生态系统服务供给能力。
生态系统服务供需的量化是生态系统服务研究的重要内容,目前常采用物质量评价法和价值量评价法,但对于较大尺度的生态系统服务评价,物质量评价往往比价值量评价更有意义,因此本文选用物质量评价法对生态系统服务供需量进行评价。因生态系统服务具有流动性,且其流动过程非常复杂,致使生态系统服务供给区边界与需求区边界往往不统一。当某一区域内生态系统服务供给量大于需求量时,就会出现一定的外溢现象,从而为邻近或其他区域提供服务,进而导致需求区往往大于供给区。开展生态系统服务供需关系研究时需要关注生态系统服务的流动性,并准确识别各种生态系统服务的供给区边界与需求区边界,科学核算不同生态系统服务的流向、流速及流量,确定生态系统服务流动的级联效应。但目前大多数研究忽视了生态系统服务的流动性。黄土高原地处黄河中游,承担着重要的生态服务功能,且区域内除碳固存服务外其他生态系统服务的供给量显著高于需求量,这充分说明黄土高原提供的这些生态系统服务不仅支撑着区内发展,而且存在一定的外溢现象,例如水源涵养服务具有“承上启下”的作用,通过流动过程将服务的供给区与需求区动态融合在一起。但由于目前缺乏定量刻画生态系统服务从供给区到需求区传递过程的成熟模型,尤其缺乏定量模拟调节服务流的流动路径、流量以及流动过程中流量消耗等方面的模型[31],使得生态系统服务供需平衡、级联效应等研究受到限制。受数据获取和模型的限制,本文也仅主要考察了黄土高原区内部的生态系统服务供给量与当地需求量的匹配关系。未来,将深入研究黄土高原各生态系统服务的空间流动性,识别供给区与需求区,厘清生态系统服务的流速、流量及流动路径,分析生态系统服务流动的级联效应,并进一步开展黄土高原生态系统服务供给与需求的互动机制、供需关系变化的驱动机制等研究。此外,还需开展黄土高原生态系统服务供需变化与人类福祉关系、生态系统服务供需平衡预警、不同情景下生态系统服务供需关系动态模拟及仿真等研究,以便为生态系统综合管理、国土空间优化提供决策依据。
参考文献 原文顺序
文献年度倒序
文中引用次数倒序
被引期刊影响因子
URL [本文引用: 2]
[本文引用: 1]
DOI:10.1016/j.scitotenv.2018.10.329URL [本文引用: 2]
DOI:10.11821/dlxb201707012 [本文引用: 1]

Natural ecosystems supply tangible products and intangible services, which are demanded and consumed by human beings. Therefore, supply and demand make up the dynamic process of ecosystem services flowing from natural ecosystems to human society. The process of identifying, measuring, mapping and conducting an equilibrium analysis of the supply and demand of ecosystem services is beneficial for the effective management of natural ecosystems and optimal allocation of natural resources. Moreover, this can provide theoretical support to payments for environmental services and ecological compensation, thus promoting ecological security and sustainable development. Although the study of ecosystem services supply and demand is important, related studies are limited in China and are mainly focused on Europe and North America. Based on the theory and case studies conducted in China and other countries, this paper first presented the definition of ecosystem services supply and demand, including actual supply, potential supply, satisfied demand, and total demand. Second, the classifications of ecosystem services were compared based on their spatial characteristics. Third, the methods of mapping ecosystem services supply and demand were divided as follows: (1) land use estimation, which needs simple operation and limited data, may cause errors due to the loss of internal heterogeneity and boundary effects; (2) ecological process simulation is mostly applied in water-related ecosystem services, showing detailed and reliable results with multi-calculation; (3) spatial data superposition, which is an ideal method for mapping ecosystem services with complete spatial data sets; (4) expert knowledge, where the mapping of ecosystem services supply and demand is decided by a group of experts or is based on the previous related findings; however, the mapping principle followed in a local study may not be applicable to studies conducted at other places; and (5) the use of integrated models InVEST (Integrated Valuation of Ecosystem Services and Trade-offs), which is suitable for supply analysis, and ARIES (ARtificial Intelligence for Ecosystem Services), maps service flow from natural ecosystems to human beings. Finally, we discussed the equilibrium analysis framework for ecosystem services supply and demand from three angles: actual supply and potential supply, satisfied demand and total demand, and the spatial and quantitative relation between supply and demand.
[本文引用: 1]
URL [本文引用: 2]
DOI:10.1016/j.scitotenv.2018.12.080URL [本文引用: 2]
URL [本文引用: 2]
URL
URL [本文引用: 1]
DOI:10.1016/j.ecolind.2019.04.049 [本文引用: 2]
Human welfare is dependent on the availability of ecosystem services (ESs). There is an urgent need to explore the balance between ES production and consumption areas to ensure the sustainable use of the natural capital. Here, we present a spatial accessibility analysis to explicitly evaluate the balance between ES supply and demand across Europe. We used a central food product (crop) as an example of provisioning ES, where transportation is required to satisfy the demand. Our results show large differences in a country's ability to produce food in relation to its demand, leading to significant risks of over- and underproduction on a regional scale. An ecosystem's capacity to provide services exceeded especially in the middle of Europe. The majority of the countries would benefit significantly by balancing the supply and demand at international level, even at close distances. Our results demonstrate how the situation in Europe can change if the international distribution of the food ES is prevented. By using a state-of-the-art accessibility method instead of commonly used overlay analysis, it is possible to identify where to invest in transportation and enhance natural capacity to respond to the possible changes in food production or the growing demand of food energy.
URL
URL
DOI:10.11821/dlxb201909016 [本文引用: 4]
The sustainable supply of ecosystem services is the basis of the sustainable development. Human beings satisfy the demand and improve their own well-being through the consumption of ecosystem services. It is of great significance for the management of regional ecosystems and the effective allocation of resources to study the demand and consumption of ecosystem services and to analyze the supply and demand characteristics of ecosystem services and their spatial trade-offs. Based on the multi-source data such as land cover, meteorological observation and statistical yearbook in Lanzhou in 2017, the spatial analysis tools including InVEST model, ArcGIS and GeoDA were used to calculate the supply and demand of water yield, food supply, carbon storage and soil conservation. The supply and demand matching of ecosystem services in the study area was analyzed and evaluated. The results show that: (1) The supply and demand of ecosystem services have obvious spatial heterogeneity. The total supply of services is greater than the total demand, but there are differences between different sub-regions and different kinds of ecosystem services. (2) The supply-demand ratio of comprehensive ecosystem services is 0.039. There are differences in supply-demand matching of different kinds of ecosystem services: water yield service (0.098) > carbon storage service (0.066) > food supply service (0.030) > soil conservation service (0.001), and there are significant differences in supply-demand matching between urban and rural areas. (3) There are different kinds of spatial matching pattern between supply and demand of ecosystem services, including "high-high spatial matching", "low-low spatial matching", "high-low spatial dislocation" and "low-high spatial dislocation". (4) There are obvious synergic effects in the balance of supply and demand of services in Lanzhou, which are "high-high synergy" and "low-low synergy".
[本文引用: 4]
URL [本文引用: 4]
DOI:10.1016/j.ecolind.2019.04.062URL [本文引用: 1]
DOI:10.31497/zrzyxb.20200118URL [本文引用: 2]
[本文引用: 2]
URL [本文引用: 1]
DOI:10.1016/j.ecoser.2018.03.012URL
URL
DOI:10.1016/j.ecolecon.2017.02.005URL [本文引用: 2]
[本文引用: 1]
[本文引用: 2]
[本文引用: 2]
[本文引用: 1]
[本文引用: 1]
DOI:10.1016/j.ecolind.2019.01.020 [本文引用: 2]
Revegetation, especially afforestation, has served as an important tool for controlling desertification. However, revegetation in water-limited regions will inevitably reduce the water available for socio-economic systems, which is poorly considered in decision-making on sustainable ecosystem management. This paper proposed a framework to determine the threshold of vegetation productivity (i.e., ecosystem carrying capacity), corresponding to available water resources for ecosystems (i.e., annual precipitation minus water demand for socioeconomic systems) on the Loess Plateau. The average annual ecosystem carrying capacity (ECC) during 1982-2012 is 577 +/- 124 g Cm-2 yr(-1), with spatial gradients increasing from northwest to southeast. Vegetation in rocky mountain areas has the largest value of 833 +/- 200 g Cm-2 yr(-1). Factorial analysis suggests that changes in precipitation and human water use contributed to 55% and 45% of the multi-decadal changes in regional ECC, respectively. Meanwhile, due to revegetation, 26 counties on the Loess Plateau, mainly in the southeast and eastern parts, have exceeded the ECC threshold during the study period. An additional 138 counties have a high potential for water competition between the ecosystems and socio-economic systems. At the regional scale, there are 9 years (similar to 30% of the study period) during which the ECC threshold has been exceeded, especially after 1997. Considering the climate change in the future and the growing demand for water in socioeconomic systems, the corresponding ECC threshold will increase by 6-36%. We believe that these findings can provide reference for policy-makers to make decisions towards ecosystem sustainability while meeting human needs for water resources.
URL [本文引用: 1]
URL [本文引用: 1]
URL [本文引用: 1]
[本文引用: 2]
[本文引用: 2]
DOI:10.1016/j.scitotenv.2019.05.022URL [本文引用: 1]
DOI:10.1016/j.scitotenv.2018.09.082URL [本文引用: 1]
[本文引用: 1]
[本文引用: 1]
